Immigrants from Cambodia vs Black/African American Disability Age 5 to 17
COMPARE
Immigrants from Cambodia
Black/African American
Disability Age 5 to 17
Disability Age 5 to 17 Comparison
Immigrants from Cambodia
Blacks/African Americans
5.9%
DISABILITY AGE 5 TO 17
1.5/ 100
METRIC RATING
251st/ 347
METRIC RANK
6.8%
DISABILITY AGE 5 TO 17
0.0/ 100
METRIC RATING
333rd/ 347
METRIC RANK
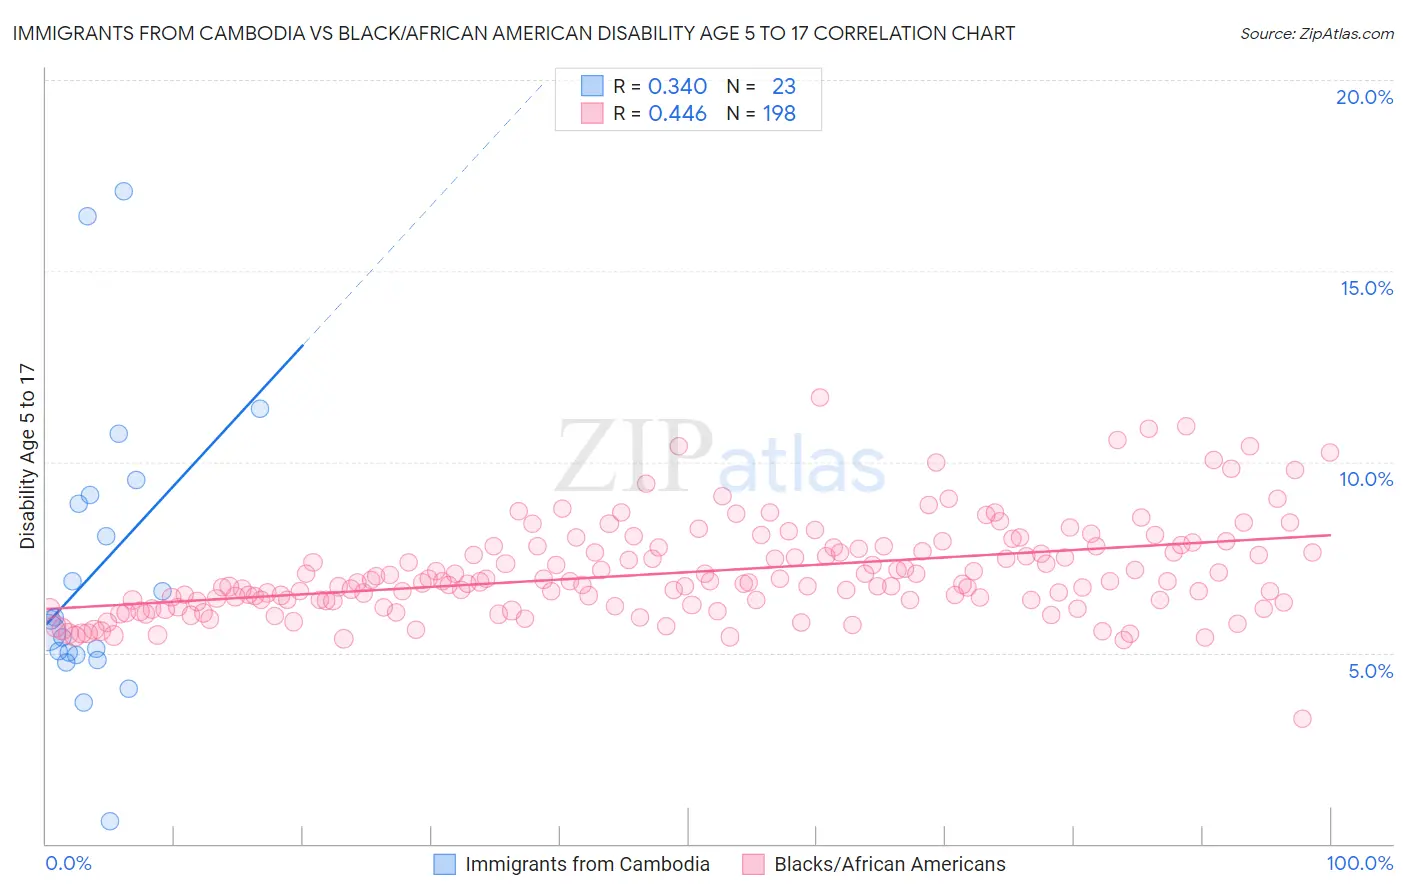
Immigrants from Cambodia vs Black/African American Disability Age 5 to 17 Correlation Chart
The statistical analysis conducted on geographies consisting of 204,706,701 people shows a mild positive correlation between the proportion of Immigrants from Cambodia and percentage of population with a disability between the ages 5 and 17 in the United States with a correlation coefficient (R) of 0.340 and weighted average of 5.9%. Similarly, the statistical analysis conducted on geographies consisting of 554,198,505 people shows a moderate positive correlation between the proportion of Blacks/African Americans and percentage of population with a disability between the ages 5 and 17 in the United States with a correlation coefficient (R) of 0.446 and weighted average of 6.8%, a difference of 14.7%.
Disability Age 5 to 17 Correlation Summary
| Measurement | Immigrants from Cambodia | Black/African American |
| Minimum | 0.58% | 3.3% |
| Maximum | 17.1% | 11.7% |
| Range | 16.5% | 8.4% |
| Mean | 7.2% | 7.1% |
| Median | 5.9% | 6.8% |
| Interquartile 25% (IQ1) | 4.9% | 6.3% |
| Interquartile 75% (IQ3) | 9.1% | 7.7% |
| Interquartile Range (IQR) | 4.2% | 1.4% |
| Standard Deviation (Sample) | 3.9% | 1.2% |
| Standard Deviation (Population) | 3.8% | 1.2% |
Similar Demographics by Disability Age 5 to 17
Demographics Similar to Immigrants from Cambodia by Disability Age 5 to 17
In terms of disability age 5 to 17, the demographic groups most similar to Immigrants from Cambodia are Polish (5.9%, a difference of 0.020%), Honduran (5.9%, a difference of 0.020%), Scandinavian (5.9%, a difference of 0.090%), Immigrants from Ghana (5.9%, a difference of 0.14%), and British (5.9%, a difference of 0.16%).
| Demographics | Rating | Rank | Disability Age 5 to 17 |
| Immigrants | Germany | 1.9 /100 | #244 | Tragic 5.9% |
| Immigrants | Micronesia | 1.9 /100 | #245 | Tragic 5.9% |
| Tlingit-Haida | 1.9 /100 | #246 | Tragic 5.9% |
| Immigrants | Honduras | 1.8 /100 | #247 | Tragic 5.9% |
| British | 1.7 /100 | #248 | Tragic 5.9% |
| Immigrants | Ghana | 1.7 /100 | #249 | Tragic 5.9% |
| Poles | 1.5 /100 | #250 | Tragic 5.9% |
| Immigrants | Cambodia | 1.5 /100 | #251 | Tragic 5.9% |
| Hondurans | 1.5 /100 | #252 | Tragic 5.9% |
| Scandinavians | 1.4 /100 | #253 | Tragic 5.9% |
| Barbadians | 1.3 /100 | #254 | Tragic 5.9% |
| Italians | 1.2 /100 | #255 | Tragic 5.9% |
| Hopi | 1.0 /100 | #256 | Tragic 5.9% |
| Hispanics or Latinos | 1.0 /100 | #257 | Tragic 5.9% |
| Brazilians | 0.9 /100 | #258 | Tragic 5.9% |
Demographics Similar to Blacks/African Americans by Disability Age 5 to 17
In terms of disability age 5 to 17, the demographic groups most similar to Blacks/African Americans are Seminole (6.8%, a difference of 0.050%), Immigrants from the Azores (6.7%, a difference of 0.59%), French Canadian (6.7%, a difference of 0.61%), Dutch West Indian (6.7%, a difference of 0.69%), and Ottawa (6.8%, a difference of 0.75%).
| Demographics | Rating | Rank | Disability Age 5 to 17 |
| Potawatomi | 0.0 /100 | #326 | Tragic 6.5% |
| French American Indians | 0.0 /100 | #327 | Tragic 6.6% |
| Pennsylvania Germans | 0.0 /100 | #328 | Tragic 6.6% |
| Blackfeet | 0.0 /100 | #329 | Tragic 6.6% |
| Dutch West Indians | 0.0 /100 | #330 | Tragic 6.7% |
| French Canadians | 0.0 /100 | #331 | Tragic 6.7% |
| Immigrants | Azores | 0.0 /100 | #332 | Tragic 6.7% |
| Blacks/African Americans | 0.0 /100 | #333 | Tragic 6.8% |
| Seminole | 0.0 /100 | #334 | Tragic 6.8% |
| Ottawa | 0.0 /100 | #335 | Tragic 6.8% |
| Chickasaw | 0.0 /100 | #336 | Tragic 6.8% |
| Creek | 0.0 /100 | #337 | Tragic 6.9% |
| Iroquois | 0.0 /100 | #338 | Tragic 6.9% |
| Choctaw | 0.0 /100 | #339 | Tragic 6.9% |
| Cherokee | 0.0 /100 | #340 | Tragic 6.9% |