French American Indian vs Ugandan Disability Age 5 to 17
COMPARE
French American Indian
Ugandan
Disability Age 5 to 17
Disability Age 5 to 17 Comparison
French American Indians
Ugandans
6.6%
DISABILITY AGE 5 TO 17
0.0/ 100
METRIC RATING
327th/ 347
METRIC RANK
6.2%
DISABILITY AGE 5 TO 17
0.0/ 100
METRIC RATING
283rd/ 347
METRIC RANK
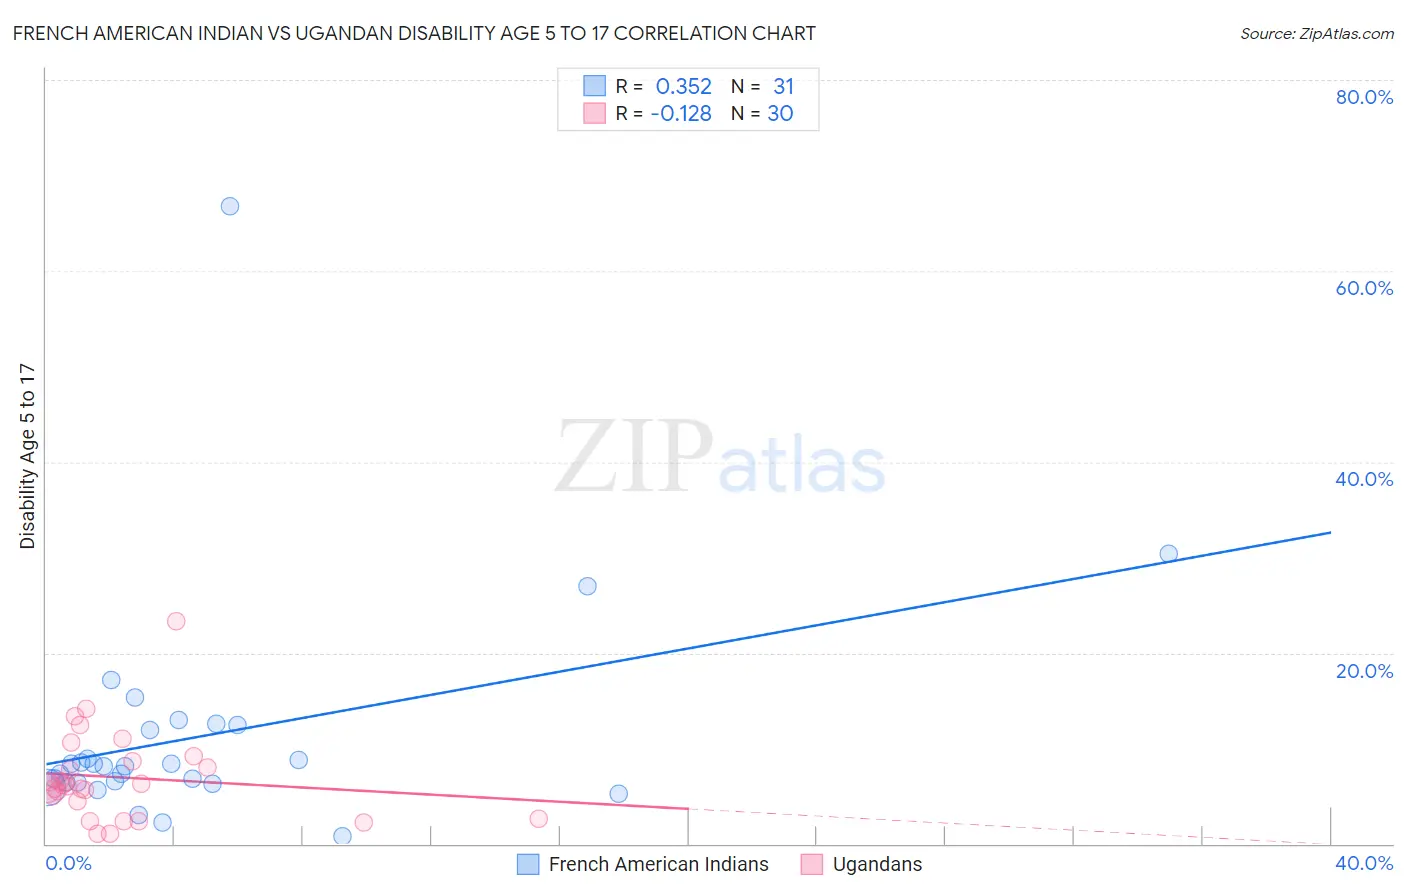
French American Indian vs Ugandan Disability Age 5 to 17 Correlation Chart
The statistical analysis conducted on geographies consisting of 131,646,511 people shows a mild positive correlation between the proportion of French American Indians and percentage of population with a disability between the ages 5 and 17 in the United States with a correlation coefficient (R) of 0.352 and weighted average of 6.6%. Similarly, the statistical analysis conducted on geographies consisting of 93,800,816 people shows a poor negative correlation between the proportion of Ugandans and percentage of population with a disability between the ages 5 and 17 in the United States with a correlation coefficient (R) of -0.128 and weighted average of 6.2%, a difference of 6.6%.
Disability Age 5 to 17 Correlation Summary
| Measurement | French American Indian | Ugandan |
| Minimum | 0.85% | 1.1% |
| Maximum | 66.8% | 23.3% |
| Range | 65.9% | 22.2% |
| Mean | 11.3% | 7.0% |
| Median | 8.2% | 6.1% |
| Interquartile 25% (IQ1) | 6.4% | 4.5% |
| Interquartile 75% (IQ3) | 12.5% | 8.7% |
| Interquartile Range (IQR) | 6.1% | 4.2% |
| Standard Deviation (Sample) | 12.0% | 4.6% |
| Standard Deviation (Population) | 11.8% | 4.6% |
Similar Demographics by Disability Age 5 to 17
Demographics Similar to French American Indians by Disability Age 5 to 17
In terms of disability age 5 to 17, the demographic groups most similar to French American Indians are Pennsylvania German (6.6%, a difference of 0.23%), Blackfeet (6.6%, a difference of 0.40%), Potawatomi (6.5%, a difference of 0.44%), American (6.5%, a difference of 0.58%), and Dominican (6.5%, a difference of 0.63%).
| Demographics | Rating | Rank | Disability Age 5 to 17 |
| Africans | 0.0 /100 | #320 | Tragic 6.5% |
| Tohono O'odham | 0.0 /100 | #321 | Tragic 6.5% |
| Slovaks | 0.0 /100 | #322 | Tragic 6.5% |
| Osage | 0.0 /100 | #323 | Tragic 6.5% |
| Dominicans | 0.0 /100 | #324 | Tragic 6.5% |
| Americans | 0.0 /100 | #325 | Tragic 6.5% |
| Potawatomi | 0.0 /100 | #326 | Tragic 6.5% |
| French American Indians | 0.0 /100 | #327 | Tragic 6.6% |
| Pennsylvania Germans | 0.0 /100 | #328 | Tragic 6.6% |
| Blackfeet | 0.0 /100 | #329 | Tragic 6.6% |
| Dutch West Indians | 0.0 /100 | #330 | Tragic 6.7% |
| French Canadians | 0.0 /100 | #331 | Tragic 6.7% |
| Immigrants | Azores | 0.0 /100 | #332 | Tragic 6.7% |
| Blacks/African Americans | 0.0 /100 | #333 | Tragic 6.8% |
| Seminole | 0.0 /100 | #334 | Tragic 6.8% |
Demographics Similar to Ugandans by Disability Age 5 to 17
In terms of disability age 5 to 17, the demographic groups most similar to Ugandans are Subsaharan African (6.2%, a difference of 0.030%), English (6.2%, a difference of 0.030%), Colville (6.2%, a difference of 0.070%), German (6.1%, a difference of 0.16%), and Pima (6.2%, a difference of 0.26%).
| Demographics | Rating | Rank | Disability Age 5 to 17 |
| Japanese | 0.1 /100 | #276 | Tragic 6.1% |
| Puget Sound Salish | 0.1 /100 | #277 | Tragic 6.1% |
| Immigrants | Liberia | 0.1 /100 | #278 | Tragic 6.1% |
| Immigrants | Jamaica | 0.1 /100 | #279 | Tragic 6.1% |
| Portuguese | 0.1 /100 | #280 | Tragic 6.1% |
| Scottish | 0.0 /100 | #281 | Tragic 6.1% |
| Germans | 0.0 /100 | #282 | Tragic 6.1% |
| Ugandans | 0.0 /100 | #283 | Tragic 6.2% |
| Sub-Saharan Africans | 0.0 /100 | #284 | Tragic 6.2% |
| English | 0.0 /100 | #285 | Tragic 6.2% |
| Colville | 0.0 /100 | #286 | Tragic 6.2% |
| Pima | 0.0 /100 | #287 | Tragic 6.2% |
| Jamaicans | 0.0 /100 | #288 | Tragic 6.2% |
| Yaqui | 0.0 /100 | #289 | Tragic 6.2% |
| Immigrants | Congo | 0.0 /100 | #290 | Tragic 6.2% |