French American Indian Disability
COMPARE
French American Indian
Select to Compare
Disability
French American Indian Disability
13.5%
DISABILITY
0.0/ 100
METRIC RATING
308th/ 347
METRIC RANK
French American Indian Disability Correlation Chart
The statistical analysis conducted on geographies consisting of 131,973,513 people shows a slight positive correlation between the proportion of French American Indians and percentage of population with a disability in the United States with a correlation coefficient (R) of 0.088 and weighted average of 13.5%. On average, for every 1% (one percent) increase in French American Indians within a typical geography, there is an increase of 0.073% in percentage of population with a disability.
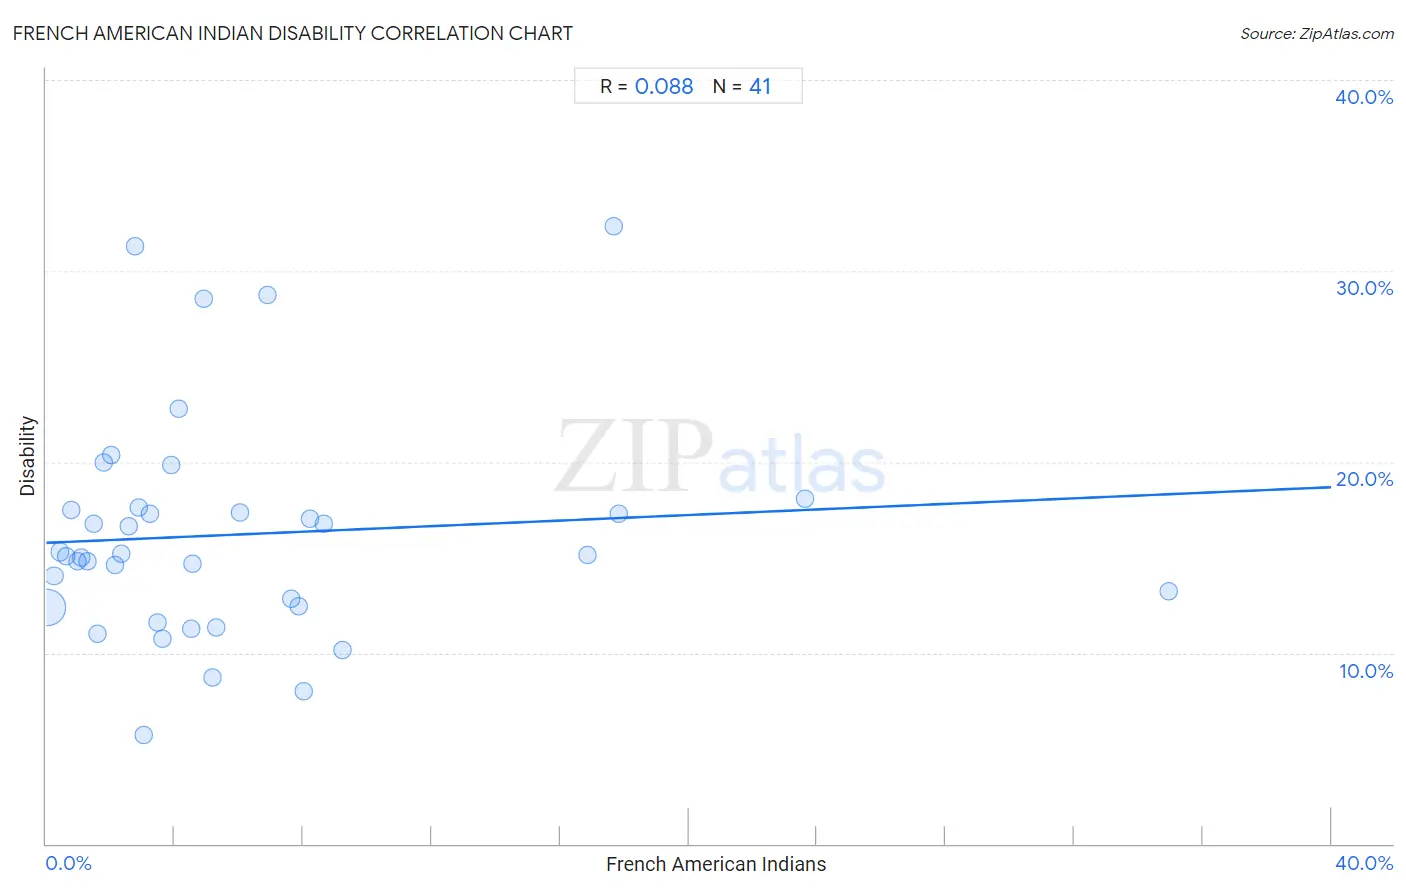
It is essential to understand that the correlation between the percentage of French American Indians and percentage of population with a disability does not imply a direct cause-and-effect relationship. It remains uncertain whether the presence of French American Indians influences an upward or downward trend in the level of percentage of population with a disability within an area, or if French American Indians simply ended up residing in those areas with higher or lower levels of percentage of population with a disability due to other factors.
Demographics Similar to French American Indians by Disability
In terms of disability, the demographic groups most similar to French American Indians are Tlingit-Haida (13.5%, a difference of 0.080%), Shoshone (13.5%, a difference of 0.090%), Cape Verdean (13.5%, a difference of 0.14%), Blackfeet (13.6%, a difference of 0.61%), and Delaware (13.6%, a difference of 0.65%).
| Demographics | Rating | Rank | Disability |
| Immigrants from Micronesia | 0.0 /100 | #301 | Tragic 13.2% |
| Arapaho | 0.0 /100 | #302 | Tragic 13.2% |
| Scotch-Irish | 0.0 /100 | #303 | Tragic 13.3% |
| Yakama | 0.0 /100 | #304 | Tragic 13.4% |
| French Canadians | 0.0 /100 | #305 | Tragic 13.4% |
| Cape Verdeans | 0.0 /100 | #306 | Tragic 13.5% |
| Shoshone | 0.0 /100 | #307 | Tragic 13.5% |
| French American Indians | 0.0 /100 | #308 | Tragic 13.5% |
| Tlingit-Haida | 0.0 /100 | #309 | Tragic 13.5% |
| Blackfeet | 0.0 /100 | #310 | Tragic 13.6% |
| Delaware | 0.0 /100 | #311 | Tragic 13.6% |
| Spanish Americans | 0.0 /100 | #312 | Tragic 13.6% |
| Cree | 0.0 /100 | #313 | Tragic 13.7% |
| Blacks/African Americans | 0.0 /100 | #314 | Tragic 13.7% |
| Puget Sound Salish | 0.0 /100 | #315 | Tragic 13.7% |
French American Indian Disability Correlation Summary
| Measurement | French American Indian Data | Disability Data |
| Minimum | 0.025% | 5.7% |
| Maximum | 34.9% | 32.4% |
| Range | 34.9% | 26.7% |
| Mean | 6.0% | 16.2% |
| Median | 3.6% | 15.1% |
| Interquartile 25% (IQ1) | 1.7% | 12.4% |
| Interquartile 75% (IQ3) | 7.7% | 17.5% |
| Interquartile Range (IQR) | 6.0% | 5.1% |
| Standard Deviation (Sample) | 7.0% | 5.8% |
| Standard Deviation (Population) | 6.9% | 5.8% |
Correlation Details
| French American Indian Percentile | Sample Size | Disability |
[ 0.0% - 0.5% ] 0.025% | 124,988,246 | 12.4% |
[ 0.0% - 0.5% ] 0.24% | 4,850,042 | 14.0% |
[ 0.0% - 0.5% ] 0.43% | 1,193,475 | 15.3% |
[ 0.5% - 1.0% ] 0.63% | 368,782 | 15.1% |
[ 0.5% - 1.0% ] 0.78% | 161,768 | 17.5% |
[ 0.5% - 1.0% ] 0.96% | 83,240 | 14.8% |
[ 1.0% - 1.5% ] 1.09% | 141,748 | 15.0% |
[ 1.0% - 1.5% ] 1.30% | 56,190 | 14.8% |
[ 1.0% - 1.5% ] 1.48% | 28,779 | 16.7% |
[ 1.5% - 2.0% ] 1.60% | 13,126 | 11.0% |
[ 1.5% - 2.0% ] 1.80% | 27,711 | 20.0% |
[ 2.0% - 2.5% ] 2.03% | 3,448 | 20.4% |
[ 2.0% - 2.5% ] 2.15% | 10,904 | 14.6% |
[ 2.0% - 2.5% ] 2.35% | 12,524 | 15.2% |
[ 2.5% - 3.0% ] 2.56% | 4,527 | 16.6% |
[ 2.5% - 3.0% ] 2.76% | 435 | 31.3% |
[ 2.5% - 3.0% ] 2.88% | 6,240 | 17.6% |
[ 3.0% - 3.5% ] 3.05% | 3,808 | 5.7% |
[ 3.0% - 3.5% ] 3.22% | 2,331 | 17.3% |
[ 3.0% - 3.5% ] 3.47% | 173 | 11.6% |
[ 3.5% - 4.0% ] 3.63% | 1,681 | 10.8% |
[ 3.5% - 4.0% ] 3.88% | 1,210 | 19.8% |
[ 4.0% - 4.5% ] 4.14% | 290 | 22.8% |
[ 4.0% - 4.5% ] 4.49% | 178 | 11.2% |
[ 4.5% - 5.0% ] 4.55% | 682 | 14.7% |
[ 4.5% - 5.0% ] 4.89% | 368 | 28.5% |
[ 5.0% - 5.5% ] 5.18% | 1,236 | 8.7% |
[ 5.0% - 5.5% ] 5.31% | 1,300 | 11.3% |
[ 6.0% - 6.5% ] 6.04% | 3,346 | 17.4% |
[ 6.5% - 7.0% ] 6.90% | 174 | 28.7% |
[ 7.5% - 8.0% ] 7.63% | 249 | 12.9% |
[ 7.5% - 8.0% ] 7.85% | 1,554 | 12.4% |
[ 8.0% - 8.5% ] 8.00% | 25 | 8.0% |
[ 8.0% - 8.5% ] 8.22% | 1,593 | 17.0% |
[ 8.5% - 9.0% ] 8.63% | 255 | 16.8% |
[ 9.0% - 9.5% ] 9.23% | 758 | 10.2% |
[ 16.5% - 17.0% ] 16.86% | 172 | 15.1% |
[ 17.5% - 18.0% ] 17.65% | 68 | 32.4% |
[ 17.5% - 18.0% ] 17.82% | 578 | 17.3% |
[ 23.5% - 24.0% ] 23.61% | 216 | 18.1% |
[ 34.5% - 35.0% ] 34.94% | 83 | 13.3% |