French American Indian GED/Equivalency

COMPARE

French American Indian
Race
Ancestry
AfghanAfricanAlaska NativeAlaskan AthabascanAlbanianAleutAlsatianAmericanApacheArabArapahoArgentineanArmenianAssyrian/Chaldean/SyriacAustralianAustrianBahamianBangladeshiBarbadianBasqueBelgianBelizeanBermudanBhutaneseBlackfeetBolivianBrazilianBritishBritish West IndianBulgarianBurmeseCajunCambodianCanadianCape VerdeanCarpatho RusynCelticCentral AmericanCentral American IndianCherokeeCheyenneChickasawChileanChineseChippewaChoctawColombianColvilleComancheCosta RicanCreeCreekCroatianCrowCubanCypriotCzechCzechoslovakianDanishDelawareDominicanDutchDutch West IndianEastern EuropeanEcuadorianEgyptianEnglishEstonianEthiopianEuropeanFijianFilipinoFinnishFrenchFrench American IndianFrench CanadianGermanGerman RussianGhanaianGreekGuamanian/ChamorroGuatemalanGuyaneseHaitianHmongHonduranHopiHoumaHungarianIcelanderIndian (Asian)IndonesianInupiatIranianIraqiIrishIroquoisIsraeliItalianJamaicanJapaneseJordanianKenyanKiowaKoreanLaotianLatvianLebaneseLiberianLithuanianLumbeeLuxembourgerMacedonianMalaysianMalteseMarshalleseMenomineeMexicanMexican American IndianMongolianMoroccanNative HawaiianNavajoNepaleseNew ZealanderNicaraguanNigerianNorthern EuropeanNorwegianOkinawanOsageOttawaPaiutePakistaniPalestinianPanamanianParaguayanPennsylvania GermanPeruvianPimaPolishPortuguesePotawatomiPuebloPuerto RicanPuget Sound SalishRomanianRussianSalvadoranSamoanScandinavianScotch-IrishScottishSeminoleSenegaleseSerbianShoshoneSierra LeoneanSiouxSlavicSlovakSloveneSomaliSouth AfricanSouth AmericanSouth American IndianSoviet UnionSpaniardSpanishSpanish AmericanSpanish American IndianSri LankanSubsaharan AfricanSudaneseSwedishSwissSyrianTaiwaneseThaiTlingit-HaidaTohono O'OdhamTonganTrinidadian and TobagonianTsimshianTurkishU.S. Virgin IslanderUgandanUkrainianUruguayanUteVenezuelanVietnameseWelshWest IndianYakamaYaquiYugoslavianYumanYup'ikZimbabwean
Immigration
NonimmigrantsImmigrantsAfghanistanAfricaAlbaniaArgentinaArmeniaAsiaAustraliaAustriaBahamasBangladeshBarbadosBelarusBelgiumBelizeBoliviaBosnia and HerzegovinaBrazilBulgariaBurma/MyanmarCabo VerdeCambodiaCameroonCanadaCaribbeanCentral AmericaChileChinaColombiaCongoCosta RicaCroatiaCubaCzechoslovakiaDenmarkDominicaDominican RepublicEastern AfricaEastern AsiaEastern EuropeEcuadorEgyptEl SalvadorEnglandEritreaEthiopiaEuropeFijiFranceGermanyGhanaGreeceGrenadaGuatemalaGuyanaHaitiHondurasHong KongHungaryIndiaIndonesiaIranIraqIrelandIsraelItalyJamaicaJapanJordanKazakhstanKenyaKoreaKuwaitLaosLatin AmericaLatviaLebanonLiberiaLithuaniaMalaysiaMexicoMicronesiaMiddle AfricaMoldovaMoroccoNepalNetherlandsNicaraguaNigeriaNorth AmericaNorth MacedoniaNorthern AfricaNorthern EuropeNorwayOceaniaPakistanPanamaPeruPhilippinesPolandPortugalRomaniaRussiaSaudi ArabiaScotlandSenegalSerbiaSierra LeoneSingaporeSomaliaSouth AfricaSouth AmericaSouth Central AsiaSouth Eastern AsiaSouthern EuropeSpainSri LankaSt. Vincent and the GrenadinesSudanSwedenSwitzerlandSyriaTaiwanThailandTrinidad and TobagoTurkeyUgandaUkraineUruguayUzbekistanVenezuelaVietnamWest IndiesWestern AfricaWestern AsiaWestern EuropeYemenZaireZimbabweAzores
Select to Compare
Race
Ancestry
AfghanAfricanAlaska NativeAlaskan AthabascanAlbanianAleutAlsatianAmericanApacheArabArapahoArgentineanArmenianAssyrian/Chaldean/SyriacAustralianAustrianBahamianBangladeshiBarbadianBasqueBelgianBelizeanBermudanBhutaneseBlackfeetBolivianBrazilianBritishBritish West IndianBulgarianBurmeseCajunCambodianCanadianCape VerdeanCarpatho RusynCelticCentral AmericanCentral American IndianCherokeeCheyenneChickasawChileanChineseChippewaChoctawColombianColvilleComancheCosta RicanCreeCreekCroatianCrowCubanCypriotCzechCzechoslovakianDanishDelawareDominicanDutchDutch West IndianEastern EuropeanEcuadorianEgyptianEnglishEstonianEthiopianEuropeanFijianFilipinoFinnishFrenchFrench CanadianGermanGerman RussianGhanaianGreekGuamanian/ChamorroGuatemalanGuyaneseHaitianHmongHonduranHopiHoumaHungarianIcelanderIndian (Asian)IndonesianInupiatIranianIraqiIrishIroquoisIsraeliItalianJamaicanJapaneseJordanianKenyanKiowaKoreanLaotianLatvianLebaneseLiberianLithuanianLumbeeLuxembourgerMacedonianMalaysianMalteseMarshalleseMenomineeMexicanMexican American IndianMongolianMoroccanNative HawaiianNavajoNepaleseNew ZealanderNicaraguanNigerianNorthern EuropeanNorwegianOkinawanOsageOttawaPaiutePakistaniPalestinianPanamanianParaguayanPennsylvania GermanPeruvianPimaPolishPortuguesePotawatomiPuebloPuerto RicanPuget Sound SalishRomanianRussianSalvadoranSamoanScandinavianScotch-IrishScottishSeminoleSenegaleseSerbianShoshoneSierra LeoneanSiouxSlavicSlovakSloveneSomaliSouth AfricanSouth AmericanSouth American IndianSoviet UnionSpaniardSpanishSpanish AmericanSpanish American IndianSri LankanSubsaharan AfricanSudaneseSwedishSwissSyrianTaiwaneseThaiTlingit-HaidaTohono O'OdhamTonganTrinidadian and TobagonianTsimshianTurkishU.S. Virgin IslanderUgandanUkrainianUruguayanUteVenezuelanVietnameseWelshWest IndianYakamaYaquiYugoslavianYumanYup'ikZimbabwean
Immigration
NonimmigrantsImmigrantsAfghanistanAfricaAlbaniaArgentinaArmeniaAsiaAustraliaAustriaBahamasBangladeshBarbadosBelarusBelgiumBelizeBoliviaBosnia and HerzegovinaBrazilBulgariaBurma/MyanmarCabo VerdeCambodiaCameroonCanadaCaribbeanCentral AmericaChileChinaColombiaCongoCosta RicaCroatiaCubaCzechoslovakiaDenmarkDominicaDominican RepublicEastern AfricaEastern AsiaEastern EuropeEcuadorEgyptEl SalvadorEnglandEritreaEthiopiaEuropeFijiFranceGermanyGhanaGreeceGrenadaGuatemalaGuyanaHaitiHondurasHong KongHungaryIndiaIndonesiaIranIraqIrelandIsraelItalyJamaicaJapanJordanKazakhstanKenyaKoreaKuwaitLaosLatin AmericaLatviaLebanonLiberiaLithuaniaMalaysiaMexicoMicronesiaMiddle AfricaMoldovaMoroccoNepalNetherlandsNicaraguaNigeriaNorth AmericaNorth MacedoniaNorthern AfricaNorthern EuropeNorwayOceaniaPakistanPanamaPeruPhilippinesPolandPortugalRomaniaRussiaSaudi ArabiaScotlandSenegalSerbiaSierra LeoneSingaporeSomaliaSouth AfricaSouth AmericaSouth Central AsiaSouth Eastern AsiaSouthern EuropeSpainSri LankaSt. Vincent and the GrenadinesSudanSwedenSwitzerlandSyriaTaiwanThailandTrinidad and TobagoTurkeyUgandaUkraineUruguayUzbekistanVenezuelaVietnamWest IndiesWestern AfricaWestern AsiaWestern EuropeYemenZaireZimbabweAzores
GED/Equivalency
Income
Poverty
Unemployment
Labor Participation
Family Structure
Vehicle Availability
Education Level
Disability

French American Indian GED/Equivalency
Tragic

84.6%
GED/EQUIVALENCY
6.3/ 100
METRIC RATING
224th/ 347
METRIC RANK

French American Indian GED/Equivalency Correlation Chart

The statistical analysis conducted on geographies consisting of 131,976,269 people shows a weak negative correlation between the proportion of French American Indians and percentage of population with at least ged/equivalency education in the United States with a correlation coefficient (R) of -0.298 and weighted average of 84.6%. On average, for every 1% (one percent) increase in French American Indians within a typical geography, there is a decrease of 0.31% in percentage of population with at least ged/equivalency education.
French American Indian GED/Equivalency
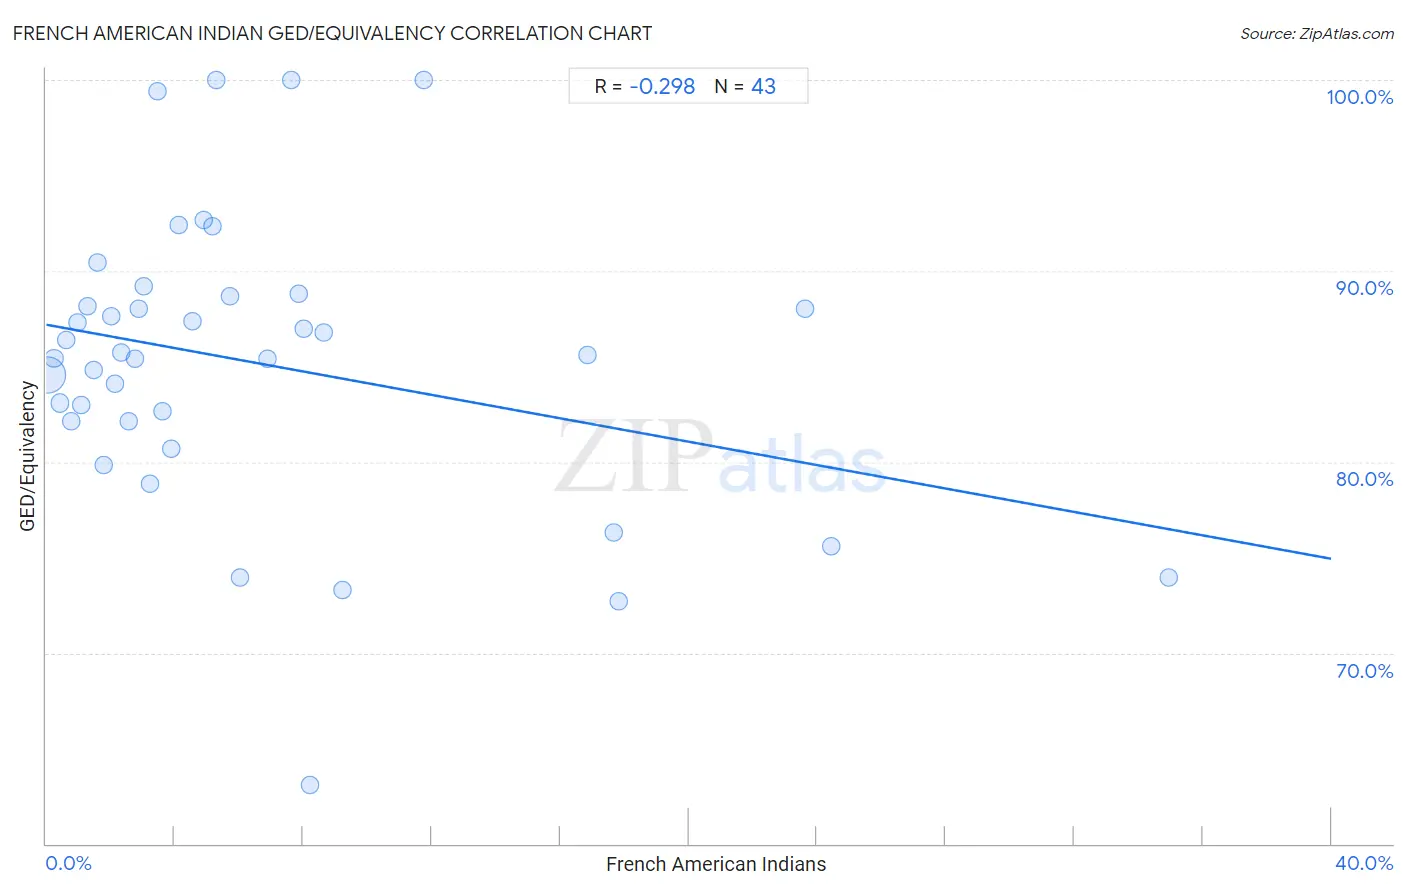
It is essential to understand that the correlation between the percentage of French American Indians and percentage of population with at least ged/equivalency education does not imply a direct cause-and-effect relationship. It remains uncertain whether the presence of French American Indians influences an upward or downward trend in the level of percentage of population with at least ged/equivalency education within an area, or if French American Indians simply ended up residing in those areas with higher or lower levels of percentage of population with at least ged/equivalency education due to other factors.

Demographics Similar to French American Indians by GED/Equivalency

In terms of ged/equivalency, the demographic groups most similar to French American Indians are Immigrants from Thailand (84.5%, a difference of 0.050%), Immigrants from Uzbekistan (84.6%, a difference of 0.070%), Immigrants from Zaire (84.5%, a difference of 0.080%), Iroquois (84.6%, a difference of 0.090%), and Immigrants from Costa Rica (84.5%, a difference of 0.090%).
DemographicsRating | RankGED/Equivalency
Nigerians
8.6
/100
|
#217
Tragic
84.7%
Alaska Natives
8.6
/100
|
#218
Tragic
84.7%
Potawatomi
8.2
/100
|
#219
Tragic
84.7%
Americans
8.2
/100
|
#220
Tragic
84.7%
Taiwanese
8.1
/100
|
#221
Tragic
84.7%
Iroquois
7.5
/100
|
#222
Tragic
84.6%
Immigrants from Uzbekistan
7.1
/100
|
#223
Tragic
84.6%
French American Indians
6.3
/100
|
#224
Tragic
84.6%
Immigrants from Thailand
5.8
/100
|
#225
Tragic
84.5%
Immigrants from Zaire
5.5
/100
|
#226
Tragic
84.5%
Immigrants from Costa Rica
5.4
/100
|
#227
Tragic
84.5%
Immigrants from Liberia
4.9
/100
|
#228
Tragic
84.4%
Immigrants from Uruguay
4.6
/100
|
#229
Tragic
84.4%
Immigrants from Colombia
4.5
/100
|
#230
Tragic
84.4%
Immigrants from Middle Africa
4.3
/100
|
#231
Tragic
84.4%

French American Indian GED/Equivalency Correlation Summary

MeasurementFrench American Indian DataGED/Equivalency Data
Minimum0.025%63.0%
Maximum34.9%100.0%
Range34.9%37.0%
Mean6.6%85.2%
Median3.9%85.6%
Interquartile 25% (IQ1)1.8%82.1%
Interquartile 75% (IQ3)8.0%88.7%
Interquartile Range (IQR)6.2%6.6%
Standard Deviation (Sample)7.5%7.7%
Standard Deviation (Population)7.4%7.6%

Correlation Details

French American Indian PercentileSample SizeGED/Equivalency
[
0.0%
-
0.5%
]
0.025%
124,988,24684.5%
[
0.0%
-
0.5%
]
0.24%
4,852,09685.4%
[
0.0%
-
0.5%
]
0.43%
1,193,47583.1%
[
0.5%
-
1.0%
]
0.63%
368,78286.4%
[
0.5%
-
1.0%
]
0.78%
161,76882.1%
[
0.5%
-
1.0%
]
0.96%
83,24087.3%
[
1.0%
-
1.5%
]
1.09%
141,74883.0%
[
1.0%
-
1.5%
]
1.30%
56,19088.1%
[
1.0%
-
1.5%
]
1.48%
28,77984.8%
[
1.5%
-
2.0%
]
1.60%
13,12690.5%
[
1.5%
-
2.0%
]
1.80%
27,71179.8%
[
2.0%
-
2.5%
]
2.03%
3,44887.6%
[
2.0%
-
2.5%
]
2.15%
10,90484.1%
[
2.0%
-
2.5%
]
2.35%
12,52485.7%
[
2.5%
-
3.0%
]
2.56%
4,52782.1%
[
2.5%
-
3.0%
]
2.76%
43585.4%
[
2.5%
-
3.0%
]
2.88%
6,24088.0%
[
3.0%
-
3.5%
]
3.05%
3,80889.2%
[
3.0%
-
3.5%
]
3.22%
2,33178.8%
[
3.0%
-
3.5%
]
3.47%
17399.4%
[
3.5%
-
4.0%
]
3.63%
1,68182.7%
[
3.5%
-
4.0%
]
3.88%
1,21080.7%
[
4.0%
-
4.5%
]
4.14%
29092.4%
[
4.5%
-
5.0%
]
4.55%
68287.4%
[
4.5%
-
5.0%
]
4.89%
36892.7%
[
5.0%
-
5.5%
]
5.18%
1,23692.4%
[
5.0%
-
5.5%
]
5.31%
1,300100.0%
[
5.5%
-
6.0%
]
5.71%
66688.7%
[
6.0%
-
6.5%
]
6.04%
3,34674.0%
[
6.5%
-
7.0%
]
6.90%
17485.4%
[
7.5%
-
8.0%
]
7.63%
249100.0%
[
7.5%
-
8.0%
]
7.85%
1,55488.8%
[
8.0%
-
8.5%
]
8.00%
2587.0%
[
8.0%
-
8.5%
]
8.22%
1,59363.0%
[
8.5%
-
9.0%
]
8.63%
25586.8%
[
9.0%
-
9.5%
]
9.23%
75873.3%
[
11.5%
-
12.0%
]
11.76%
34100.0%
[
16.5%
-
17.0%
]
16.86%
17285.6%
[
17.5%
-
18.0%
]
17.65%
6876.3%
[
17.5%
-
18.0%
]
17.82%
57872.7%
[
23.5%
-
24.0%
]
23.61%
21688.0%
[
24.0%
-
24.5%
]
24.44%
18075.6%
[
34.5%
-
35.0%
]
34.94%
8373.9%