French American Indian 4 or more Vehicles in Household

COMPARE

French American Indian
Race
Ancestry
AfghanAfricanAlaska NativeAlaskan AthabascanAlbanianAleutAlsatianAmericanApacheArabArapahoArgentineanArmenianAssyrian/Chaldean/SyriacAustralianAustrianBahamianBangladeshiBarbadianBasqueBelgianBelizeanBermudanBhutaneseBlackfeetBolivianBrazilianBritishBritish West IndianBulgarianBurmeseCajunCambodianCanadianCape VerdeanCarpatho RusynCelticCentral AmericanCentral American IndianCherokeeCheyenneChickasawChileanChineseChippewaChoctawColombianColvilleComancheCosta RicanCreeCreekCroatianCrowCubanCypriotCzechCzechoslovakianDanishDelawareDominicanDutchDutch West IndianEastern EuropeanEcuadorianEgyptianEnglishEstonianEthiopianEuropeanFijianFilipinoFinnishFrenchFrench American IndianFrench CanadianGermanGerman RussianGhanaianGreekGuamanian/ChamorroGuatemalanGuyaneseHaitianHmongHonduranHopiHoumaHungarianIcelanderIndian (Asian)IndonesianInupiatIranianIraqiIrishIroquoisIsraeliItalianJamaicanJapaneseJordanianKenyanKiowaKoreanLaotianLatvianLebaneseLiberianLithuanianLumbeeLuxembourgerMacedonianMalaysianMalteseMarshalleseMenomineeMexicanMexican American IndianMongolianMoroccanNative HawaiianNavajoNepaleseNew ZealanderNicaraguanNigerianNorthern EuropeanNorwegianOkinawanOsageOttawaPaiutePakistaniPalestinianPanamanianParaguayanPennsylvania GermanPeruvianPimaPolishPortuguesePotawatomiPuebloPuerto RicanPuget Sound SalishRomanianRussianSalvadoranSamoanScandinavianScotch-IrishScottishSeminoleSenegaleseSerbianShoshoneSierra LeoneanSiouxSlavicSlovakSloveneSomaliSouth AfricanSouth AmericanSouth American IndianSoviet UnionSpaniardSpanishSpanish AmericanSpanish American IndianSri LankanSubsaharan AfricanSudaneseSwedishSwissSyrianTaiwaneseThaiTlingit-HaidaTohono O'OdhamTonganTrinidadian and TobagonianTsimshianTurkishU.S. Virgin IslanderUgandanUkrainianUruguayanUteVenezuelanVietnameseWelshWest IndianYakamaYaquiYugoslavianYumanYup'ikZimbabwean
Immigration
NonimmigrantsImmigrantsAfghanistanAfricaAlbaniaArgentinaArmeniaAsiaAustraliaAustriaBahamasBangladeshBarbadosBelarusBelgiumBelizeBoliviaBosnia and HerzegovinaBrazilBulgariaBurma/MyanmarCabo VerdeCambodiaCameroonCanadaCaribbeanCentral AmericaChileChinaColombiaCongoCosta RicaCroatiaCubaCzechoslovakiaDenmarkDominicaDominican RepublicEastern AfricaEastern AsiaEastern EuropeEcuadorEgyptEl SalvadorEnglandEritreaEthiopiaEuropeFijiFranceGermanyGhanaGreeceGrenadaGuatemalaGuyanaHaitiHondurasHong KongHungaryIndiaIndonesiaIranIraqIrelandIsraelItalyJamaicaJapanJordanKazakhstanKenyaKoreaKuwaitLaosLatin AmericaLatviaLebanonLiberiaLithuaniaMalaysiaMexicoMicronesiaMiddle AfricaMoldovaMoroccoNepalNetherlandsNicaraguaNigeriaNorth AmericaNorth MacedoniaNorthern AfricaNorthern EuropeNorwayOceaniaPakistanPanamaPeruPhilippinesPolandPortugalRomaniaRussiaSaudi ArabiaScotlandSenegalSerbiaSierra LeoneSingaporeSomaliaSouth AfricaSouth AmericaSouth Central AsiaSouth Eastern AsiaSouthern EuropeSpainSri LankaSt. Vincent and the GrenadinesSudanSwedenSwitzerlandSyriaTaiwanThailandTrinidad and TobagoTurkeyUgandaUkraineUruguayUzbekistanVenezuelaVietnamWest IndiesWestern AfricaWestern AsiaWestern EuropeYemenZaireZimbabweAzores
Select to Compare
Race
Ancestry
AfghanAfricanAlaska NativeAlaskan AthabascanAlbanianAleutAlsatianAmericanApacheArabArapahoArgentineanArmenianAssyrian/Chaldean/SyriacAustralianAustrianBahamianBangladeshiBarbadianBasqueBelgianBelizeanBermudanBhutaneseBlackfeetBolivianBrazilianBritishBritish West IndianBulgarianBurmeseCajunCambodianCanadianCape VerdeanCarpatho RusynCelticCentral AmericanCentral American IndianCherokeeCheyenneChickasawChileanChineseChippewaChoctawColombianColvilleComancheCosta RicanCreeCreekCroatianCrowCubanCypriotCzechCzechoslovakianDanishDelawareDominicanDutchDutch West IndianEastern EuropeanEcuadorianEgyptianEnglishEstonianEthiopianEuropeanFijianFilipinoFinnishFrenchFrench CanadianGermanGerman RussianGhanaianGreekGuamanian/ChamorroGuatemalanGuyaneseHaitianHmongHonduranHopiHoumaHungarianIcelanderIndian (Asian)IndonesianInupiatIranianIraqiIrishIroquoisIsraeliItalianJamaicanJapaneseJordanianKenyanKiowaKoreanLaotianLatvianLebaneseLiberianLithuanianLumbeeLuxembourgerMacedonianMalaysianMalteseMarshalleseMenomineeMexicanMexican American IndianMongolianMoroccanNative HawaiianNavajoNepaleseNew ZealanderNicaraguanNigerianNorthern EuropeanNorwegianOkinawanOsageOttawaPaiutePakistaniPalestinianPanamanianParaguayanPennsylvania GermanPeruvianPimaPolishPortuguesePotawatomiPuebloPuerto RicanPuget Sound SalishRomanianRussianSalvadoranSamoanScandinavianScotch-IrishScottishSeminoleSenegaleseSerbianShoshoneSierra LeoneanSiouxSlavicSlovakSloveneSomaliSouth AfricanSouth AmericanSouth American IndianSoviet UnionSpaniardSpanishSpanish AmericanSpanish American IndianSri LankanSubsaharan AfricanSudaneseSwedishSwissSyrianTaiwaneseThaiTlingit-HaidaTohono O'OdhamTonganTrinidadian and TobagonianTsimshianTurkishU.S. Virgin IslanderUgandanUkrainianUruguayanUteVenezuelanVietnameseWelshWest IndianYakamaYaquiYugoslavianYumanYup'ikZimbabwean
Immigration
NonimmigrantsImmigrantsAfghanistanAfricaAlbaniaArgentinaArmeniaAsiaAustraliaAustriaBahamasBangladeshBarbadosBelarusBelgiumBelizeBoliviaBosnia and HerzegovinaBrazilBulgariaBurma/MyanmarCabo VerdeCambodiaCameroonCanadaCaribbeanCentral AmericaChileChinaColombiaCongoCosta RicaCroatiaCubaCzechoslovakiaDenmarkDominicaDominican RepublicEastern AfricaEastern AsiaEastern EuropeEcuadorEgyptEl SalvadorEnglandEritreaEthiopiaEuropeFijiFranceGermanyGhanaGreeceGrenadaGuatemalaGuyanaHaitiHondurasHong KongHungaryIndiaIndonesiaIranIraqIrelandIsraelItalyJamaicaJapanJordanKazakhstanKenyaKoreaKuwaitLaosLatin AmericaLatviaLebanonLiberiaLithuaniaMalaysiaMexicoMicronesiaMiddle AfricaMoldovaMoroccoNepalNetherlandsNicaraguaNigeriaNorth AmericaNorth MacedoniaNorthern AfricaNorthern EuropeNorwayOceaniaPakistanPanamaPeruPhilippinesPolandPortugalRomaniaRussiaSaudi ArabiaScotlandSenegalSerbiaSierra LeoneSingaporeSomaliaSouth AfricaSouth AmericaSouth Central AsiaSouth Eastern AsiaSouthern EuropeSpainSri LankaSt. Vincent and the GrenadinesSudanSwedenSwitzerlandSyriaTaiwanThailandTrinidad and TobagoTurkeyUgandaUkraineUruguayUzbekistanVenezuelaVietnamWest IndiesWestern AfricaWestern AsiaWestern EuropeYemenZaireZimbabweAzores
4 or more Vehicles in Household
Income
Poverty
Unemployment
Labor Participation
Family Structure
Vehicle Availability
Education Level
Disability

French American Indian 4 or more Vehicles in Household
Exceptional

6.8%
4+ VEHICLES AVAILABLE
95.7/ 100
METRIC RATING
118th/ 347
METRIC RANK

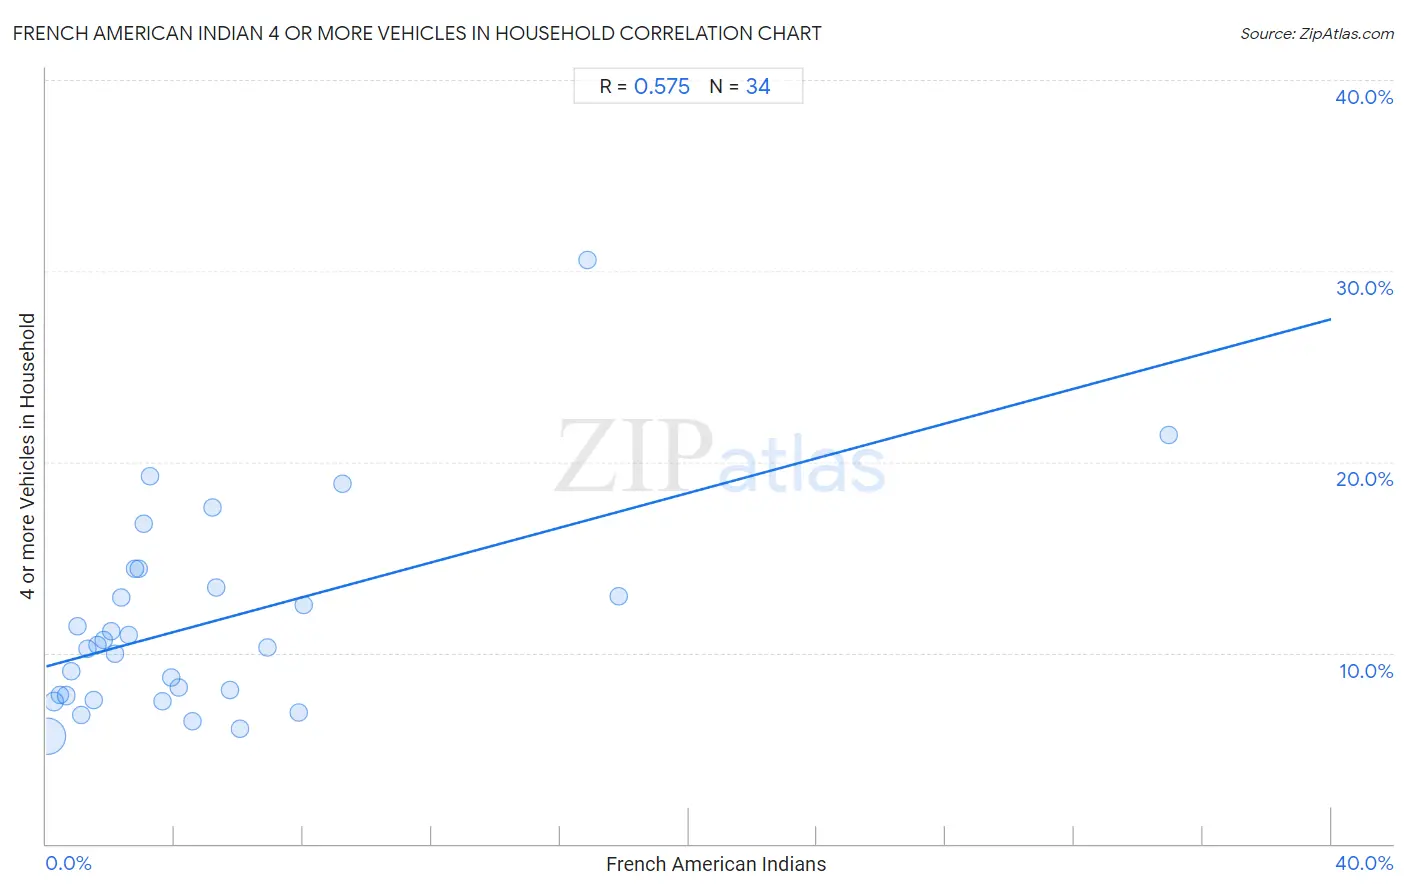
French American Indian 4 or more Vehicles in Household Correlation Chart

The statistical analysis conducted on geographies consisting of 131,879,224 people shows a substantial positive correlation between the proportion of French American Indians and percentage of households with 4 or more vehicles available in the United States with a correlation coefficient (R) of 0.575 and weighted average of 6.8%. On average, for every 1% (one percent) increase in French American Indians within a typical geography, there is an increase of 0.45% in percentage of households with 4 or more vehicles available.
French American Indian 4 or more Vehicles in Household
It is essential to understand that the correlation between the percentage of French American Indians and percentage of households with 4 or more vehicles available does not imply a direct cause-and-effect relationship. It remains uncertain whether the presence of French American Indians influences an upward or downward trend in the level of percentage of households with 4 or more vehicles available within an area, or if French American Indians simply ended up residing in those areas with higher or lower levels of percentage of households with 4 or more vehicles available due to other factors.

Demographics Similar to French American Indians by 4 or more Vehicles in Household

In terms of 4 or more vehicles in household, the demographic groups most similar to French American Indians are Burmese (6.8%, a difference of 0.0%), Immigrants from Guatemala (6.8%, a difference of 0.020%), Costa Rican (6.8%, a difference of 0.11%), Tlingit-Haida (6.8%, a difference of 0.28%), and Bolivian (6.8%, a difference of 0.34%).
DemographicsRating | Rank4 or more Vehicles in Household
Aleuts
97.0
/100
|
#111
Exceptional
6.9%
Hopi
97.0
/100
|
#112
Exceptional
6.9%
Canadians
96.4
/100
|
#113
Exceptional
6.9%
Bolivians
96.3
/100
|
#114
Exceptional
6.8%
Tlingit-Haida
96.2
/100
|
#115
Exceptional
6.8%
Immigrants from Guatemala
95.8
/100
|
#116
Exceptional
6.8%
Burmese
95.7
/100
|
#117
Exceptional
6.8%
French American Indians
95.7
/100
|
#118
Exceptional
6.8%
Costa Ricans
95.5
/100
|
#119
Exceptional
6.8%
Comanche
94.8
/100
|
#120
Exceptional
6.8%
Immigrants from Germany
94.7
/100
|
#121
Exceptional
6.8%
Immigrants from Nicaragua
94.7
/100
|
#122
Exceptional
6.8%
Immigrants
94.6
/100
|
#123
Exceptional
6.8%
Immigrants from Asia
94.4
/100
|
#124
Exceptional
6.8%
Austrians
94.1
/100
|
#125
Exceptional
6.8%

French American Indian 4 or more Vehicles in Household Correlation Summary

MeasurementFrench American Indian Data4 or more Vehicles in Household Data
Minimum0.025%5.6%
Maximum34.9%30.6%
Range34.9%25.0%
Mean5.0%11.6%
Median3.0%10.3%
Interquartile 25% (IQ1)1.5%7.8%
Interquartile 75% (IQ3)5.7%13.4%
Interquartile Range (IQR)4.2%5.6%
Standard Deviation (Sample)6.7%5.3%
Standard Deviation (Population)6.6%5.2%

Correlation Details

French American Indian PercentileSample Size4 or more Vehicles in Household
[
0.0%
-
0.5%
]
0.025%
124,919,8415.6%
[
0.0%
-
0.5%
]
0.24%
4,847,0287.5%
[
0.0%
-
0.5%
]
0.43%
1,180,2687.8%
[
0.5%
-
1.0%
]
0.63%
367,8297.8%
[
0.5%
-
1.0%
]
0.78%
161,3539.0%
[
0.5%
-
1.0%
]
0.96%
82,62411.4%
[
1.0%
-
1.5%
]
1.09%
141,5626.7%
[
1.0%
-
1.5%
]
1.30%
53,55910.2%
[
1.0%
-
1.5%
]
1.48%
27,2407.5%
[
1.5%
-
2.0%
]
1.60%
13,00710.4%
[
1.5%
-
2.0%
]
1.80%
27,71110.7%
[
2.0%
-
2.5%
]
2.03%
3,44811.1%
[
2.0%
-
2.5%
]
2.14%
10,6399.9%
[
2.0%
-
2.5%
]
2.35%
12,26812.9%
[
2.5%
-
3.0%
]
2.56%
4,52710.9%
[
2.5%
-
3.0%
]
2.76%
36214.4%
[
2.5%
-
3.0%
]
2.88%
6,24014.4%
[
3.0%
-
3.5%
]
3.05%
3,80816.8%
[
3.0%
-
3.5%
]
3.22%
2,33119.2%
[
3.5%
-
4.0%
]
3.63%
1,6817.5%
[
3.5%
-
4.0%
]
3.88%
1,2108.7%
[
4.0%
-
4.5%
]
4.14%
2908.2%
[
4.5%
-
5.0%
]
4.55%
5066.4%
[
5.0%
-
5.5%
]
5.18%
1,23617.6%
[
5.0%
-
5.5%
]
5.31%
1,30013.4%
[
5.5%
-
6.0%
]
5.71%
6668.1%
[
6.0%
-
6.5%
]
6.04%
3,3466.0%
[
6.5%
-
7.0%
]
6.90%
17410.3%
[
7.5%
-
8.0%
]
7.85%
1,5546.9%
[
8.0%
-
8.5%
]
8.00%
2512.5%
[
9.0%
-
9.5%
]
9.23%
75818.9%
[
16.5%
-
17.0%
]
16.86%
17230.6%
[
17.5%
-
18.0%
]
17.82%
57813.0%
[
34.5%
-
35.0%
]
34.94%
8321.4%