Delaware vs Welsh Disability Age 5 to 17
COMPARE
Delaware
Welsh
Disability Age 5 to 17
Disability Age 5 to 17 Comparison
Delaware
Welsh
6.5%
DISABILITY AGE 5 TO 17
0.0/ 100
METRIC RATING
319th/ 347
METRIC RANK
6.3%
DISABILITY AGE 5 TO 17
0.0/ 100
METRIC RATING
299th/ 347
METRIC RANK
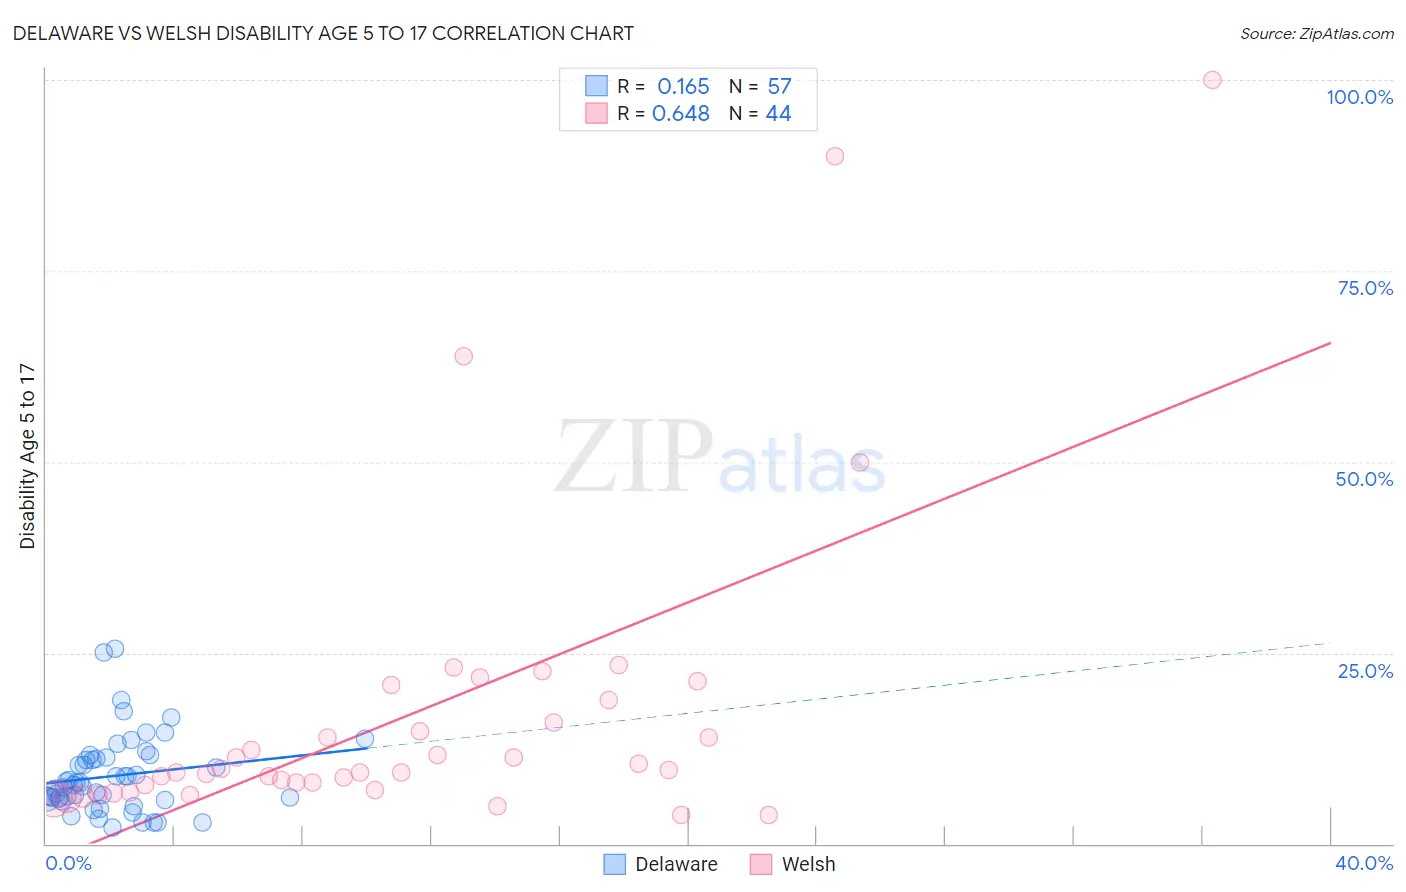
Delaware vs Welsh Disability Age 5 to 17 Correlation Chart
The statistical analysis conducted on geographies consisting of 95,994,789 people shows a poor positive correlation between the proportion of Delaware and percentage of population with a disability between the ages 5 and 17 in the United States with a correlation coefficient (R) of 0.165 and weighted average of 6.5%. Similarly, the statistical analysis conducted on geographies consisting of 518,817,158 people shows a significant positive correlation between the proportion of Welsh and percentage of population with a disability between the ages 5 and 17 in the United States with a correlation coefficient (R) of 0.648 and weighted average of 6.3%, a difference of 3.6%.
Disability Age 5 to 17 Correlation Summary
| Measurement | Delaware | Welsh |
| Minimum | 2.1% | 3.7% |
| Maximum | 25.5% | 100.0% |
| Range | 23.4% | 96.3% |
| Mean | 8.9% | 17.0% |
| Median | 7.7% | 9.5% |
| Interquartile 25% (IQ1) | 5.8% | 7.4% |
| Interquartile 75% (IQ3) | 11.3% | 17.4% |
| Interquartile Range (IQR) | 5.4% | 9.9% |
| Standard Deviation (Sample) | 5.0% | 20.5% |
| Standard Deviation (Population) | 4.9% | 20.3% |
Demographics Similar to Delaware and Welsh by Disability Age 5 to 17
In terms of disability age 5 to 17, the demographic groups most similar to Delaware are Comanche (6.4%, a difference of 0.55%), Kiowa (6.4%, a difference of 0.58%), Immigrants from Dominican Republic (6.4%, a difference of 0.71%), Immigrants from Portugal (6.4%, a difference of 0.89%), and French (6.4%, a difference of 1.1%). Similarly, the demographic groups most similar to Welsh are Carpatho Rusyn (6.3%, a difference of 0.12%), U.S. Virgin Islander (6.3%, a difference of 0.14%), Celtic (6.3%, a difference of 0.47%), Yakama (6.3%, a difference of 0.57%), and Senegalese (6.3%, a difference of 0.65%).
| Demographics | Rating | Rank | Disability Age 5 to 17 |
| Welsh | 0.0 /100 | #299 | Tragic 6.3% |
| Carpatho Rusyns | 0.0 /100 | #300 | Tragic 6.3% |
| U.S. Virgin Islanders | 0.0 /100 | #301 | Tragic 6.3% |
| Celtics | 0.0 /100 | #302 | Tragic 6.3% |
| Yakama | 0.0 /100 | #303 | Tragic 6.3% |
| Senegalese | 0.0 /100 | #304 | Tragic 6.3% |
| Natives/Alaskans | 0.0 /100 | #305 | Tragic 6.3% |
| Immigrants | Nonimmigrants | 0.0 /100 | #306 | Tragic 6.3% |
| Bahamians | 0.0 /100 | #307 | Tragic 6.3% |
| Scotch-Irish | 0.0 /100 | #308 | Tragic 6.3% |
| Hmong | 0.0 /100 | #309 | Tragic 6.3% |
| Alaskan Athabascans | 0.0 /100 | #310 | Tragic 6.3% |
| Immigrants | Dominica | 0.0 /100 | #311 | Tragic 6.3% |
| Bermudans | 0.0 /100 | #312 | Tragic 6.4% |
| Apache | 0.0 /100 | #313 | Tragic 6.4% |
| French | 0.0 /100 | #314 | Tragic 6.4% |
| Immigrants | Portugal | 0.0 /100 | #315 | Tragic 6.4% |
| Immigrants | Dominican Republic | 0.0 /100 | #316 | Tragic 6.4% |
| Kiowa | 0.0 /100 | #317 | Tragic 6.4% |
| Comanche | 0.0 /100 | #318 | Tragic 6.4% |
| Delaware | 0.0 /100 | #319 | Tragic 6.5% |