Croatian GED/Equivalency
COMPARE
Croatian
Select to Compare
GED/Equivalency
Croatian GED/Equivalency
88.8%
GED/EQUIVALENCY
99.9/ 100
METRIC RATING
17th/ 347
METRIC RANK
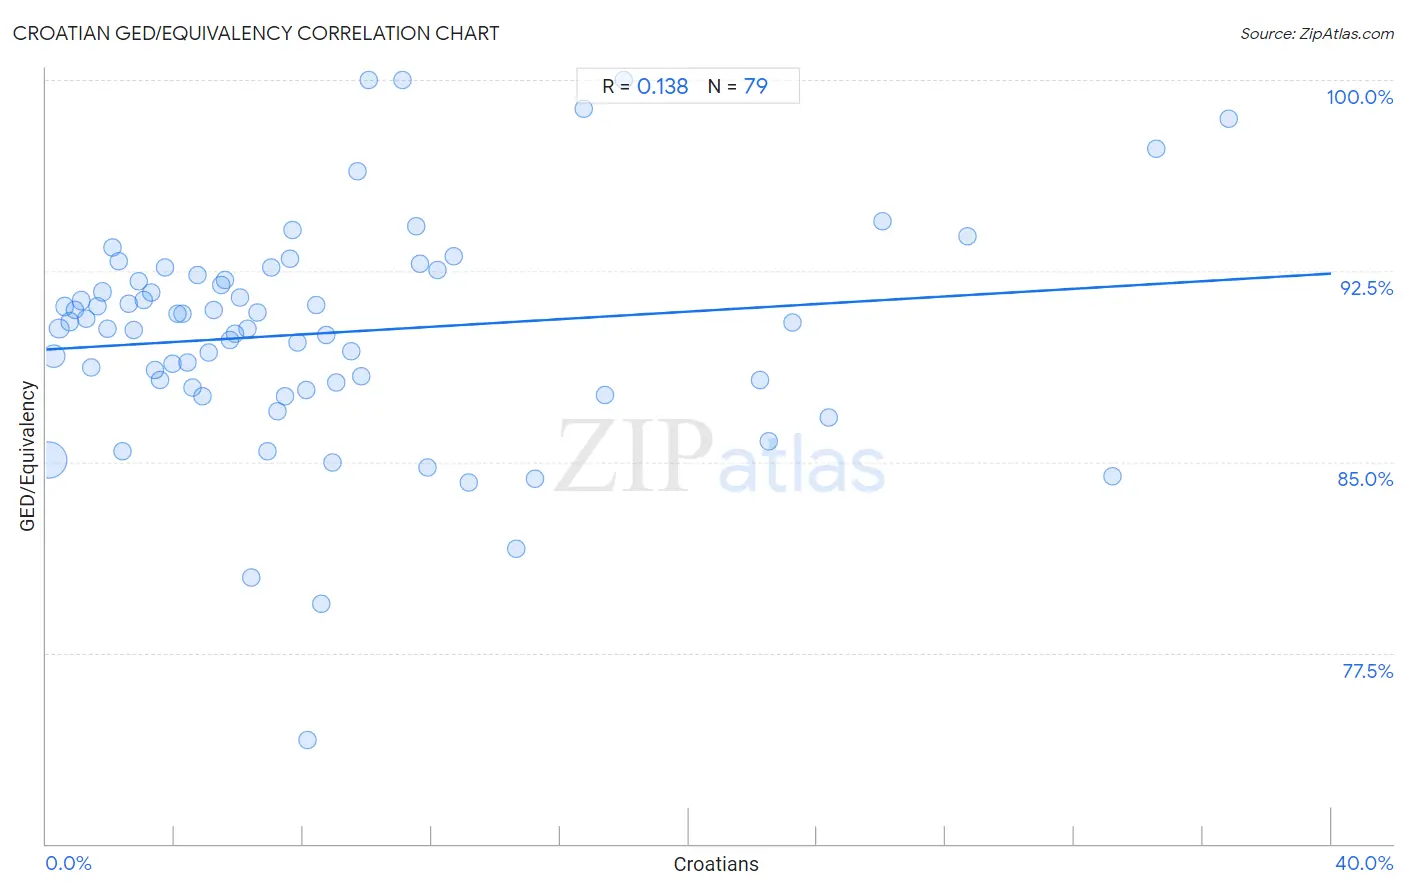
Croatian GED/Equivalency Correlation Chart
The statistical analysis conducted on geographies consisting of 375,732,690 people shows a poor positive correlation between the proportion of Croatians and percentage of population with at least ged/equivalency education in the United States with a correlation coefficient (R) of 0.138 and weighted average of 88.8%. On average, for every 1% (one percent) increase in Croatians within a typical geography, there is an increase of 0.075% in percentage of population with at least ged/equivalency education.
It is essential to understand that the correlation between the percentage of Croatians and percentage of population with at least ged/equivalency education does not imply a direct cause-and-effect relationship. It remains uncertain whether the presence of Croatians influences an upward or downward trend in the level of percentage of population with at least ged/equivalency education within an area, or if Croatians simply ended up residing in those areas with higher or lower levels of percentage of population with at least ged/equivalency education due to other factors.
Demographics Similar to Croatians by GED/Equivalency
In terms of ged/equivalency, the demographic groups most similar to Croatians are Immigrants from Taiwan (88.8%, a difference of 0.030%), Slovene (88.8%, a difference of 0.030%), Okinawan (88.9%, a difference of 0.060%), Cypriot (88.9%, a difference of 0.080%), and Swedish (88.8%, a difference of 0.080%).
| Demographics | Rating | Rank | GED/Equivalency |
| Norwegians | 99.9 /100 | #10 | Exceptional 89.0% |
| Bulgarians | 99.9 /100 | #11 | Exceptional 89.0% |
| Lithuanians | 99.9 /100 | #12 | Exceptional 88.9% |
| Immigrants from Iran | 99.9 /100 | #13 | Exceptional 88.9% |
| Cypriots | 99.9 /100 | #14 | Exceptional 88.9% |
| Okinawans | 99.9 /100 | #15 | Exceptional 88.9% |
| Immigrants from Taiwan | 99.9 /100 | #16 | Exceptional 88.8% |
| Croatians | 99.9 /100 | #17 | Exceptional 88.8% |
| Slovenes | 99.9 /100 | #18 | Exceptional 88.8% |
| Swedes | 99.9 /100 | #19 | Exceptional 88.8% |
| Maltese | 99.9 /100 | #20 | Exceptional 88.6% |
| Luxembourgers | 99.8 /100 | #21 | Exceptional 88.6% |
| Immigrants from Ireland | 99.8 /100 | #22 | Exceptional 88.6% |
| Russians | 99.8 /100 | #23 | Exceptional 88.6% |
| Slovaks | 99.8 /100 | #24 | Exceptional 88.6% |
Croatian GED/Equivalency Correlation Summary
| Measurement | Croatian Data | GED/Equivalency Data |
| Minimum | 0.073% | 74.1% |
| Maximum | 36.8% | 100.0% |
| Range | 36.7% | 25.9% |
| Mean | 8.9% | 90.1% |
| Median | 6.6% | 90.5% |
| Interquartile 25% (IQ1) | 3.3% | 87.9% |
| Interquartile 75% (IQ3) | 11.5% | 92.3% |
| Interquartile Range (IQR) | 8.2% | 4.4% |
| Standard Deviation (Sample) | 8.2% | 4.5% |
| Standard Deviation (Population) | 8.2% | 4.4% |
Correlation Details
| Croatian Percentile | Sample Size | GED/Equivalency |
[ 0.0% - 0.5% ] 0.073% | 256,202,296 | 85.1% |
[ 0.0% - 0.5% ] 0.23% | 70,303,309 | 89.1% |
[ 0.0% - 0.5% ] 0.40% | 22,931,891 | 90.2% |
[ 0.5% - 1.0% ] 0.57% | 9,838,794 | 91.1% |
[ 0.5% - 1.0% ] 0.74% | 5,826,755 | 90.5% |
[ 0.5% - 1.0% ] 0.91% | 3,182,134 | 91.0% |
[ 1.0% - 1.5% ] 1.08% | 1,826,012 | 91.3% |
[ 1.0% - 1.5% ] 1.24% | 1,037,545 | 90.6% |
[ 1.0% - 1.5% ] 1.40% | 662,514 | 88.7% |
[ 1.5% - 2.0% ] 1.58% | 549,437 | 91.1% |
[ 1.5% - 2.0% ] 1.75% | 639,836 | 91.7% |
[ 1.5% - 2.0% ] 1.91% | 516,684 | 90.2% |
[ 2.0% - 2.5% ] 2.07% | 364,367 | 93.4% |
[ 2.0% - 2.5% ] 2.24% | 373,236 | 92.9% |
[ 2.0% - 2.5% ] 2.39% | 334,179 | 85.4% |
[ 2.5% - 3.0% ] 2.58% | 168,614 | 91.2% |
[ 2.5% - 3.0% ] 2.71% | 114,113 | 90.2% |
[ 2.5% - 3.0% ] 2.89% | 169,550 | 92.1% |
[ 3.0% - 3.5% ] 3.03% | 127,954 | 91.3% |
[ 3.0% - 3.5% ] 3.25% | 32,107 | 91.7% |
[ 3.0% - 3.5% ] 3.39% | 68,210 | 88.6% |
[ 3.5% - 4.0% ] 3.56% | 41,701 | 88.2% |
[ 3.5% - 4.0% ] 3.71% | 83,770 | 92.6% |
[ 3.5% - 4.0% ] 3.92% | 21,142 | 88.8% |
[ 4.0% - 4.5% ] 4.08% | 31,818 | 90.8% |
[ 4.0% - 4.5% ] 4.23% | 115,319 | 90.8% |
[ 4.0% - 4.5% ] 4.41% | 9,580 | 88.9% |
[ 4.5% - 5.0% ] 4.54% | 16,263 | 87.9% |
[ 4.5% - 5.0% ] 4.71% | 10,344 | 92.3% |
[ 4.5% - 5.0% ] 4.88% | 8,704 | 87.6% |
[ 5.0% - 5.5% ] 5.07% | 4,797 | 89.3% |
[ 5.0% - 5.5% ] 5.19% | 14,553 | 91.0% |
[ 5.0% - 5.5% ] 5.44% | 2,943 | 92.0% |
[ 5.5% - 6.0% ] 5.58% | 29,415 | 92.1% |
[ 5.5% - 6.0% ] 5.73% | 7,942 | 89.8% |
[ 5.5% - 6.0% ] 5.86% | 11,015 | 90.0% |
[ 6.0% - 6.5% ] 6.03% | 5,767 | 91.4% |
[ 6.0% - 6.5% ] 6.26% | 3,307 | 90.2% |
[ 6.0% - 6.5% ] 6.39% | 3,223 | 80.4% |
[ 6.5% - 7.0% ] 6.57% | 731 | 90.9% |
[ 6.5% - 7.0% ] 6.89% | 5,342 | 85.4% |
[ 7.0% - 7.5% ] 7.00% | 9,094 | 92.6% |
[ 7.0% - 7.5% ] 7.21% | 652 | 87.0% |
[ 7.0% - 7.5% ] 7.43% | 2,019 | 87.6% |
[ 7.5% - 8.0% ] 7.57% | 1,823 | 93.0% |
[ 7.5% - 8.0% ] 7.68% | 612 | 94.1% |
[ 7.5% - 8.0% ] 7.83% | 1,251 | 89.7% |
[ 8.0% - 8.5% ] 8.10% | 1,717 | 87.8% |
[ 8.0% - 8.5% ] 8.15% | 270 | 74.1% |
[ 8.0% - 8.5% ] 8.42% | 1,164 | 91.2% |
[ 8.5% - 9.0% ] 8.56% | 397 | 79.4% |
[ 8.5% - 9.0% ] 8.72% | 447 | 90.0% |
[ 8.5% - 9.0% ] 8.89% | 731 | 85.0% |
[ 9.0% - 9.5% ] 9.04% | 365 | 88.1% |
[ 9.0% - 9.5% ] 9.50% | 1,674 | 89.4% |
[ 9.5% - 10.0% ] 9.68% | 589 | 96.4% |
[ 9.5% - 10.0% ] 9.82% | 1,181 | 88.3% |
[ 10.0% - 10.5% ] 10.02% | 409 | 100.0% |
[ 11.0% - 11.5% ] 11.07% | 614 | 100.0% |
[ 11.5% - 12.0% ] 11.50% | 339 | 94.3% |
[ 11.5% - 12.0% ] 11.63% | 946 | 92.8% |
[ 11.5% - 12.0% ] 11.87% | 396 | 84.8% |
[ 12.0% - 12.5% ] 12.16% | 148 | 92.5% |
[ 12.5% - 13.0% ] 12.67% | 1,318 | 93.1% |
[ 13.0% - 13.5% ] 13.16% | 38 | 84.2% |
[ 14.5% - 15.0% ] 14.62% | 253 | 81.6% |
[ 15.0% - 15.5% ] 15.22% | 427 | 84.3% |
[ 16.5% - 17.0% ] 16.74% | 1,111 | 98.9% |
[ 17.0% - 17.5% ] 17.41% | 1,252 | 87.6% |
[ 17.5% - 18.0% ] 17.96% | 334 | 100.0% |
[ 22.0% - 22.5% ] 22.22% | 18 | 88.2% |
[ 22.0% - 22.5% ] 22.49% | 369 | 85.8% |
[ 23.0% - 23.5% ] 23.25% | 985 | 90.5% |
[ 24.0% - 24.5% ] 24.36% | 312 | 86.7% |
[ 26.0% - 26.5% ] 26.04% | 672 | 94.5% |
[ 28.5% - 29.0% ] 28.69% | 610 | 93.9% |
[ 33.0% - 33.5% ] 33.19% | 229 | 84.4% |
[ 34.5% - 35.0% ] 34.57% | 567 | 97.3% |
[ 36.5% - 37.0% ] 36.81% | 144 | 98.5% |