Croatian vs Immigrants from Bulgaria Disability Age 5 to 17
COMPARE
Croatian
Immigrants from Bulgaria
Disability Age 5 to 17
Disability Age 5 to 17 Comparison
Croatians
Immigrants from Bulgaria
5.7%
DISABILITY AGE 5 TO 17
23.6/ 100
METRIC RATING
194th/ 347
METRIC RANK
5.4%
DISABILITY AGE 5 TO 17
94.0/ 100
METRIC RATING
130th/ 347
METRIC RANK
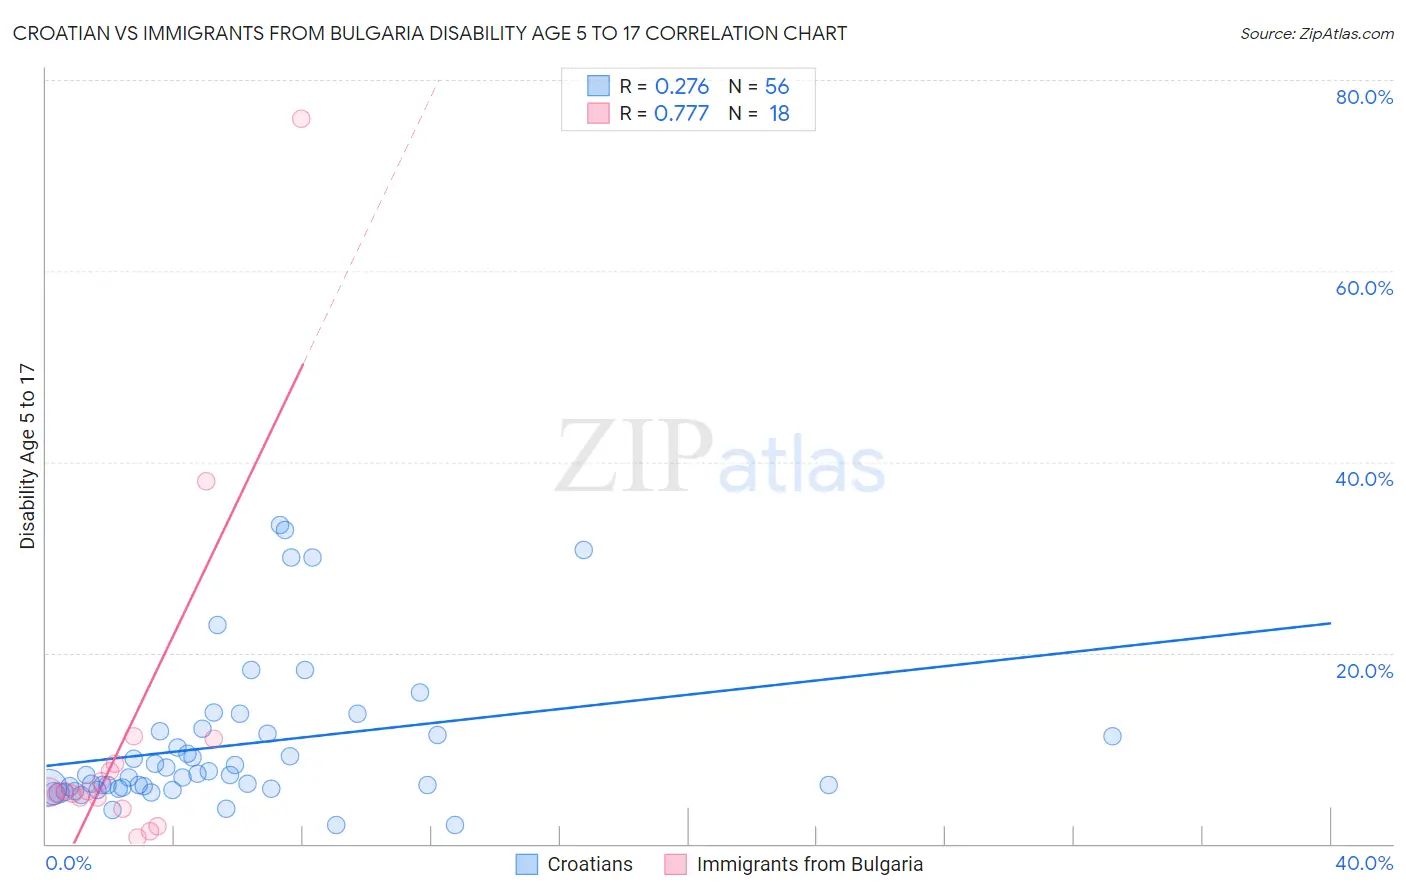
Croatian vs Immigrants from Bulgaria Disability Age 5 to 17 Correlation Chart
The statistical analysis conducted on geographies consisting of 372,001,330 people shows a weak positive correlation between the proportion of Croatians and percentage of population with a disability between the ages 5 and 17 in the United States with a correlation coefficient (R) of 0.276 and weighted average of 5.7%. Similarly, the statistical analysis conducted on geographies consisting of 171,828,354 people shows a strong positive correlation between the proportion of Immigrants from Bulgaria and percentage of population with a disability between the ages 5 and 17 in the United States with a correlation coefficient (R) of 0.777 and weighted average of 5.4%, a difference of 5.0%.
Disability Age 5 to 17 Correlation Summary
| Measurement | Croatian | Immigrants from Bulgaria |
| Minimum | 2.0% | 0.67% |
| Maximum | 33.3% | 76.0% |
| Range | 31.3% | 75.3% |
| Mean | 10.3% | 11.3% |
| Median | 7.2% | 5.4% |
| Interquartile 25% (IQ1) | 5.8% | 4.8% |
| Interquartile 75% (IQ3) | 11.6% | 8.4% |
| Interquartile Range (IQR) | 5.9% | 3.6% |
| Standard Deviation (Sample) | 7.8% | 18.1% |
| Standard Deviation (Population) | 7.7% | 17.6% |
Similar Demographics by Disability Age 5 to 17
Demographics Similar to Croatians by Disability Age 5 to 17
In terms of disability age 5 to 17, the demographic groups most similar to Croatians are Immigrants from Nigeria (5.7%, a difference of 0.010%), Inupiat (5.7%, a difference of 0.020%), Immigrants from North America (5.7%, a difference of 0.030%), Immigrants from Canada (5.7%, a difference of 0.16%), and Immigrants from Bosnia and Herzegovina (5.7%, a difference of 0.17%).
| Demographics | Rating | Rank | Disability Age 5 to 17 |
| Immigrants | Thailand | 30.2 /100 | #187 | Fair 5.7% |
| Marshallese | 28.1 /100 | #188 | Fair 5.7% |
| Pueblo | 27.5 /100 | #189 | Fair 5.7% |
| Immigrants | Eastern Africa | 27.3 /100 | #190 | Fair 5.7% |
| Danes | 26.5 /100 | #191 | Fair 5.7% |
| Immigrants | Bosnia and Herzegovina | 26.3 /100 | #192 | Fair 5.7% |
| Immigrants | Canada | 26.1 /100 | #193 | Fair 5.7% |
| Croatians | 23.6 /100 | #194 | Fair 5.7% |
| Immigrants | Nigeria | 23.4 /100 | #195 | Fair 5.7% |
| Inupiat | 23.3 /100 | #196 | Fair 5.7% |
| Immigrants | North America | 23.1 /100 | #197 | Fair 5.7% |
| Norwegians | 20.9 /100 | #198 | Fair 5.7% |
| Northern Europeans | 15.2 /100 | #199 | Poor 5.7% |
| Icelanders | 14.6 /100 | #200 | Poor 5.7% |
| Basques | 13.7 /100 | #201 | Poor 5.7% |
Demographics Similar to Immigrants from Bulgaria by Disability Age 5 to 17
In terms of disability age 5 to 17, the demographic groups most similar to Immigrants from Bulgaria are Romanian (5.4%, a difference of 0.020%), Immigrants from Venezuela (5.4%, a difference of 0.11%), New Zealander (5.4%, a difference of 0.23%), Latvian (5.4%, a difference of 0.23%), and Arab (5.4%, a difference of 0.23%).
| Demographics | Rating | Rank | Disability Age 5 to 17 |
| Immigrants | Ethiopia | 95.5 /100 | #123 | Exceptional 5.4% |
| Crow | 95.0 /100 | #124 | Exceptional 5.4% |
| Immigrants | Chile | 95.0 /100 | #125 | Exceptional 5.4% |
| New Zealanders | 95.0 /100 | #126 | Exceptional 5.4% |
| Latvians | 95.0 /100 | #127 | Exceptional 5.4% |
| Immigrants | Venezuela | 94.5 /100 | #128 | Exceptional 5.4% |
| Romanians | 94.1 /100 | #129 | Exceptional 5.4% |
| Immigrants | Bulgaria | 94.0 /100 | #130 | Exceptional 5.4% |
| Arabs | 92.9 /100 | #131 | Exceptional 5.4% |
| Immigrants | Colombia | 92.9 /100 | #132 | Exceptional 5.4% |
| Venezuelans | 92.7 /100 | #133 | Exceptional 5.4% |
| Yuman | 92.3 /100 | #134 | Exceptional 5.4% |
| Immigrants | Belize | 91.7 /100 | #135 | Exceptional 5.4% |
| Immigrants | Denmark | 91.4 /100 | #136 | Exceptional 5.4% |
| Navajo | 90.9 /100 | #137 | Exceptional 5.4% |