Croatian Married-couple Households
COMPARE
Croatian
Select to Compare
Married-couple Households
Croatian Married-couple Households
48.5%
MARRIED-COUPLE HOUSEHOLDS
99.1/ 100
METRIC RATING
60th/ 347
METRIC RANK
Croatian Married-couple Households Correlation Chart
The statistical analysis conducted on geographies consisting of 375,518,925 people shows no correlation between the proportion of Croatians and percentage of married-couple family households in the United States with a correlation coefficient (R) of 0.000 and weighted average of 48.5%. On average, for every 1% (one percent) increase in Croatians within a typical geography, there is an increase of 0.00018% in percentage of married-couple family households.
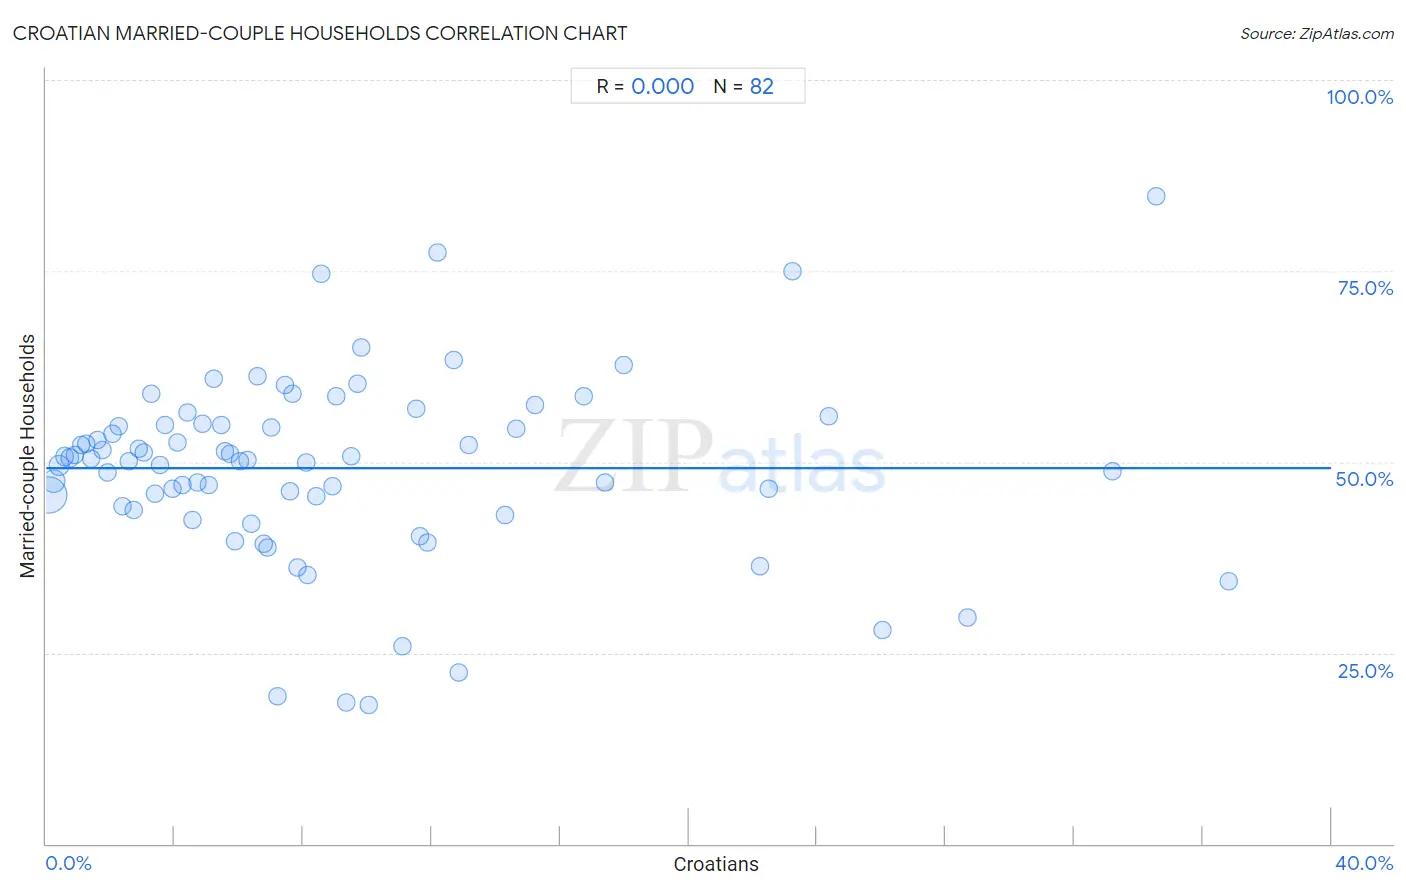
It is essential to understand that the correlation between the percentage of Croatians and percentage of married-couple family households does not imply a direct cause-and-effect relationship. It remains uncertain whether the presence of Croatians influences an upward or downward trend in the level of percentage of married-couple family households within an area, or if Croatians simply ended up residing in those areas with higher or lower levels of percentage of married-couple family households due to other factors.
Demographics Similar to Croatians by Married-couple Households
In terms of married-couple households, the demographic groups most similar to Croatians are Bulgarian (48.5%, a difference of 0.050%), Luxembourger (48.5%, a difference of 0.060%), Polish (48.5%, a difference of 0.080%), Immigrants from Indonesia (48.5%, a difference of 0.080%), and Czechoslovakian (48.5%, a difference of 0.080%).
| Demographics | Rating | Rank | Married-couple Households |
| Whites/Caucasians | 99.3 /100 | #53 | Exceptional 48.6% |
| Immigrants from Lithuania | 99.3 /100 | #54 | Exceptional 48.6% |
| Austrians | 99.3 /100 | #55 | Exceptional 48.6% |
| Immigrants from Northern Europe | 99.3 /100 | #56 | Exceptional 48.6% |
| Poles | 99.2 /100 | #57 | Exceptional 48.5% |
| Immigrants from Indonesia | 99.2 /100 | #58 | Exceptional 48.5% |
| Czechoslovakians | 99.2 /100 | #59 | Exceptional 48.5% |
| Croatians | 99.1 /100 | #60 | Exceptional 48.5% |
| Bulgarians | 99.1 /100 | #61 | Exceptional 48.5% |
| Luxembourgers | 99.1 /100 | #62 | Exceptional 48.5% |
| Basques | 99.0 /100 | #63 | Exceptional 48.4% |
| Northern Europeans | 99.0 /100 | #64 | Exceptional 48.4% |
| Immigrants from Canada | 99.0 /100 | #65 | Exceptional 48.4% |
| Jordanians | 98.9 /100 | #66 | Exceptional 48.4% |
| Romanians | 98.9 /100 | #67 | Exceptional 48.4% |
Croatian Married-couple Households Correlation Summary
| Measurement | Croatian Data | Married-couple Households Data |
| Minimum | 0.073% | 18.1% |
| Maximum | 36.8% | 84.8% |
| Range | 36.7% | 66.7% |
| Mean | 9.0% | 49.2% |
| Median | 6.8% | 50.4% |
| Interquartile 25% (IQ1) | 3.4% | 44.2% |
| Interquartile 75% (IQ3) | 11.6% | 54.8% |
| Interquartile Range (IQR) | 8.2% | 10.6% |
| Standard Deviation (Sample) | 8.1% | 12.1% |
| Standard Deviation (Population) | 8.1% | 12.0% |
Correlation Details
| Croatian Percentile | Sample Size | Married-couple Households |
[ 0.0% - 0.5% ] 0.073% | 256,135,687 | 45.6% |
[ 0.0% - 0.5% ] 0.23% | 70,233,618 | 47.5% |
[ 0.0% - 0.5% ] 0.40% | 22,900,049 | 49.5% |
[ 0.5% - 1.0% ] 0.57% | 9,822,561 | 50.7% |
[ 0.5% - 1.0% ] 0.74% | 5,811,649 | 50.5% |
[ 0.5% - 1.0% ] 0.91% | 3,177,860 | 50.9% |
[ 1.0% - 1.5% ] 1.08% | 1,820,723 | 52.2% |
[ 1.0% - 1.5% ] 1.24% | 1,035,462 | 52.4% |
[ 1.0% - 1.5% ] 1.40% | 662,514 | 50.5% |
[ 1.5% - 2.0% ] 1.58% | 548,168 | 52.9% |
[ 1.5% - 2.0% ] 1.75% | 639,836 | 51.5% |
[ 1.5% - 2.0% ] 1.91% | 516,684 | 48.6% |
[ 2.0% - 2.5% ] 2.07% | 363,319 | 53.6% |
[ 2.0% - 2.5% ] 2.24% | 373,236 | 54.7% |
[ 2.0% - 2.5% ] 2.39% | 334,179 | 44.2% |
[ 2.5% - 3.0% ] 2.58% | 167,462 | 50.1% |
[ 2.5% - 3.0% ] 2.71% | 114,113 | 43.6% |
[ 2.5% - 3.0% ] 2.89% | 169,550 | 51.7% |
[ 3.0% - 3.5% ] 3.03% | 127,954 | 51.2% |
[ 3.0% - 3.5% ] 3.25% | 32,107 | 59.0% |
[ 3.0% - 3.5% ] 3.39% | 68,210 | 45.8% |
[ 3.5% - 4.0% ] 3.56% | 41,701 | 49.6% |
[ 3.5% - 4.0% ] 3.71% | 83,770 | 54.8% |
[ 3.5% - 4.0% ] 3.92% | 20,962 | 46.5% |
[ 4.0% - 4.5% ] 4.08% | 31,818 | 52.5% |
[ 4.0% - 4.5% ] 4.23% | 115,319 | 47.0% |
[ 4.0% - 4.5% ] 4.41% | 9,580 | 56.4% |
[ 4.5% - 5.0% ] 4.54% | 16,263 | 42.4% |
[ 4.5% - 5.0% ] 4.71% | 10,344 | 47.2% |
[ 4.5% - 5.0% ] 4.88% | 8,704 | 55.0% |
[ 5.0% - 5.5% ] 5.07% | 4,797 | 47.0% |
[ 5.0% - 5.5% ] 5.19% | 14,553 | 60.9% |
[ 5.0% - 5.5% ] 5.44% | 2,943 | 54.8% |
[ 5.5% - 6.0% ] 5.58% | 29,415 | 51.3% |
[ 5.5% - 6.0% ] 5.73% | 7,942 | 51.1% |
[ 5.5% - 6.0% ] 5.86% | 11,015 | 39.7% |
[ 6.0% - 6.5% ] 6.03% | 5,767 | 50.0% |
[ 6.0% - 6.5% ] 6.26% | 3,307 | 50.3% |
[ 6.0% - 6.5% ] 6.39% | 3,223 | 41.9% |
[ 6.5% - 7.0% ] 6.57% | 731 | 61.1% |
[ 6.5% - 7.0% ] 6.76% | 281 | 39.3% |
[ 6.5% - 7.0% ] 6.89% | 5,226 | 38.7% |
[ 7.0% - 7.5% ] 7.00% | 9,094 | 54.6% |
[ 7.0% - 7.5% ] 7.21% | 652 | 19.4% |
[ 7.0% - 7.5% ] 7.43% | 2,019 | 60.1% |
[ 7.5% - 8.0% ] 7.57% | 1,823 | 46.1% |
[ 7.5% - 8.0% ] 7.68% | 612 | 59.0% |
[ 7.5% - 8.0% ] 7.83% | 1,251 | 36.2% |
[ 8.0% - 8.5% ] 8.10% | 1,717 | 49.9% |
[ 8.0% - 8.5% ] 8.15% | 270 | 35.2% |
[ 8.0% - 8.5% ] 8.42% | 1,164 | 45.5% |
[ 8.5% - 9.0% ] 8.56% | 397 | 74.6% |
[ 8.5% - 9.0% ] 8.89% | 731 | 46.8% |
[ 9.0% - 9.5% ] 9.04% | 365 | 58.6% |
[ 9.0% - 9.5% ] 9.34% | 739 | 18.4% |
[ 9.0% - 9.5% ] 9.50% | 1,674 | 50.8% |
[ 9.5% - 10.0% ] 9.68% | 589 | 60.3% |
[ 9.5% - 10.0% ] 9.82% | 1,181 | 65.1% |
[ 10.0% - 10.5% ] 10.02% | 409 | 18.1% |
[ 11.0% - 11.5% ] 11.07% | 614 | 25.9% |
[ 11.5% - 12.0% ] 11.50% | 339 | 56.9% |
[ 11.5% - 12.0% ] 11.63% | 946 | 40.3% |
[ 11.5% - 12.0% ] 11.87% | 396 | 39.5% |
[ 12.0% - 12.5% ] 12.16% | 148 | 77.4% |
[ 12.5% - 13.0% ] 12.67% | 1,318 | 63.3% |
[ 12.5% - 13.0% ] 12.85% | 358 | 22.3% |
[ 13.0% - 13.5% ] 13.16% | 38 | 52.2% |
[ 14.0% - 14.5% ] 14.29% | 196 | 43.1% |
[ 14.5% - 15.0% ] 14.62% | 253 | 54.3% |
[ 15.0% - 15.5% ] 15.22% | 427 | 57.4% |
[ 16.5% - 17.0% ] 16.74% | 1,111 | 58.6% |
[ 17.0% - 17.5% ] 17.41% | 1,252 | 47.2% |
[ 17.5% - 18.0% ] 17.96% | 334 | 62.6% |
[ 22.0% - 22.5% ] 22.22% | 18 | 36.4% |
[ 22.0% - 22.5% ] 22.49% | 369 | 46.4% |
[ 23.0% - 23.5% ] 23.25% | 985 | 74.9% |
[ 24.0% - 24.5% ] 24.36% | 312 | 56.0% |
[ 26.0% - 26.5% ] 26.04% | 672 | 28.0% |
[ 28.5% - 29.0% ] 28.69% | 610 | 29.7% |
[ 33.0% - 33.5% ] 33.19% | 229 | 48.7% |
[ 34.5% - 35.0% ] 34.57% | 567 | 84.8% |
[ 36.5% - 37.0% ] 36.81% | 144 | 34.4% |