Croatian Unemployment Among Women with Children Ages 6 to 17 years

COMPARE

Croatian
Race
Ancestry
AfghanAfricanAlaska NativeAlaskan AthabascanAlbanianAleutAlsatianAmericanApacheArabArapahoArgentineanArmenianAssyrian/Chaldean/SyriacAustralianAustrianBahamianBangladeshiBarbadianBasqueBelgianBelizeanBermudanBhutaneseBlackfeetBolivianBrazilianBritishBritish West IndianBulgarianBurmeseCajunCambodianCanadianCape VerdeanCarpatho RusynCelticCentral AmericanCentral American IndianCherokeeCheyenneChickasawChileanChineseChippewaChoctawColombianColvilleComancheCosta RicanCreeCreekCroatianCrowCubanCypriotCzechCzechoslovakianDanishDelawareDominicanDutchDutch West IndianEastern EuropeanEcuadorianEgyptianEnglishEstonianEthiopianEuropeanFijianFilipinoFinnishFrenchFrench American IndianFrench CanadianGermanGerman RussianGhanaianGreekGuamanian/ChamorroGuatemalanGuyaneseHaitianHmongHonduranHopiHoumaHungarianIcelanderIndian (Asian)IndonesianInupiatIranianIraqiIrishIroquoisIsraeliItalianJamaicanJapaneseJordanianKenyanKiowaKoreanLaotianLatvianLebaneseLiberianLithuanianLumbeeLuxembourgerMacedonianMalaysianMalteseMarshalleseMenomineeMexicanMexican American IndianMongolianMoroccanNative HawaiianNavajoNepaleseNew ZealanderNicaraguanNigerianNorthern EuropeanNorwegianOkinawanOsageOttawaPaiutePakistaniPalestinianPanamanianParaguayanPennsylvania GermanPeruvianPimaPolishPortuguesePotawatomiPuebloPuerto RicanPuget Sound SalishRomanianRussianSalvadoranSamoanScandinavianScotch-IrishScottishSeminoleSenegaleseSerbianShoshoneSierra LeoneanSiouxSlavicSlovakSloveneSomaliSouth AfricanSouth AmericanSouth American IndianSoviet UnionSpaniardSpanishSpanish AmericanSpanish American IndianSri LankanSubsaharan AfricanSudaneseSwedishSwissSyrianTaiwaneseThaiTlingit-HaidaTohono O'OdhamTonganTrinidadian and TobagonianTsimshianTurkishU.S. Virgin IslanderUgandanUkrainianUruguayanUteVenezuelanVietnameseWelshWest IndianYakamaYaquiYugoslavianYumanYup'ikZimbabwean
Immigration
NonimmigrantsImmigrantsAfghanistanAfricaAlbaniaArgentinaArmeniaAsiaAustraliaAustriaBahamasBangladeshBarbadosBelarusBelgiumBelizeBoliviaBosnia and HerzegovinaBrazilBulgariaBurma/MyanmarCabo VerdeCambodiaCameroonCanadaCaribbeanCentral AmericaChileChinaColombiaCongoCosta RicaCroatiaCubaCzechoslovakiaDenmarkDominicaDominican RepublicEastern AfricaEastern AsiaEastern EuropeEcuadorEgyptEl SalvadorEnglandEritreaEthiopiaEuropeFijiFranceGermanyGhanaGreeceGrenadaGuatemalaGuyanaHaitiHondurasHong KongHungaryIndiaIndonesiaIranIraqIrelandIsraelItalyJamaicaJapanJordanKazakhstanKenyaKoreaKuwaitLaosLatin AmericaLatviaLebanonLiberiaLithuaniaMalaysiaMexicoMicronesiaMiddle AfricaMoldovaMoroccoNepalNetherlandsNicaraguaNigeriaNorth AmericaNorth MacedoniaNorthern AfricaNorthern EuropeNorwayOceaniaPakistanPanamaPeruPhilippinesPolandPortugalRomaniaRussiaSaudi ArabiaScotlandSenegalSerbiaSierra LeoneSingaporeSomaliaSouth AfricaSouth AmericaSouth Central AsiaSouth Eastern AsiaSouthern EuropeSpainSri LankaSt. Vincent and the GrenadinesSudanSwedenSwitzerlandSyriaTaiwanThailandTrinidad and TobagoTurkeyUgandaUkraineUruguayUzbekistanVenezuelaVietnamWest IndiesWestern AfricaWestern AsiaWestern EuropeYemenZaireZimbabweAzores
Select to Compare
Race
Ancestry
AfghanAfricanAlaska NativeAlaskan AthabascanAlbanianAleutAlsatianAmericanApacheArabArapahoArgentineanArmenianAssyrian/Chaldean/SyriacAustralianAustrianBahamianBangladeshiBarbadianBasqueBelgianBelizeanBermudanBhutaneseBlackfeetBolivianBrazilianBritishBritish West IndianBulgarianBurmeseCajunCambodianCanadianCape VerdeanCarpatho RusynCelticCentral AmericanCentral American IndianCherokeeCheyenneChickasawChileanChineseChippewaChoctawColombianColvilleComancheCosta RicanCreeCreekCrowCubanCypriotCzechCzechoslovakianDanishDelawareDominicanDutchDutch West IndianEastern EuropeanEcuadorianEgyptianEnglishEstonianEthiopianEuropeanFijianFilipinoFinnishFrenchFrench American IndianFrench CanadianGermanGerman RussianGhanaianGreekGuamanian/ChamorroGuatemalanGuyaneseHaitianHmongHonduranHopiHoumaHungarianIcelanderIndian (Asian)IndonesianInupiatIranianIraqiIrishIroquoisIsraeliItalianJamaicanJapaneseJordanianKenyanKiowaKoreanLaotianLatvianLebaneseLiberianLithuanianLumbeeLuxembourgerMacedonianMalaysianMalteseMarshalleseMenomineeMexicanMexican American IndianMongolianMoroccanNative HawaiianNavajoNepaleseNew ZealanderNicaraguanNigerianNorthern EuropeanNorwegianOkinawanOsageOttawaPaiutePakistaniPalestinianPanamanianParaguayanPennsylvania GermanPeruvianPimaPolishPortuguesePotawatomiPuebloPuerto RicanPuget Sound SalishRomanianRussianSalvadoranSamoanScandinavianScotch-IrishScottishSeminoleSenegaleseSerbianShoshoneSierra LeoneanSiouxSlavicSlovakSloveneSomaliSouth AfricanSouth AmericanSouth American IndianSoviet UnionSpaniardSpanishSpanish AmericanSpanish American IndianSri LankanSubsaharan AfricanSudaneseSwedishSwissSyrianTaiwaneseThaiTlingit-HaidaTohono O'OdhamTonganTrinidadian and TobagonianTsimshianTurkishU.S. Virgin IslanderUgandanUkrainianUruguayanUteVenezuelanVietnameseWelshWest IndianYakamaYaquiYugoslavianYumanYup'ikZimbabwean
Immigration
NonimmigrantsImmigrantsAfghanistanAfricaAlbaniaArgentinaArmeniaAsiaAustraliaAustriaBahamasBangladeshBarbadosBelarusBelgiumBelizeBoliviaBosnia and HerzegovinaBrazilBulgariaBurma/MyanmarCabo VerdeCambodiaCameroonCanadaCaribbeanCentral AmericaChileChinaColombiaCongoCosta RicaCroatiaCubaCzechoslovakiaDenmarkDominicaDominican RepublicEastern AfricaEastern AsiaEastern EuropeEcuadorEgyptEl SalvadorEnglandEritreaEthiopiaEuropeFijiFranceGermanyGhanaGreeceGrenadaGuatemalaGuyanaHaitiHondurasHong KongHungaryIndiaIndonesiaIranIraqIrelandIsraelItalyJamaicaJapanJordanKazakhstanKenyaKoreaKuwaitLaosLatin AmericaLatviaLebanonLiberiaLithuaniaMalaysiaMexicoMicronesiaMiddle AfricaMoldovaMoroccoNepalNetherlandsNicaraguaNigeriaNorth AmericaNorth MacedoniaNorthern AfricaNorthern EuropeNorwayOceaniaPakistanPanamaPeruPhilippinesPolandPortugalRomaniaRussiaSaudi ArabiaScotlandSenegalSerbiaSierra LeoneSingaporeSomaliaSouth AfricaSouth AmericaSouth Central AsiaSouth Eastern AsiaSouthern EuropeSpainSri LankaSt. Vincent and the GrenadinesSudanSwedenSwitzerlandSyriaTaiwanThailandTrinidad and TobagoTurkeyUgandaUkraineUruguayUzbekistanVenezuelaVietnamWest IndiesWestern AfricaWestern AsiaWestern EuropeYemenZaireZimbabweAzores
Unemployment Among Women with Children Ages 6 to 17 years
Income
Poverty
Unemployment
Labor Participation
Family Structure
Vehicle Availability
Education Level
Disability

Croatian Unemployment Among Women with Children Ages 6 to 17 years
Good

8.8%
UNEMPLOYMENT | WOMEN W/ CHILDREN 6 TO 17
76.0/ 100
METRIC RATING
149th/ 347
METRIC RANK

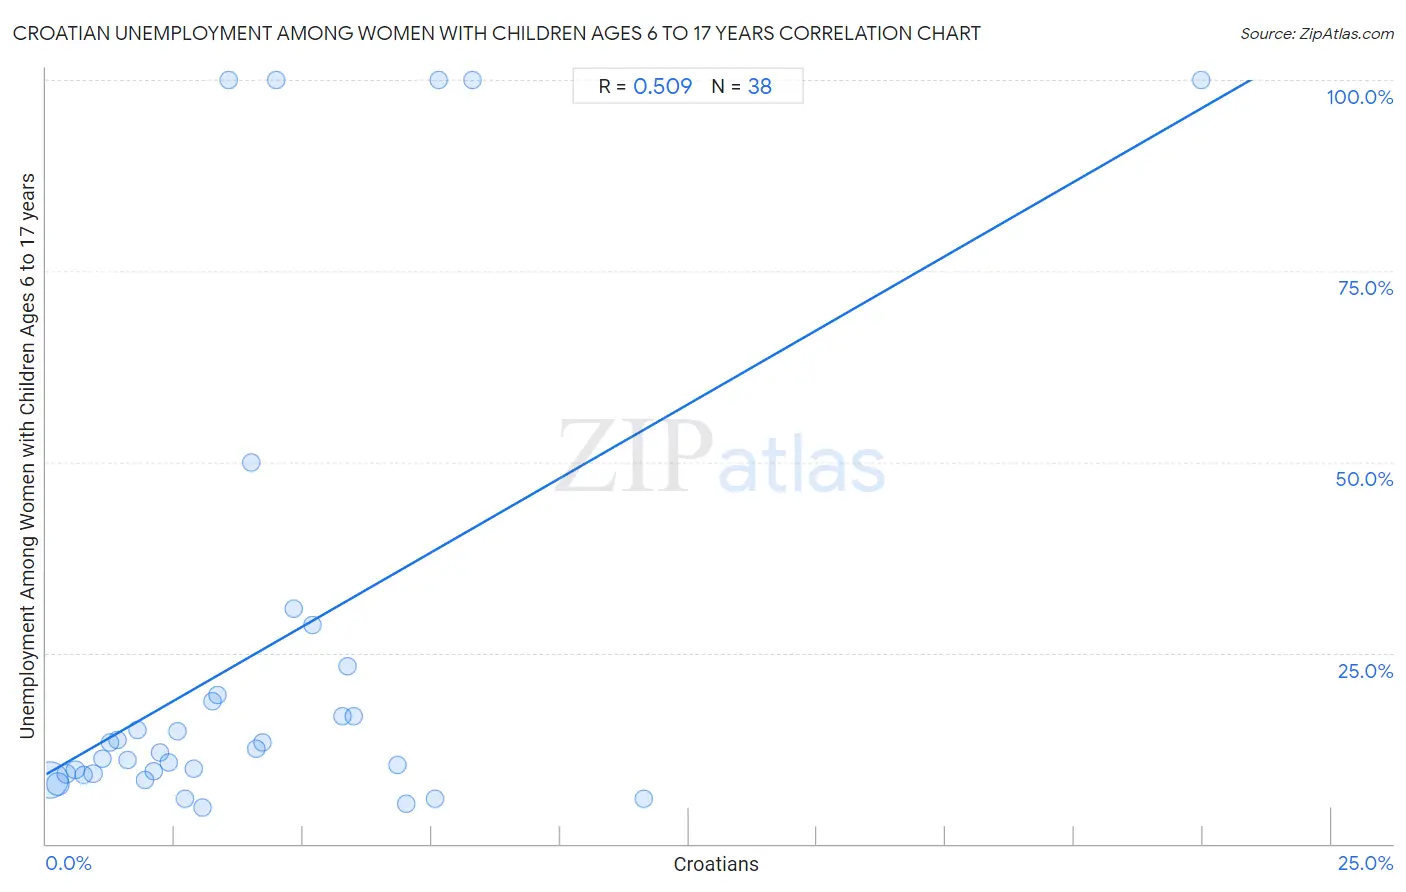
Croatian Unemployment Among Women with Children Ages 6 to 17 years Correlation Chart

The statistical analysis conducted on geographies consisting of 264,265,692 people shows a substantial positive correlation between the proportion of Croatians and unemployment rate among women with children between the ages 6 and 17 in the United States with a correlation coefficient (R) of 0.509 and weighted average of 8.8%. On average, for every 1% (one percent) increase in Croatians within a typical geography, there is an increase of 3.9% in unemployment rate among women with children between the ages 6 and 17.
Croatian Unemployment Among Women with Children Ages 6 to 17 years
It is essential to understand that the correlation between the percentage of Croatians and unemployment rate among women with children between the ages 6 and 17 does not imply a direct cause-and-effect relationship. It remains uncertain whether the presence of Croatians influences an upward or downward trend in the level of unemployment rate among women with children between the ages 6 and 17 within an area, or if Croatians simply ended up residing in those areas with higher or lower levels of unemployment rate among women with children between the ages 6 and 17 due to other factors.

Demographics Similar to Croatians by Unemployment Among Women with Children Ages 6 to 17 years

In terms of unemployment among women with children ages 6 to 17 years, the demographic groups most similar to Croatians are Greek (8.9%, a difference of 0.050%), Costa Rican (8.8%, a difference of 0.060%), Immigrants from Eastern Africa (8.9%, a difference of 0.090%), Immigrants from Northern Europe (8.9%, a difference of 0.090%), and Immigrants from Europe (8.9%, a difference of 0.16%).
DemographicsRating | RankUnemployment Among Women with Children Ages 6 to 17 years
Immigrants from Austria
87.5
/100
|
#142
Excellent
8.8%
Immigrants from Kenya
86.1
/100
|
#143
Excellent
8.8%
Russians
85.8
/100
|
#144
Excellent
8.8%
Kenyans
85.6
/100
|
#145
Excellent
8.8%
Chileans
80.8
/100
|
#146
Excellent
8.8%
Immigrants from Bangladesh
79.4
/100
|
#147
Good
8.8%
Costa Ricans
77.0
/100
|
#148
Good
8.8%
Croatians
76.0
/100
|
#149
Good
8.8%
Greeks
75.2
/100
|
#150
Good
8.9%
Immigrants from Eastern Africa
74.6
/100
|
#151
Good
8.9%
Immigrants from Northern Europe
74.6
/100
|
#152
Good
8.9%
Immigrants from Europe
73.4
/100
|
#153
Good
8.9%
Vietnamese
72.1
/100
|
#154
Good
8.9%
Immigrants from Greece
71.8
/100
|
#155
Good
8.9%
Osage
65.9
/100
|
#156
Good
8.9%

Croatian Unemployment Among Women with Children Ages 6 to 17 years Correlation Summary

MeasurementCroatian DataUnemployment Among Women with Children Ages 6 to 17 years Data
Minimum0.071%4.8%
Maximum22.5%100.0%
Range22.4%95.2%
Mean4.1%25.0%
Median3.1%12.2%
Interquartile 25% (IQ1)1.6%9.1%
Interquartile 75% (IQ3)5.8%19.5%
Interquartile Range (IQR)4.2%10.3%
Standard Deviation (Sample)4.0%30.7%
Standard Deviation (Population)4.0%30.3%

Correlation Details

Croatian PercentileSample SizeUnemployment Among Women with Children Ages 6 to 17 years
[
0.0%
-
0.5%
]
0.071%
196,030,8128.4%
[
0.0%
-
0.5%
]
0.23%
45,111,4397.8%
[
0.0%
-
0.5%
]
0.39%
12,042,1409.1%
[
0.5%
-
1.0%
]
0.57%
4,208,5719.6%
[
0.5%
-
1.0%
]
0.74%
2,638,8689.0%
[
0.5%
-
1.0%
]
0.91%
1,430,6239.2%
[
1.0%
-
1.5%
]
1.08%
885,70411.1%
[
1.0%
-
1.5%
]
1.23%
332,35213.2%
[
1.0%
-
1.5%
]
1.39%
229,45213.6%
[
1.5%
-
2.0%
]
1.58%
106,88011.0%
[
1.5%
-
2.0%
]
1.78%
179,36614.8%
[
1.5%
-
2.0%
]
1.92%
284,9288.3%
[
2.0%
-
2.5%
]
2.08%
228,1359.4%
[
2.0%
-
2.5%
]
2.21%
68,45612.0%
[
2.0%
-
2.5%
]
2.38%
150,17910.6%
[
2.5%
-
3.0%
]
2.56%
80,62514.7%
[
2.5%
-
3.0%
]
2.70%
25,1865.9%
[
2.5%
-
3.0%
]
2.87%
34,9189.9%
[
3.0%
-
3.5%
]
3.03%
69,6074.8%
[
3.0%
-
3.5%
]
3.23%
4,46518.7%
[
3.0%
-
3.5%
]
3.33%
9,17819.5%
[
3.5%
-
4.0%
]
3.56%
618100.0%
[
3.5%
-
4.0%
]
3.98%
55350.0%
[
4.0%
-
4.5%
]
4.08%
26,68012.5%
[
4.0%
-
4.5%
]
4.22%
54,00013.3%
[
4.0%
-
4.5%
]
4.48%
491100.0%
[
4.5%
-
5.0%
]
4.82%
1,39030.8%
[
5.0%
-
5.5%
]
5.19%
10,78128.7%
[
5.5%
-
6.0%
]
5.76%
24316.7%
[
5.5%
-
6.0%
]
5.87%
6,26623.3%
[
5.5%
-
6.0%
]
5.98%
23416.7%
[
6.5%
-
7.0%
]
6.83%
1,62510.3%
[
6.5%
-
7.0%
]
7.00%
7,7595.3%
[
7.5%
-
8.0%
]
7.57%
1,4665.9%
[
7.5%
-
8.0%
]
7.64%
314100.0%
[
8.0%
-
8.5%
]
8.30%
289100.0%
[
11.5%
-
12.0%
]
11.62%
9125.9%
[
22.0%
-
22.5%
]
22.46%
187100.0%