Croatian Female Disability
COMPARE
Croatian
Select to Compare
Female Disability
Croatian Female Disability
12.4%
DISABILITY | FEMALES
20.2/ 100
METRIC RATING
207th/ 347
METRIC RANK
Croatian Female Disability Correlation Chart
The statistical analysis conducted on geographies consisting of 375,696,225 people shows a substantial positive correlation between the proportion of Croatians and percentage of females with a disability in the United States with a correlation coefficient (R) of 0.582 and weighted average of 12.4%. On average, for every 1% (one percent) increase in Croatians within a typical geography, there is an increase of 0.91% in percentage of females with a disability.
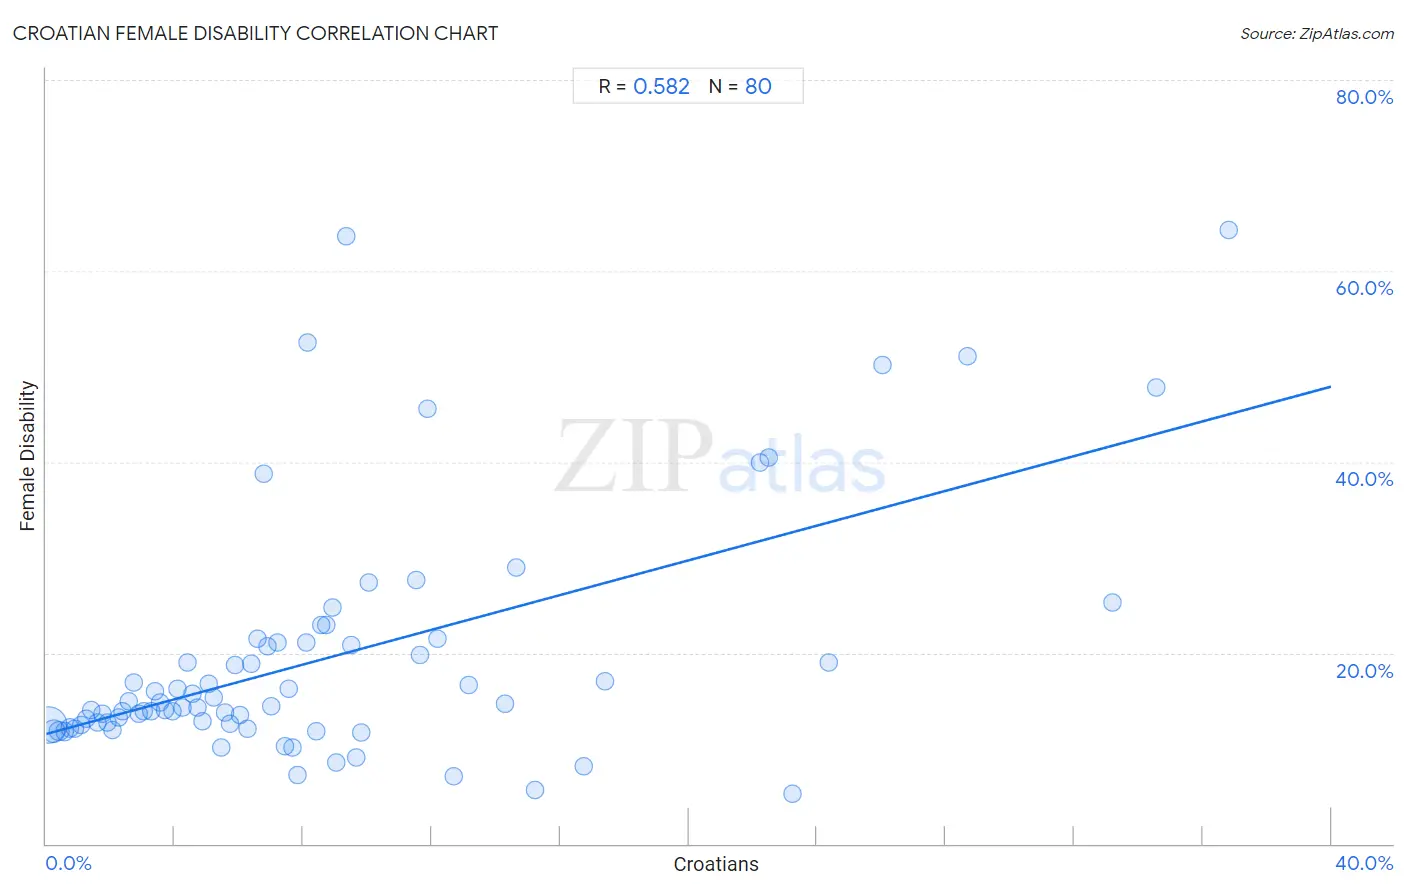
It is essential to understand that the correlation between the percentage of Croatians and percentage of females with a disability does not imply a direct cause-and-effect relationship. It remains uncertain whether the presence of Croatians influences an upward or downward trend in the level of percentage of females with a disability within an area, or if Croatians simply ended up residing in those areas with higher or lower levels of percentage of females with a disability due to other factors.
Demographics Similar to Croatians by Female Disability
In terms of female disability, the demographic groups most similar to Croatians are Immigrants from Cuba (12.4%, a difference of 0.0%), Immigrants from Grenada (12.4%, a difference of 0.020%), Immigrants from Zaire (12.3%, a difference of 0.040%), Immigrants from Barbados (12.3%, a difference of 0.050%), and Somali (12.3%, a difference of 0.080%).
| Demographics | Rating | Rank | Female Disability |
| Trinidadians and Tobagonians | 22.4 /100 | #200 | Fair 12.3% |
| Chinese | 22.1 /100 | #201 | Fair 12.3% |
| Somalis | 21.5 /100 | #202 | Fair 12.3% |
| Immigrants from Barbados | 21.1 /100 | #203 | Fair 12.3% |
| Immigrants from Zaire | 20.9 /100 | #204 | Fair 12.3% |
| Immigrants from Grenada | 20.5 /100 | #205 | Fair 12.4% |
| Immigrants from Cuba | 20.2 /100 | #206 | Fair 12.4% |
| Croatians | 20.2 /100 | #207 | Fair 12.4% |
| Basques | 17.5 /100 | #208 | Poor 12.4% |
| Mexicans | 15.7 /100 | #209 | Poor 12.4% |
| Swiss | 14.9 /100 | #210 | Poor 12.4% |
| Immigrants from Bosnia and Herzegovina | 14.8 /100 | #211 | Poor 12.4% |
| Ute | 14.7 /100 | #212 | Poor 12.4% |
| Immigrants from Thailand | 14.5 /100 | #213 | Poor 12.4% |
| Panamanians | 13.5 /100 | #214 | Poor 12.4% |
Croatian Female Disability Correlation Summary
| Measurement | Croatian Data | Female Disability Data |
| Minimum | 0.073% | 5.2% |
| Maximum | 36.8% | 64.3% |
| Range | 36.7% | 59.1% |
| Mean | 8.8% | 19.5% |
| Median | 6.7% | 14.5% |
| Interquartile 25% (IQ1) | 3.3% | 12.4% |
| Interquartile 75% (IQ3) | 10.8% | 21.1% |
| Interquartile Range (IQR) | 7.4% | 8.7% |
| Standard Deviation (Sample) | 8.1% | 12.7% |
| Standard Deviation (Population) | 8.1% | 12.6% |
Correlation Details
| Croatian Percentile | Sample Size | Female Disability |
[ 0.0% - 0.5% ] 0.073% | 256,197,601 | 12.4% |
[ 0.0% - 0.5% ] 0.23% | 70,285,906 | 11.7% |
[ 0.0% - 0.5% ] 0.40% | 22,927,100 | 11.8% |
[ 0.5% - 1.0% ] 0.57% | 9,837,102 | 11.7% |
[ 0.5% - 1.0% ] 0.74% | 5,825,404 | 12.1% |
[ 0.5% - 1.0% ] 0.91% | 3,180,989 | 12.0% |
[ 1.0% - 1.5% ] 1.08% | 1,826,070 | 12.4% |
[ 1.0% - 1.5% ] 1.24% | 1,037,545 | 13.1% |
[ 1.0% - 1.5% ] 1.40% | 662,514 | 14.1% |
[ 1.5% - 2.0% ] 1.58% | 549,185 | 12.7% |
[ 1.5% - 2.0% ] 1.75% | 639,836 | 13.6% |
[ 1.5% - 2.0% ] 1.91% | 516,684 | 12.7% |
[ 2.0% - 2.5% ] 2.07% | 364,273 | 11.9% |
[ 2.0% - 2.5% ] 2.24% | 373,099 | 13.3% |
[ 2.0% - 2.5% ] 2.39% | 334,097 | 13.8% |
[ 2.5% - 3.0% ] 2.58% | 168,099 | 14.9% |
[ 2.5% - 3.0% ] 2.71% | 114,113 | 16.9% |
[ 2.5% - 3.0% ] 2.89% | 168,996 | 13.6% |
[ 3.0% - 3.5% ] 3.03% | 127,954 | 13.9% |
[ 3.0% - 3.5% ] 3.26% | 31,949 | 13.8% |
[ 3.0% - 3.5% ] 3.39% | 67,822 | 16.0% |
[ 3.5% - 4.0% ] 3.56% | 41,701 | 14.8% |
[ 3.5% - 4.0% ] 3.71% | 83,505 | 14.0% |
[ 3.5% - 4.0% ] 3.92% | 20,625 | 13.9% |
[ 4.0% - 4.5% ] 4.08% | 31,818 | 16.2% |
[ 4.0% - 4.5% ] 4.23% | 115,319 | 14.3% |
[ 4.0% - 4.5% ] 4.41% | 9,580 | 19.0% |
[ 4.5% - 5.0% ] 4.54% | 16,263 | 15.7% |
[ 4.5% - 5.0% ] 4.71% | 10,344 | 14.3% |
[ 4.5% - 5.0% ] 4.88% | 8,704 | 12.8% |
[ 5.0% - 5.5% ] 5.07% | 3,849 | 16.7% |
[ 5.0% - 5.5% ] 5.19% | 14,553 | 15.4% |
[ 5.0% - 5.5% ] 5.44% | 2,943 | 10.1% |
[ 5.5% - 6.0% ] 5.58% | 29,415 | 13.8% |
[ 5.5% - 6.0% ] 5.73% | 7,942 | 12.6% |
[ 5.5% - 6.0% ] 5.86% | 10,293 | 18.7% |
[ 6.0% - 6.5% ] 6.03% | 5,767 | 13.4% |
[ 6.0% - 6.5% ] 6.26% | 3,307 | 12.1% |
[ 6.0% - 6.5% ] 6.39% | 3,223 | 18.8% |
[ 6.5% - 7.0% ] 6.57% | 731 | 21.5% |
[ 6.5% - 7.0% ] 6.76% | 281 | 38.7% |
[ 6.5% - 7.0% ] 6.89% | 5,154 | 20.7% |
[ 7.0% - 7.5% ] 7.00% | 9,094 | 14.4% |
[ 7.0% - 7.5% ] 7.21% | 652 | 21.1% |
[ 7.0% - 7.5% ] 7.43% | 2,019 | 10.2% |
[ 7.5% - 8.0% ] 7.57% | 1,731 | 16.3% |
[ 7.5% - 8.0% ] 7.68% | 612 | 10.1% |
[ 7.5% - 8.0% ] 7.83% | 1,251 | 7.2% |
[ 8.0% - 8.5% ] 8.10% | 1,717 | 21.1% |
[ 8.0% - 8.5% ] 8.15% | 270 | 52.6% |
[ 8.0% - 8.5% ] 8.41% | 904 | 11.8% |
[ 8.5% - 9.0% ] 8.56% | 397 | 22.9% |
[ 8.5% - 9.0% ] 8.72% | 447 | 22.9% |
[ 8.5% - 9.0% ] 8.89% | 731 | 24.8% |
[ 9.0% - 9.5% ] 9.03% | 299 | 8.6% |
[ 9.0% - 9.5% ] 9.35% | 492 | 63.7% |
[ 9.0% - 9.5% ] 9.50% | 1,674 | 20.8% |
[ 9.5% - 10.0% ] 9.64% | 394 | 9.0% |
[ 9.5% - 10.0% ] 9.82% | 1,181 | 11.6% |
[ 10.0% - 10.5% ] 10.02% | 409 | 27.3% |
[ 11.5% - 12.0% ] 11.50% | 339 | 27.7% |
[ 11.5% - 12.0% ] 11.62% | 912 | 19.8% |
[ 11.5% - 12.0% ] 11.87% | 396 | 45.6% |
[ 12.0% - 12.5% ] 12.16% | 148 | 21.4% |
[ 12.5% - 13.0% ] 12.67% | 1,318 | 7.1% |
[ 13.0% - 13.5% ] 13.16% | 38 | 16.7% |
[ 14.0% - 14.5% ] 14.29% | 196 | 14.7% |
[ 14.5% - 15.0% ] 14.62% | 253 | 28.9% |
[ 15.0% - 15.5% ] 15.22% | 427 | 5.7% |
[ 16.5% - 17.0% ] 16.74% | 1,111 | 8.2% |
[ 17.0% - 17.5% ] 17.41% | 1,252 | 17.1% |
[ 22.0% - 22.5% ] 22.22% | 18 | 40.0% |
[ 22.0% - 22.5% ] 22.49% | 369 | 40.4% |
[ 23.0% - 23.5% ] 23.25% | 985 | 5.2% |
[ 24.0% - 24.5% ] 24.36% | 312 | 19.0% |
[ 26.0% - 26.5% ] 26.04% | 672 | 50.2% |
[ 28.5% - 29.0% ] 28.69% | 610 | 51.0% |
[ 33.0% - 33.5% ] 33.19% | 229 | 25.3% |
[ 34.5% - 35.0% ] 34.57% | 567 | 47.8% |
[ 36.5% - 37.0% ] 36.81% | 144 | 64.3% |