Zip Codes with the Highest Percentage of Population Employed in Architecture & Engineering in Benton, AR
RELATED REPORTS & OPTIONS
Architecture & Engineering
Benton
Compare Zip Codes
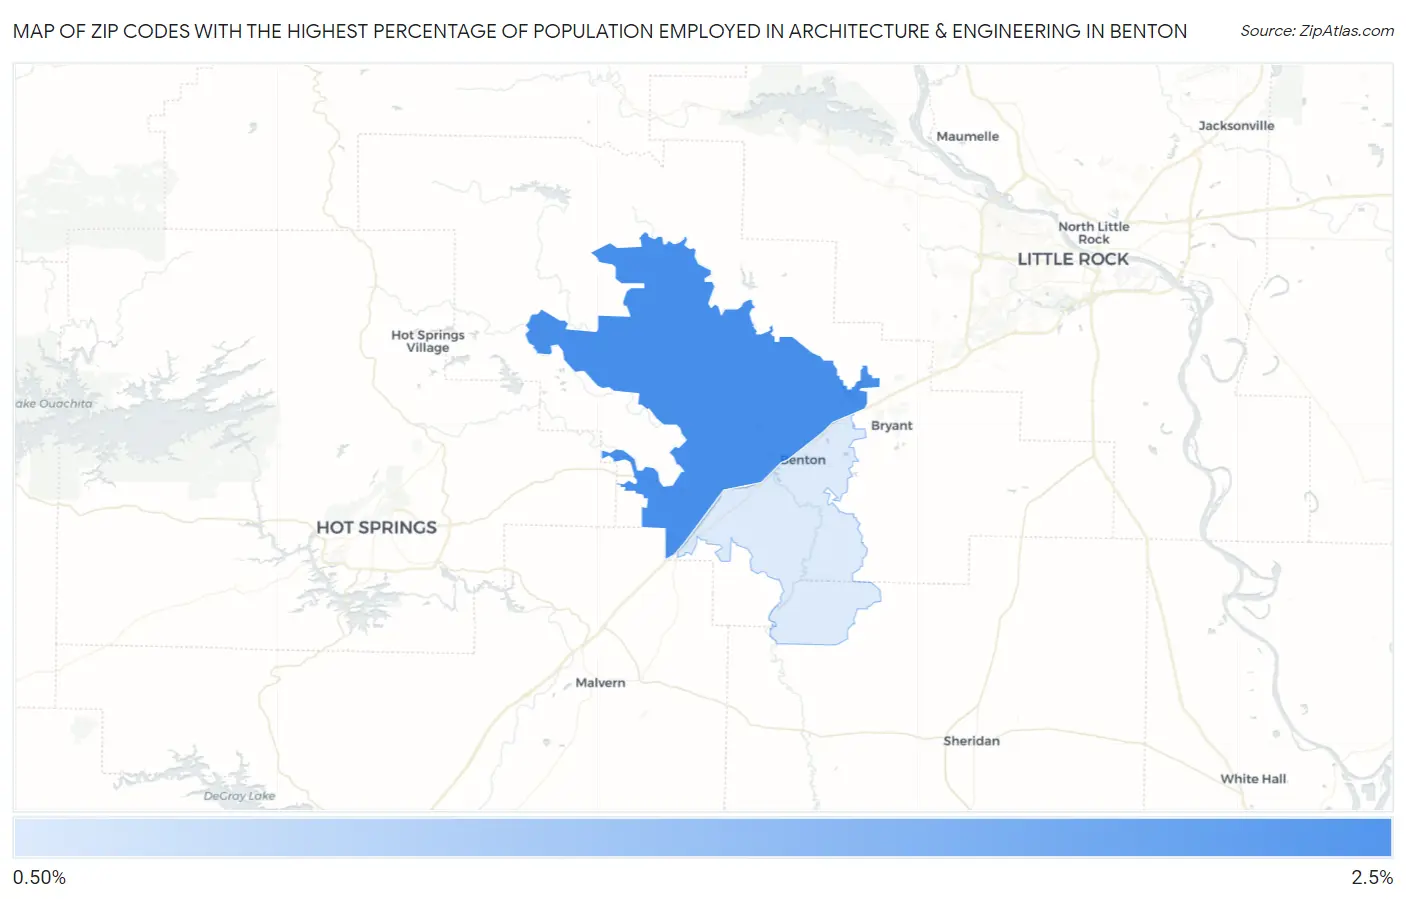
Map of Zip Codes with the Highest Percentage of Population Employed in Architecture & Engineering in Benton
0.98%
2.4%
Zip Codes with the Highest Percentage of Population Employed in Architecture & Engineering in Benton, AR
| Zip Code | % Employed | vs State | vs National | |
| 1. | 72019 | 2.4% | 1.3%(+1.10)#59 | 2.1%(+0.226)#7,596 |
| 2. | 72015 | 0.98% | 1.3%(-0.289)#158 | 2.1%(-1.17)#16,745 |
1
Common Questions
What are the Top Zip Codes with the Highest Percentage of Population Employed in Architecture & Engineering in Benton, AR?
Top Zip Codes with the Highest Percentage of Population Employed in Architecture & Engineering in Benton, AR are:
What zip code has the Highest Percentage of Population Employed in Architecture & Engineering in Benton, AR?
72019 has the Highest Percentage of Population Employed in Architecture & Engineering in Benton, AR with 2.4%.
What is the Percentage of Population Employed in Architecture & Engineering in Benton, AR?
Percentage of Population Employed in Architecture & Engineering in Benton is 1.3%.
What is the Percentage of Population Employed in Architecture & Engineering in Arkansas?
Percentage of Population Employed in Architecture & Engineering in Arkansas is 1.3%.
What is the Percentage of Population Employed in Architecture & Engineering in the United States?
Percentage of Population Employed in Architecture & Engineering in the United States is 2.1%.