Huntsville, AR Map & Demographics
Huntsville Map
Huntsville Overview
$26,453
PER CAPITA INCOME
$50,500
AVG FAMILY INCOME
$48,478
AVG HOUSEHOLD INCOME
53.7%
WAGE / INCOME GAP [ % ]
46.3¢/ $1
WAGE / INCOME GAP [ $ ]
0.55
INEQUALITY / GINI INDEX
2,973
TOTAL POPULATION
1,355
MALE POPULATION
1,618
FEMALE POPULATION
83.75
MALES / 100 FEMALES
119.41
FEMALES / 100 MALES
30.0
MEDIAN AGE
3.5
AVG FAMILY SIZE
2.9
AVG HOUSEHOLD SIZE
1,203
LABOR FORCE [ PEOPLE ]
63.5%
PERCENT IN LABOR FORCE
5.9%
UNEMPLOYMENT RATE
Huntsville Zip Codes
Huntsville Area Codes
Income in Huntsville
Income Overview in Huntsville
Per Capita Income in Huntsville is $26,453, while median incomes of families and households are $50,500 and $48,478 respectively.
| Characteristic | Number | Measure |
| Per Capita Income | 2,973 | $26,453 |
| Median Family Income | 734 | $50,500 |
| Mean Family Income | 734 | $91,458 |
| Median Household Income | 996 | $48,478 |
| Mean Household Income | 996 | $79,338 |
| Income Deficit | 734 | $0 |
| Wage / Income Gap (%) | 2,973 | 53.69% |
| Wage / Income Gap ($) | 2,973 | 46.31¢ per $1 |
| Gini / Inequality Index | 2,973 | 0.55 |
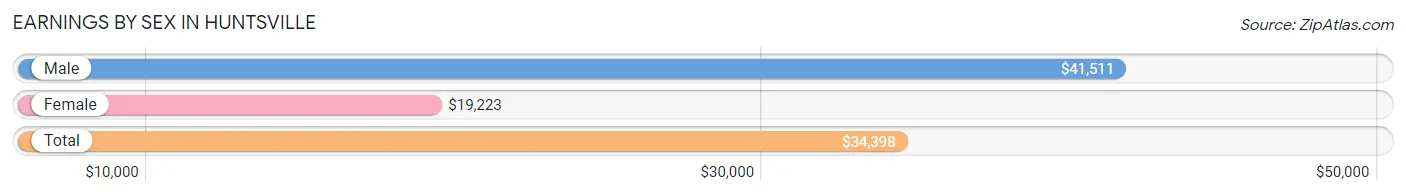
Earnings by Sex in Huntsville
Average Earnings in Huntsville are $34,398, $41,511 for men and $19,223 for women, a difference of 53.7%.
| Sex | Number | Average Earnings |
| Male | 602 (48.3%) | $41,511 |
| Female | 645 (51.7%) | $19,223 |
| Total | 1,247 (100.0%) | $34,398 |
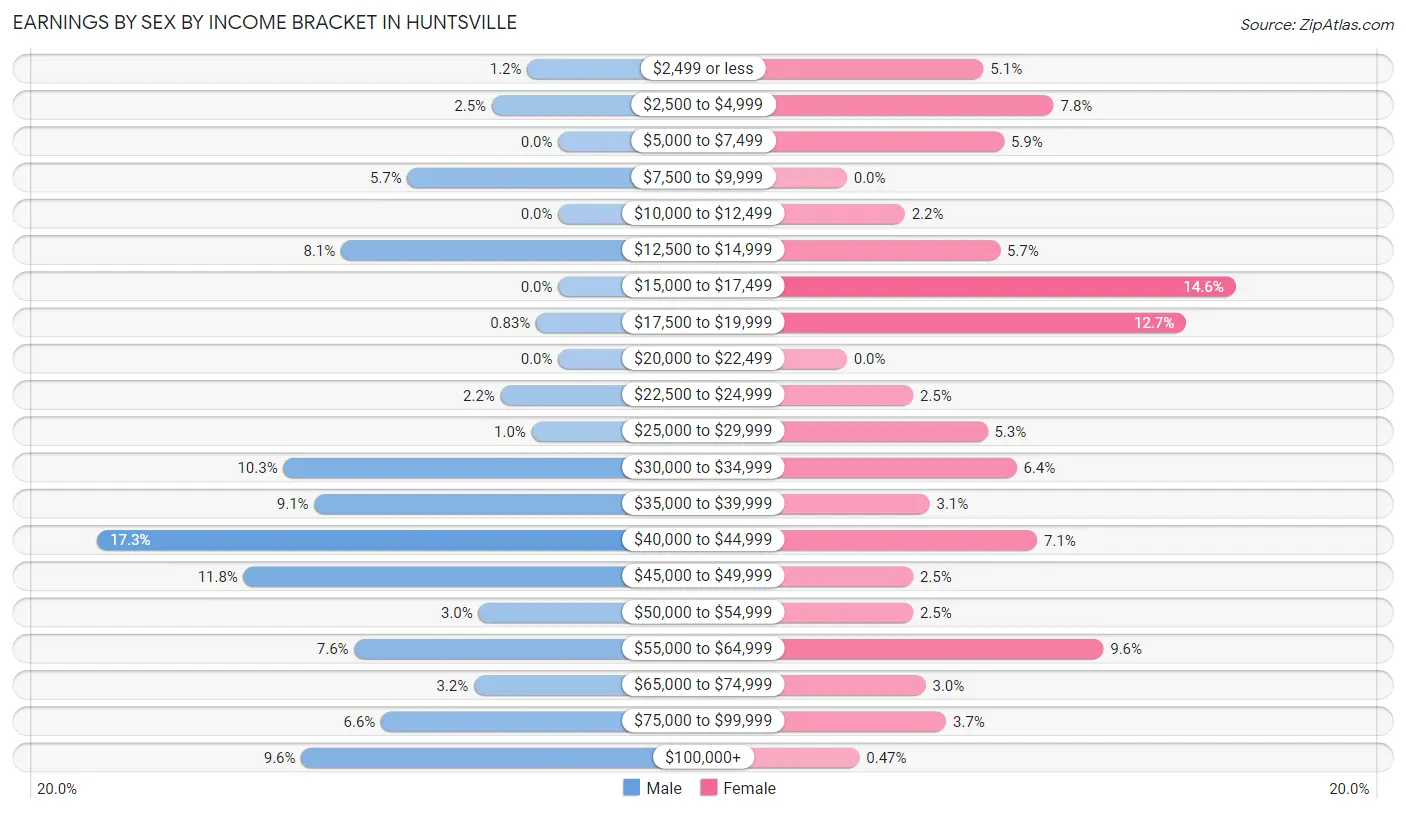
Earnings by Sex by Income Bracket in Huntsville
The most common earnings brackets in Huntsville are $40,000 to $44,999 for men (104 | 17.3%) and $15,000 to $17,499 for women (94 | 14.6%).
| Income | Male | Female |
| $2,499 or less | 7 (1.2%) | 33 (5.1%) |
| $2,500 to $4,999 | 15 (2.5%) | 50 (7.7%) |
| $5,000 to $7,499 | 0 (0.0%) | 38 (5.9%) |
| $7,500 to $9,999 | 34 (5.7%) | 0 (0.0%) |
| $10,000 to $12,499 | 0 (0.0%) | 14 (2.2%) |
| $12,500 to $14,999 | 49 (8.1%) | 37 (5.7%) |
| $15,000 to $17,499 | 0 (0.0%) | 94 (14.6%) |
| $17,500 to $19,999 | 5 (0.8%) | 82 (12.7%) |
| $20,000 to $22,499 | 0 (0.0%) | 0 (0.0%) |
| $22,500 to $24,999 | 13 (2.2%) | 16 (2.5%) |
| $25,000 to $29,999 | 6 (1.0%) | 34 (5.3%) |
| $30,000 to $34,999 | 62 (10.3%) | 41 (6.4%) |
| $35,000 to $39,999 | 55 (9.1%) | 20 (3.1%) |
| $40,000 to $44,999 | 104 (17.3%) | 46 (7.1%) |
| $45,000 to $49,999 | 71 (11.8%) | 16 (2.5%) |
| $50,000 to $54,999 | 18 (3.0%) | 16 (2.5%) |
| $55,000 to $64,999 | 46 (7.6%) | 62 (9.6%) |
| $65,000 to $74,999 | 19 (3.2%) | 19 (2.9%) |
| $75,000 to $99,999 | 40 (6.6%) | 24 (3.7%) |
| $100,000+ | 58 (9.6%) | 3 (0.5%) |
| Total | 602 (100.0%) | 645 (100.0%) |
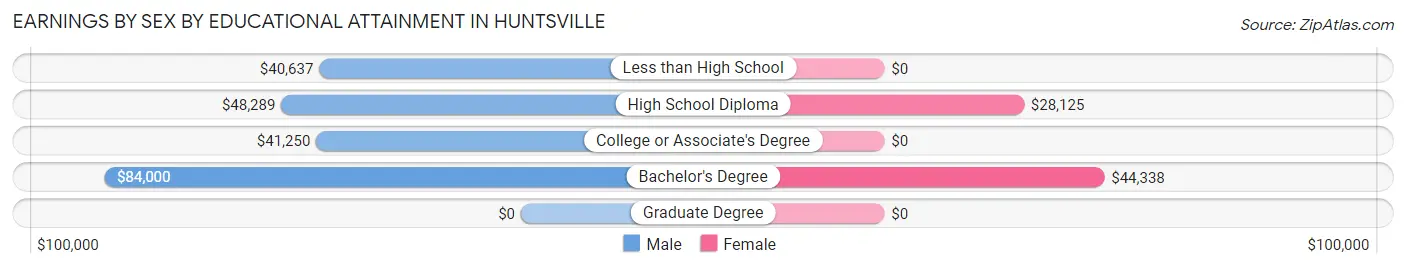
Earnings by Sex by Educational Attainment in Huntsville
Average earnings in Huntsville are $42,005 for men and $19,962 for women, a difference of 52.5%. Men with an educational attainment of bachelor's degree enjoy the highest average annual earnings of $84,000, while those with less than high school education earn the least with $40,637. Women with an educational attainment of bachelor's degree earn the most with the average annual earnings of $44,338, while those with high school diploma education have the smallest earnings of $28,125.
| Educational Attainment | Male Income | Female Income |
| Less than High School | $40,637 | $0 |
| High School Diploma | $48,289 | $28,125 |
| College or Associate's Degree | $41,250 | $0 |
| Bachelor's Degree | $84,000 | $44,338 |
| Graduate Degree | - | - |
| Total | $42,005 | $19,962 |
Family Income in Huntsville
Family Income Brackets in Huntsville
According to the Huntsville family income data, there are 142 families falling into the $50,000 to $74,999 income range, which is the most common income bracket and makes up 19.4% of all families. Conversely, the $10,000 to $14,999 income bracket is the least frequent group with only 26 families (3.5%) belonging to this category.
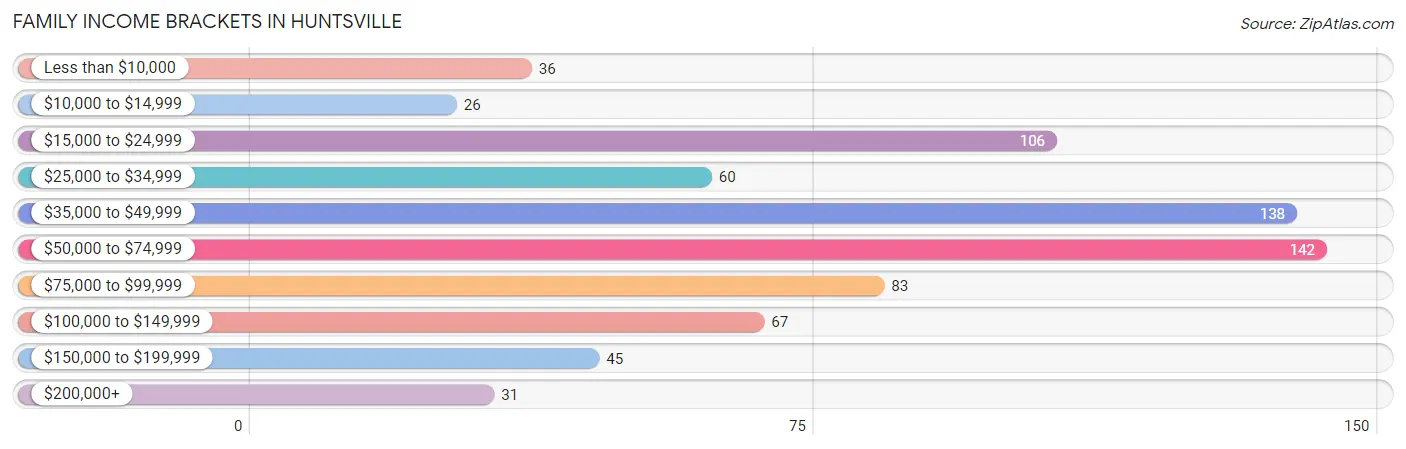
| Income Bracket | # Families | % Families |
| Less than $10,000 | 36 | 4.9% |
| $10,000 to $14,999 | 26 | 3.5% |
| $15,000 to $24,999 | 106 | 14.4% |
| $25,000 to $34,999 | 60 | 8.2% |
| $35,000 to $49,999 | 138 | 18.8% |
| $50,000 to $74,999 | 142 | 19.3% |
| $75,000 to $99,999 | 83 | 11.3% |
| $100,000 to $149,999 | 67 | 9.1% |
| $150,000 to $199,999 | 45 | 6.1% |
| $200,000+ | 31 | 4.2% |
Family Income by Famaliy Size in Huntsville
5-person families (102 | 13.9%) account for the highest median family income in Huntsville with $90,750 per family, while 2-person families (266 | 36.2%) have the highest median income of $20,584 per family member.
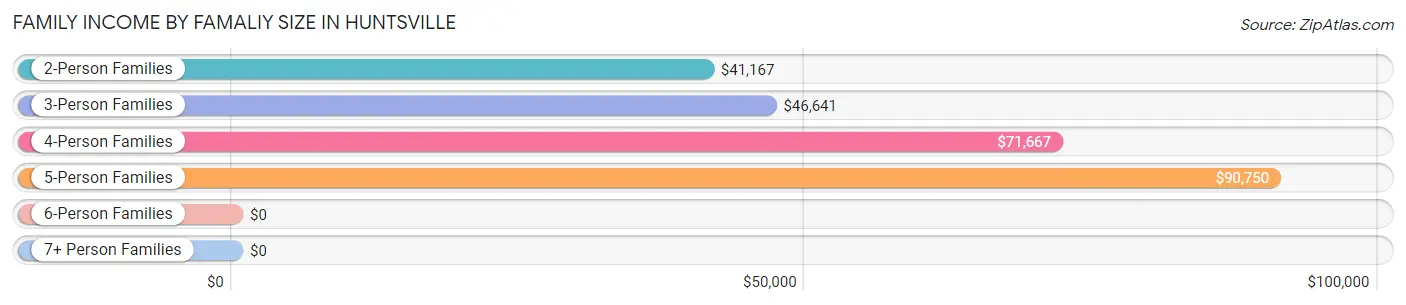
| Income Bracket | # Families | Median Income |
| 2-Person Families | 266 (36.2%) | $41,167 |
| 3-Person Families | 197 (26.8%) | $46,641 |
| 4-Person Families | 134 (18.3%) | $71,667 |
| 5-Person Families | 102 (13.9%) | $90,750 |
| 6-Person Families | 8 (1.1%) | $0 |
| 7+ Person Families | 27 (3.7%) | $0 |
| Total | 734 (100.0%) | $50,500 |
Family Income by Number of Earners in Huntsville
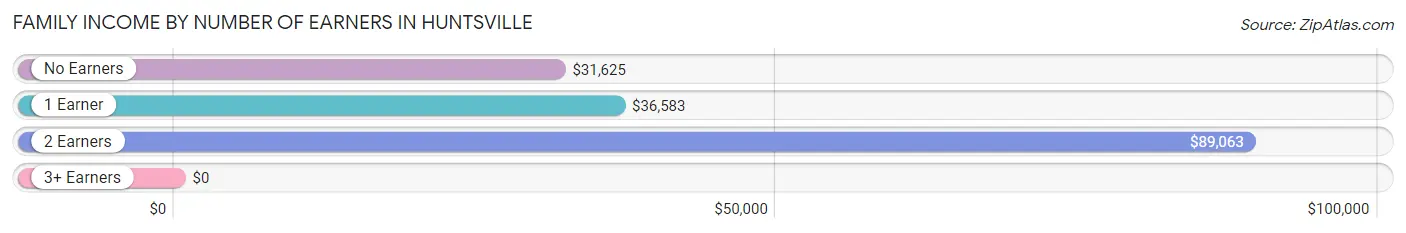
| Number of Earners | # Families | Median Income |
| No Earners | 70 (9.5%) | $31,625 |
| 1 Earner | 369 (50.3%) | $36,583 |
| 2 Earners | 283 (38.6%) | $89,063 |
| 3+ Earners | 12 (1.6%) | $0 |
| Total | 734 (100.0%) | $50,500 |
Household Income in Huntsville
Household Income Brackets in Huntsville
With 213 households falling in the category, the $50,000 to $74,999 income range is the most frequent in Huntsville, accounting for 21.4% of all households. In contrast, only 31 households (3.1%) fall into the $200,000+ income bracket, making it the least populous group.
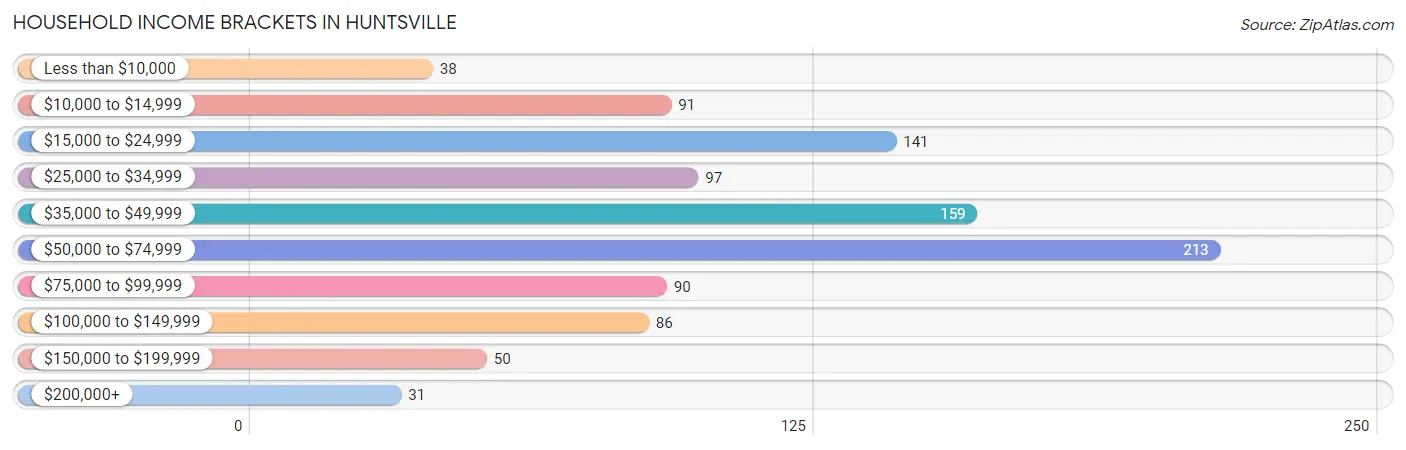
| Income Bracket | # Households | % Households |
| Less than $10,000 | 38 | 3.8% |
| $10,000 to $14,999 | 91 | 9.1% |
| $15,000 to $24,999 | 141 | 14.2% |
| $25,000 to $34,999 | 97 | 9.7% |
| $35,000 to $49,999 | 159 | 16.0% |
| $50,000 to $74,999 | 213 | 21.4% |
| $75,000 to $99,999 | 90 | 9.0% |
| $100,000 to $149,999 | 86 | 8.6% |
| $150,000 to $199,999 | 50 | 5.0% |
| $200,000+ | 31 | 3.1% |
Household Income by Householder Age in Huntsville
The median household income in Huntsville is $48,478, with the highest median household income of $56,938 found in the 25 to 44 years age bracket for the primary householder. A total of 467 households (46.9%) fall into this category. Meanwhile, the 15 to 24 years age bracket for the primary householder has the lowest median household income of $0, with 66 households (6.6%) in this group.
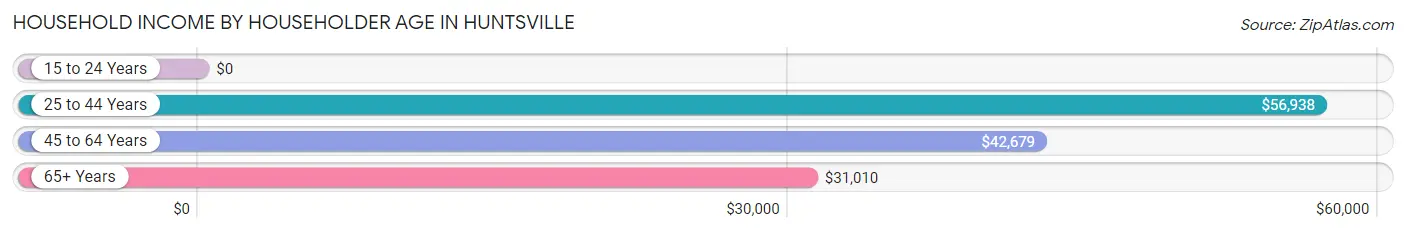
| Income Bracket | # Households | Median Income |
| 15 to 24 Years | 66 (6.6%) | $0 |
| 25 to 44 Years | 467 (46.9%) | $56,938 |
| 45 to 64 Years | 286 (28.7%) | $42,679 |
| 65+ Years | 177 (17.8%) | $31,010 |
| Total | 996 (100.0%) | $48,478 |
Poverty in Huntsville
Income Below Poverty by Sex and Age in Huntsville
With 25.9% poverty level for males and 20.6% for females among the residents of Huntsville, under 5 year old males and 5 year old females are the most vulnerable to poverty, with 143 males (90.5%) and 3 females (100.0%) in their respective age groups living below the poverty level.
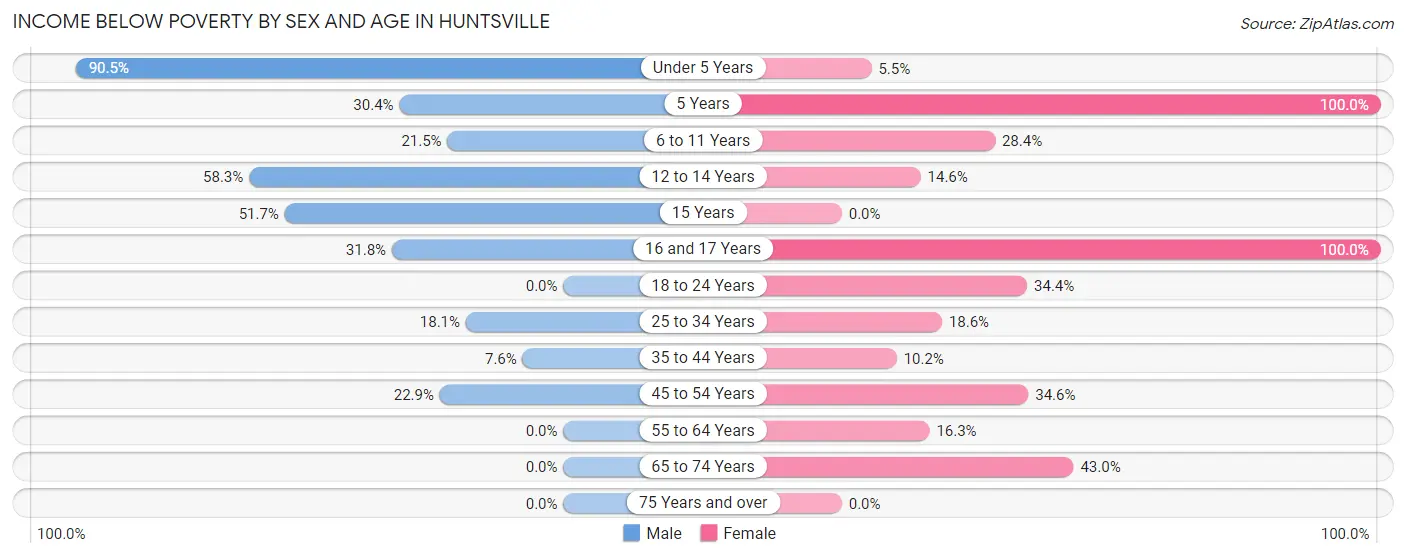
| Age Bracket | Male | Female |
| Under 5 Years | 143 (90.5%) | 11 (5.5%) |
| 5 Years | 14 (30.4%) | 3 (100.0%) |
| 6 to 11 Years | 57 (21.5%) | 56 (28.4%) |
| 12 to 14 Years | 28 (58.3%) | 18 (14.6%) |
| 15 Years | 15 (51.7%) | 0 (0.0%) |
| 16 and 17 Years | 7 (31.8%) | 17 (100.0%) |
| 18 to 24 Years | 0 (0.0%) | 43 (34.4%) |
| 25 to 34 Years | 42 (18.1%) | 58 (18.6%) |
| 35 to 44 Years | 17 (7.6%) | 11 (10.2%) |
| 45 to 54 Years | 25 (22.9%) | 36 (34.6%) |
| 55 to 64 Years | 0 (0.0%) | 27 (16.3%) |
| 65 to 74 Years | 0 (0.0%) | 40 (43.0%) |
| 75 Years and over | 0 (0.0%) | 0 (0.0%) |
| Total | 348 (25.9%) | 320 (20.6%) |
Income Above Poverty by Sex and Age in Huntsville
According to the poverty statistics in Huntsville, males aged 18 to 24 years and females aged 15 years are the age groups that are most secure financially, with 100.0% of males and 100.0% of females in these age groups living above the poverty line.
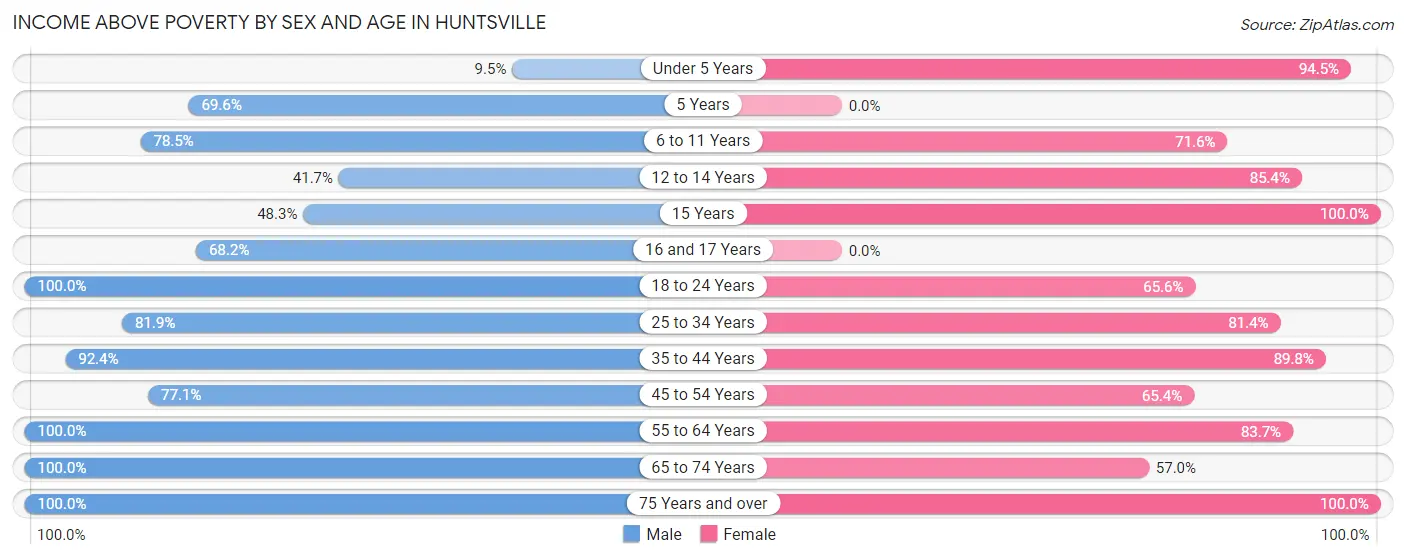
| Age Bracket | Male | Female |
| Under 5 Years | 15 (9.5%) | 189 (94.5%) |
| 5 Years | 32 (69.6%) | 0 (0.0%) |
| 6 to 11 Years | 208 (78.5%) | 141 (71.6%) |
| 12 to 14 Years | 20 (41.7%) | 105 (85.4%) |
| 15 Years | 14 (48.3%) | 7 (100.0%) |
| 16 and 17 Years | 15 (68.2%) | 0 (0.0%) |
| 18 to 24 Years | 28 (100.0%) | 82 (65.6%) |
| 25 to 34 Years | 190 (81.9%) | 254 (81.4%) |
| 35 to 44 Years | 208 (92.4%) | 97 (89.8%) |
| 45 to 54 Years | 84 (77.1%) | 68 (65.4%) |
| 55 to 64 Years | 80 (100.0%) | 139 (83.7%) |
| 65 to 74 Years | 37 (100.0%) | 53 (57.0%) |
| 75 Years and over | 66 (100.0%) | 98 (100.0%) |
| Total | 997 (74.1%) | 1,233 (79.4%) |
Income Below Poverty Among Married-Couple Families in Huntsville
The poverty statistics for married-couple families in Huntsville show that 2.9% or 14 of the total 479 families live below the poverty line. Families with 1 or 2 children have the highest poverty rate of 7.9%, comprising of 14 families. On the other hand, families with no children have the lowest poverty rate of 0.0%, which includes 0 families.
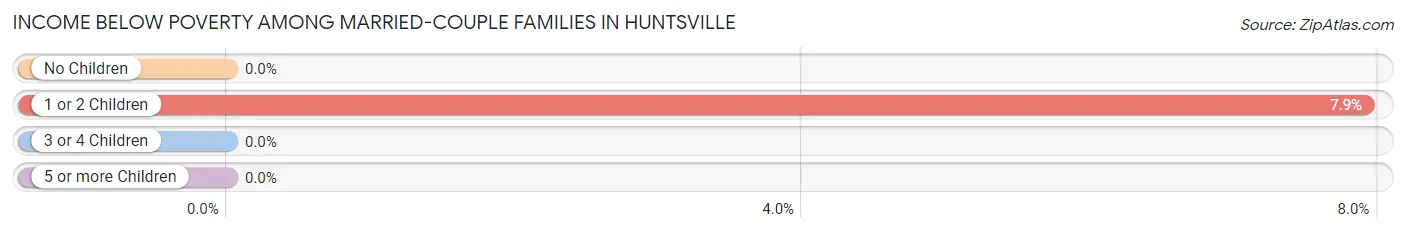
| Children | Above Poverty | Below Poverty |
| No Children | 222 (100.0%) | 0 (0.0%) |
| 1 or 2 Children | 163 (92.1%) | 14 (7.9%) |
| 3 or 4 Children | 60 (100.0%) | 0 (0.0%) |
| 5 or more Children | 20 (100.0%) | 0 (0.0%) |
| Total | 465 (97.1%) | 14 (2.9%) |
Income Below Poverty Among Single-Parent Households in Huntsville
According to the poverty data in Huntsville, 75.0% or 21 single-father households and 44.9% or 102 single-mother households are living below the poverty line. Among single-father households, those with 3 or 4 children have the highest poverty rate, with 13 households (100.0%) experiencing poverty. Likewise, among single-mother households, those with no children have the highest poverty rate, with 20 households (100.0%) falling below the poverty line.
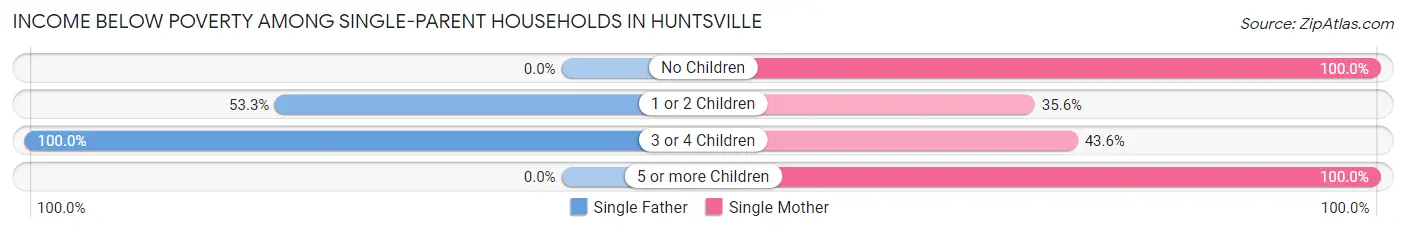
| Children | Single Father | Single Mother |
| No Children | 0 (0.0%) | 20 (100.0%) |
| 1 or 2 Children | 8 (53.3%) | 57 (35.6%) |
| 3 or 4 Children | 13 (100.0%) | 17 (43.6%) |
| 5 or more Children | 0 (0.0%) | 8 (100.0%) |
| Total | 21 (75.0%) | 102 (44.9%) |
Income Below Poverty Among Married-Couple vs Single-Parent Households in Huntsville
The poverty data for Huntsville shows that 14 of the married-couple family households (2.9%) and 123 of the single-parent households (48.2%) are living below the poverty level. Within the married-couple family households, those with 1 or 2 children have the highest poverty rate, with 14 households (7.9%) falling below the poverty line. Among the single-parent households, those with no children have the highest poverty rate, with 20 household (100.0%) living below poverty.
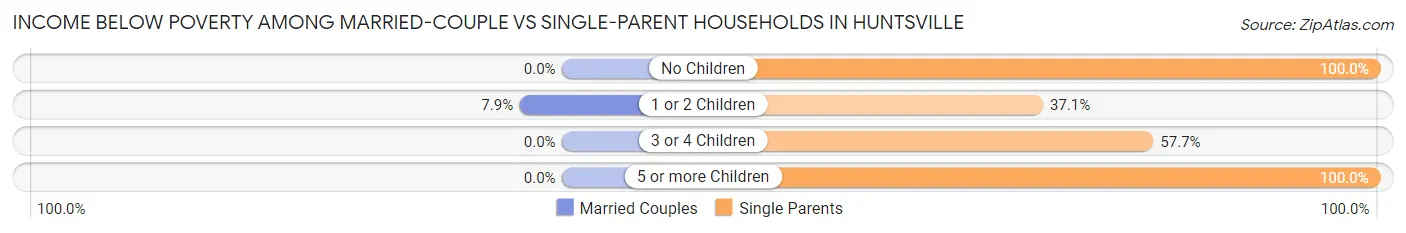
| Children | Married-Couple Families | Single-Parent Households |
| No Children | 0 (0.0%) | 20 (100.0%) |
| 1 or 2 Children | 14 (7.9%) | 65 (37.1%) |
| 3 or 4 Children | 0 (0.0%) | 30 (57.7%) |
| 5 or more Children | 0 (0.0%) | 8 (100.0%) |
| Total | 14 (2.9%) | 123 (48.2%) |
Race in Huntsville
The most populous races in Huntsville are White / Caucasian (2,241 | 75.4%), Hispanic or Latino (537 | 18.1%), and Two or more Races (470 | 15.8%).
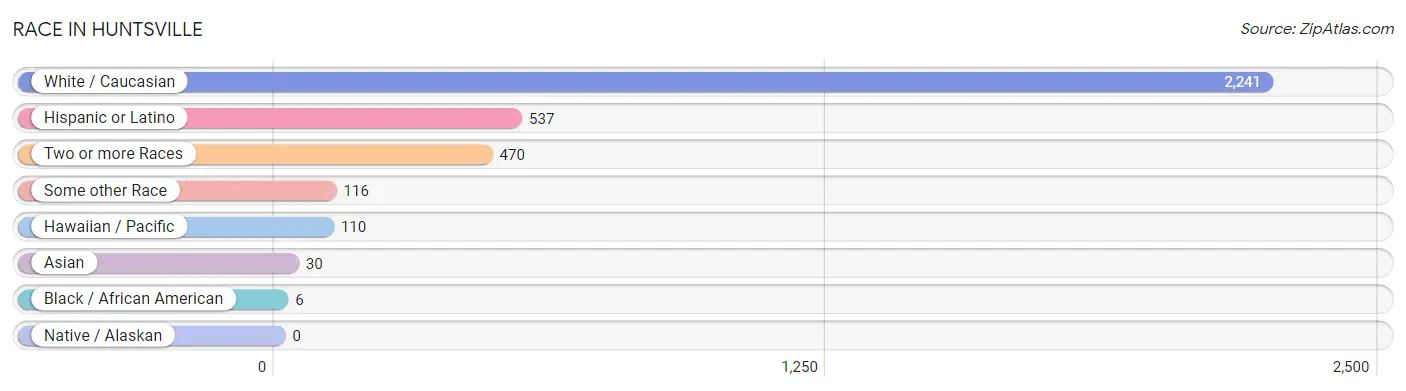
| Race | # Population | % Population |
| Asian | 30 | 1.0% |
| Black / African American | 6 | 0.2% |
| Hawaiian / Pacific | 110 | 3.7% |
| Hispanic or Latino | 537 | 18.1% |
| Native / Alaskan | 0 | 0.0% |
| White / Caucasian | 2,241 | 75.4% |
| Two or more Races | 470 | 15.8% |
| Some other Race | 116 | 3.9% |
| Total | 2,973 | 100.0% |
Ancestry in Huntsville
The most populous ancestries reported in Huntsville are Irish (473 | 15.9%), Mexican (431 | 14.5%), English (294 | 9.9%), German (277 | 9.3%), and Italian (182 | 6.1%), together accounting for 55.7% of all Huntsville residents.
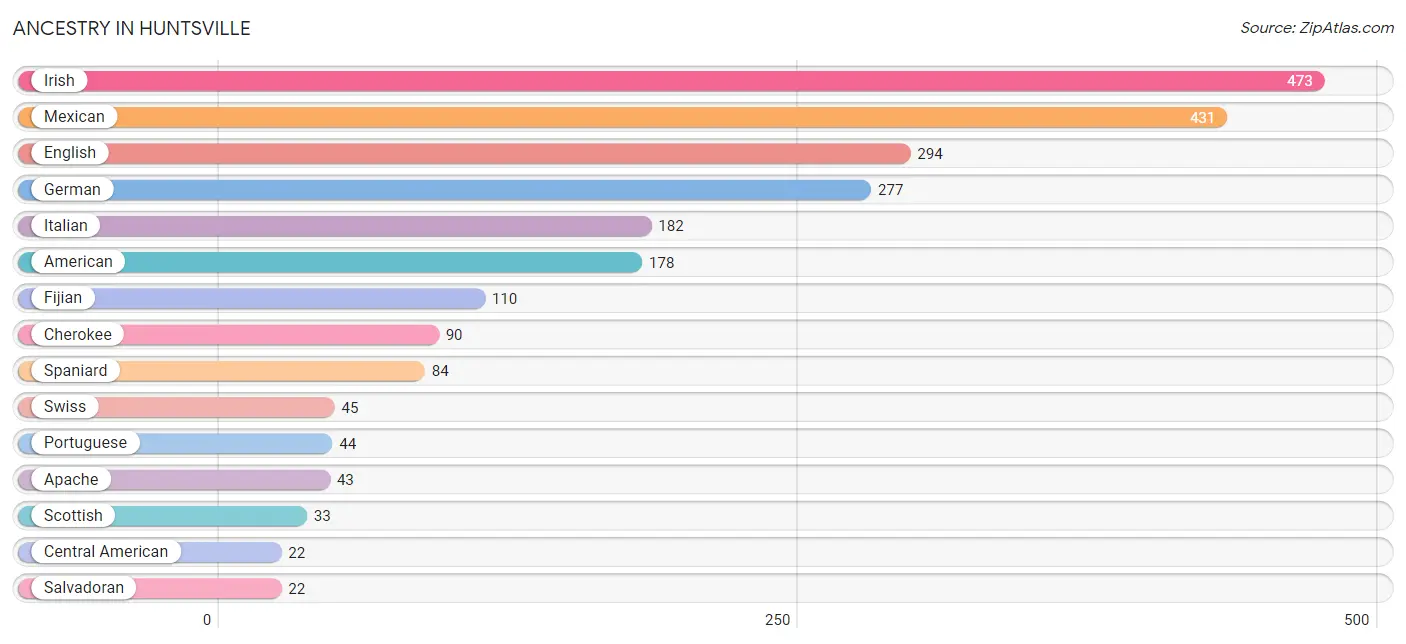
| Ancestry | # Population | % Population |
| American | 178 | 6.0% |
| Apache | 43 | 1.5% |
| Bhutanese | 7 | 0.2% |
| British | 21 | 0.7% |
| Celtic | 7 | 0.2% |
| Central American | 22 | 0.7% |
| Cherokee | 90 | 3.0% |
| English | 294 | 9.9% |
| European | 8 | 0.3% |
| Fijian | 110 | 3.7% |
| German | 277 | 9.3% |
| Irish | 473 | 15.9% |
| Italian | 182 | 6.1% |
| Korean | 7 | 0.2% |
| Mexican | 431 | 14.5% |
| Polish | 5 | 0.2% |
| Portuguese | 44 | 1.5% |
| Salvadoran | 22 | 0.7% |
| Scotch-Irish | 22 | 0.7% |
| Scottish | 33 | 1.1% |
| Spaniard | 84 | 2.8% |
| Swiss | 45 | 1.5% | View All 22 Rows |
Immigrants in Huntsville
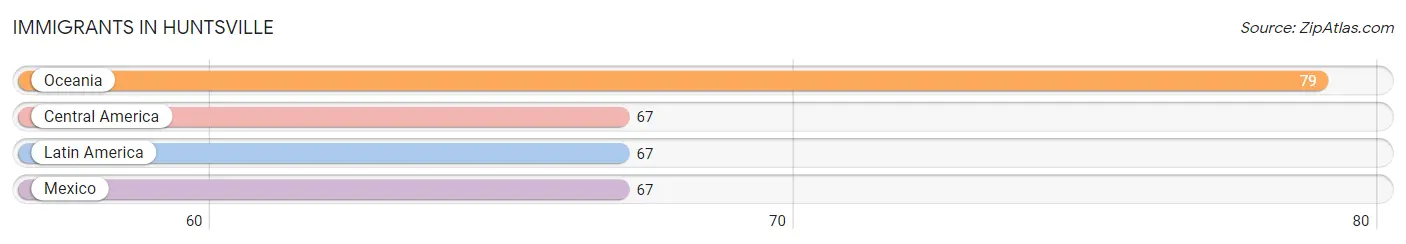
The most numerous immigrant groups reported in Huntsville came from Oceania (79 | 2.7%), Central America (67 | 2.2%), Latin America (67 | 2.2%), and Mexico (67 | 2.2%), together accounting for 9.4% of all Huntsville residents.
| Immigration Origin | # Population | % Population |
| Central America | 67 | 2.2% |
| Latin America | 67 | 2.2% |
| Mexico | 67 | 2.2% |
| Oceania | 79 | 2.7% | View All 4 Rows |
Sex and Age in Huntsville
Sex and Age in Huntsville
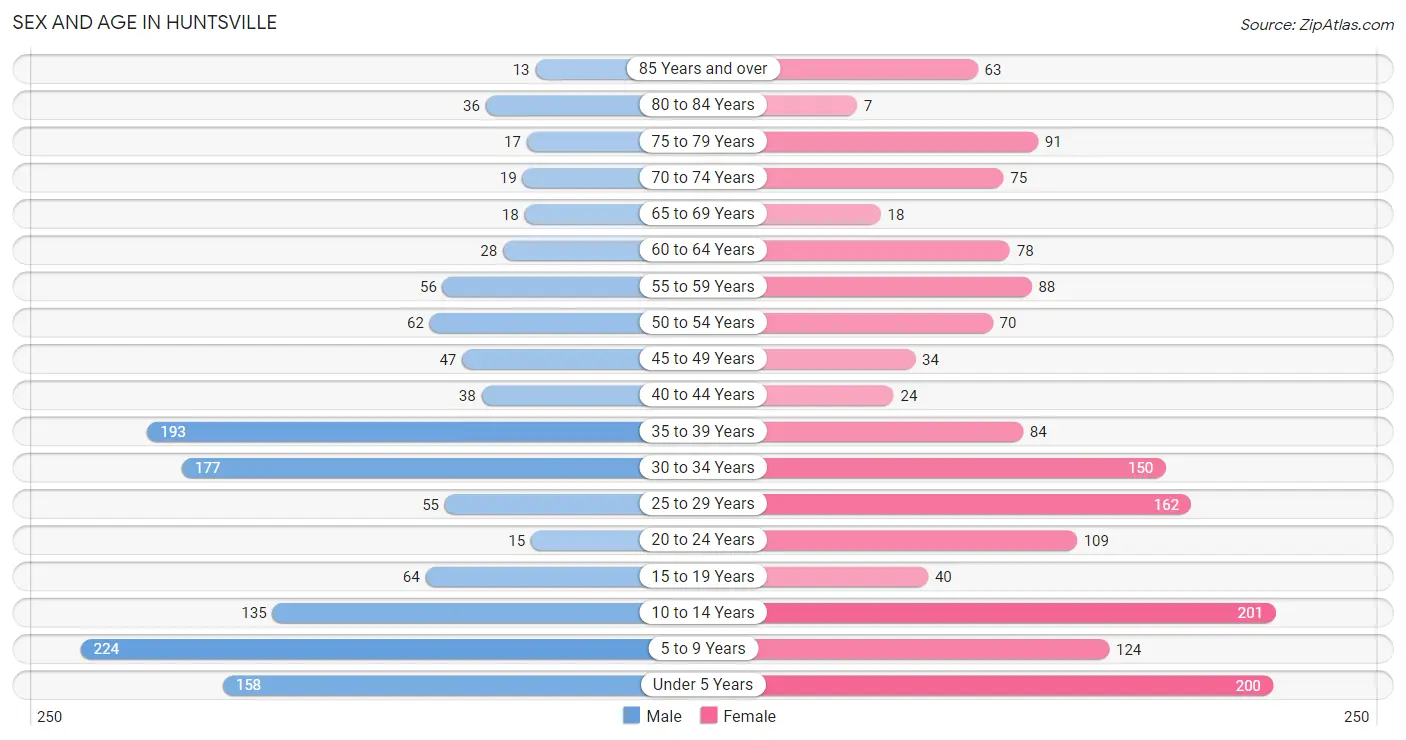
The most populous age groups in Huntsville are 5 to 9 Years (224 | 16.5%) for men and 10 to 14 Years (201 | 12.4%) for women.
| Age Bracket | Male | Female |
| Under 5 Years | 158 (11.7%) | 200 (12.4%) |
| 5 to 9 Years | 224 (16.5%) | 124 (7.7%) |
| 10 to 14 Years | 135 (10.0%) | 201 (12.4%) |
| 15 to 19 Years | 64 (4.7%) | 40 (2.5%) |
| 20 to 24 Years | 15 (1.1%) | 109 (6.7%) |
| 25 to 29 Years | 55 (4.1%) | 162 (10.0%) |
| 30 to 34 Years | 177 (13.1%) | 150 (9.3%) |
| 35 to 39 Years | 193 (14.2%) | 84 (5.2%) |
| 40 to 44 Years | 38 (2.8%) | 24 (1.5%) |
| 45 to 49 Years | 47 (3.5%) | 34 (2.1%) |
| 50 to 54 Years | 62 (4.6%) | 70 (4.3%) |
| 55 to 59 Years | 56 (4.1%) | 88 (5.4%) |
| 60 to 64 Years | 28 (2.1%) | 78 (4.8%) |
| 65 to 69 Years | 18 (1.3%) | 18 (1.1%) |
| 70 to 74 Years | 19 (1.4%) | 75 (4.6%) |
| 75 to 79 Years | 17 (1.3%) | 91 (5.6%) |
| 80 to 84 Years | 36 (2.7%) | 7 (0.4%) |
| 85 Years and over | 13 (1.0%) | 63 (3.9%) |
| Total | 1,355 (100.0%) | 1,618 (100.0%) |
Families and Households in Huntsville
Median Family Size in Huntsville
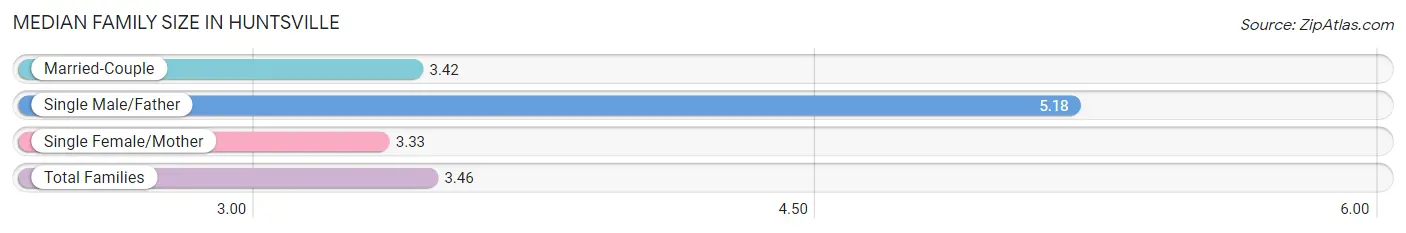
The median family size in Huntsville is 3.46 persons per family, with single male/father families (28 | 3.8%) accounting for the largest median family size of 5.18 persons per family. On the other hand, single female/mother families (227 | 30.9%) represent the smallest median family size with 3.33 persons per family.
| Family Type | # Families | Family Size |
| Married-Couple | 479 (65.3%) | 3.42 |
| Single Male/Father | 28 (3.8%) | 5.18 |
| Single Female/Mother | 227 (30.9%) | 3.33 |
| Total Families | 734 (100.0%) | 3.46 |
Median Household Size in Huntsville
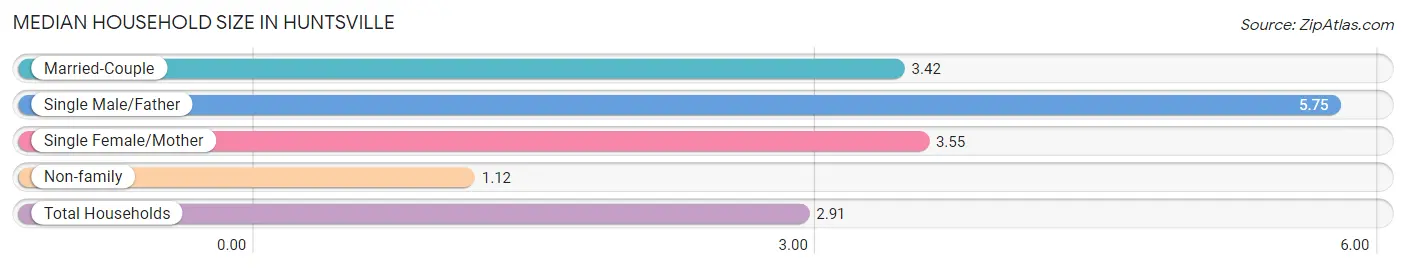
The median household size in Huntsville is 2.91 persons per household, with single male/father households (28 | 2.8%) accounting for the largest median household size of 5.75 persons per household. non-family households (262 | 26.3%) represent the smallest median household size with 1.12 persons per household.
| Household Type | # Households | Household Size |
| Married-Couple | 479 (48.1%) | 3.42 |
| Single Male/Father | 28 (2.8%) | 5.75 |
| Single Female/Mother | 227 (22.8%) | 3.55 |
| Non-family | 262 (26.3%) | 1.12 |
| Total Households | 996 (100.0%) | 2.91 |
Household Size by Marriage Status in Huntsville
Out of a total of 996 households in Huntsville, 734 (73.7%) are family households, while 262 (26.3%) are nonfamily households. The most numerous type of family households are 2-person households, comprising 222, and the most common type of nonfamily households are 1-person households, comprising 231.
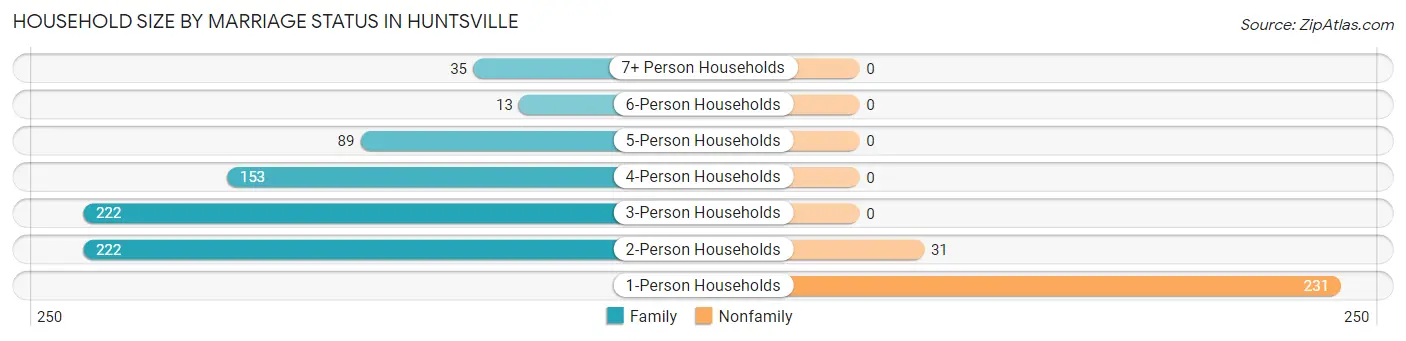
| Household Size | Family Households | Nonfamily Households |
| 1-Person Households | - | 231 (23.2%) |
| 2-Person Households | 222 (22.3%) | 31 (3.1%) |
| 3-Person Households | 222 (22.3%) | 0 (0.0%) |
| 4-Person Households | 153 (15.4%) | 0 (0.0%) |
| 5-Person Households | 89 (8.9%) | 0 (0.0%) |
| 6-Person Households | 13 (1.3%) | 0 (0.0%) |
| 7+ Person Households | 35 (3.5%) | 0 (0.0%) |
| Total | 734 (73.7%) | 262 (26.3%) |
Female Fertility in Huntsville
Fertility by Age in Huntsville
Average fertility rate in Huntsville is 73.0 births per 1,000 women. Women in the age bracket of 35 to 50 years have the highest fertility rate with 83.0 births per 1,000 women. Women in the age bracket of 20 to 34 years acount for 71.1% of all women with births.
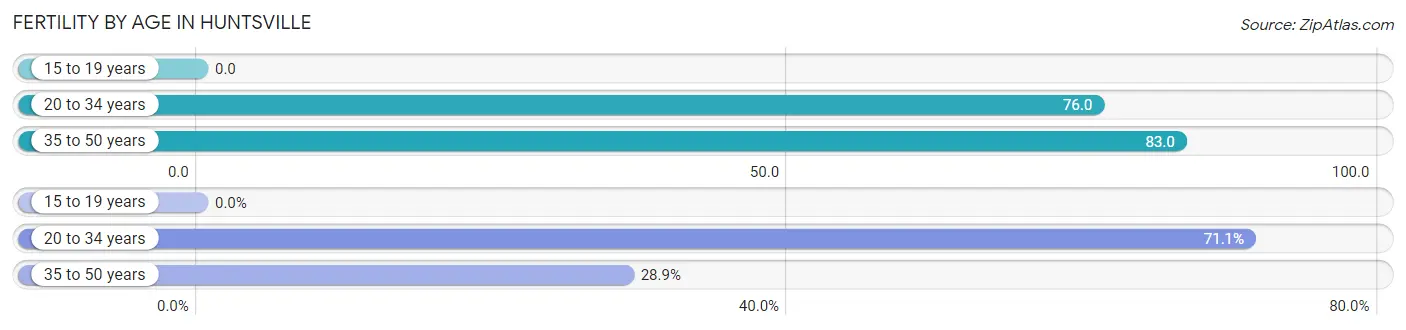
| Age Bracket | Women with Births | Births / 1,000 Women |
| 15 to 19 years | 0 (0.0%) | 0.0 |
| 20 to 34 years | 32 (71.1%) | 76.0 |
| 35 to 50 years | 13 (28.9%) | 83.0 |
| Total | 45 (100.0%) | 73.0 |
Fertility by Age by Marriage Status in Huntsville
15.6% of women with births (45) in Huntsville are married. The highest percentage of unmarried women with births falls into 20 to 34 years age bracket with 100.0% of them unmarried at the time of birth, while the lowest percentage of unmarried women with births belong to 35 to 50 years age bracket with 46.2% of them unmarried.
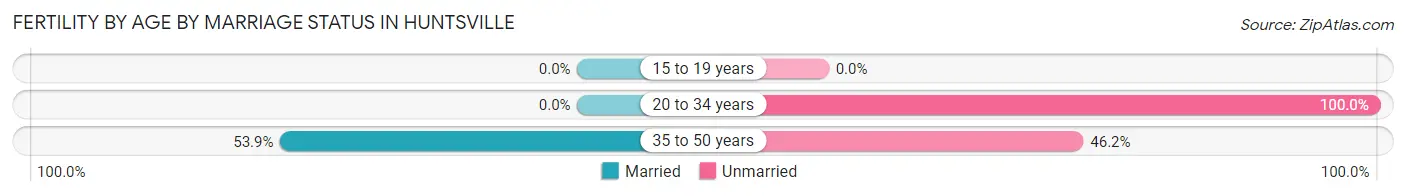
| Age Bracket | Married | Unmarried |
| 15 to 19 years | 0 (0.0%) | 0 (0.0%) |
| 20 to 34 years | 0 (0.0%) | 32 (100.0%) |
| 35 to 50 years | 7 (53.8%) | 6 (46.2%) |
| Total | 7 (15.6%) | 38 (84.4%) |
Fertility by Education in Huntsville
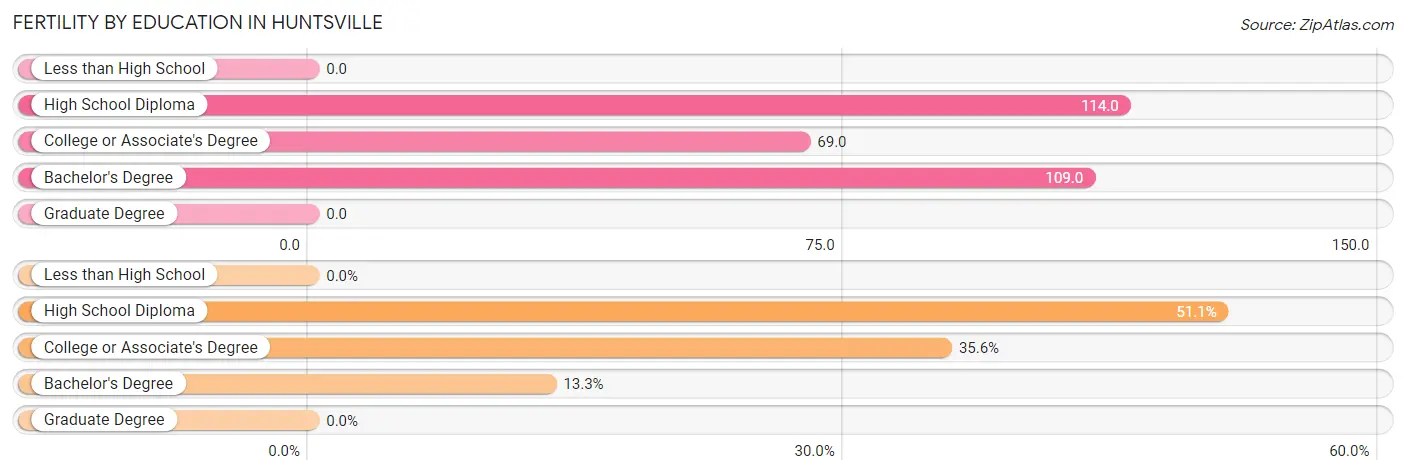
| Educational Attainment | Women with Births | Births / 1,000 Women |
| Less than High School | 0 (0.0%) | 0.0 |
| High School Diploma | 23 (51.1%) | 114.0 |
| College or Associate's Degree | 16 (35.6%) | 69.0 |
| Bachelor's Degree | 6 (13.3%) | 109.0 |
| Graduate Degree | 0 (0.0%) | 0.0 |
| Total | 45 (100.0%) | 73.0 |
Fertility by Education by Marriage Status in Huntsville
84.4% of women with births in Huntsville are unmarried. Women with the educational attainment of high school diploma are most likely to be married with 30.4% of them married at childbirth, while women with the educational attainment of college or associate's degree are least likely to be married with 100.0% of them unmarried at childbirth.
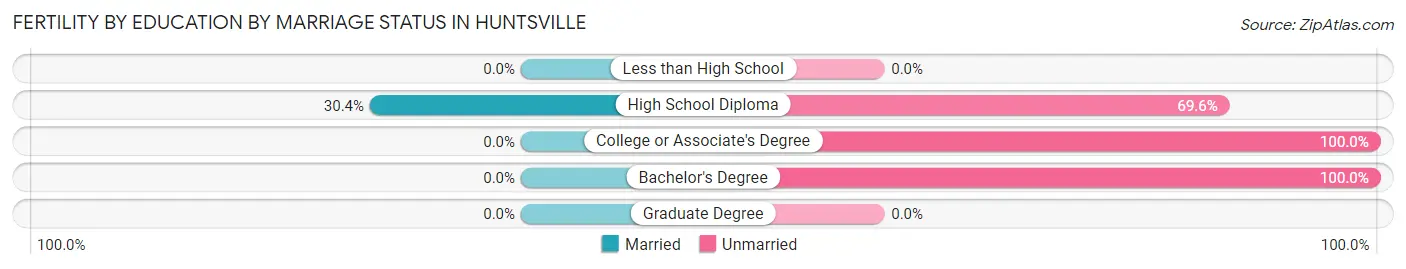
| Educational Attainment | Married | Unmarried |
| Less than High School | 0 (0.0%) | 0 (0.0%) |
| High School Diploma | 7 (30.4%) | 16 (69.6%) |
| College or Associate's Degree | 0 (0.0%) | 16 (100.0%) |
| Bachelor's Degree | 0 (0.0%) | 6 (100.0%) |
| Graduate Degree | 0 (0.0%) | 0 (0.0%) |
| Total | 7 (15.6%) | 38 (84.4%) |
Employment Characteristics in Huntsville
Employment by Class of Employer in Huntsville
Among the 1,129 employed individuals in Huntsville, private company employees (880 | 77.9%), not-for-profit organizations (90 | 8.0%), and self-employed (not incorporated) (52 | 4.6%) make up the most common classes of employment.
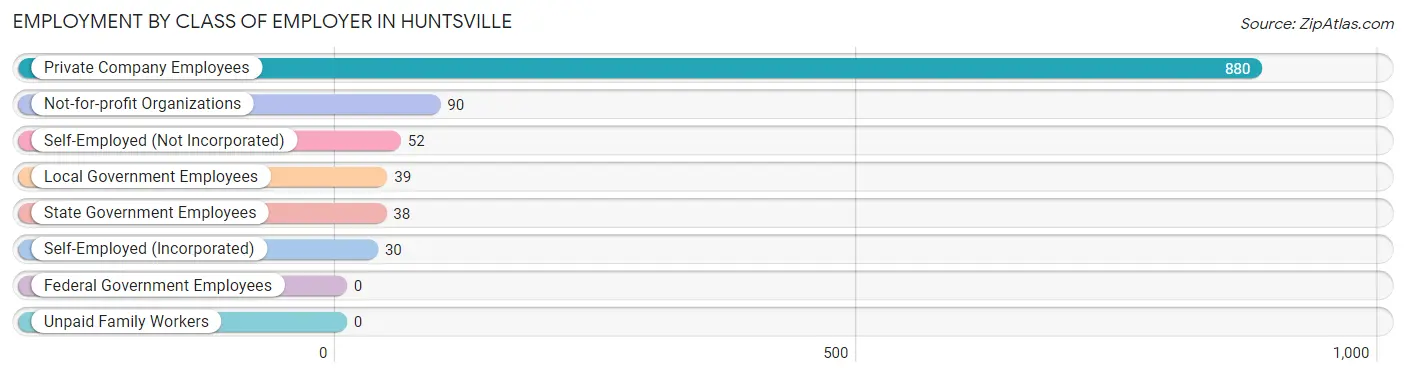
| Employer Class | # Employees | % Employees |
| Private Company Employees | 880 | 77.9% |
| Self-Employed (Incorporated) | 30 | 2.7% |
| Self-Employed (Not Incorporated) | 52 | 4.6% |
| Not-for-profit Organizations | 90 | 8.0% |
| Local Government Employees | 39 | 3.5% |
| State Government Employees | 38 | 3.4% |
| Federal Government Employees | 0 | 0.0% |
| Unpaid Family Workers | 0 | 0.0% |
| Total | 1,129 | 100.0% |
Employment Status by Age in Huntsville
According to the labor force statistics for Huntsville, out of the total population over 16 years of age (1,895), 63.5% or 1,203 individuals are in the labor force, with 5.9% or 71 of them unemployed. The age group with the highest labor force participation rate is 30 to 34 years, with 93.0% or 304 individuals in the labor force. Within the labor force, the 60 to 64 years age range has the highest percentage of unemployed individuals, with 38.7% or 12 of them being unemployed.
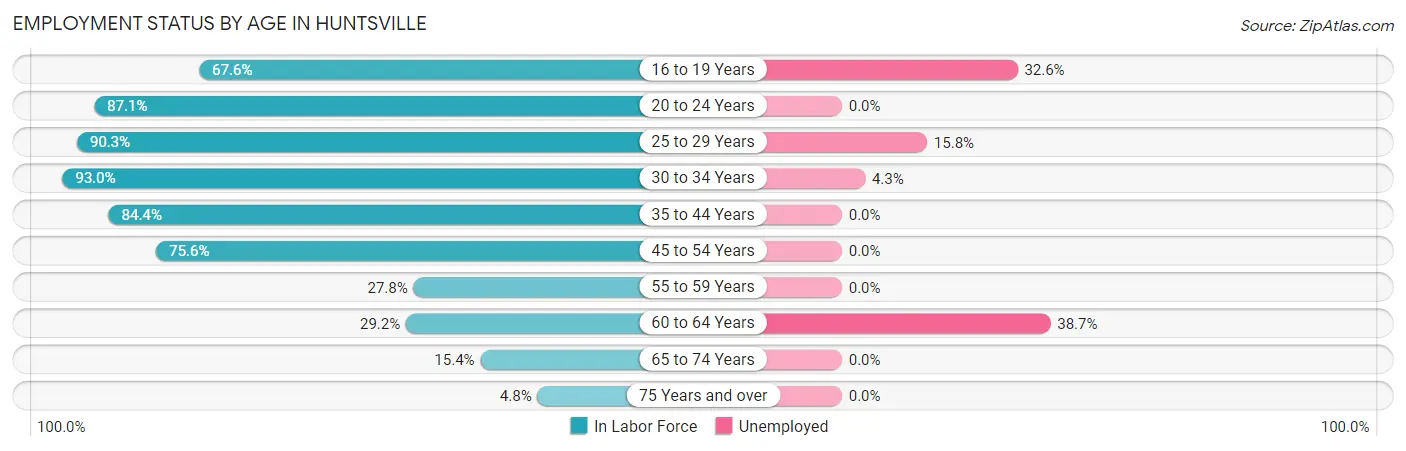
| Age Bracket | In Labor Force | Unemployed |
| 16 to 19 Years | 46 (67.6%) | 15 (32.6%) |
| 20 to 24 Years | 108 (87.1%) | 0 (0.0%) |
| 25 to 29 Years | 196 (90.3%) | 31 (15.8%) |
| 30 to 34 Years | 304 (93.0%) | 13 (4.3%) |
| 35 to 44 Years | 286 (84.4%) | 0 (0.0%) |
| 45 to 54 Years | 161 (75.6%) | 0 (0.0%) |
| 55 to 59 Years | 40 (27.8%) | 0 (0.0%) |
| 60 to 64 Years | 31 (29.2%) | 12 (38.7%) |
| 65 to 74 Years | 20 (15.4%) | 0 (0.0%) |
| 75 Years and over | 11 (4.8%) | 0 (0.0%) |
| Total | 1,203 (63.5%) | 71 (5.9%) |
Employment Status by Educational Attainment in Huntsville
According to labor force statistics for Huntsville, 75.6% of individuals (1,018) out of the total population between 25 and 64 years of age (1,346) are in the labor force, with 5.5% or 56 of them being unemployed. The group with the highest labor force participation rate are those with the educational attainment of college / associate degree, with 95.0% or 286 individuals in the labor force. Within the labor force, individuals with less than high school education have the highest percentage of unemployment, with 15.5% or 40 of them being unemployed.
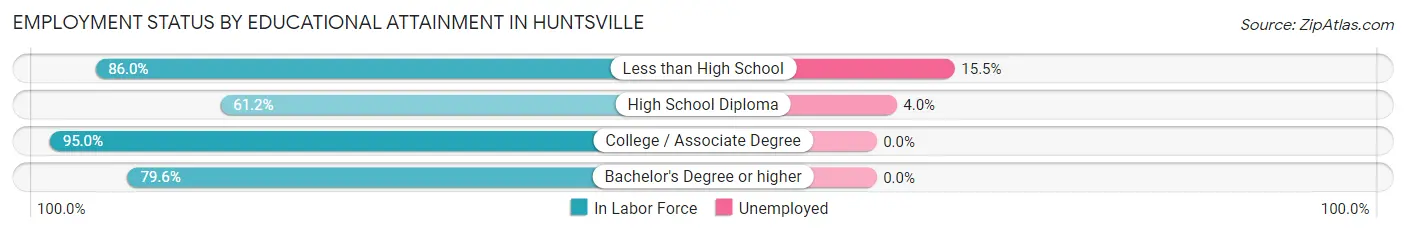
| Educational Attainment | In Labor Force | Unemployed |
| Less than High School | 258 (86.0%) | 46 (15.5%) |
| High School Diploma | 396 (61.2%) | 26 (4.0%) |
| College / Associate Degree | 286 (95.0%) | 0 (0.0%) |
| Bachelor's Degree or higher | 78 (79.6%) | 0 (0.0%) |
| Total | 1,018 (75.6%) | 74 (5.5%) |
Employment Occupations by Sex in Huntsville
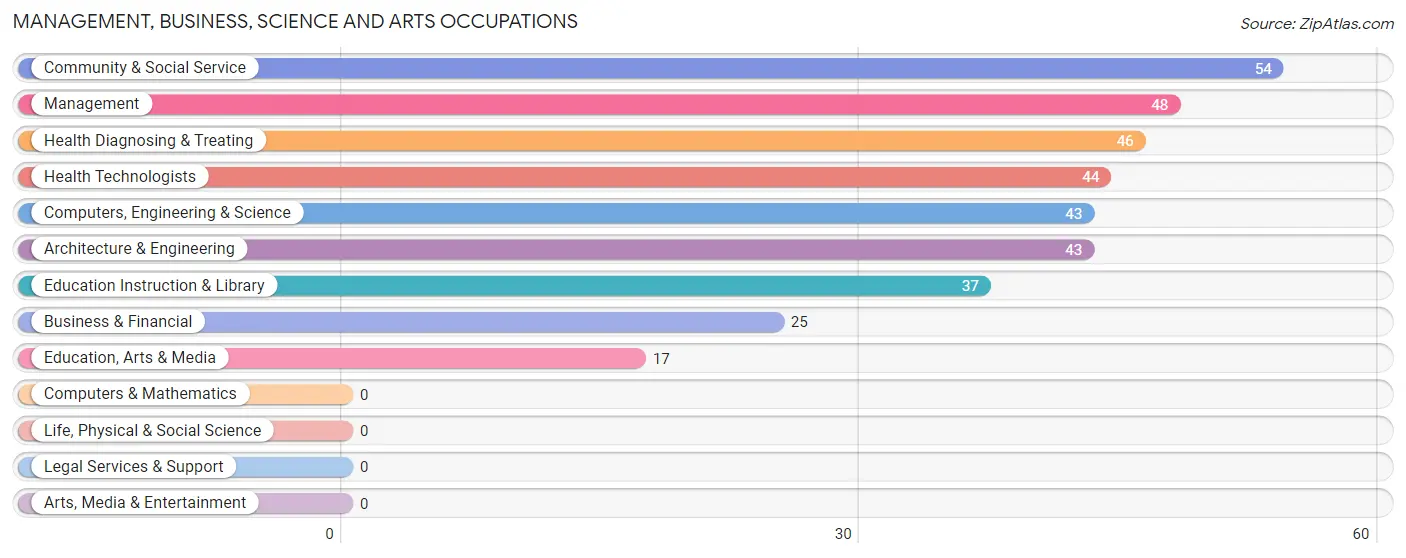
Management, Business, Science and Arts Occupations
The most common Management, Business, Science and Arts occupations in Huntsville are Community & Social Service (54 | 4.8%), Management (48 | 4.2%), Health Diagnosing & Treating (46 | 4.1%), Health Technologists (44 | 3.9%), and Computers, Engineering & Science (43 | 3.8%).
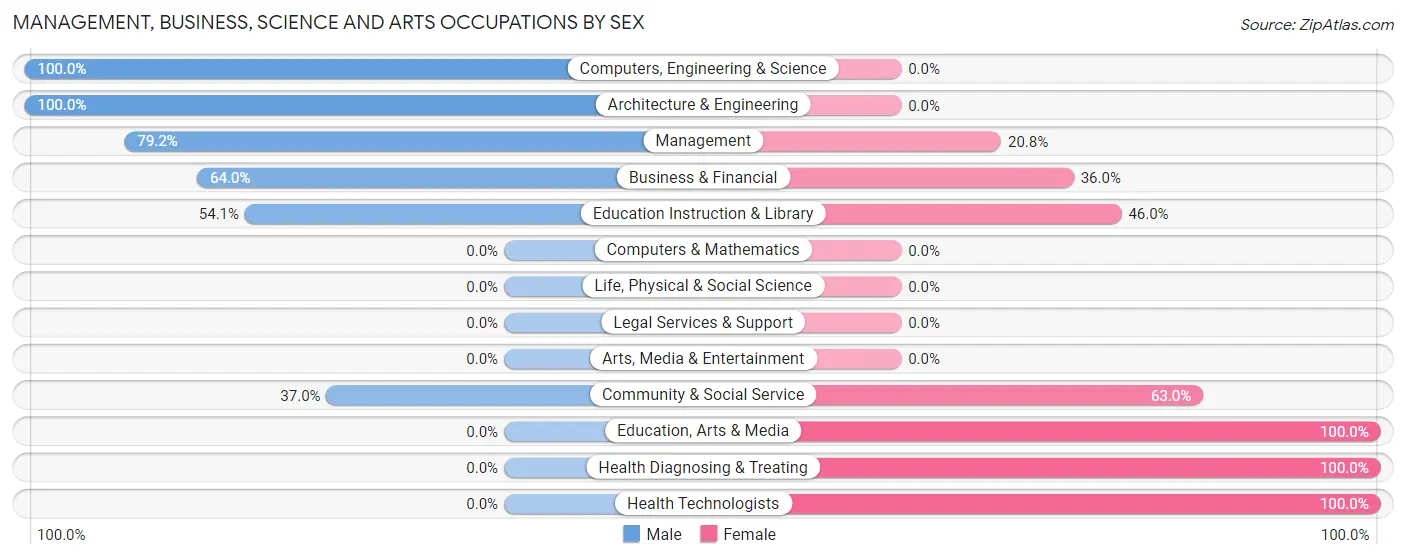
Management, Business, Science and Arts Occupations by Sex
Within the Management, Business, Science and Arts occupations in Huntsville, the most male-oriented occupations are Computers, Engineering & Science (100.0%), Architecture & Engineering (100.0%), and Management (79.2%), while the most female-oriented occupations are Education, Arts & Media (100.0%), Health Diagnosing & Treating (100.0%), and Health Technologists (100.0%).
| Occupation | Male | Female |
| Management | 38 (79.2%) | 10 (20.8%) |
| Business & Financial | 16 (64.0%) | 9 (36.0%) |
| Computers, Engineering & Science | 43 (100.0%) | 0 (0.0%) |
| Computers & Mathematics | 0 (0.0%) | 0 (0.0%) |
| Architecture & Engineering | 43 (100.0%) | 0 (0.0%) |
| Life, Physical & Social Science | 0 (0.0%) | 0 (0.0%) |
| Community & Social Service | 20 (37.0%) | 34 (63.0%) |
| Education, Arts & Media | 0 (0.0%) | 17 (100.0%) |
| Legal Services & Support | 0 (0.0%) | 0 (0.0%) |
| Education Instruction & Library | 20 (54.0%) | 17 (46.0%) |
| Arts, Media & Entertainment | 0 (0.0%) | 0 (0.0%) |
| Health Diagnosing & Treating | 0 (0.0%) | 46 (100.0%) |
| Health Technologists | 0 (0.0%) | 44 (100.0%) |
| Total (Category) | 117 (54.2%) | 99 (45.8%) |
| Total (Overall) | 574 (50.7%) | 558 (49.3%) |
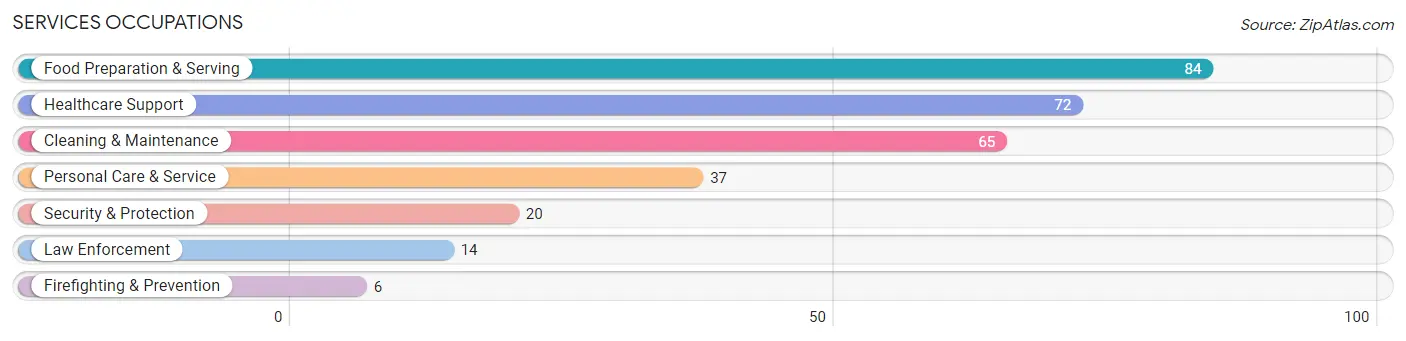
Services Occupations
The most common Services occupations in Huntsville are Food Preparation & Serving (84 | 7.4%), Healthcare Support (72 | 6.4%), Cleaning & Maintenance (65 | 5.7%), Personal Care & Service (37 | 3.3%), and Security & Protection (20 | 1.8%).
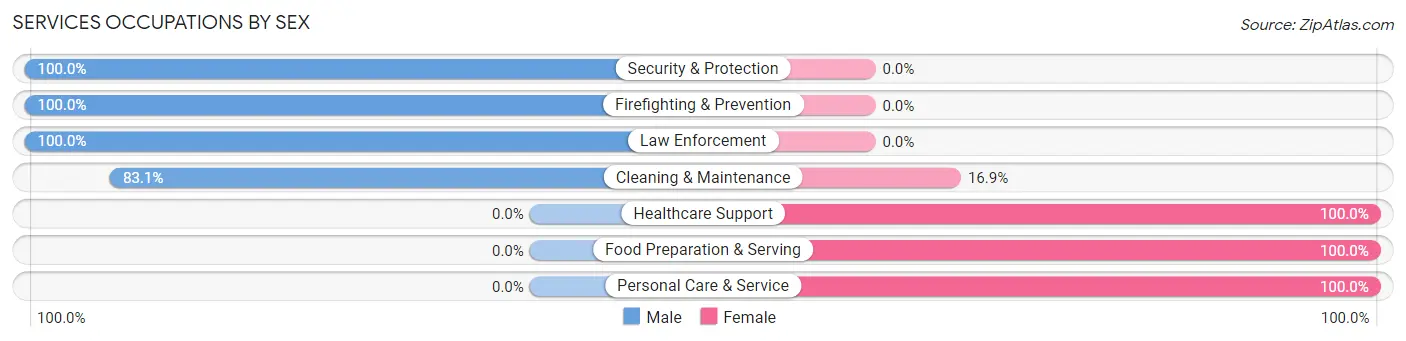
Services Occupations by Sex
Within the Services occupations in Huntsville, the most male-oriented occupations are Security & Protection (100.0%), Firefighting & Prevention (100.0%), and Law Enforcement (100.0%), while the most female-oriented occupations are Healthcare Support (100.0%), Food Preparation & Serving (100.0%), and Personal Care & Service (100.0%).
| Occupation | Male | Female |
| Healthcare Support | 0 (0.0%) | 72 (100.0%) |
| Security & Protection | 20 (100.0%) | 0 (0.0%) |
| Firefighting & Prevention | 6 (100.0%) | 0 (0.0%) |
| Law Enforcement | 14 (100.0%) | 0 (0.0%) |
| Food Preparation & Serving | 0 (0.0%) | 84 (100.0%) |
| Cleaning & Maintenance | 54 (83.1%) | 11 (16.9%) |
| Personal Care & Service | 0 (0.0%) | 37 (100.0%) |
| Total (Category) | 74 (26.6%) | 204 (73.4%) |
| Total (Overall) | 574 (50.7%) | 558 (49.3%) |
Sales and Office Occupations
The most common Sales and Office occupations in Huntsville are Sales & Related (68 | 6.0%), and Office & Administration (48 | 4.2%).
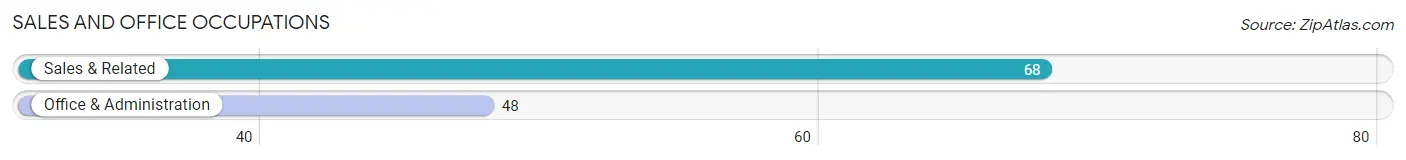
Sales and Office Occupations by Sex
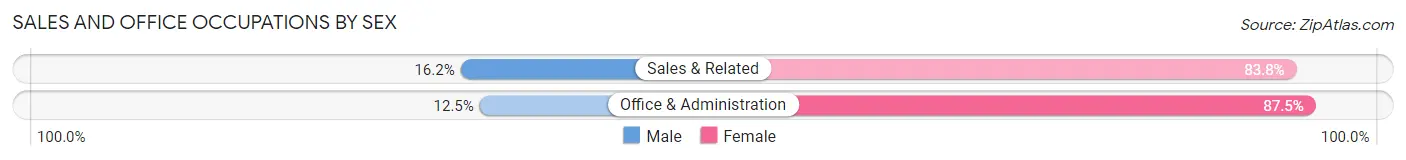
| Occupation | Male | Female |
| Sales & Related | 11 (16.2%) | 57 (83.8%) |
| Office & Administration | 6 (12.5%) | 42 (87.5%) |
| Total (Category) | 17 (14.7%) | 99 (85.3%) |
| Total (Overall) | 574 (50.7%) | 558 (49.3%) |
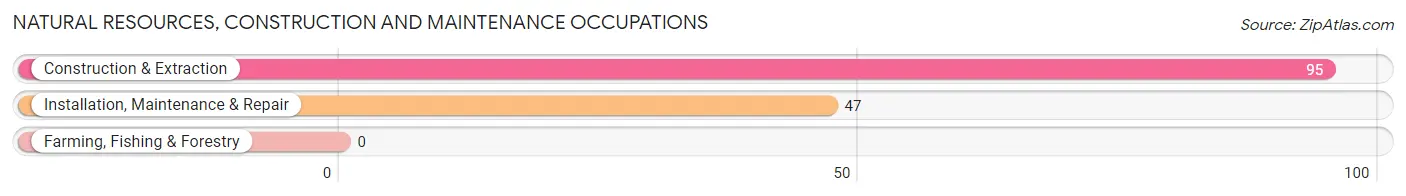
Natural Resources, Construction and Maintenance Occupations
The most common Natural Resources, Construction and Maintenance occupations in Huntsville are Construction & Extraction (95 | 8.4%), and Installation, Maintenance & Repair (47 | 4.2%).
Natural Resources, Construction and Maintenance Occupations by Sex
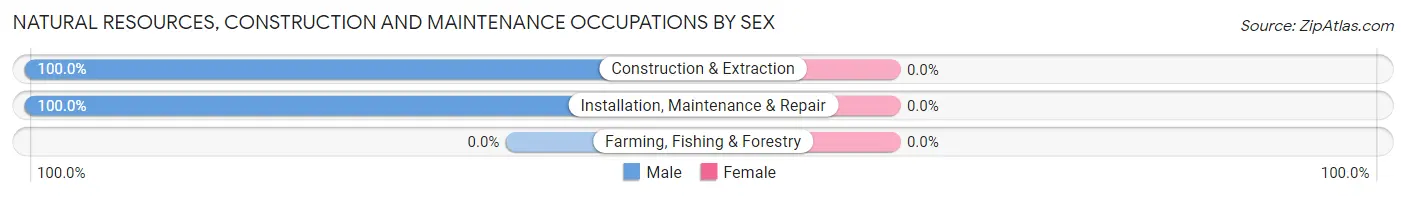
| Occupation | Male | Female |
| Farming, Fishing & Forestry | 0 (0.0%) | 0 (0.0%) |
| Construction & Extraction | 95 (100.0%) | 0 (0.0%) |
| Installation, Maintenance & Repair | 47 (100.0%) | 0 (0.0%) |
| Total (Category) | 142 (100.0%) | 0 (0.0%) |
| Total (Overall) | 574 (50.7%) | 558 (49.3%) |
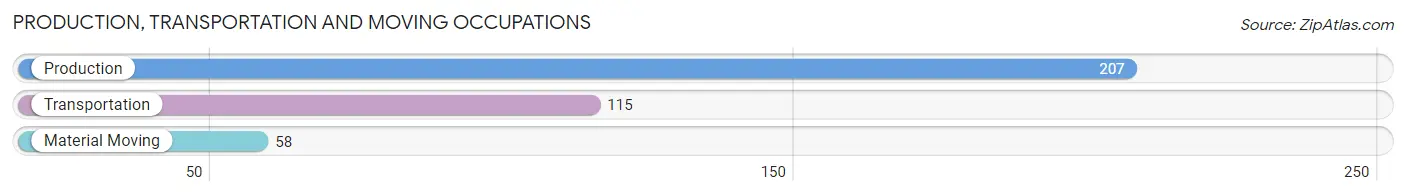
Production, Transportation and Moving Occupations
The most common Production, Transportation and Moving occupations in Huntsville are Production (207 | 18.3%), Transportation (115 | 10.2%), and Material Moving (58 | 5.1%).
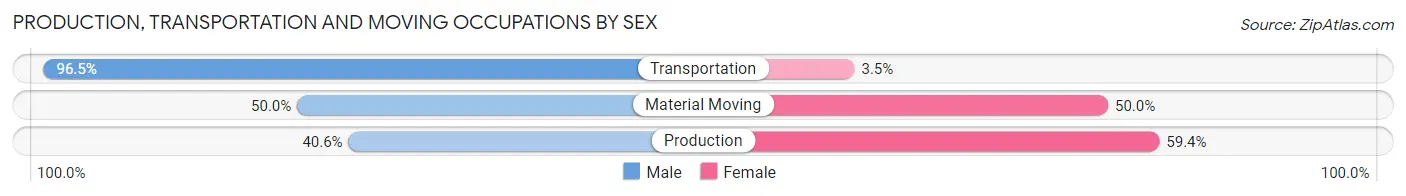
Production, Transportation and Moving Occupations by Sex
| Occupation | Male | Female |
| Production | 84 (40.6%) | 123 (59.4%) |
| Transportation | 111 (96.5%) | 4 (3.5%) |
| Material Moving | 29 (50.0%) | 29 (50.0%) |
| Total (Category) | 224 (59.0%) | 156 (41.0%) |
| Total (Overall) | 574 (50.7%) | 558 (49.3%) |
Employment Industries by Sex in Huntsville
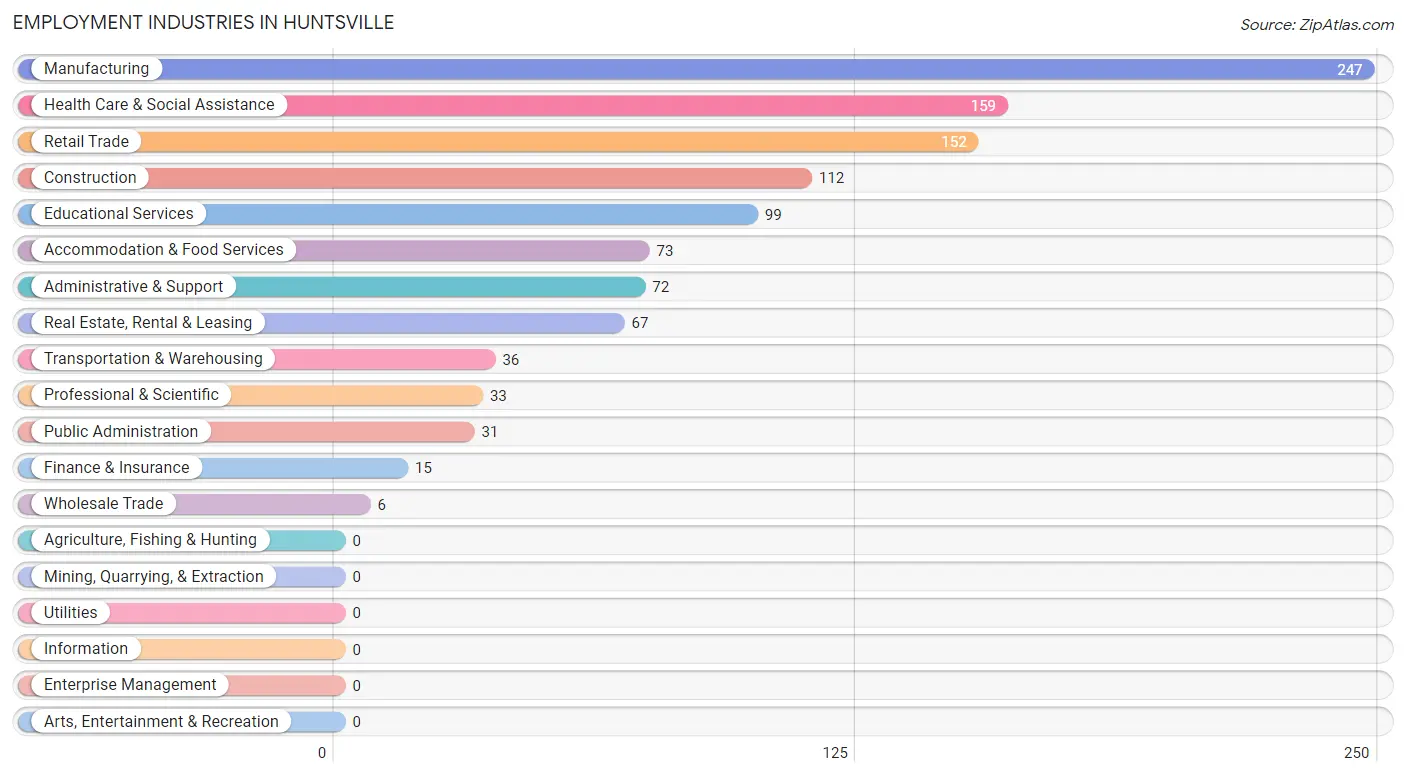
Employment Industries in Huntsville
The major employment industries in Huntsville include Manufacturing (247 | 21.8%), Health Care & Social Assistance (159 | 14.1%), Retail Trade (152 | 13.4%), Construction (112 | 9.9%), and Educational Services (99 | 8.7%).
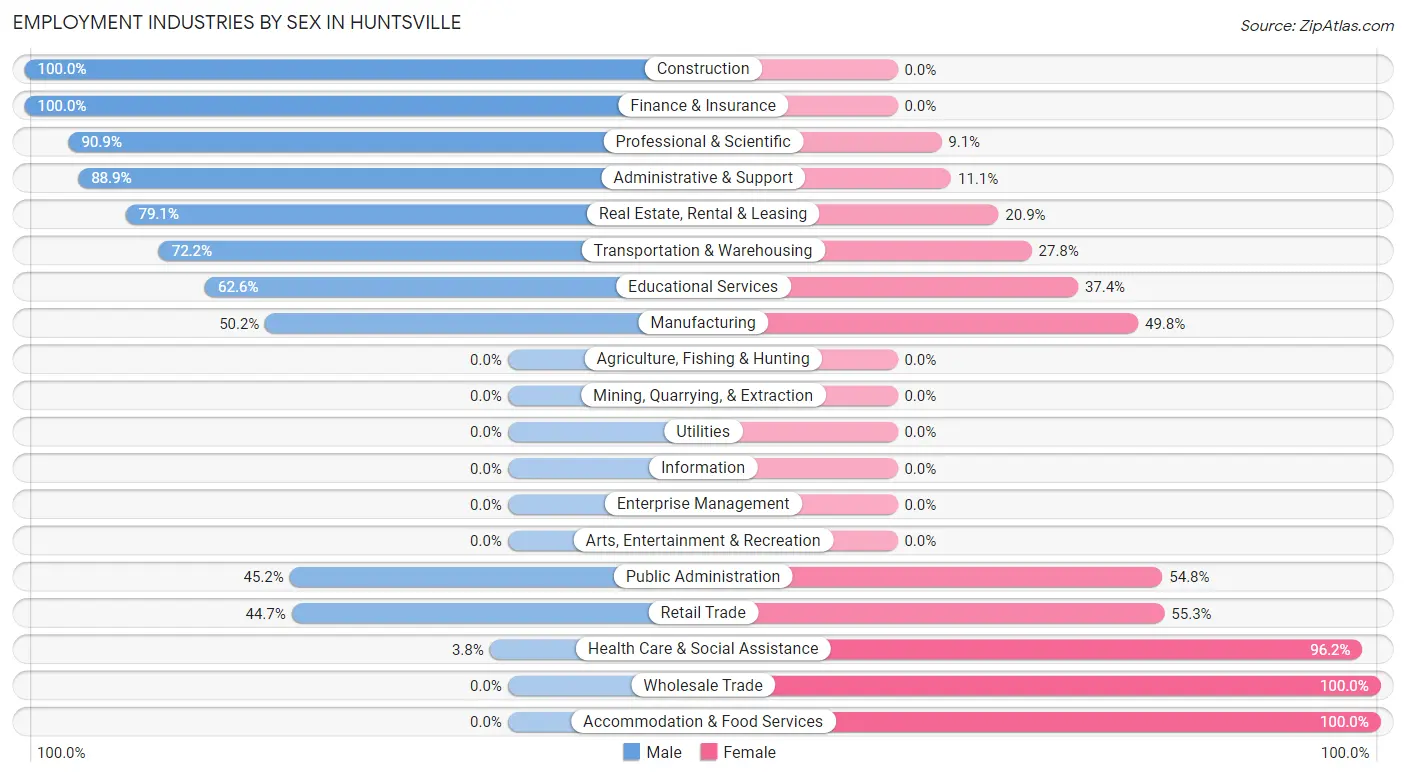
Employment Industries by Sex in Huntsville
The Huntsville industries that see more men than women are Construction (100.0%), Finance & Insurance (100.0%), and Professional & Scientific (90.9%), whereas the industries that tend to have a higher number of women are Wholesale Trade (100.0%), Accommodation & Food Services (100.0%), and Health Care & Social Assistance (96.2%).
| Industry | Male | Female |
| Agriculture, Fishing & Hunting | 0 (0.0%) | 0 (0.0%) |
| Mining, Quarrying, & Extraction | 0 (0.0%) | 0 (0.0%) |
| Construction | 112 (100.0%) | 0 (0.0%) |
| Manufacturing | 124 (50.2%) | 123 (49.8%) |
| Wholesale Trade | 0 (0.0%) | 6 (100.0%) |
| Retail Trade | 68 (44.7%) | 84 (55.3%) |
| Transportation & Warehousing | 26 (72.2%) | 10 (27.8%) |
| Utilities | 0 (0.0%) | 0 (0.0%) |
| Information | 0 (0.0%) | 0 (0.0%) |
| Finance & Insurance | 15 (100.0%) | 0 (0.0%) |
| Real Estate, Rental & Leasing | 53 (79.1%) | 14 (20.9%) |
| Professional & Scientific | 30 (90.9%) | 3 (9.1%) |
| Enterprise Management | 0 (0.0%) | 0 (0.0%) |
| Administrative & Support | 64 (88.9%) | 8 (11.1%) |
| Educational Services | 62 (62.6%) | 37 (37.4%) |
| Health Care & Social Assistance | 6 (3.8%) | 153 (96.2%) |
| Arts, Entertainment & Recreation | 0 (0.0%) | 0 (0.0%) |
| Accommodation & Food Services | 0 (0.0%) | 73 (100.0%) |
| Public Administration | 14 (45.2%) | 17 (54.8%) |
| Total | 574 (50.7%) | 558 (49.3%) |
Education in Huntsville
School Enrollment in Huntsville
The most common levels of schooling among the 904 students in Huntsville are middle school (325 | 35.9%), elementary school (265 | 29.3%), and high school (96 | 10.6%).
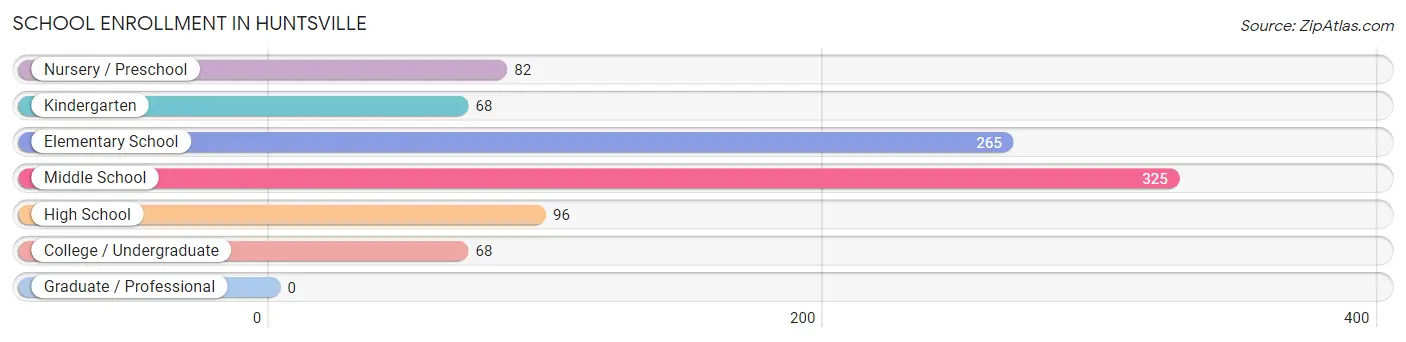
| School Level | # Students | % Students |
| Nursery / Preschool | 82 | 9.1% |
| Kindergarten | 68 | 7.5% |
| Elementary School | 265 | 29.3% |
| Middle School | 325 | 35.9% |
| High School | 96 | 10.6% |
| College / Undergraduate | 68 | 7.5% |
| Graduate / Professional | 0 | 0.0% |
| Total | 904 | 100.0% |
School Enrollment by Age by Funding Source in Huntsville
Out of a total of 904 students who are enrolled in schools in Huntsville, 48 (5.3%) attend a private institution, while the remaining 856 (94.7%) are enrolled in public schools. The age group of 3 to 4 year olds has the highest likelihood of being enrolled in private schools, with 28 (41.2% in the age bracket) enrolled. Conversely, the age group of 5 to 9 year old has the lowest likelihood of being enrolled in a private school, with 339 (100.0% in the age bracket) attending a public institution.
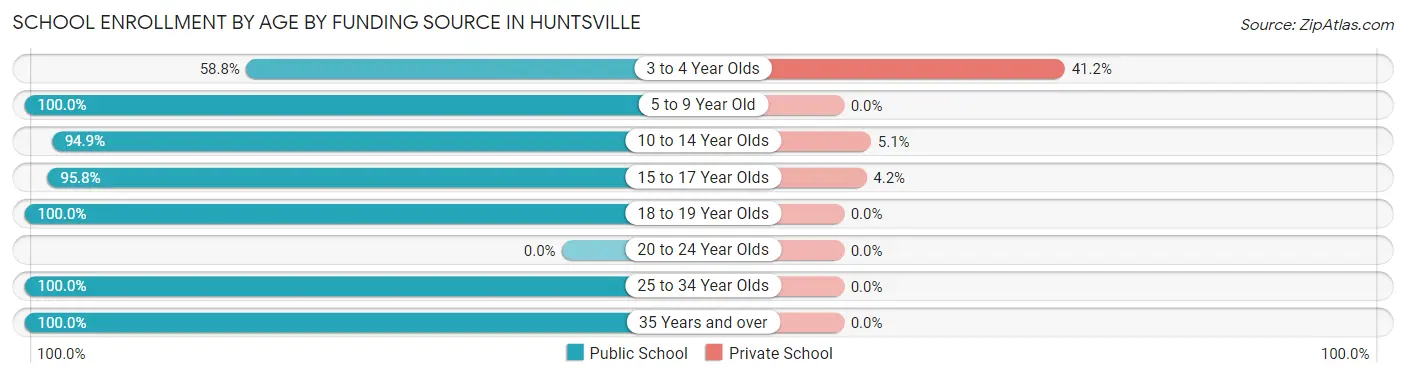
| Age Bracket | Public School | Private School |
| 3 to 4 Year Olds | 40 (58.8%) | 28 (41.2%) |
| 5 to 9 Year Old | 339 (100.0%) | 0 (0.0%) |
| 10 to 14 Year Olds | 319 (94.9%) | 17 (5.1%) |
| 15 to 17 Year Olds | 68 (95.8%) | 3 (4.2%) |
| 18 to 19 Year Olds | 22 (100.0%) | 0 (0.0%) |
| 20 to 24 Year Olds | 0 (0.0%) | 0 (0.0%) |
| 25 to 34 Year Olds | 48 (100.0%) | 0 (0.0%) |
| 35 Years and over | 20 (100.0%) | 0 (0.0%) |
| Total | 856 (94.7%) | 48 (5.3%) |
Educational Attainment by Field of Study in Huntsville
Bio, nature & agricultural (28 | 23.9%), education (28 | 23.9%), psychology (17 | 14.5%), physical & health sciences (10 | 8.6%), and engineering (8 | 6.8%) are the most common fields of study among 117 individuals in Huntsville who have obtained a bachelor's degree or higher.
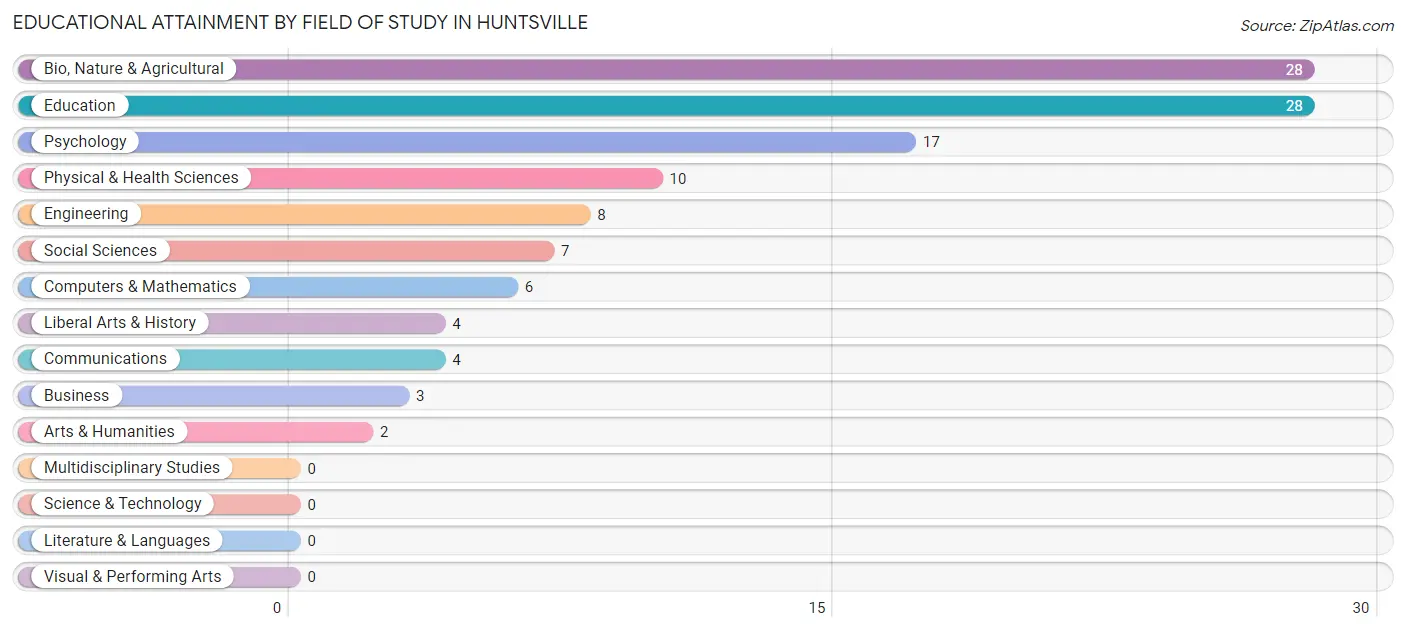
| Field of Study | # Graduates | % Graduates |
| Computers & Mathematics | 6 | 5.1% |
| Bio, Nature & Agricultural | 28 | 23.9% |
| Physical & Health Sciences | 10 | 8.6% |
| Psychology | 17 | 14.5% |
| Social Sciences | 7 | 6.0% |
| Engineering | 8 | 6.8% |
| Multidisciplinary Studies | 0 | 0.0% |
| Science & Technology | 0 | 0.0% |
| Business | 3 | 2.6% |
| Education | 28 | 23.9% |
| Literature & Languages | 0 | 0.0% |
| Liberal Arts & History | 4 | 3.4% |
| Visual & Performing Arts | 0 | 0.0% |
| Communications | 4 | 3.4% |
| Arts & Humanities | 2 | 1.7% |
| Total | 117 | 100.0% |
Transportation & Commute in Huntsville
Vehicle Availability by Sex in Huntsville
The most prevalent vehicle ownership categories in Huntsville are males with 2 vehicles (353, accounting for 61.5%) and females with 2 vehicles (306, making up 63.6%).
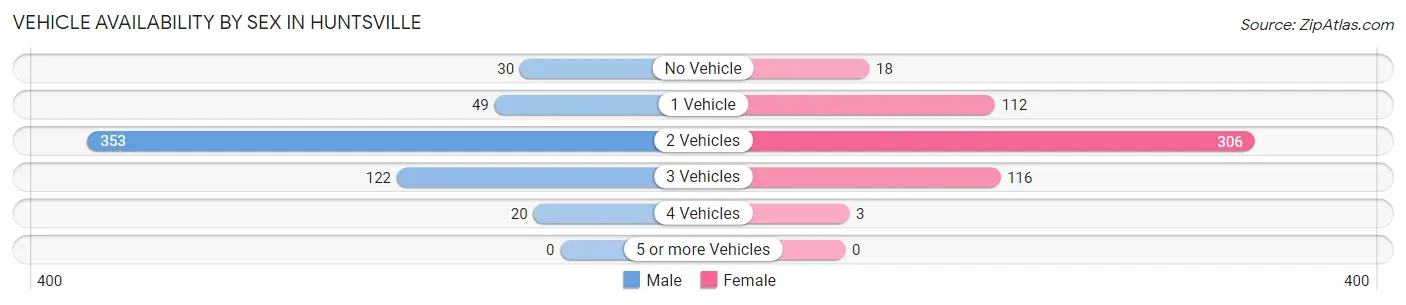
| Vehicles Available | Male | Female |
| No Vehicle | 30 (5.2%) | 18 (3.2%) |
| 1 Vehicle | 49 (8.5%) | 112 (20.2%) |
| 2 Vehicles | 353 (61.5%) | 306 (55.1%) |
| 3 Vehicles | 122 (21.2%) | 116 (20.9%) |
| 4 Vehicles | 20 (3.5%) | 3 (0.5%) |
| 5 or more Vehicles | 0 (0.0%) | 0 (0.0%) |
| Total | 574 (100.0%) | 555 (100.0%) |
Commute Time in Huntsville
The most frequently occuring commute durations in Huntsville are 5 to 9 minutes (346 commuters, 32.3%), 30 to 34 minutes (174 commuters, 16.2%), and 10 to 14 minutes (149 commuters, 13.9%).
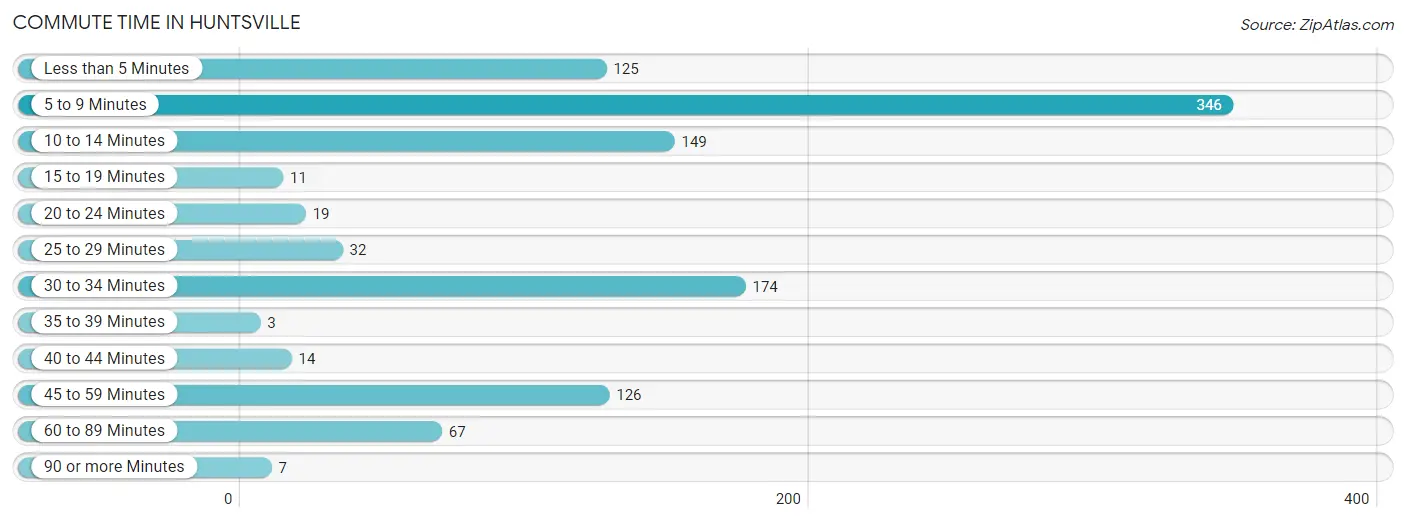
| Commute Time | # Commuters | % Commuters |
| Less than 5 Minutes | 125 | 11.7% |
| 5 to 9 Minutes | 346 | 32.3% |
| 10 to 14 Minutes | 149 | 13.9% |
| 15 to 19 Minutes | 11 | 1.0% |
| 20 to 24 Minutes | 19 | 1.8% |
| 25 to 29 Minutes | 32 | 3.0% |
| 30 to 34 Minutes | 174 | 16.2% |
| 35 to 39 Minutes | 3 | 0.3% |
| 40 to 44 Minutes | 14 | 1.3% |
| 45 to 59 Minutes | 126 | 11.7% |
| 60 to 89 Minutes | 67 | 6.2% |
| 90 or more Minutes | 7 | 0.6% |
Commute Time by Sex in Huntsville
The most common commute times in Huntsville are 5 to 9 minutes (132 commuters, 24.7%) for males and 5 to 9 minutes (214 commuters, 39.7%) for females.
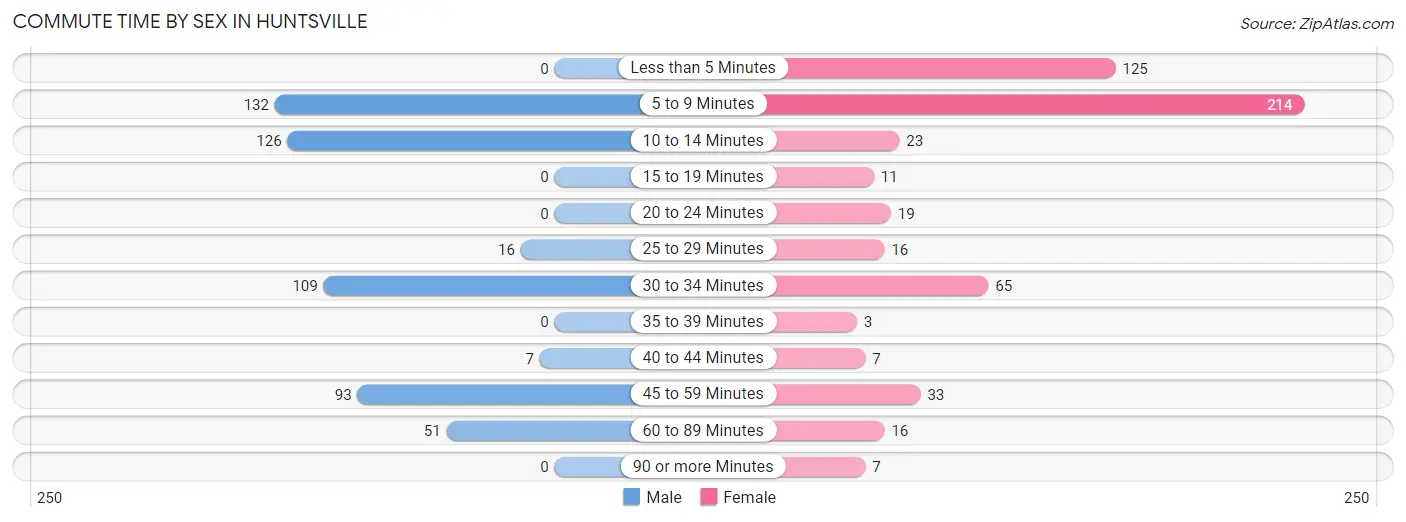
| Commute Time | Male | Female |
| Less than 5 Minutes | 0 (0.0%) | 125 (23.2%) |
| 5 to 9 Minutes | 132 (24.7%) | 214 (39.7%) |
| 10 to 14 Minutes | 126 (23.6%) | 23 (4.3%) |
| 15 to 19 Minutes | 0 (0.0%) | 11 (2.0%) |
| 20 to 24 Minutes | 0 (0.0%) | 19 (3.5%) |
| 25 to 29 Minutes | 16 (3.0%) | 16 (3.0%) |
| 30 to 34 Minutes | 109 (20.4%) | 65 (12.1%) |
| 35 to 39 Minutes | 0 (0.0%) | 3 (0.6%) |
| 40 to 44 Minutes | 7 (1.3%) | 7 (1.3%) |
| 45 to 59 Minutes | 93 (17.4%) | 33 (6.1%) |
| 60 to 89 Minutes | 51 (9.6%) | 16 (3.0%) |
| 90 or more Minutes | 0 (0.0%) | 7 (1.3%) |
Time of Departure to Work by Sex in Huntsville
The most frequent times of departure to work in Huntsville are 7:00 AM to 7:29 AM (154, 28.8%) for males and 7:00 AM to 7:29 AM (195, 36.2%) for females.
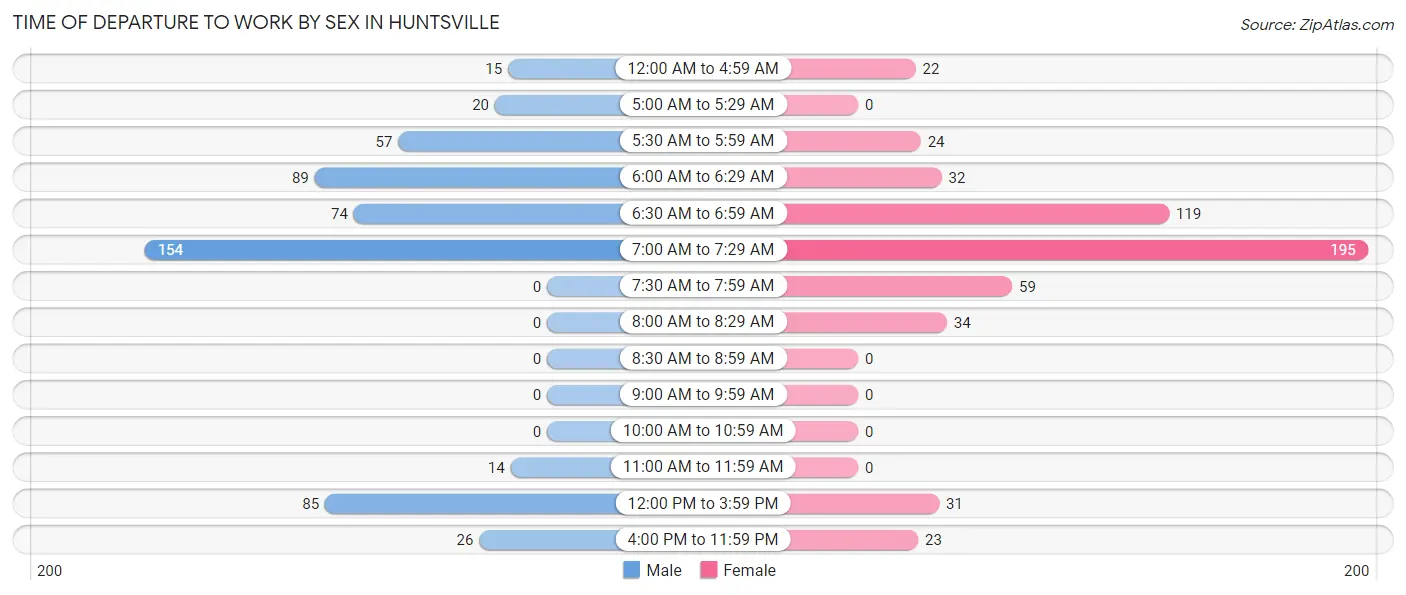
| Time of Departure | Male | Female |
| 12:00 AM to 4:59 AM | 15 (2.8%) | 22 (4.1%) |
| 5:00 AM to 5:29 AM | 20 (3.7%) | 0 (0.0%) |
| 5:30 AM to 5:59 AM | 57 (10.7%) | 24 (4.4%) |
| 6:00 AM to 6:29 AM | 89 (16.7%) | 32 (5.9%) |
| 6:30 AM to 6:59 AM | 74 (13.9%) | 119 (22.1%) |
| 7:00 AM to 7:29 AM | 154 (28.8%) | 195 (36.2%) |
| 7:30 AM to 7:59 AM | 0 (0.0%) | 59 (11.0%) |
| 8:00 AM to 8:29 AM | 0 (0.0%) | 34 (6.3%) |
| 8:30 AM to 8:59 AM | 0 (0.0%) | 0 (0.0%) |
| 9:00 AM to 9:59 AM | 0 (0.0%) | 0 (0.0%) |
| 10:00 AM to 10:59 AM | 0 (0.0%) | 0 (0.0%) |
| 11:00 AM to 11:59 AM | 14 (2.6%) | 0 (0.0%) |
| 12:00 PM to 3:59 PM | 85 (15.9%) | 31 (5.8%) |
| 4:00 PM to 11:59 PM | 26 (4.9%) | 23 (4.3%) |
| Total | 534 (100.0%) | 539 (100.0%) |
Housing Occupancy in Huntsville
Occupancy by Ownership in Huntsville
Of the total 996 dwellings in Huntsville, owner-occupied units account for 524 (52.6%), while renter-occupied units make up 472 (47.4%).
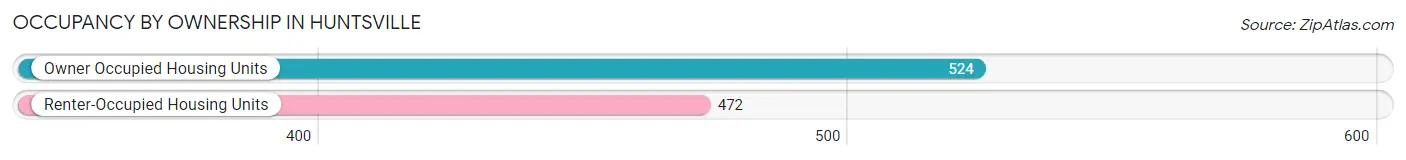
| Occupancy | # Housing Units | % Housing Units |
| Owner Occupied Housing Units | 524 | 52.6% |
| Renter-Occupied Housing Units | 472 | 47.4% |
| Total Occupied Housing Units | 996 | 100.0% |
Occupancy by Household Size in Huntsville
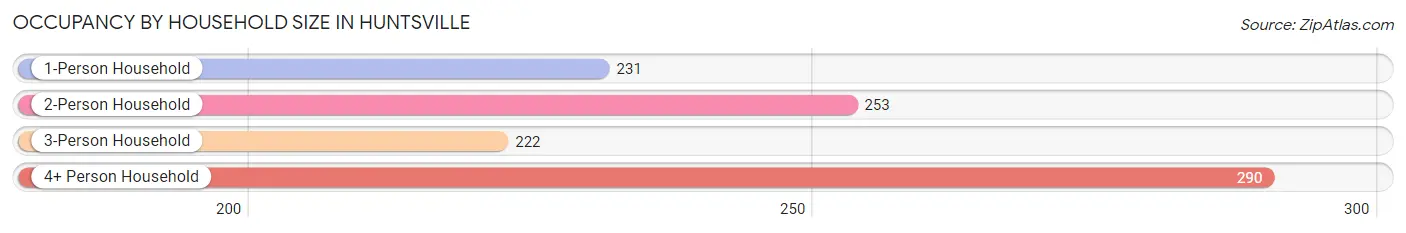
| Household Size | # Housing Units | % Housing Units |
| 1-Person Household | 231 | 23.2% |
| 2-Person Household | 253 | 25.4% |
| 3-Person Household | 222 | 22.3% |
| 4+ Person Household | 290 | 29.1% |
| Total Housing Units | 996 | 100.0% |
Occupancy by Ownership by Household Size in Huntsville
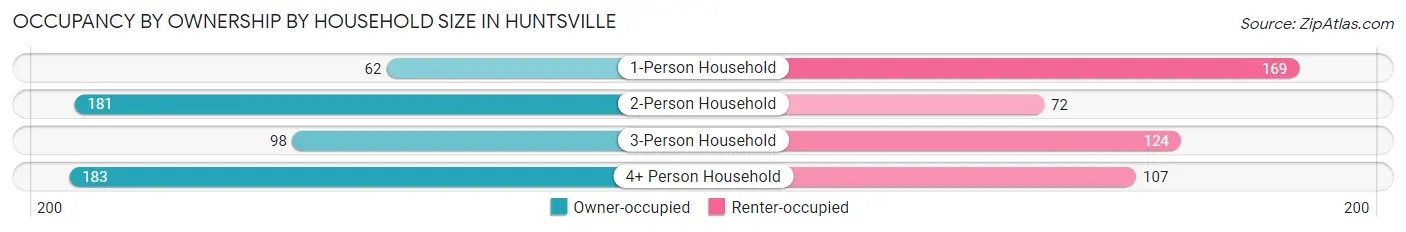
| Household Size | Owner-occupied | Renter-occupied |
| 1-Person Household | 62 (26.8%) | 169 (73.2%) |
| 2-Person Household | 181 (71.5%) | 72 (28.5%) |
| 3-Person Household | 98 (44.1%) | 124 (55.9%) |
| 4+ Person Household | 183 (63.1%) | 107 (36.9%) |
| Total Housing Units | 524 (52.6%) | 472 (47.4%) |
Occupancy by Educational Attainment in Huntsville
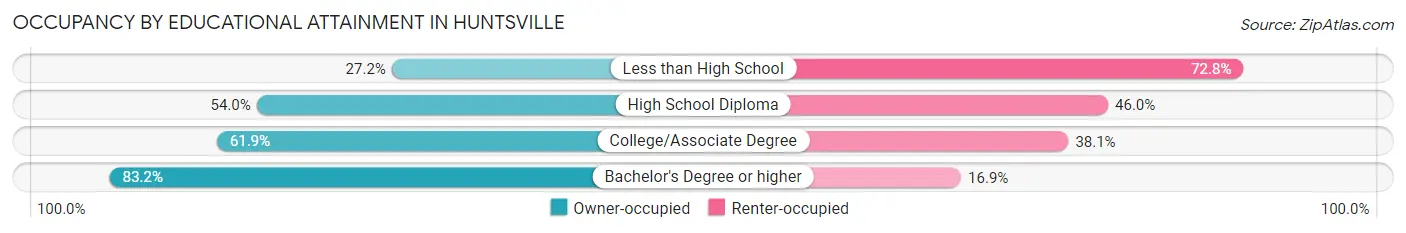
| Household Size | Owner-occupied | Renter-occupied |
| Less than High School | 55 (27.2%) | 147 (72.8%) |
| High School Diploma | 283 (54.0%) | 241 (46.0%) |
| College/Associate Degree | 112 (61.9%) | 69 (38.1%) |
| Bachelor's Degree or higher | 74 (83.2%) | 15 (16.9%) |
Occupancy by Age of Householder in Huntsville
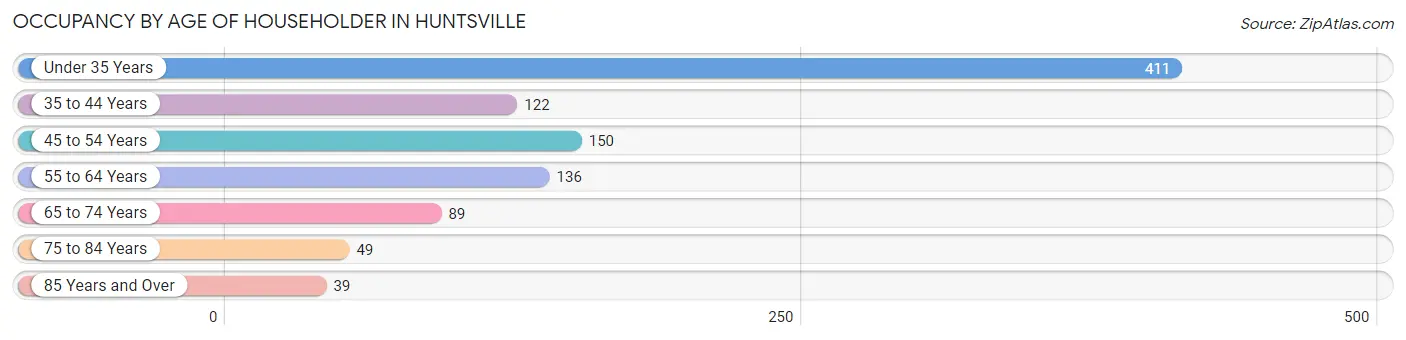
| Age Bracket | # Households | % Households |
| Under 35 Years | 411 | 41.3% |
| 35 to 44 Years | 122 | 12.2% |
| 45 to 54 Years | 150 | 15.1% |
| 55 to 64 Years | 136 | 13.7% |
| 65 to 74 Years | 89 | 8.9% |
| 75 to 84 Years | 49 | 4.9% |
| 85 Years and Over | 39 | 3.9% |
| Total | 996 | 100.0% |
Housing Finances in Huntsville
Median Income by Occupancy in Huntsville
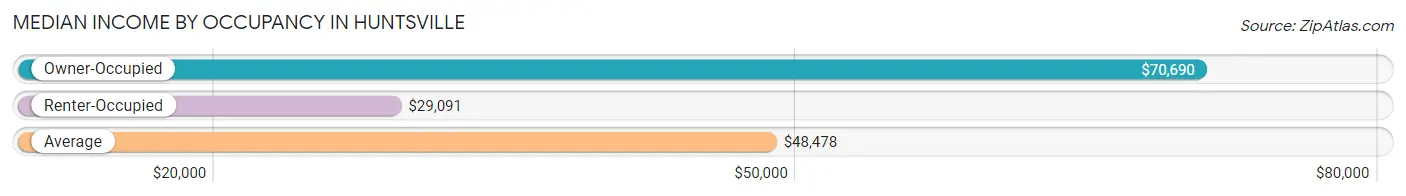
| Occupancy Type | # Households | Median Income |
| Owner-Occupied | 524 (52.6%) | $70,690 |
| Renter-Occupied | 472 (47.4%) | $29,091 |
| Average | 996 (100.0%) | $48,478 |
Occupancy by Householder Income Bracket in Huntsville
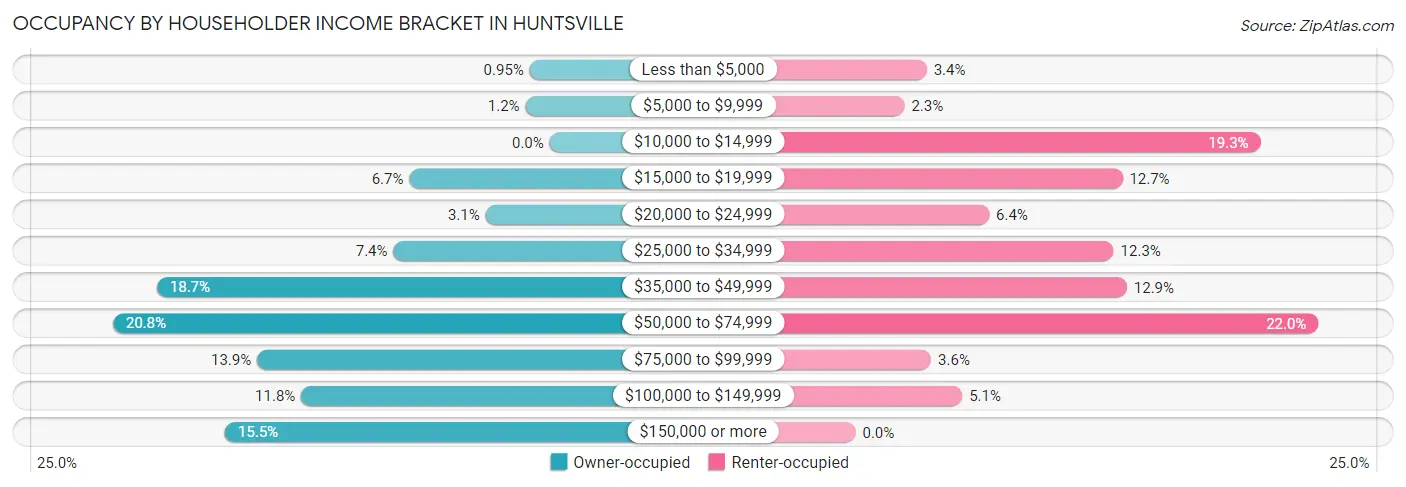
| Income Bracket | Owner-occupied | Renter-occupied |
| Less than $5,000 | 5 (0.9%) | 16 (3.4%) |
| $5,000 to $9,999 | 6 (1.1%) | 11 (2.3%) |
| $10,000 to $14,999 | 0 (0.0%) | 91 (19.3%) |
| $15,000 to $19,999 | 35 (6.7%) | 60 (12.7%) |
| $20,000 to $24,999 | 16 (3.0%) | 30 (6.4%) |
| $25,000 to $34,999 | 39 (7.4%) | 58 (12.3%) |
| $35,000 to $49,999 | 98 (18.7%) | 61 (12.9%) |
| $50,000 to $74,999 | 109 (20.8%) | 104 (22.0%) |
| $75,000 to $99,999 | 73 (13.9%) | 17 (3.6%) |
| $100,000 to $149,999 | 62 (11.8%) | 24 (5.1%) |
| $150,000 or more | 81 (15.5%) | 0 (0.0%) |
| Total | 524 (100.0%) | 472 (100.0%) |
Monthly Housing Cost Tiers in Huntsville
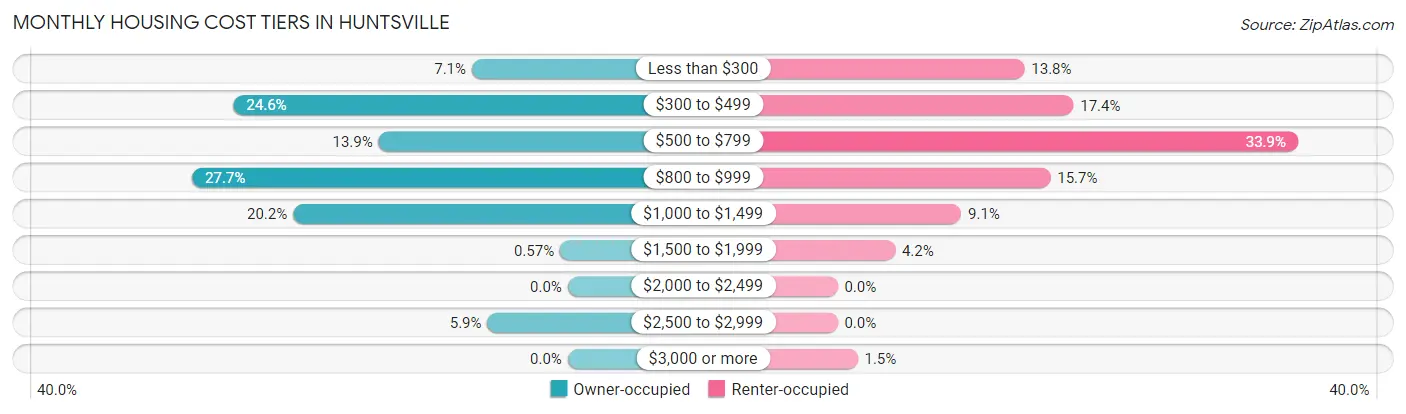
| Monthly Cost | Owner-occupied | Renter-occupied |
| Less than $300 | 37 (7.1%) | 65 (13.8%) |
| $300 to $499 | 129 (24.6%) | 82 (17.4%) |
| $500 to $799 | 73 (13.9%) | 160 (33.9%) |
| $800 to $999 | 145 (27.7%) | 74 (15.7%) |
| $1,000 to $1,499 | 106 (20.2%) | 43 (9.1%) |
| $1,500 to $1,999 | 3 (0.6%) | 20 (4.2%) |
| $2,000 to $2,499 | 0 (0.0%) | 0 (0.0%) |
| $2,500 to $2,999 | 31 (5.9%) | 0 (0.0%) |
| $3,000 or more | 0 (0.0%) | 7 (1.5%) |
| Total | 524 (100.0%) | 472 (100.0%) |
Physical Housing Characteristics in Huntsville
Housing Structures in Huntsville
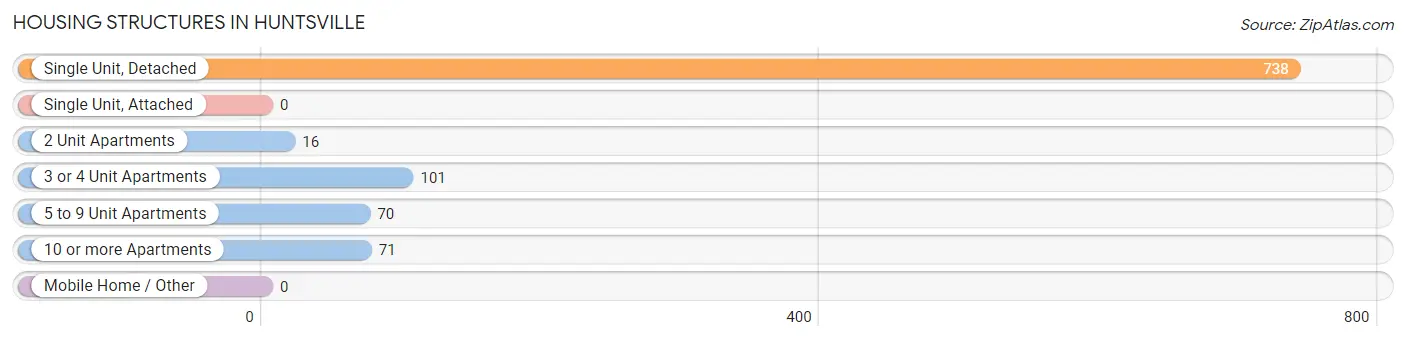
| Structure Type | # Housing Units | % Housing Units |
| Single Unit, Detached | 738 | 74.1% |
| Single Unit, Attached | 0 | 0.0% |
| 2 Unit Apartments | 16 | 1.6% |
| 3 or 4 Unit Apartments | 101 | 10.1% |
| 5 to 9 Unit Apartments | 70 | 7.0% |
| 10 or more Apartments | 71 | 7.1% |
| Mobile Home / Other | 0 | 0.0% |
| Total | 996 | 100.0% |
Housing Structures by Occupancy in Huntsville
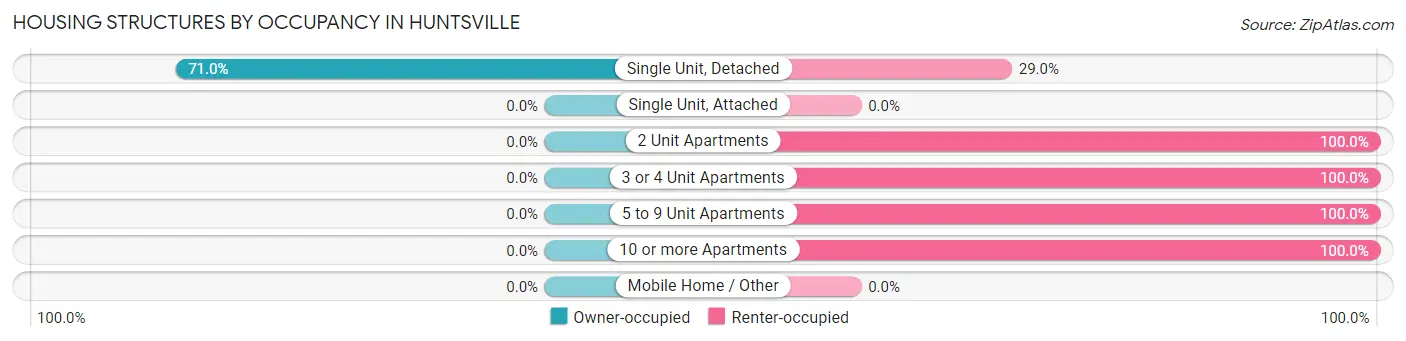
| Structure Type | Owner-occupied | Renter-occupied |
| Single Unit, Detached | 524 (71.0%) | 214 (29.0%) |
| Single Unit, Attached | 0 (0.0%) | 0 (0.0%) |
| 2 Unit Apartments | 0 (0.0%) | 16 (100.0%) |
| 3 or 4 Unit Apartments | 0 (0.0%) | 101 (100.0%) |
| 5 to 9 Unit Apartments | 0 (0.0%) | 70 (100.0%) |
| 10 or more Apartments | 0 (0.0%) | 71 (100.0%) |
| Mobile Home / Other | 0 (0.0%) | 0 (0.0%) |
| Total | 524 (52.6%) | 472 (47.4%) |
Housing Structures by Number of Rooms in Huntsville
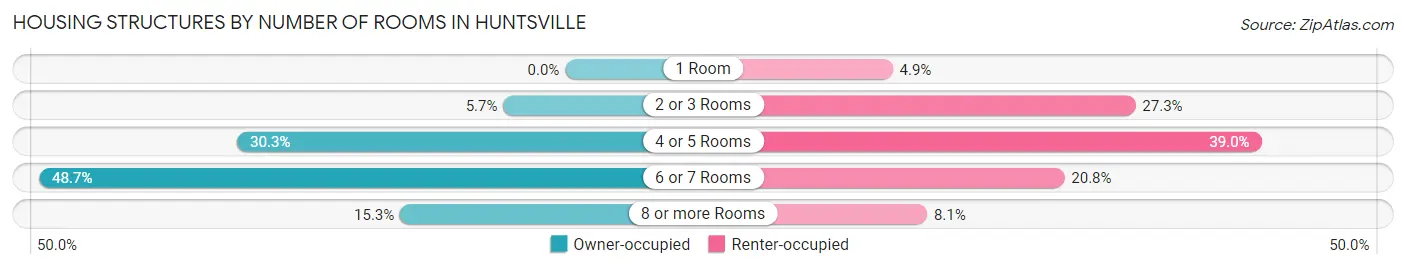
| Number of Rooms | Owner-occupied | Renter-occupied |
| 1 Room | 0 (0.0%) | 23 (4.9%) |
| 2 or 3 Rooms | 30 (5.7%) | 129 (27.3%) |
| 4 or 5 Rooms | 159 (30.3%) | 184 (39.0%) |
| 6 or 7 Rooms | 255 (48.7%) | 98 (20.8%) |
| 8 or more Rooms | 80 (15.3%) | 38 (8.1%) |
| Total | 524 (100.0%) | 472 (100.0%) |
Housing Structure by Heating Type in Huntsville
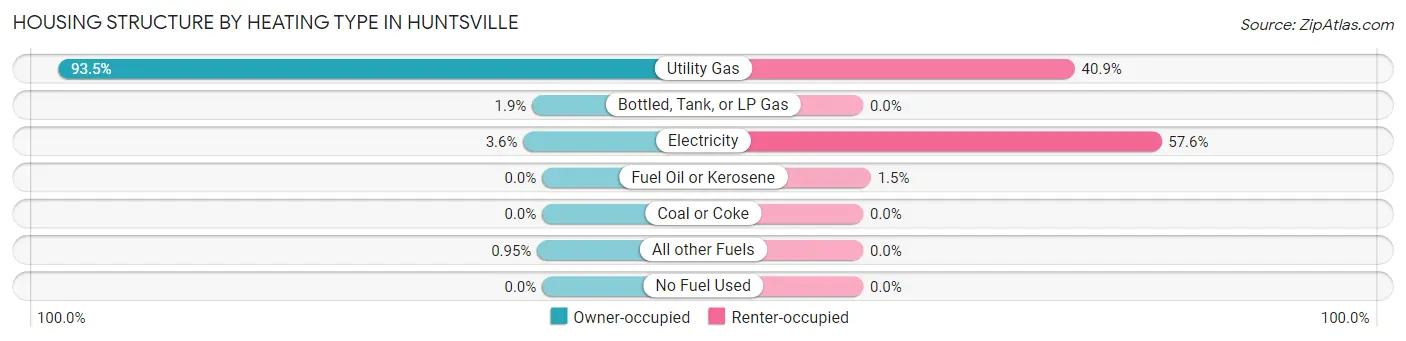
| Heating Type | Owner-occupied | Renter-occupied |
| Utility Gas | 490 (93.5%) | 193 (40.9%) |
| Bottled, Tank, or LP Gas | 10 (1.9%) | 0 (0.0%) |
| Electricity | 19 (3.6%) | 272 (57.6%) |
| Fuel Oil or Kerosene | 0 (0.0%) | 7 (1.5%) |
| Coal or Coke | 0 (0.0%) | 0 (0.0%) |
| All other Fuels | 5 (0.9%) | 0 (0.0%) |
| No Fuel Used | 0 (0.0%) | 0 (0.0%) |
| Total | 524 (100.0%) | 472 (100.0%) |
Household Vehicle Usage in Huntsville
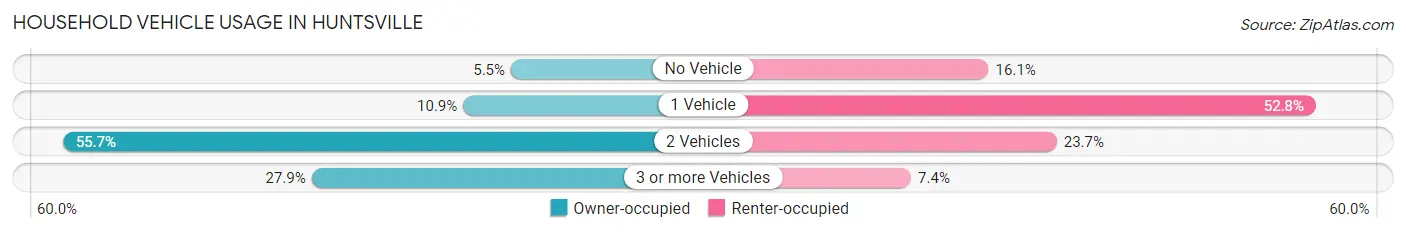
| Vehicles per Household | Owner-occupied | Renter-occupied |
| No Vehicle | 29 (5.5%) | 76 (16.1%) |
| 1 Vehicle | 57 (10.9%) | 249 (52.7%) |
| 2 Vehicles | 292 (55.7%) | 112 (23.7%) |
| 3 or more Vehicles | 146 (27.9%) | 35 (7.4%) |
| Total | 524 (100.0%) | 472 (100.0%) |
Real Estate & Mortgages in Huntsville
Real Estate and Mortgage Overview in Huntsville
| Characteristic | Without Mortgage | With Mortgage |
| Housing Units | 204 | 320 |
| Median Property Value | $130,000 | $133,700 |
| Median Household Income | $57,917 | $43 |
| Monthly Housing Costs | $404 | $0 |
| Real Estate Taxes | - | - |
Property Value by Mortgage Status in Huntsville
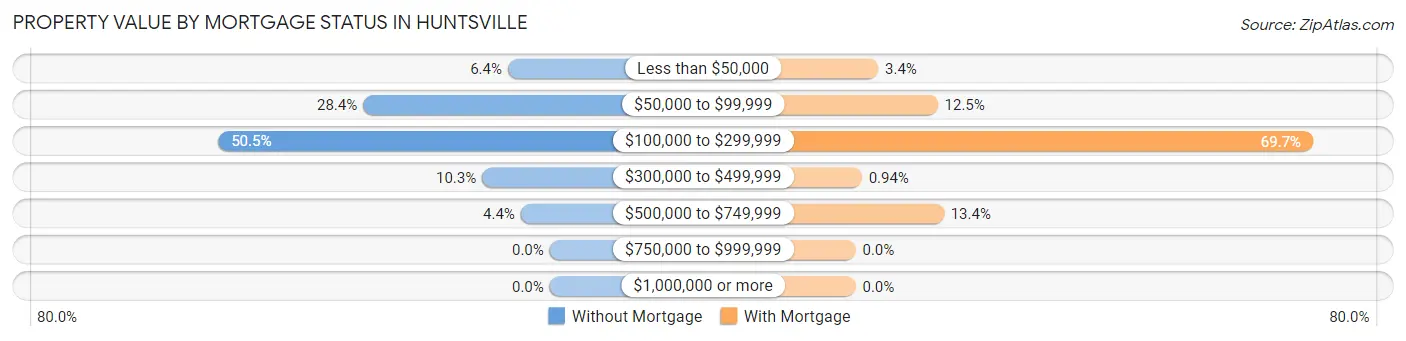
| Property Value | Without Mortgage | With Mortgage |
| Less than $50,000 | 13 (6.4%) | 11 (3.4%) |
| $50,000 to $99,999 | 58 (28.4%) | 40 (12.5%) |
| $100,000 to $299,999 | 103 (50.5%) | 223 (69.7%) |
| $300,000 to $499,999 | 21 (10.3%) | 3 (0.9%) |
| $500,000 to $749,999 | 9 (4.4%) | 43 (13.4%) |
| $750,000 to $999,999 | 0 (0.0%) | 0 (0.0%) |
| $1,000,000 or more | 0 (0.0%) | 0 (0.0%) |
| Total | 204 (100.0%) | 320 (100.0%) |
Household Income by Mortgage Status in Huntsville
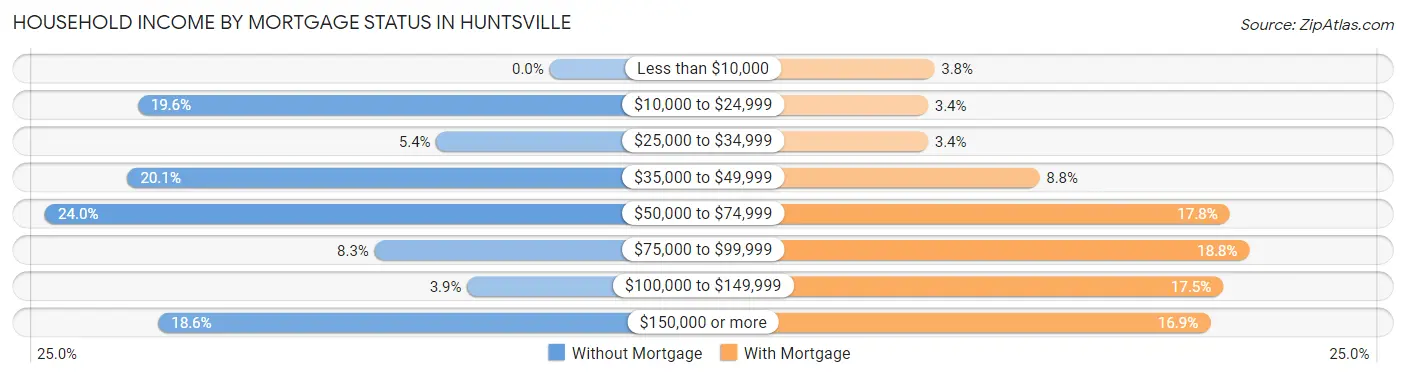
| Household Income | Without Mortgage | With Mortgage |
| Less than $10,000 | 0 (0.0%) | 12 (3.7%) |
| $10,000 to $24,999 | 40 (19.6%) | 11 (3.4%) |
| $25,000 to $34,999 | 11 (5.4%) | 11 (3.4%) |
| $35,000 to $49,999 | 41 (20.1%) | 28 (8.7%) |
| $50,000 to $74,999 | 49 (24.0%) | 57 (17.8%) |
| $75,000 to $99,999 | 17 (8.3%) | 60 (18.8%) |
| $100,000 to $149,999 | 8 (3.9%) | 56 (17.5%) |
| $150,000 or more | 38 (18.6%) | 54 (16.9%) |
| Total | 204 (100.0%) | 320 (100.0%) |
Property Value to Household Income Ratio in Huntsville
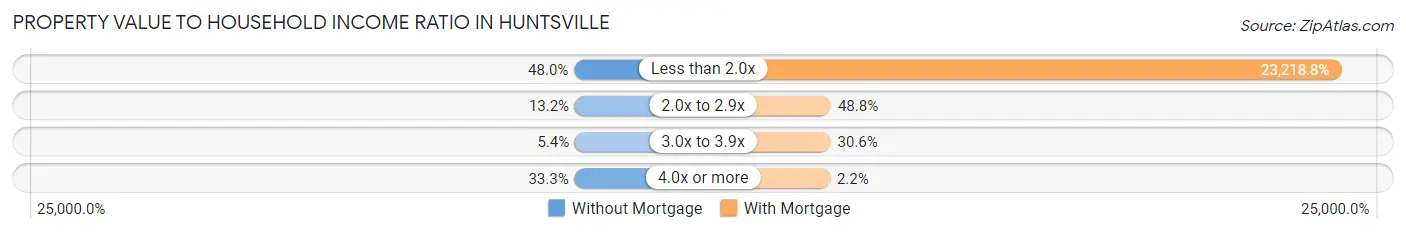
| Value-to-Income Ratio | Without Mortgage | With Mortgage |
| Less than 2.0x | 98 (48.0%) | 74,300 (23,218.8%) |
| 2.0x to 2.9x | 27 (13.2%) | 156 (48.7%) |
| 3.0x to 3.9x | 11 (5.4%) | 98 (30.6%) |
| 4.0x or more | 68 (33.3%) | 7 (2.2%) |
| Total | 204 (100.0%) | 320 (100.0%) |
Real Estate Taxes by Mortgage Status in Huntsville
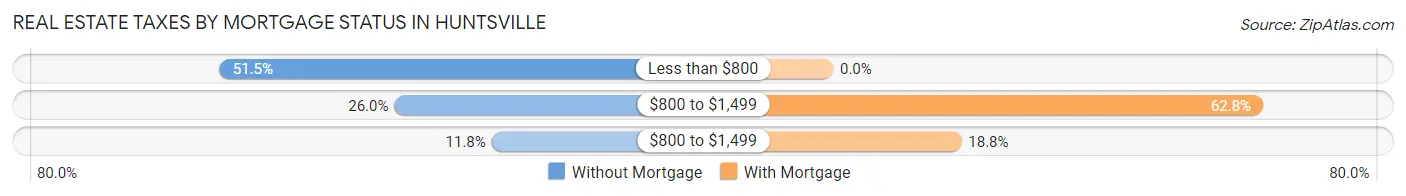
| Property Taxes | Without Mortgage | With Mortgage |
| Less than $800 | 105 (51.5%) | 0 (0.0%) |
| $800 to $1,499 | 53 (26.0%) | 201 (62.8%) |
| $800 to $1,499 | 24 (11.8%) | 60 (18.8%) |
| Total | 204 (100.0%) | 320 (100.0%) |
Health & Disability in Huntsville
Health Insurance Coverage by Age in Huntsville
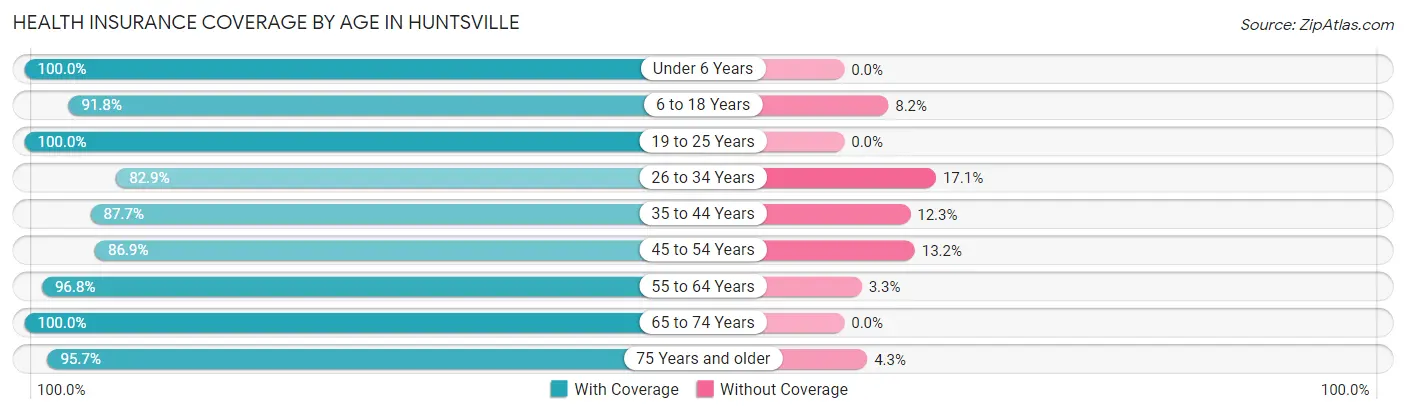
| Age Bracket | With Coverage | Without Coverage |
| Under 6 Years | 407 (100.0%) | 0 (0.0%) |
| 6 to 18 Years | 672 (91.8%) | 60 (8.2%) |
| 19 to 25 Years | 131 (100.0%) | 0 (0.0%) |
| 26 to 34 Years | 451 (82.9%) | 93 (17.1%) |
| 35 to 44 Years | 292 (87.7%) | 41 (12.3%) |
| 45 to 54 Years | 185 (86.9%) | 28 (13.2%) |
| 55 to 64 Years | 238 (96.8%) | 8 (3.3%) |
| 65 to 74 Years | 130 (100.0%) | 0 (0.0%) |
| 75 Years and older | 157 (95.7%) | 7 (4.3%) |
| Total | 2,663 (91.8%) | 237 (8.2%) |
Health Insurance Coverage by Citizenship Status in Huntsville
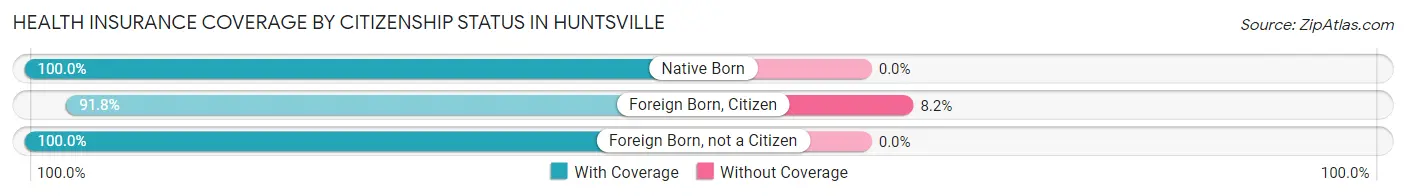
| Citizenship Status | With Coverage | Without Coverage |
| Native Born | 407 (100.0%) | 0 (0.0%) |
| Foreign Born, Citizen | 672 (91.8%) | 60 (8.2%) |
| Foreign Born, not a Citizen | 131 (100.0%) | 0 (0.0%) |
Health Insurance Coverage by Household Income in Huntsville
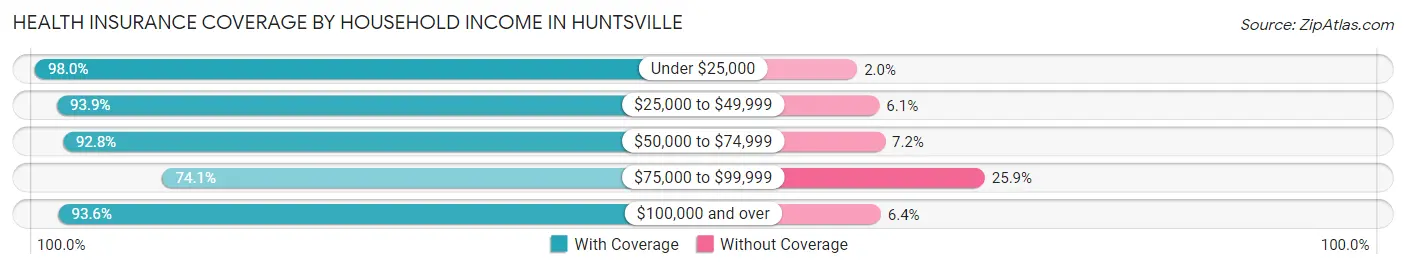
| Household Income | With Coverage | Without Coverage |
| Under $25,000 | 551 (98.0%) | 11 (2.0%) |
| $25,000 to $49,999 | 676 (93.9%) | 44 (6.1%) |
| $50,000 to $74,999 | 659 (92.8%) | 51 (7.2%) |
| $75,000 to $99,999 | 278 (74.1%) | 97 (25.9%) |
| $100,000 and over | 499 (93.6%) | 34 (6.4%) |
Public vs Private Health Insurance Coverage by Age in Huntsville
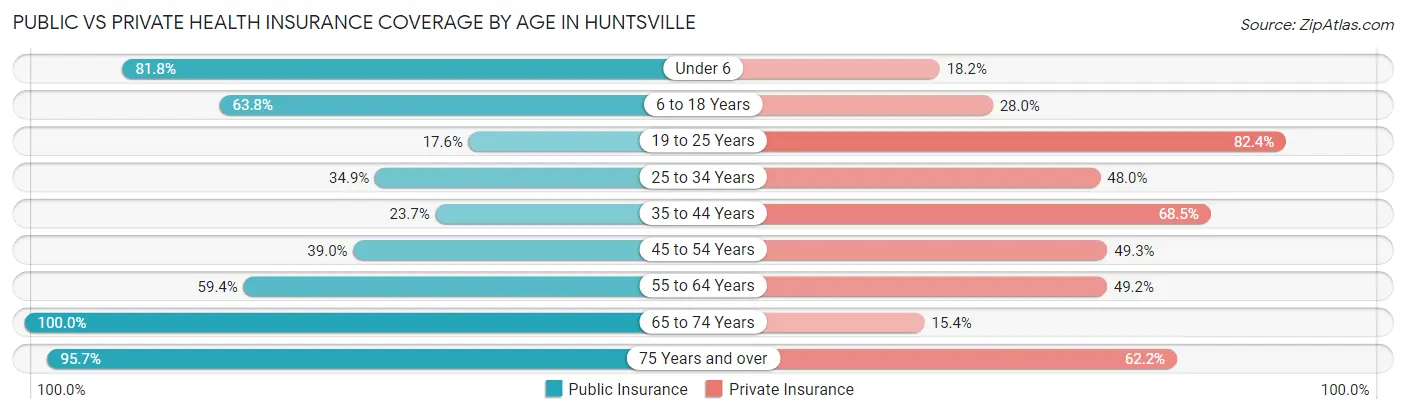
| Age Bracket | Public Insurance | Private Insurance |
| Under 6 | 333 (81.8%) | 74 (18.2%) |
| 6 to 18 Years | 467 (63.8%) | 205 (28.0%) |
| 19 to 25 Years | 23 (17.6%) | 108 (82.4%) |
| 25 to 34 Years | 190 (34.9%) | 261 (48.0%) |
| 35 to 44 Years | 79 (23.7%) | 228 (68.5%) |
| 45 to 54 Years | 83 (39.0%) | 105 (49.3%) |
| 55 to 64 Years | 146 (59.4%) | 121 (49.2%) |
| 65 to 74 Years | 130 (100.0%) | 20 (15.4%) |
| 75 Years and over | 157 (95.7%) | 102 (62.2%) |
| Total | 1,608 (55.4%) | 1,224 (42.2%) |
Disability Status by Sex by Age in Huntsville
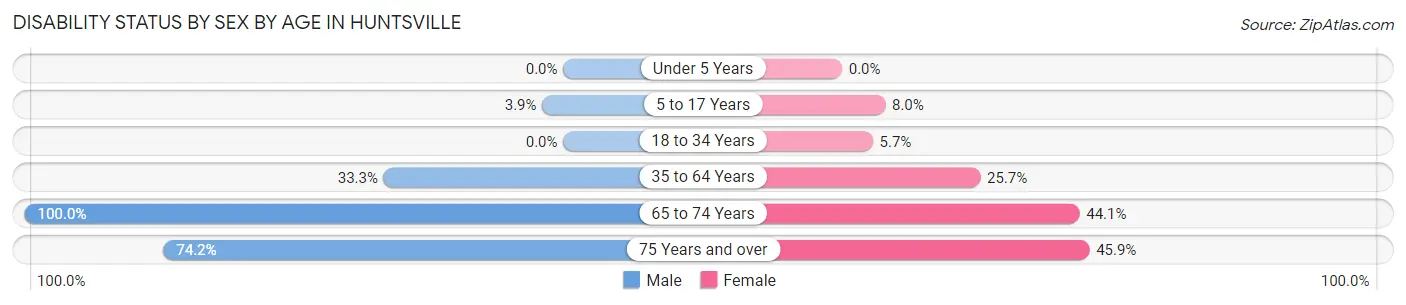
| Age Bracket | Male | Female |
| Under 5 Years | 0 (0.0%) | 0 (0.0%) |
| 5 to 17 Years | 16 (3.9%) | 28 (8.0%) |
| 18 to 34 Years | 0 (0.0%) | 25 (5.7%) |
| 35 to 64 Years | 138 (33.3%) | 97 (25.7%) |
| 65 to 74 Years | 37 (100.0%) | 41 (44.1%) |
| 75 Years and over | 49 (74.2%) | 45 (45.9%) |
Disability Class by Sex by Age in Huntsville
Disability Class: Hearing Difficulty
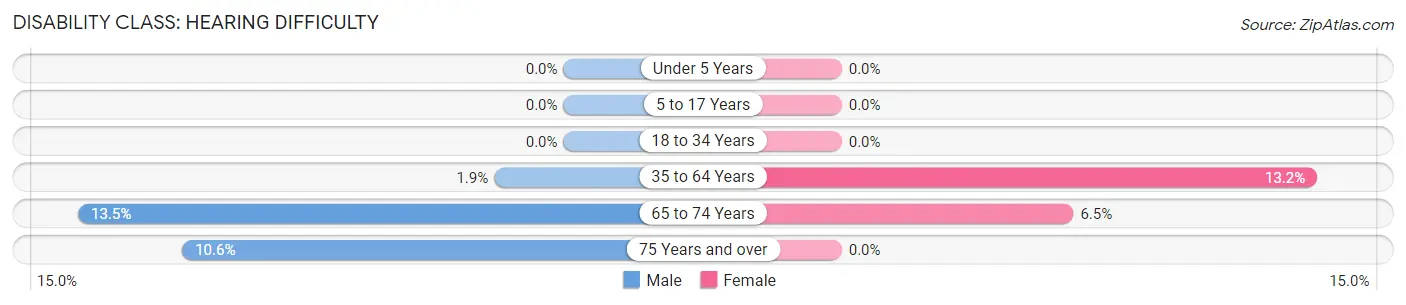
| Age Bracket | Male | Female |
| Under 5 Years | 0 (0.0%) | 0 (0.0%) |
| 5 to 17 Years | 0 (0.0%) | 0 (0.0%) |
| 18 to 34 Years | 0 (0.0%) | 0 (0.0%) |
| 35 to 64 Years | 8 (1.9%) | 50 (13.2%) |
| 65 to 74 Years | 5 (13.5%) | 6 (6.5%) |
| 75 Years and over | 7 (10.6%) | 0 (0.0%) |
Disability Class: Vision Difficulty
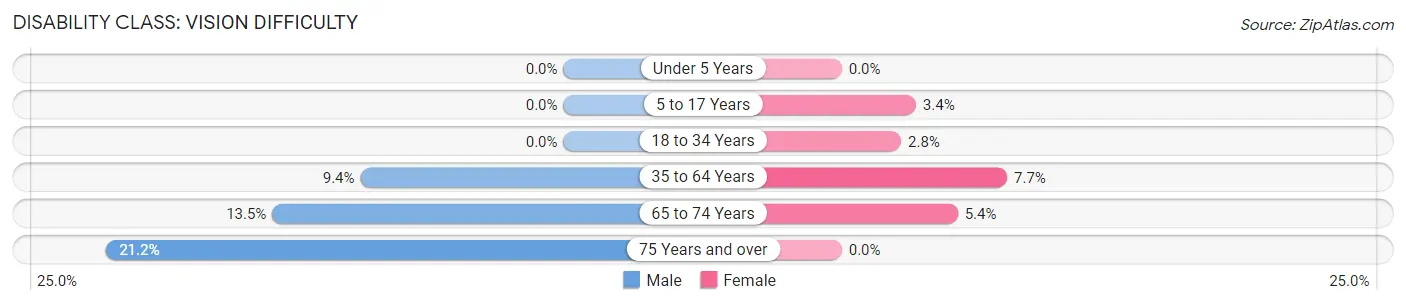
| Age Bracket | Male | Female |
| Under 5 Years | 0 (0.0%) | 0 (0.0%) |
| 5 to 17 Years | 0 (0.0%) | 12 (3.4%) |
| 18 to 34 Years | 0 (0.0%) | 12 (2.8%) |
| 35 to 64 Years | 39 (9.4%) | 29 (7.7%) |
| 65 to 74 Years | 5 (13.5%) | 5 (5.4%) |
| 75 Years and over | 14 (21.2%) | 0 (0.0%) |
Disability Class: Cognitive Difficulty
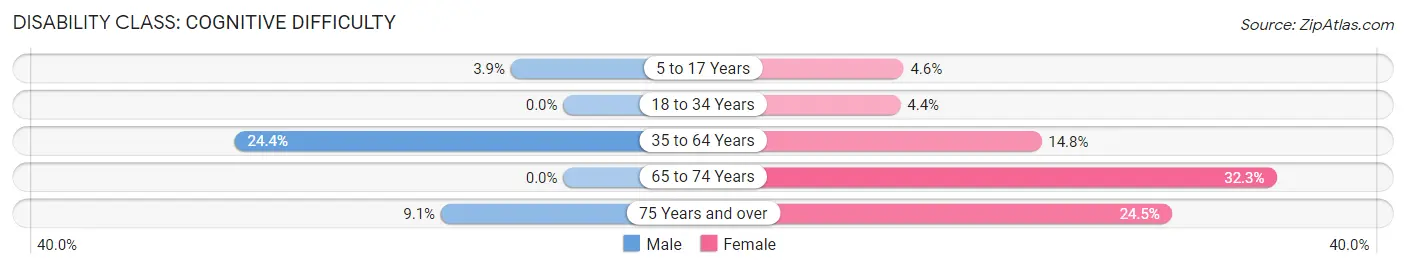
| Age Bracket | Male | Female |
| 5 to 17 Years | 16 (3.9%) | 16 (4.6%) |
| 18 to 34 Years | 0 (0.0%) | 19 (4.3%) |
| 35 to 64 Years | 101 (24.4%) | 56 (14.8%) |
| 65 to 74 Years | 0 (0.0%) | 30 (32.3%) |
| 75 Years and over | 6 (9.1%) | 24 (24.5%) |
Disability Class: Ambulatory Difficulty
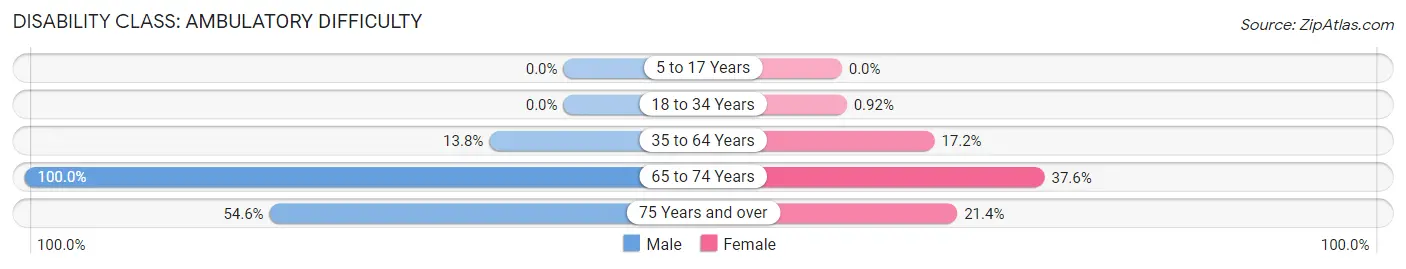
| Age Bracket | Male | Female |
| 5 to 17 Years | 0 (0.0%) | 0 (0.0%) |
| 18 to 34 Years | 0 (0.0%) | 4 (0.9%) |
| 35 to 64 Years | 57 (13.8%) | 65 (17.2%) |
| 65 to 74 Years | 37 (100.0%) | 35 (37.6%) |
| 75 Years and over | 36 (54.5%) | 21 (21.4%) |
Disability Class: Self-Care Difficulty
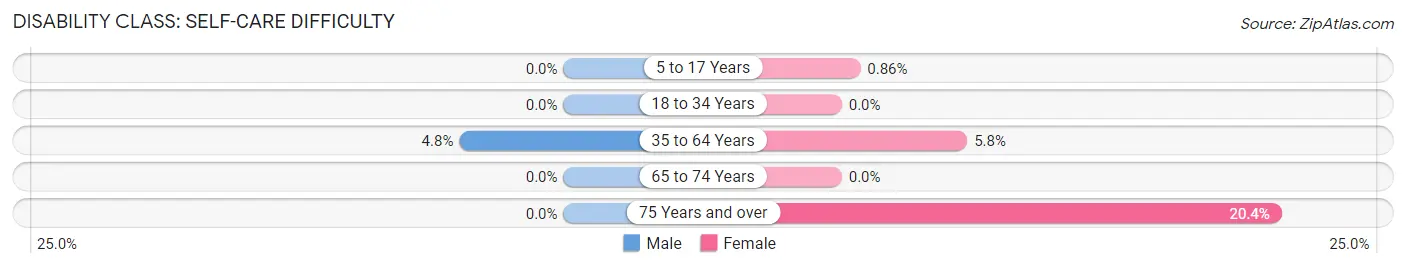
| Age Bracket | Male | Female |
| 5 to 17 Years | 0 (0.0%) | 3 (0.9%) |
| 18 to 34 Years | 0 (0.0%) | 0 (0.0%) |
| 35 to 64 Years | 20 (4.8%) | 22 (5.8%) |
| 65 to 74 Years | 0 (0.0%) | 0 (0.0%) |
| 75 Years and over | 0 (0.0%) | 20 (20.4%) |
Technology Access in Huntsville
Computing Device Access in Huntsville
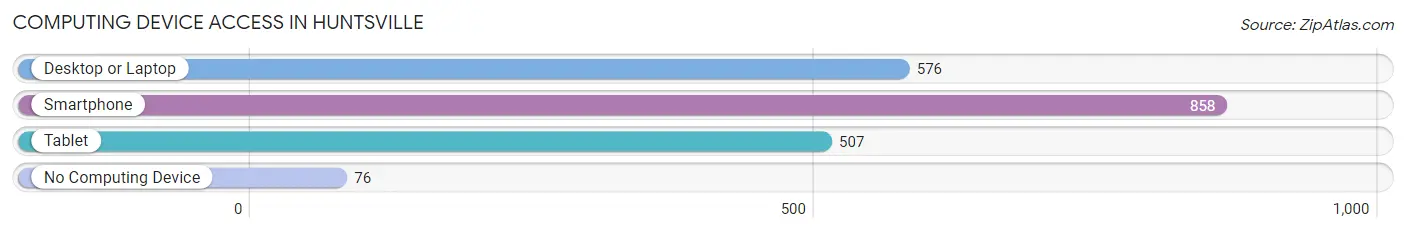
| Device Type | # Households | % Households |
| Desktop or Laptop | 576 | 57.8% |
| Smartphone | 858 | 86.1% |
| Tablet | 507 | 50.9% |
| No Computing Device | 76 | 7.6% |
| Total | 996 | 100.0% |
Internet Access in Huntsville
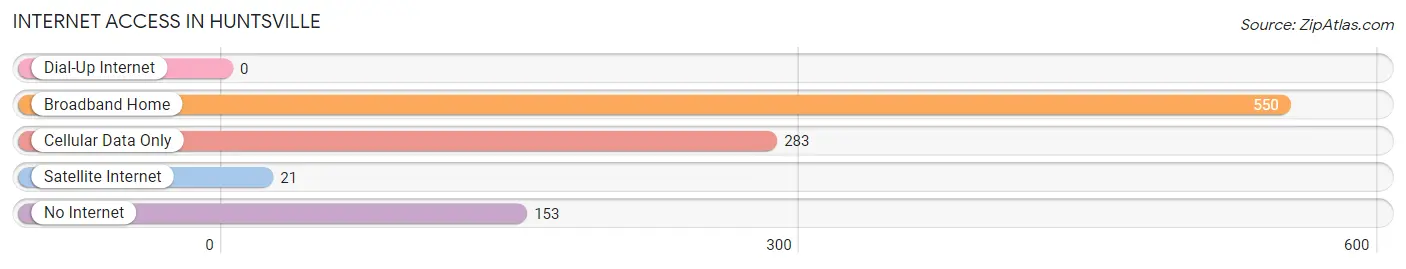
| Internet Type | # Households | % Households |
| Dial-Up Internet | 0 | 0.0% |
| Broadband Home | 550 | 55.2% |
| Cellular Data Only | 283 | 28.4% |
| Satellite Internet | 21 | 2.1% |
| No Internet | 153 | 15.4% |
| Total | 996 | 100.0% |
Huntsville Summary
Huntsville, Arkansas is a small city located in the Ozark Mountains of Northwest Arkansas. It is the county seat of Madison County and is located in the foothills of the Ozark Mountains. The city has a population of 3,731 as of the 2010 census.
History
The area that is now Huntsville was first settled in the early 1800s by settlers from Tennessee and Kentucky. The first post office was established in 1837 and the town was officially incorporated in 1845. The city was named after a local settler, John Hunt, who was a prominent figure in the area.
In the late 1800s, Huntsville was a thriving agricultural center and was known for its production of apples, peaches, and other fruits. The city was also home to several sawmills and gristmills.
In the early 1900s, the city began to experience a decline in population as many of the local farmers moved away to larger cities. The city was also affected by the Great Depression and World War II.
Geography
Huntsville is located in the Ozark Mountains of Northwest Arkansas. It is situated in the foothills of the Ozarks and is surrounded by rolling hills and forests. The city is located at the intersection of State Highway 23 and State Highway 74.
The city has a total area of 2.2 square miles, all of which is land. The city is located at an elevation of 1,072 feet above sea level.
Economy
The economy of Huntsville is largely based on agriculture and tourism. The city is home to several farms that produce apples, peaches, and other fruits. The city is also home to several sawmills and gristmills.
The city is also home to several tourist attractions, including the Ozark Folk Center State Park, which is a living history museum that features traditional Ozark crafts and music. The city is also home to several wineries and is a popular destination for outdoor activities such as hiking, camping, and fishing.
Demographics
As of the 2010 census, the population of Huntsville was 3,731. The racial makeup of the city was 95.3% White, 0.7% African American, 0.3% Native American, 0.2% Asian, 0.1% Pacific Islander, 1.2% from other races, and 2.4% from two or more races. Hispanic or Latino of any race were 3.2% of the population.
The median income for a household in the city was $30,938 and the median income for a family was $37,813. The per capita income for the city was $17,845. About 16.2% of families and 19.2% of the population were below the poverty line, including 25.2% of those under age 18 and 11.2% of those age 65 or over.
Common Questions
What is Per Capita Income in Huntsville?
Per Capita income in Huntsville is $26,453.
What is the Median Family Income in Huntsville?
Median Family Income in Huntsville is $50,500.
What is the Median Household income in Huntsville?
Median Household Income in Huntsville is $48,478.
What is Income or Wage Gap in Huntsville?
Income or Wage Gap in Huntsville is 53.7%.
Women in Huntsville earn 46.3 cents for every dollar earned by a man.
What is Inequality or Gini Index in Huntsville?
Inequality or Gini Index in Huntsville is 0.55.
What is the Total Population of Huntsville?
Total Population of Huntsville is 2,973.
What is the Total Male Population of Huntsville?
Total Male Population of Huntsville is 1,355.
What is the Total Female Population of Huntsville?
Total Female Population of Huntsville is 1,618.
What is the Ratio of Males per 100 Females in Huntsville?
There are 83.75 Males per 100 Females in Huntsville.
What is the Ratio of Females per 100 Males in Huntsville?
There are 119.41 Females per 100 Males in Huntsville.
What is the Median Population Age in Huntsville?
Median Population Age in Huntsville is 30.0 Years.
What is the Average Family Size in Huntsville
Average Family Size in Huntsville is 3.5 People.
What is the Average Household Size in Huntsville
Average Household Size in Huntsville is 2.9 People.
How Large is the Labor Force in Huntsville?
There are 1,203 People in the Labor Forcein in Huntsville.
What is the Percentage of People in the Labor Force in Huntsville?
63.5% of People are in the Labor Force in Huntsville.
What is the Unemployment Rate in Huntsville?
Unemployment Rate in Huntsville is 5.9%.