Leachville, AR Map & Demographics
Leachville Map
Leachville Overview
$23,053
PER CAPITA INCOME
$50,588
AVG FAMILY INCOME
$31,607
AVG HOUSEHOLD INCOME
27.2%
WAGE / INCOME GAP [ % ]
72.8¢/ $1
WAGE / INCOME GAP [ $ ]
$15,103
FAMILY INCOME DEFICIT
0.55
INEQUALITY / GINI INDEX
2,132
TOTAL POPULATION
1,048
MALE POPULATION
1,084
FEMALE POPULATION
96.68
MALES / 100 FEMALES
103.44
FEMALES / 100 MALES
35.9
MEDIAN AGE
3.0
AVG FAMILY SIZE
2.6
AVG HOUSEHOLD SIZE
865
LABOR FORCE [ PEOPLE ]
56.0%
PERCENT IN LABOR FORCE
4.1%
UNEMPLOYMENT RATE
Leachville Zip Codes
Leachville Area Codes
Income in Leachville
Income Overview in Leachville
Per Capita Income in Leachville is $23,053, while median incomes of families and households are $50,588 and $31,607 respectively.
| Characteristic | Number | Measure |
| Per Capita Income | 2,132 | $23,053 |
| Median Family Income | 560 | $50,588 |
| Mean Family Income | 560 | $69,811 |
| Median Household Income | 833 | $31,607 |
| Mean Household Income | 833 | $55,897 |
| Income Deficit | 560 | $15,103 |
| Wage / Income Gap (%) | 2,132 | 27.18% |
| Wage / Income Gap ($) | 2,132 | 72.82¢ per $1 |
| Gini / Inequality Index | 2,132 | 0.55 |
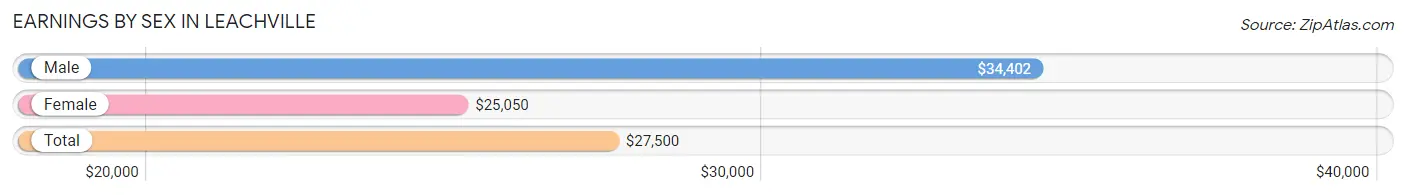
Earnings by Sex in Leachville
Average Earnings in Leachville are $27,500, $34,402 for men and $25,050 for women, a difference of 27.2%.
| Sex | Number | Average Earnings |
| Male | 507 (57.0%) | $34,402 |
| Female | 383 (43.0%) | $25,050 |
| Total | 890 (100.0%) | $27,500 |
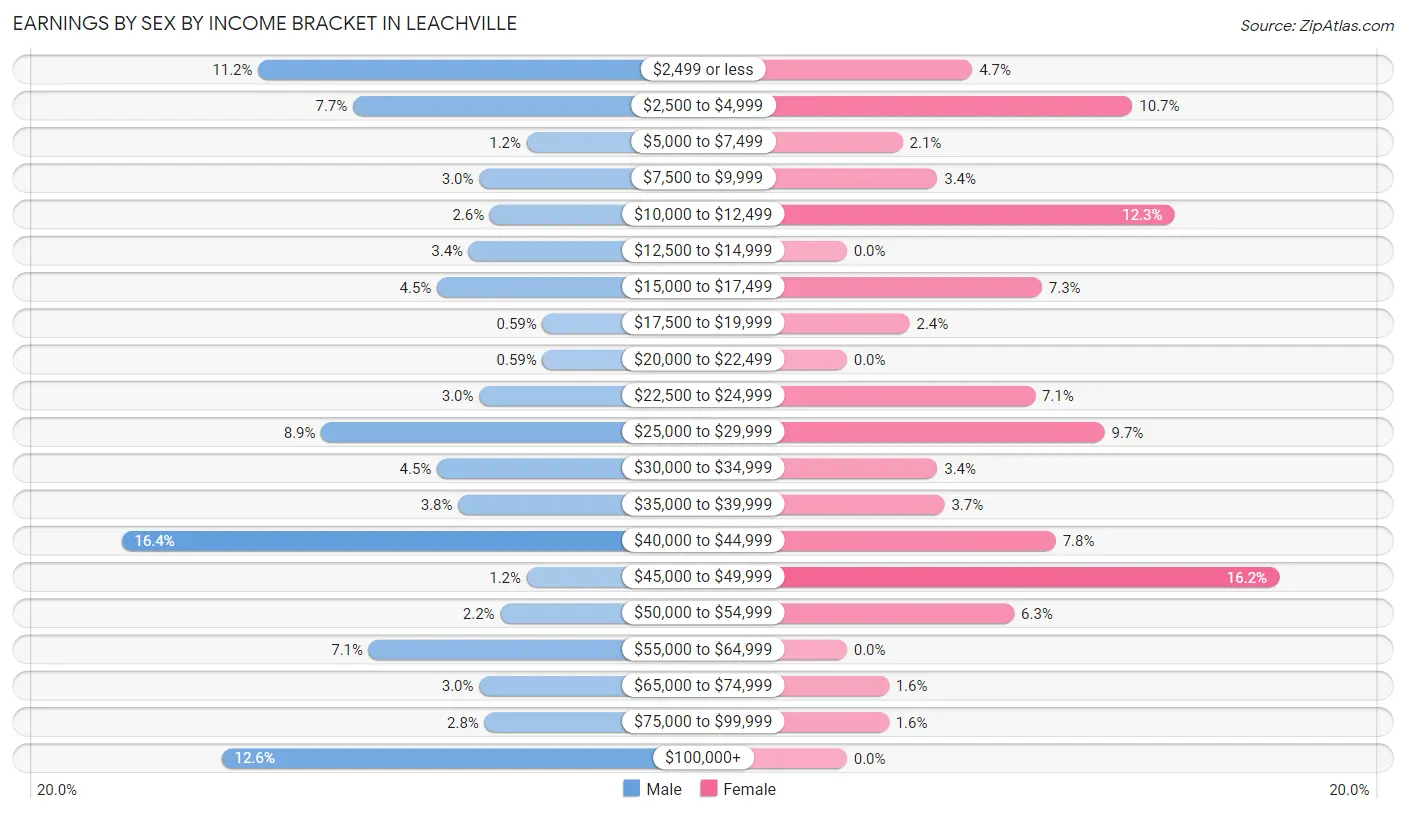
Earnings by Sex by Income Bracket in Leachville
The most common earnings brackets in Leachville are $40,000 to $44,999 for men (83 | 16.4%) and $45,000 to $49,999 for women (62 | 16.2%).
| Income | Male | Female |
| $2,499 or less | 57 (11.2%) | 18 (4.7%) |
| $2,500 to $4,999 | 39 (7.7%) | 41 (10.7%) |
| $5,000 to $7,499 | 6 (1.2%) | 8 (2.1%) |
| $7,500 to $9,999 | 15 (3.0%) | 13 (3.4%) |
| $10,000 to $12,499 | 13 (2.6%) | 47 (12.3%) |
| $12,500 to $14,999 | 17 (3.4%) | 0 (0.0%) |
| $15,000 to $17,499 | 23 (4.5%) | 28 (7.3%) |
| $17,500 to $19,999 | 3 (0.6%) | 9 (2.4%) |
| $20,000 to $22,499 | 3 (0.6%) | 0 (0.0%) |
| $22,500 to $24,999 | 15 (3.0%) | 27 (7.0%) |
| $25,000 to $29,999 | 45 (8.9%) | 37 (9.7%) |
| $30,000 to $34,999 | 23 (4.5%) | 13 (3.4%) |
| $35,000 to $39,999 | 19 (3.7%) | 14 (3.7%) |
| $40,000 to $44,999 | 83 (16.4%) | 30 (7.8%) |
| $45,000 to $49,999 | 6 (1.2%) | 62 (16.2%) |
| $50,000 to $54,999 | 11 (2.2%) | 24 (6.3%) |
| $55,000 to $64,999 | 36 (7.1%) | 0 (0.0%) |
| $65,000 to $74,999 | 15 (3.0%) | 6 (1.6%) |
| $75,000 to $99,999 | 14 (2.8%) | 6 (1.6%) |
| $100,000+ | 64 (12.6%) | 0 (0.0%) |
| Total | 507 (100.0%) | 383 (100.0%) |
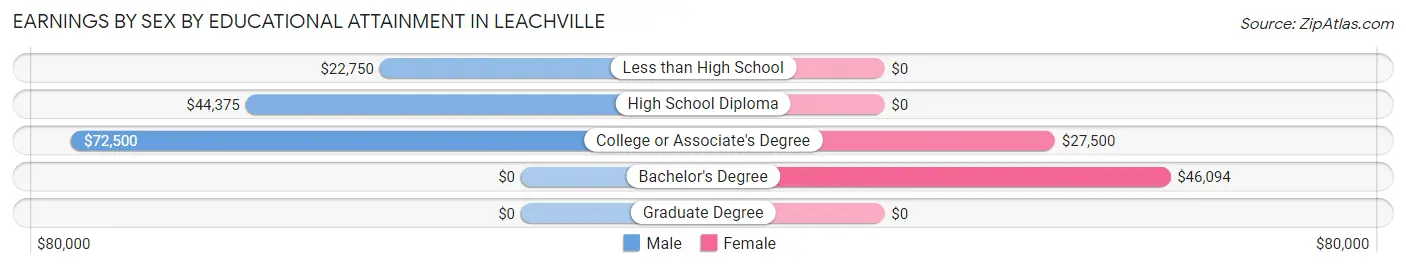
Earnings by Sex by Educational Attainment in Leachville
Average earnings in Leachville are $43,148 for men and $27,200 for women, a difference of 37.0%. Men with an educational attainment of college or associate's degree enjoy the highest average annual earnings of $72,500, while those with less than high school education earn the least with $22,750. Women with an educational attainment of bachelor's degree earn the most with the average annual earnings of $46,094, while those with college or associate's degree education have the smallest earnings of $27,500.
| Educational Attainment | Male Income | Female Income |
| Less than High School | $22,750 | $0 |
| High School Diploma | $44,375 | $0 |
| College or Associate's Degree | $72,500 | $27,500 |
| Bachelor's Degree | - | - |
| Graduate Degree | - | - |
| Total | $43,148 | $27,200 |
Family Income in Leachville
Family Income Brackets in Leachville
According to the Leachville family income data, there are 114 families falling into the less than $10,000 income range, which is the most common income bracket and makes up 20.4% of all families. Conversely, the $10,000 to $14,999 income bracket is the least frequent group with only 14 families (2.5%) belonging to this category.
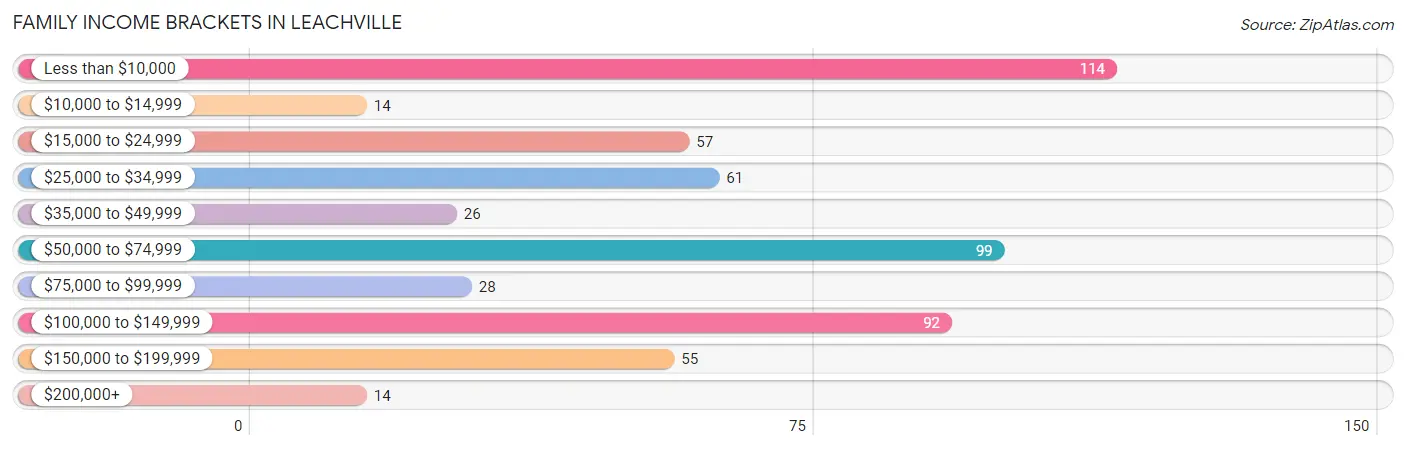
| Income Bracket | # Families | % Families |
| Less than $10,000 | 114 | 20.4% |
| $10,000 to $14,999 | 14 | 2.5% |
| $15,000 to $24,999 | 57 | 10.2% |
| $25,000 to $34,999 | 61 | 10.9% |
| $35,000 to $49,999 | 26 | 4.6% |
| $50,000 to $74,999 | 99 | 17.7% |
| $75,000 to $99,999 | 28 | 5.0% |
| $100,000 to $149,999 | 92 | 16.4% |
| $150,000 to $199,999 | 55 | 9.8% |
| $200,000+ | 14 | 2.5% |
Family Income by Famaliy Size in Leachville
6-person families (21 | 3.7%) account for the highest median family income in Leachville with $174,107 per family, while 6-person families (21 | 3.7%) have the highest median income of $29,018 per family member.
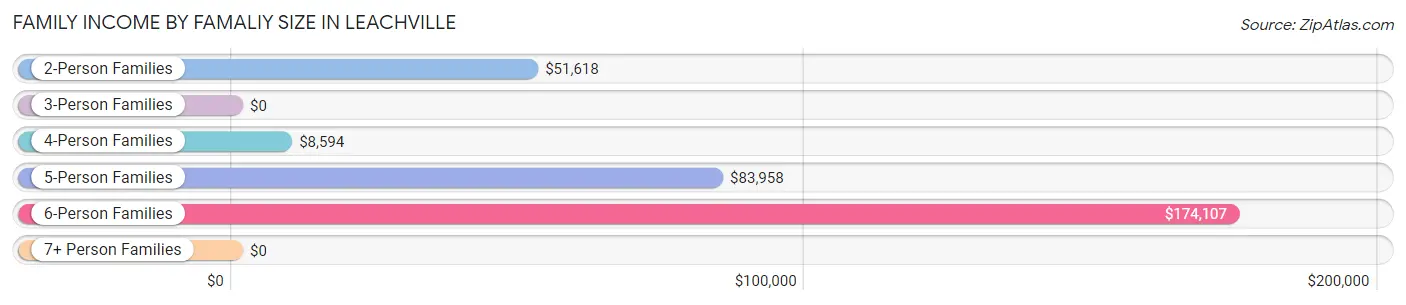
| Income Bracket | # Families | Median Income |
| 2-Person Families | 340 (60.7%) | $51,618 |
| 3-Person Families | 95 (17.0%) | $0 |
| 4-Person Families | 64 (11.4%) | $8,594 |
| 5-Person Families | 40 (7.1%) | $83,958 |
| 6-Person Families | 21 (3.7%) | $174,107 |
| 7+ Person Families | 0 (0.0%) | $0 |
| Total | 560 (100.0%) | $50,588 |
Family Income by Number of Earners in Leachville
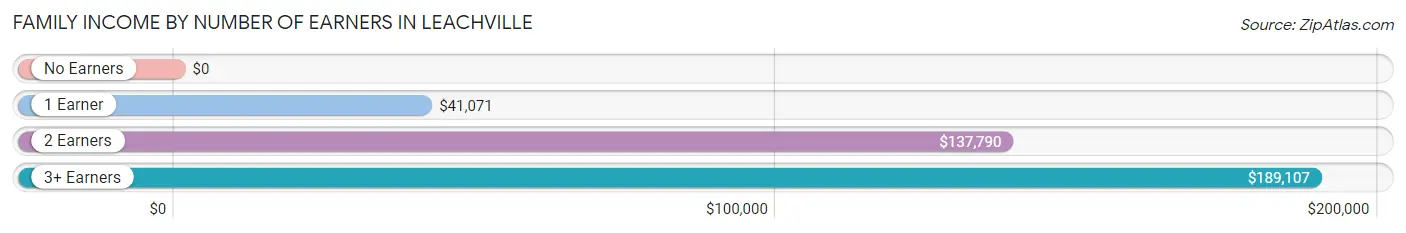
| Number of Earners | # Families | Median Income |
| No Earners | 160 (28.6%) | $0 |
| 1 Earner | 224 (40.0%) | $41,071 |
| 2 Earners | 151 (27.0%) | $137,790 |
| 3+ Earners | 25 (4.5%) | $189,107 |
| Total | 560 (100.0%) | $50,588 |
Household Income in Leachville
Household Income Brackets in Leachville
With 164 households falling in the category, the less than $10,000 income range is the most frequent in Leachville, accounting for 19.7% of all households. In contrast, only 14 households (1.7%) fall into the $200,000+ income bracket, making it the least populous group.
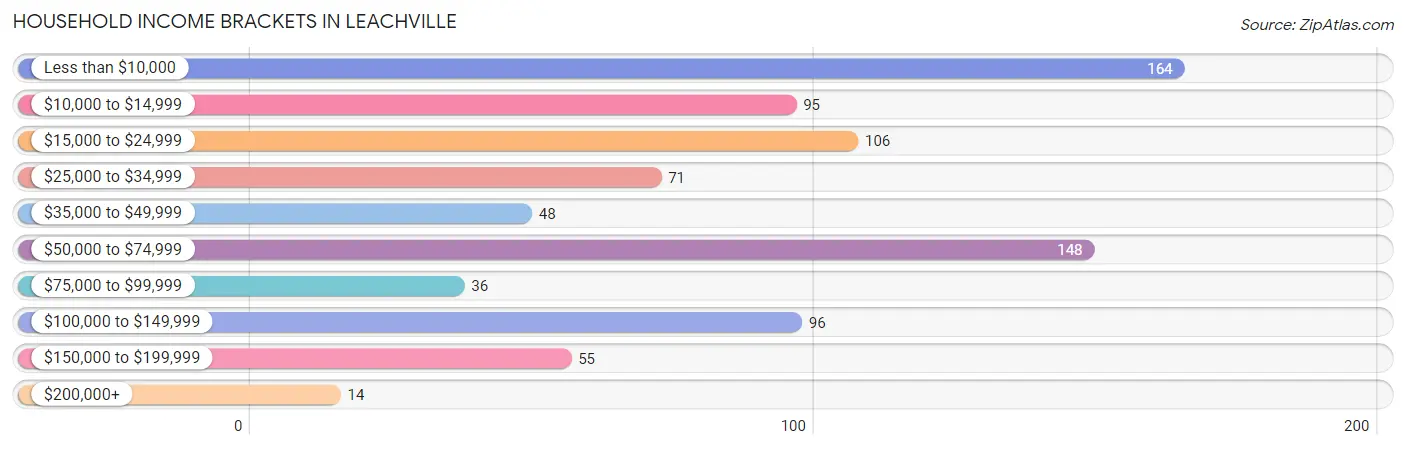
| Income Bracket | # Households | % Households |
| Less than $10,000 | 164 | 19.7% |
| $10,000 to $14,999 | 95 | 11.4% |
| $15,000 to $24,999 | 106 | 12.7% |
| $25,000 to $34,999 | 71 | 8.5% |
| $35,000 to $49,999 | 48 | 5.8% |
| $50,000 to $74,999 | 148 | 17.8% |
| $75,000 to $99,999 | 36 | 4.3% |
| $100,000 to $149,999 | 96 | 11.5% |
| $150,000 to $199,999 | 55 | 6.6% |
| $200,000+ | 14 | 1.7% |
Household Income by Householder Age in Leachville
The median household income in Leachville is $31,607, with the highest median household income of $50,313 found in the 45 to 64 years age bracket for the primary householder. A total of 374 households (44.9%) fall into this category. Meanwhile, the 15 to 24 years age bracket for the primary householder has the lowest median household income of $0, with 26 households (3.1%) in this group.
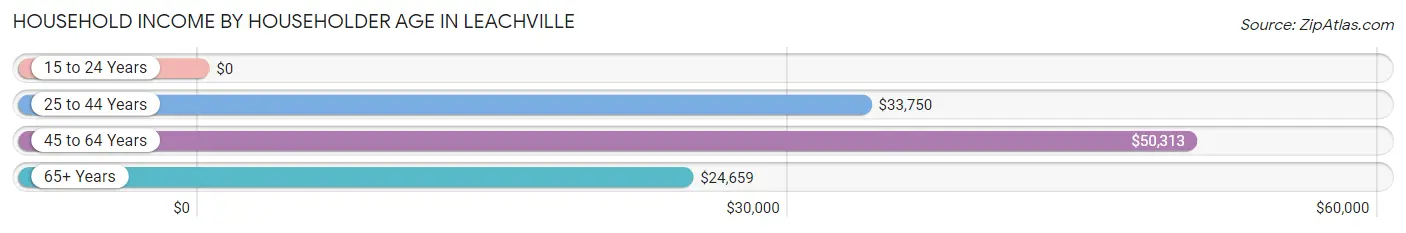
| Income Bracket | # Households | Median Income |
| 15 to 24 Years | 26 (3.1%) | $0 |
| 25 to 44 Years | 246 (29.5%) | $33,750 |
| 45 to 64 Years | 374 (44.9%) | $50,313 |
| 65+ Years | 187 (22.5%) | $24,659 |
| Total | 833 (100.0%) | $31,607 |
Poverty in Leachville
Income Below Poverty by Sex and Age in Leachville
With 22.1% poverty level for males and 46.8% for females among the residents of Leachville, 12 to 14 year old males and 15 year old females are the most vulnerable to poverty, with 69 males (71.1%) and 42 females (100.0%) in their respective age groups living below the poverty level.
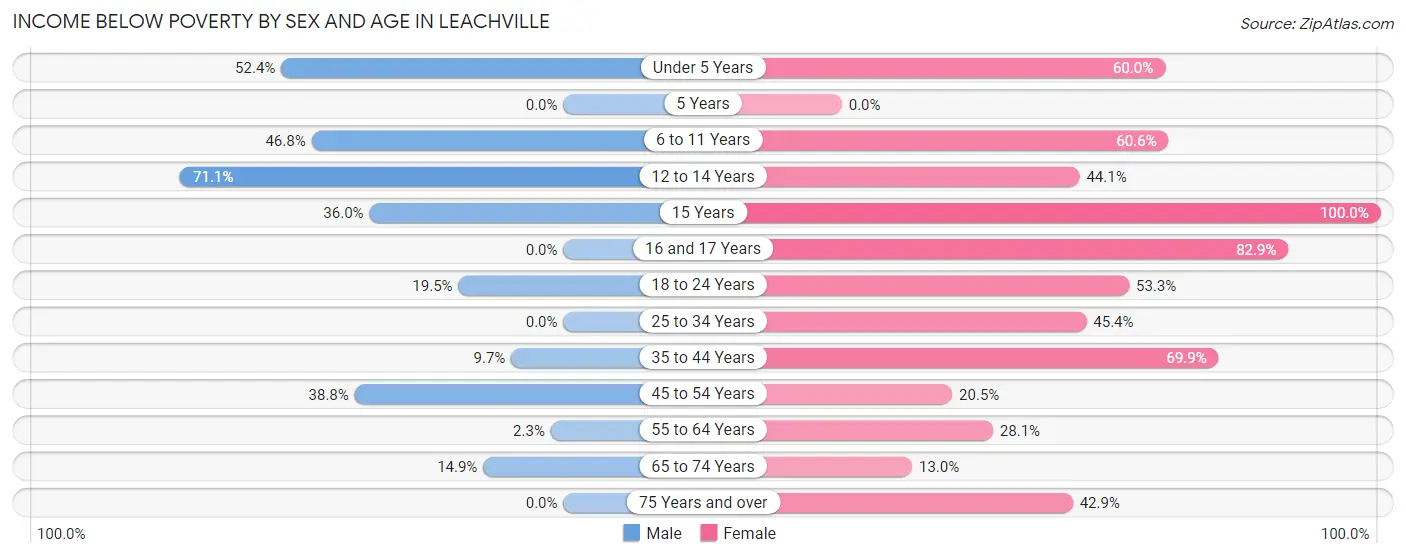
| Age Bracket | Male | Female |
| Under 5 Years | 33 (52.4%) | 30 (60.0%) |
| 5 Years | 0 (0.0%) | 0 (0.0%) |
| 6 to 11 Years | 36 (46.8%) | 77 (60.6%) |
| 12 to 14 Years | 69 (71.1%) | 15 (44.1%) |
| 15 Years | 9 (36.0%) | 42 (100.0%) |
| 16 and 17 Years | 0 (0.0%) | 29 (82.9%) |
| 18 to 24 Years | 15 (19.5%) | 24 (53.3%) |
| 25 to 34 Years | 0 (0.0%) | 69 (45.4%) |
| 35 to 44 Years | 6 (9.7%) | 100 (69.9%) |
| 45 to 54 Years | 31 (38.8%) | 34 (20.5%) |
| 55 to 64 Years | 5 (2.3%) | 46 (28.1%) |
| 65 to 74 Years | 18 (14.9%) | 6 (13.0%) |
| 75 Years and over | 0 (0.0%) | 27 (42.9%) |
| Total | 222 (22.1%) | 499 (46.8%) |
Income Above Poverty by Sex and Age in Leachville
According to the poverty statistics in Leachville, males aged 5 years and females aged 65 to 74 years are the age groups that are most secure financially, with 100.0% of males and 87.0% of females in these age groups living above the poverty line.
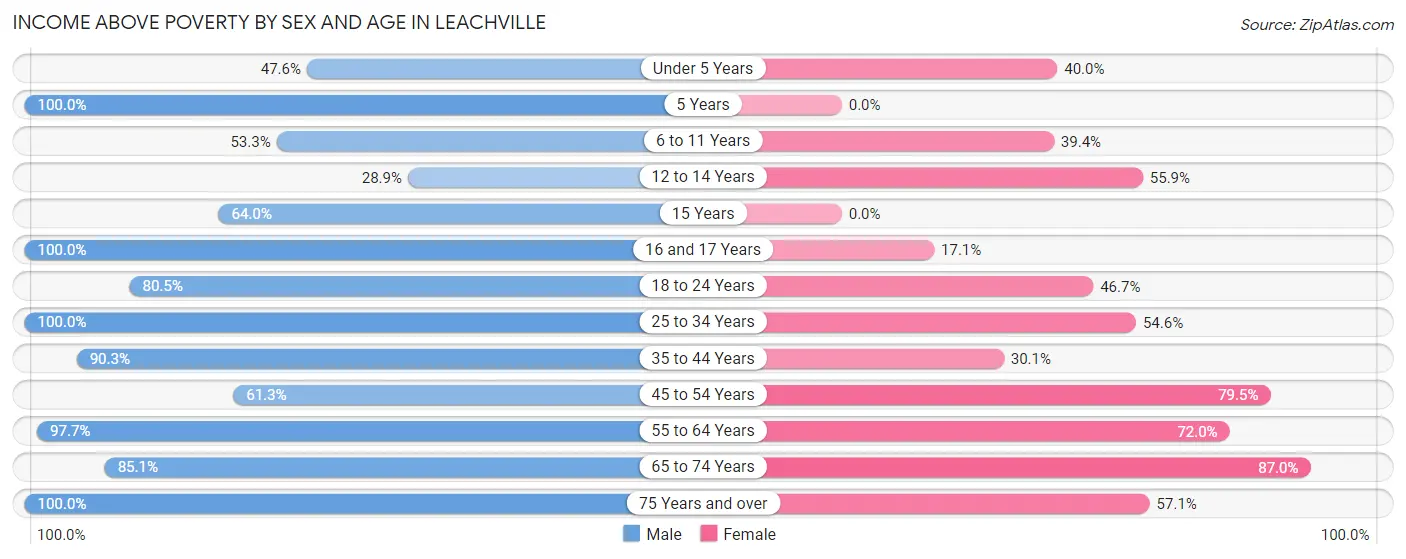
| Age Bracket | Male | Female |
| Under 5 Years | 30 (47.6%) | 20 (40.0%) |
| 5 Years | 14 (100.0%) | 0 (0.0%) |
| 6 to 11 Years | 41 (53.2%) | 50 (39.4%) |
| 12 to 14 Years | 28 (28.9%) | 19 (55.9%) |
| 15 Years | 16 (64.0%) | 0 (0.0%) |
| 16 and 17 Years | 55 (100.0%) | 6 (17.1%) |
| 18 to 24 Years | 62 (80.5%) | 21 (46.7%) |
| 25 to 34 Years | 75 (100.0%) | 83 (54.6%) |
| 35 to 44 Years | 56 (90.3%) | 43 (30.1%) |
| 45 to 54 Years | 49 (61.3%) | 132 (79.5%) |
| 55 to 64 Years | 209 (97.7%) | 118 (72.0%) |
| 65 to 74 Years | 103 (85.1%) | 40 (87.0%) |
| 75 Years and over | 46 (100.0%) | 36 (57.1%) |
| Total | 784 (77.9%) | 568 (53.2%) |
Income Below Poverty Among Married-Couple Families in Leachville
The poverty statistics for married-couple families in Leachville show that 3.6% or 12 of the total 330 families live below the poverty line. Families with 1 or 2 children have the highest poverty rate of 20.6%, comprising of 7 families. On the other hand, families with 3 or 4 children have the lowest poverty rate of 0.0%, which includes 0 families.
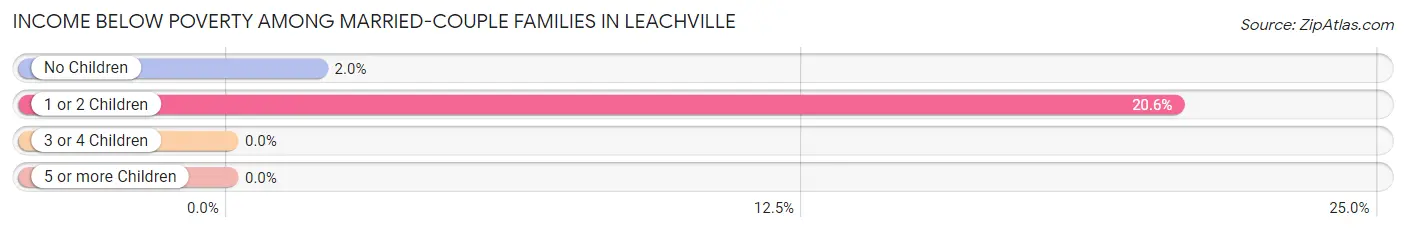
| Children | Above Poverty | Below Poverty |
| No Children | 251 (98.1%) | 5 (1.9%) |
| 1 or 2 Children | 27 (79.4%) | 7 (20.6%) |
| 3 or 4 Children | 40 (100.0%) | 0 (0.0%) |
| 5 or more Children | 0 (0.0%) | 0 (0.0%) |
| Total | 318 (96.4%) | 12 (3.6%) |
Income Below Poverty Among Single-Parent Households in Leachville
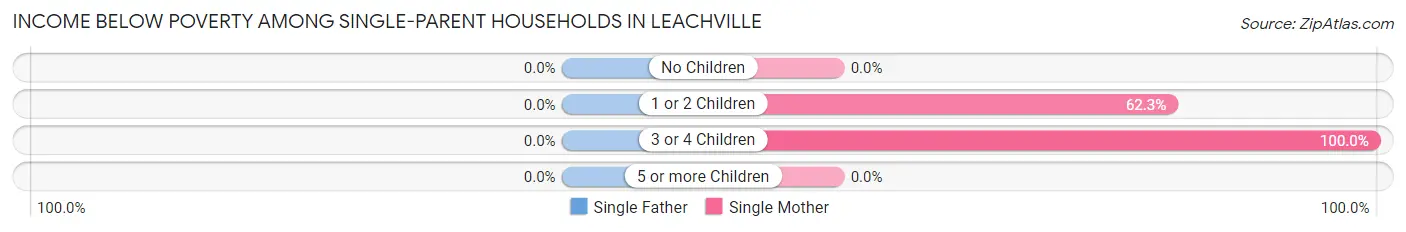
| Children | Single Father | Single Mother |
| No Children | 0 (0.0%) | 0 (0.0%) |
| 1 or 2 Children | 0 (0.0%) | 99 (62.3%) |
| 3 or 4 Children | 0 (0.0%) | 50 (100.0%) |
| 5 or more Children | 0 (0.0%) | 0 (0.0%) |
| Total | 0 (0.0%) | 149 (64.8%) |
Income Below Poverty Among Married-Couple vs Single-Parent Households in Leachville
The poverty data for Leachville shows that 12 of the married-couple family households (3.6%) and 149 of the single-parent households (64.8%) are living below the poverty level. Within the married-couple family households, those with 1 or 2 children have the highest poverty rate, with 7 households (20.6%) falling below the poverty line. Among the single-parent households, those with 3 or 4 children have the highest poverty rate, with 50 household (100.0%) living below poverty.
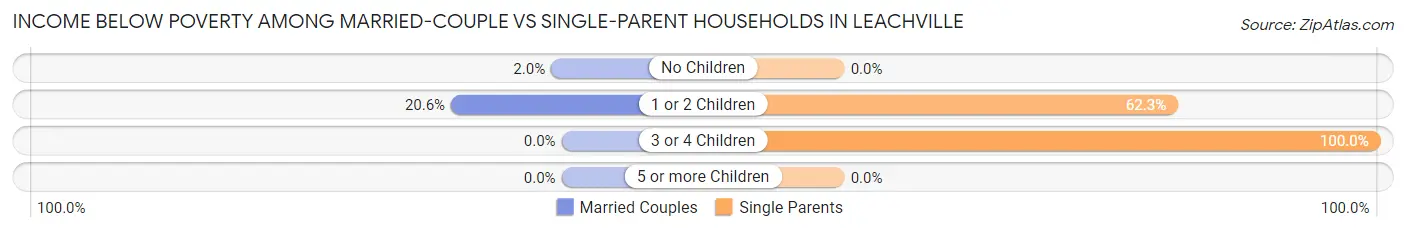
| Children | Married-Couple Families | Single-Parent Households |
| No Children | 5 (1.9%) | 0 (0.0%) |
| 1 or 2 Children | 7 (20.6%) | 99 (62.3%) |
| 3 or 4 Children | 0 (0.0%) | 50 (100.0%) |
| 5 or more Children | 0 (0.0%) | 0 (0.0%) |
| Total | 12 (3.6%) | 149 (64.8%) |
Race in Leachville
The most populous races in Leachville are White / Caucasian (1,878 | 88.1%), Hispanic or Latino (384 | 18.0%), and Two or more Races (158 | 7.4%).
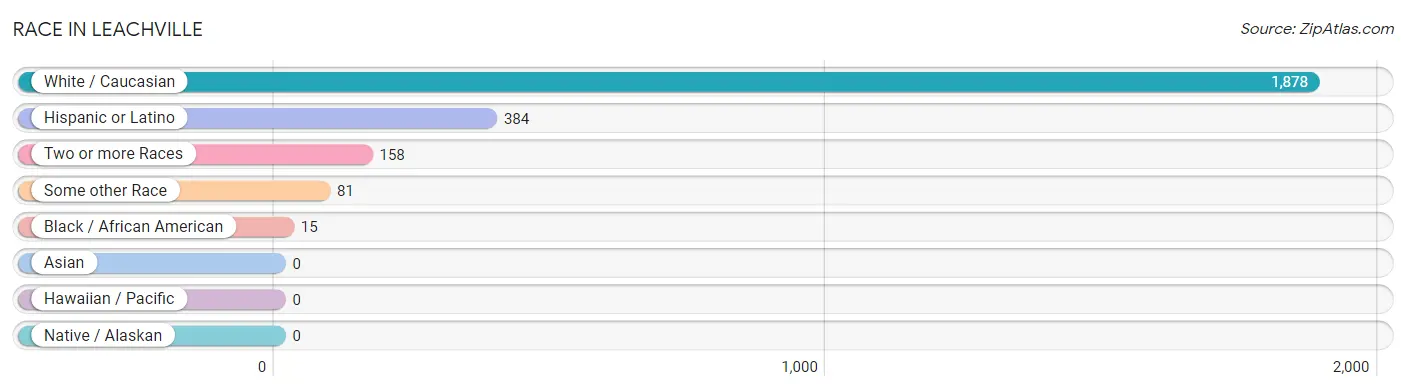
| Race | # Population | % Population |
| Asian | 0 | 0.0% |
| Black / African American | 15 | 0.7% |
| Hawaiian / Pacific | 0 | 0.0% |
| Hispanic or Latino | 384 | 18.0% |
| Native / Alaskan | 0 | 0.0% |
| White / Caucasian | 1,878 | 88.1% |
| Two or more Races | 158 | 7.4% |
| Some other Race | 81 | 3.8% |
| Total | 2,132 | 100.0% |
Ancestry in Leachville
The most populous ancestries reported in Leachville are Irish (382 | 17.9%), Mexican (378 | 17.7%), English (172 | 8.1%), German (155 | 7.3%), and American (83 | 3.9%), together accounting for 54.9% of all Leachville residents.
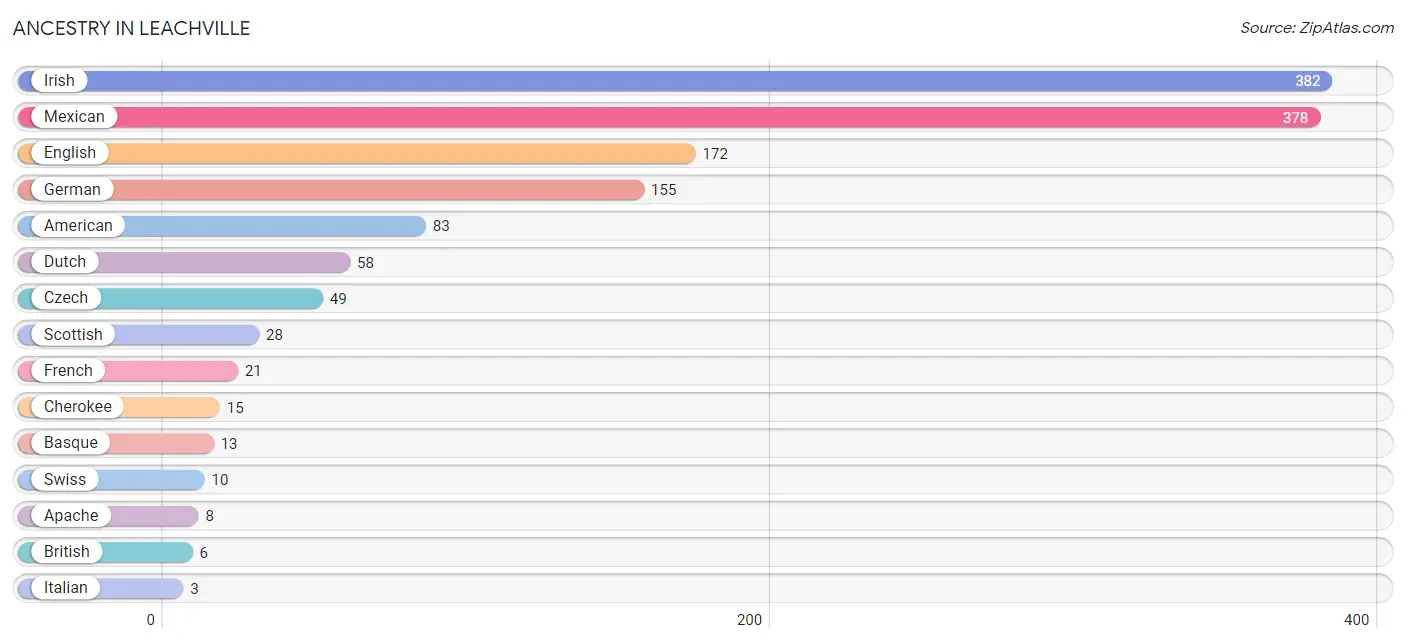
| Ancestry | # Population | % Population |
| American | 83 | 3.9% |
| Apache | 8 | 0.4% |
| Basque | 13 | 0.6% |
| British | 6 | 0.3% |
| Cherokee | 15 | 0.7% |
| Czech | 49 | 2.3% |
| Dutch | 58 | 2.7% |
| English | 172 | 8.1% |
| French | 21 | 1.0% |
| German | 155 | 7.3% |
| Irish | 382 | 17.9% |
| Italian | 3 | 0.1% |
| Mexican | 378 | 17.7% |
| Scandinavian | 1 | 0.1% |
| Scottish | 28 | 1.3% |
| Swiss | 10 | 0.5% | View All 16 Rows |
Immigrants in Leachville
The most numerous immigrant groups reported in Leachville came from Central America (48 | 2.2%), Latin America (48 | 2.2%), and Mexico (48 | 2.2%), together accounting for 6.8% of all Leachville residents.
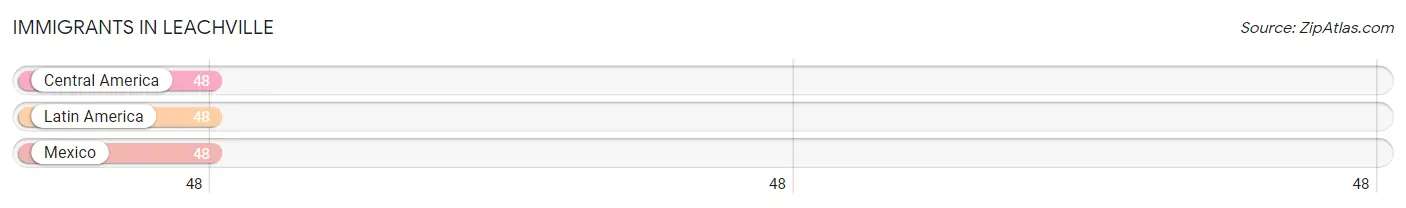
| Immigration Origin | # Population | % Population |
| Central America | 48 | 2.2% |
| Latin America | 48 | 2.2% |
| Mexico | 48 | 2.2% | View All 3 Rows |
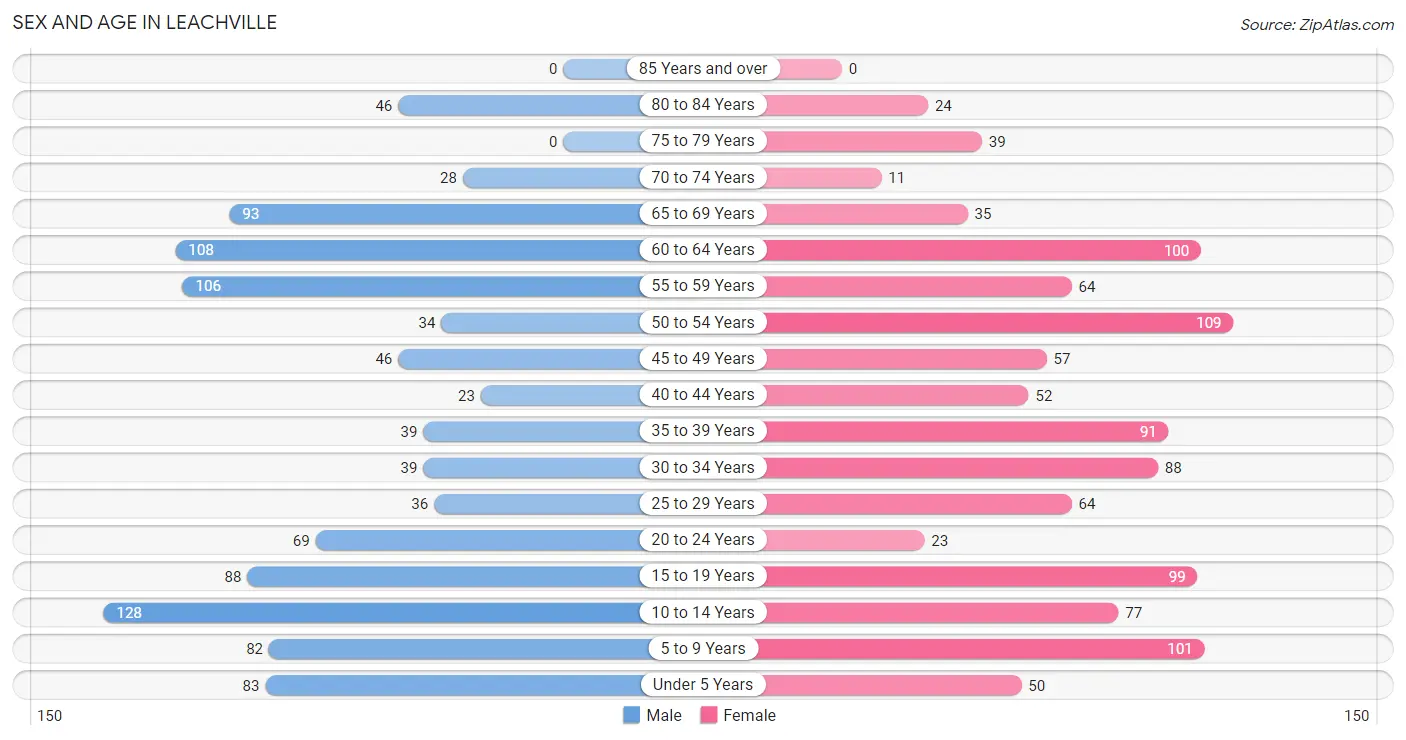
Sex and Age in Leachville
Sex and Age in Leachville
The most populous age groups in Leachville are 10 to 14 Years (128 | 12.2%) for men and 50 to 54 Years (109 | 10.1%) for women.
| Age Bracket | Male | Female |
| Under 5 Years | 83 (7.9%) | 50 (4.6%) |
| 5 to 9 Years | 82 (7.8%) | 101 (9.3%) |
| 10 to 14 Years | 128 (12.2%) | 77 (7.1%) |
| 15 to 19 Years | 88 (8.4%) | 99 (9.1%) |
| 20 to 24 Years | 69 (6.6%) | 23 (2.1%) |
| 25 to 29 Years | 36 (3.4%) | 64 (5.9%) |
| 30 to 34 Years | 39 (3.7%) | 88 (8.1%) |
| 35 to 39 Years | 39 (3.7%) | 91 (8.4%) |
| 40 to 44 Years | 23 (2.2%) | 52 (4.8%) |
| 45 to 49 Years | 46 (4.4%) | 57 (5.3%) |
| 50 to 54 Years | 34 (3.2%) | 109 (10.1%) |
| 55 to 59 Years | 106 (10.1%) | 64 (5.9%) |
| 60 to 64 Years | 108 (10.3%) | 100 (9.2%) |
| 65 to 69 Years | 93 (8.9%) | 35 (3.2%) |
| 70 to 74 Years | 28 (2.7%) | 11 (1.0%) |
| 75 to 79 Years | 0 (0.0%) | 39 (3.6%) |
| 80 to 84 Years | 46 (4.4%) | 24 (2.2%) |
| 85 Years and over | 0 (0.0%) | 0 (0.0%) |
| Total | 1,048 (100.0%) | 1,084 (100.0%) |
Families and Households in Leachville
Median Family Size in Leachville
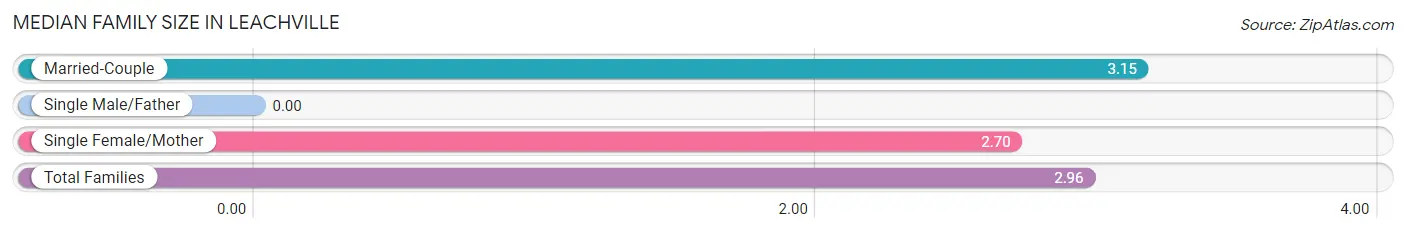
| Family Type | # Families | Family Size |
| Married-Couple | 330 (58.9%) | 3.15 |
| Single Male/Father | 0 (0.0%) | - |
| Single Female/Mother | 230 (41.1%) | 2.70 |
| Total Families | 560 (100.0%) | 2.96 |
Median Household Size in Leachville
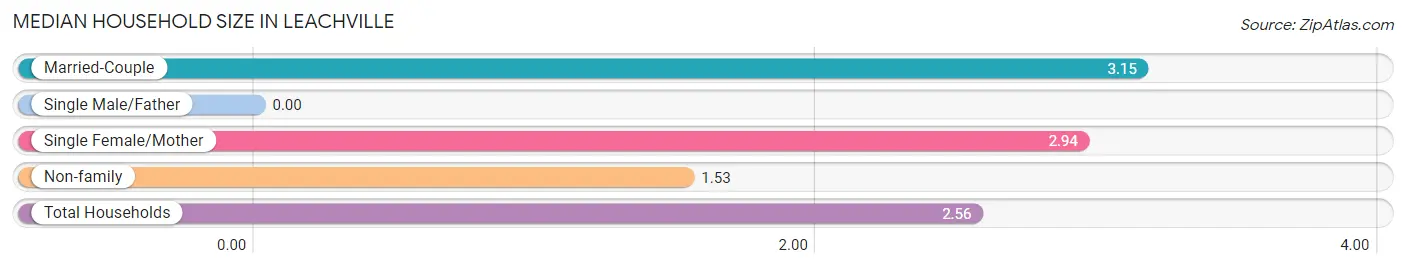
| Household Type | # Households | Household Size |
| Married-Couple | 330 (39.6%) | 3.15 |
| Single Male/Father | 0 (0.0%) | - |
| Single Female/Mother | 230 (27.6%) | 2.94 |
| Non-family | 273 (32.8%) | 1.53 |
| Total Households | 833 (100.0%) | 2.56 |
Household Size by Marriage Status in Leachville
Out of a total of 833 households in Leachville, 560 (67.2%) are family households, while 273 (32.8%) are nonfamily households. The most numerous type of family households are 2-person households, comprising 328, and the most common type of nonfamily households are 1-person households, comprising 247.
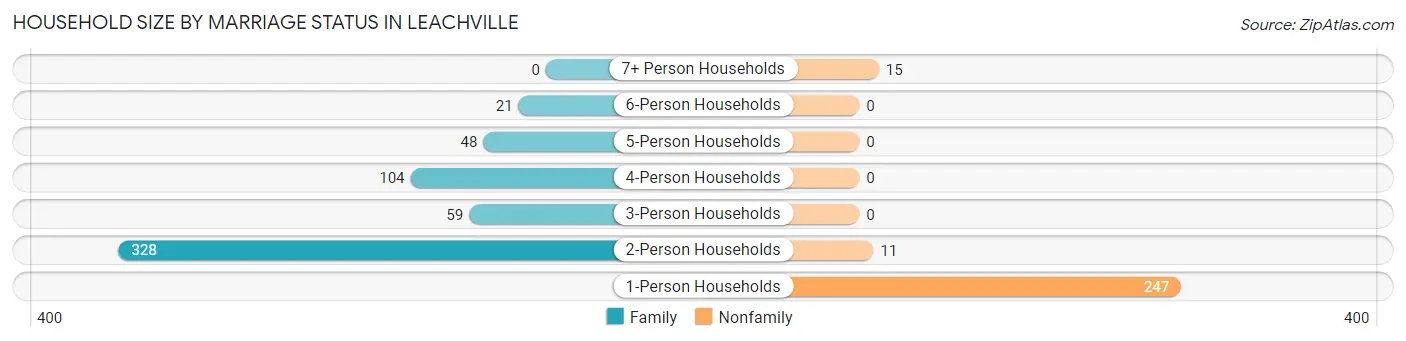
| Household Size | Family Households | Nonfamily Households |
| 1-Person Households | - | 247 (29.6%) |
| 2-Person Households | 328 (39.4%) | 11 (1.3%) |
| 3-Person Households | 59 (7.1%) | 0 (0.0%) |
| 4-Person Households | 104 (12.5%) | 0 (0.0%) |
| 5-Person Households | 48 (5.8%) | 0 (0.0%) |
| 6-Person Households | 21 (2.5%) | 0 (0.0%) |
| 7+ Person Households | 0 (0.0%) | 15 (1.8%) |
| Total | 560 (67.2%) | 273 (32.8%) |
Female Fertility in Leachville
Fertility by Age in Leachville
Average fertility rate in Leachville is 53.0 births per 1,000 women. Women in the age bracket of 20 to 34 years have the highest fertility rate with 143.0 births per 1,000 women. Women in the age bracket of 20 to 34 years acount for 100.0% of all women with births.
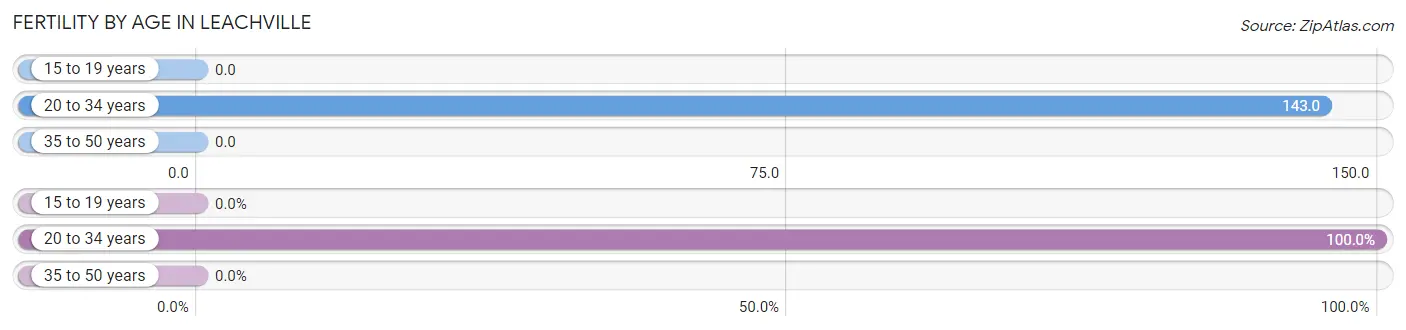
| Age Bracket | Women with Births | Births / 1,000 Women |
| 15 to 19 years | 0 (0.0%) | 0.0 |
| 20 to 34 years | 25 (100.0%) | 143.0 |
| 35 to 50 years | 0 (0.0%) | 0.0 |
| Total | 25 (100.0%) | 53.0 |
Fertility by Age by Marriage Status in Leachville
40.0% of women with births (25) in Leachville are married. The highest percentage of unmarried women with births falls into 20 to 34 years age bracket with 60.0% of them unmarried at the time of birth, while the lowest percentage of unmarried women with births belong to 20 to 34 years age bracket with 60.0% of them unmarried.
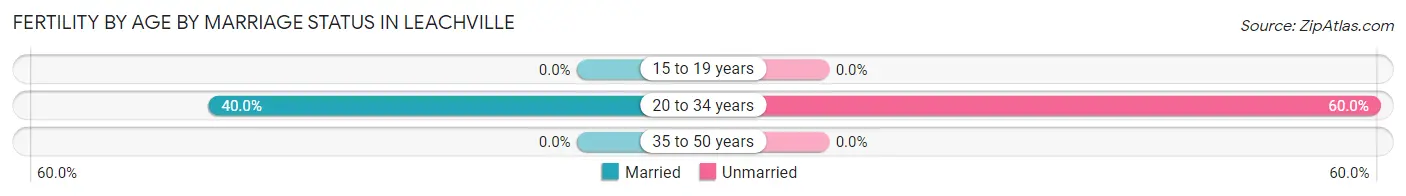
| Age Bracket | Married | Unmarried |
| 15 to 19 years | 0 (0.0%) | 0 (0.0%) |
| 20 to 34 years | 10 (40.0%) | 15 (60.0%) |
| 35 to 50 years | 0 (0.0%) | 0 (0.0%) |
| Total | 10 (40.0%) | 15 (60.0%) |
Fertility by Education in Leachville
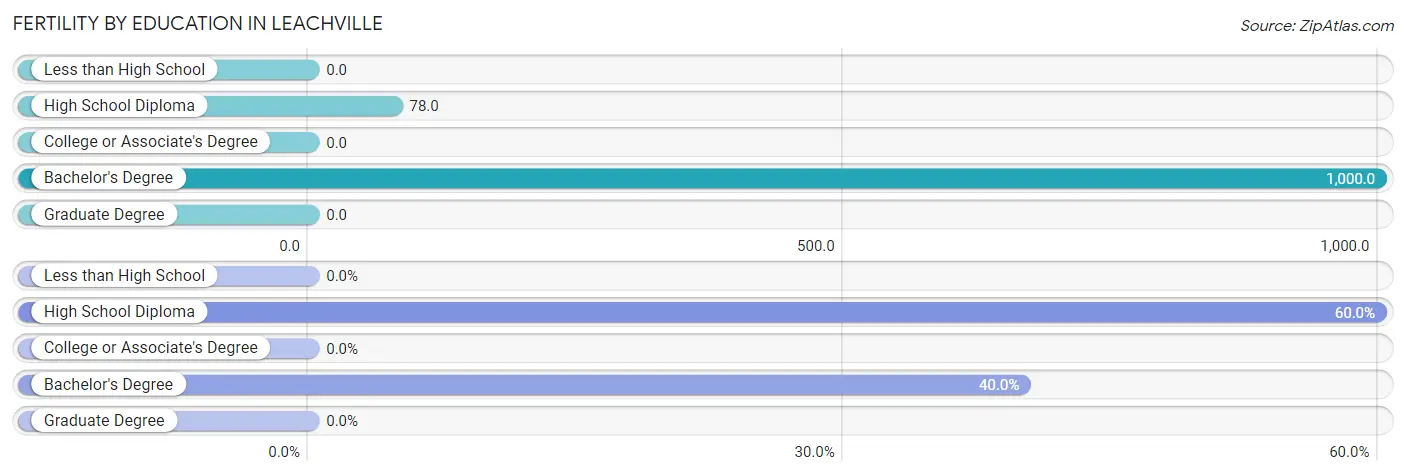
| Educational Attainment | Women with Births | Births / 1,000 Women |
| Less than High School | 0 (0.0%) | 0.0 |
| High School Diploma | 15 (60.0%) | 78.0 |
| College or Associate's Degree | 0 (0.0%) | 0.0 |
| Bachelor's Degree | 10 (40.0%) | 1,000.0 |
| Graduate Degree | 0 (0.0%) | 0.0 |
| Total | 25 (100.0%) | 53.0 |
Fertility by Education by Marriage Status in Leachville
60.0% of women with births in Leachville are unmarried. Women with the educational attainment of bachelor's degree are most likely to be married with 100.0% of them married at childbirth, while women with the educational attainment of high school diploma are least likely to be married with 100.0% of them unmarried at childbirth.
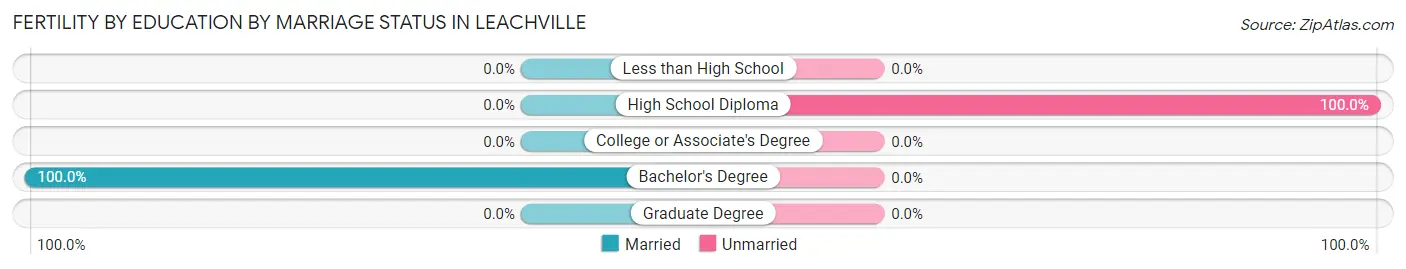
| Educational Attainment | Married | Unmarried |
| Less than High School | 0 (0.0%) | 0 (0.0%) |
| High School Diploma | 0 (0.0%) | 15 (100.0%) |
| College or Associate's Degree | 0 (0.0%) | 0 (0.0%) |
| Bachelor's Degree | 10 (100.0%) | 0 (0.0%) |
| Graduate Degree | 0 (0.0%) | 0 (0.0%) |
| Total | 10 (40.0%) | 15 (60.0%) |
Employment Characteristics in Leachville
Employment by Class of Employer in Leachville
Among the 809 employed individuals in Leachville, private company employees (538 | 66.5%), local government employees (170 | 21.0%), and state government employees (38 | 4.7%) make up the most common classes of employment.
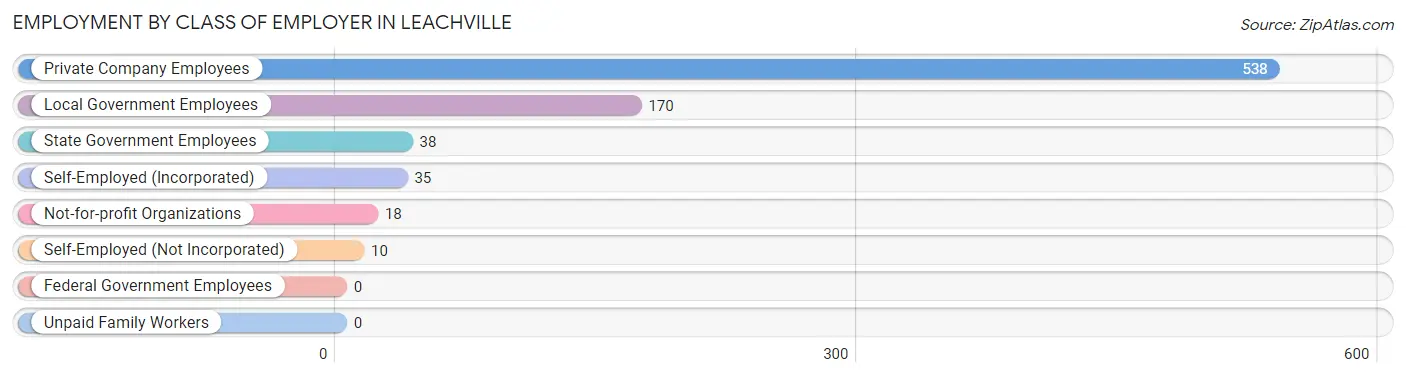
| Employer Class | # Employees | % Employees |
| Private Company Employees | 538 | 66.5% |
| Self-Employed (Incorporated) | 35 | 4.3% |
| Self-Employed (Not Incorporated) | 10 | 1.2% |
| Not-for-profit Organizations | 18 | 2.2% |
| Local Government Employees | 170 | 21.0% |
| State Government Employees | 38 | 4.7% |
| Federal Government Employees | 0 | 0.0% |
| Unpaid Family Workers | 0 | 0.0% |
| Total | 809 | 100.0% |
Employment Status by Age in Leachville
According to the labor force statistics for Leachville, out of the total population over 16 years of age (1,544), 56.0% or 865 individuals are in the labor force, with 4.1% or 35 of them unemployed. The age group with the highest labor force participation rate is 25 to 29 years, with 100.0% or 100 individuals in the labor force. Within the labor force, the 35 to 44 years age range has the highest percentage of unemployed individuals, with 18.1% or 23 of them being unemployed.
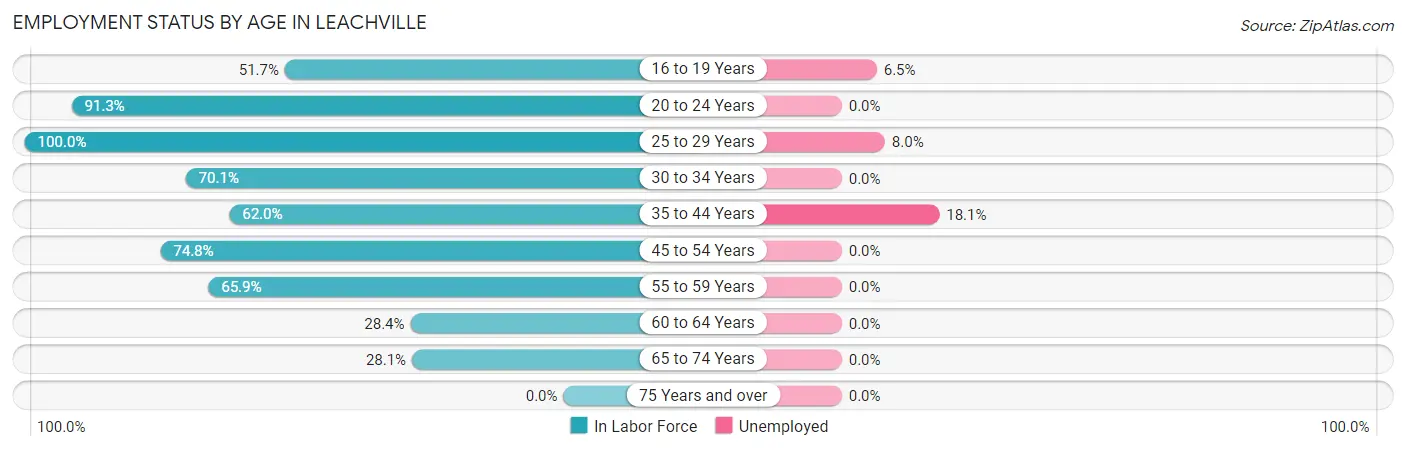
| Age Bracket | In Labor Force | Unemployed |
| 16 to 19 Years | 62 (51.7%) | 4 (6.5%) |
| 20 to 24 Years | 84 (91.3%) | 0 (0.0%) |
| 25 to 29 Years | 100 (100.0%) | 8 (8.0%) |
| 30 to 34 Years | 89 (70.1%) | 0 (0.0%) |
| 35 to 44 Years | 127 (62.0%) | 23 (18.1%) |
| 45 to 54 Years | 184 (74.8%) | 0 (0.0%) |
| 55 to 59 Years | 112 (65.9%) | 0 (0.0%) |
| 60 to 64 Years | 59 (28.4%) | 0 (0.0%) |
| 65 to 74 Years | 47 (28.1%) | 0 (0.0%) |
| 75 Years and over | 0 (0.0%) | 0 (0.0%) |
| Total | 865 (56.0%) | 35 (4.1%) |
Employment Status by Educational Attainment in Leachville
According to labor force statistics for Leachville, 63.5% of individuals (671) out of the total population between 25 and 64 years of age (1,056) are in the labor force, with 4.6% or 31 of them being unemployed. The group with the highest labor force participation rate are those with the educational attainment of bachelor's degree or higher, with 95.1% or 154 individuals in the labor force. Within the labor force, individuals with high school diploma education have the highest percentage of unemployment, with 10.9% or 24 of them being unemployed.
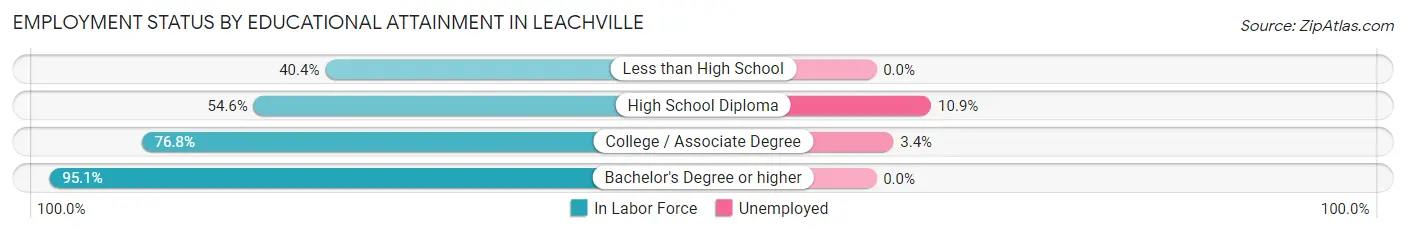
| Educational Attainment | In Labor Force | Unemployed |
| Less than High School | 88 (40.4%) | 0 (0.0%) |
| High School Diploma | 221 (54.6%) | 44 (10.9%) |
| College / Associate Degree | 208 (76.8%) | 9 (3.4%) |
| Bachelor's Degree or higher | 154 (95.1%) | 0 (0.0%) |
| Total | 671 (63.5%) | 49 (4.6%) |
Employment Occupations by Sex in Leachville
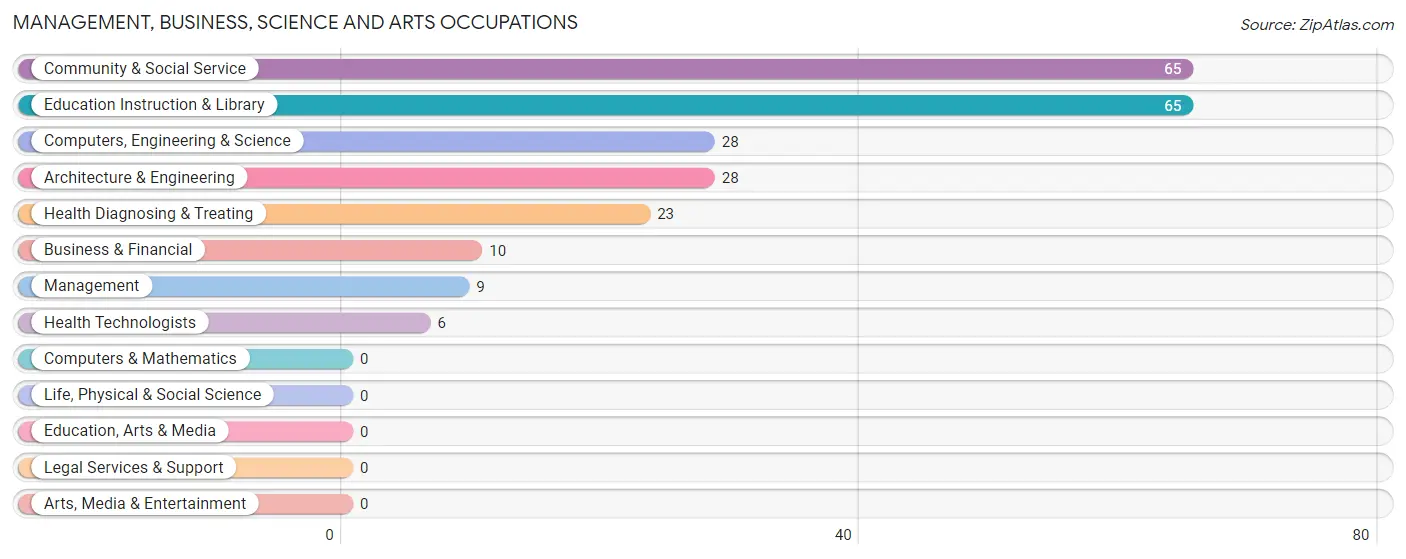
Management, Business, Science and Arts Occupations
The most common Management, Business, Science and Arts occupations in Leachville are Community & Social Service (65 | 7.8%), Education Instruction & Library (65 | 7.8%), Computers, Engineering & Science (28 | 3.4%), Architecture & Engineering (28 | 3.4%), and Health Diagnosing & Treating (23 | 2.8%).
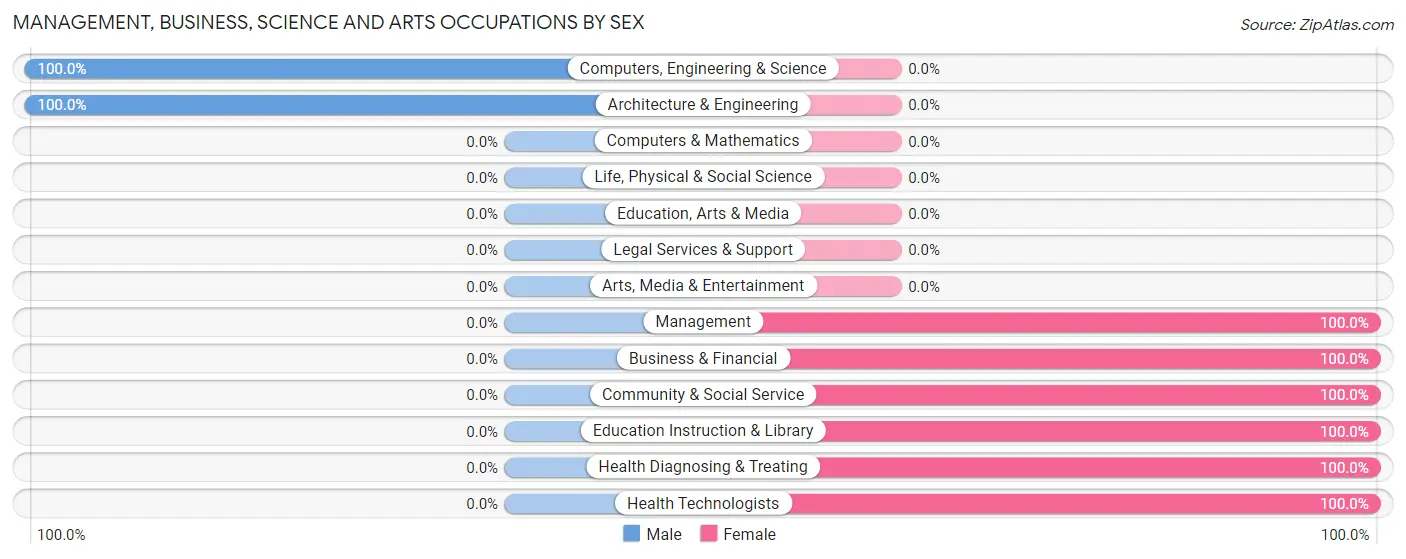
Management, Business, Science and Arts Occupations by Sex
Within the Management, Business, Science and Arts occupations in Leachville, the most male-oriented occupations are Computers, Engineering & Science (100.0%), and Architecture & Engineering (100.0%), while the most female-oriented occupations are Management (100.0%), Business & Financial (100.0%), and Community & Social Service (100.0%).
| Occupation | Male | Female |
| Management | 0 (0.0%) | 9 (100.0%) |
| Business & Financial | 0 (0.0%) | 10 (100.0%) |
| Computers, Engineering & Science | 28 (100.0%) | 0 (0.0%) |
| Computers & Mathematics | 0 (0.0%) | 0 (0.0%) |
| Architecture & Engineering | 28 (100.0%) | 0 (0.0%) |
| Life, Physical & Social Science | 0 (0.0%) | 0 (0.0%) |
| Community & Social Service | 0 (0.0%) | 65 (100.0%) |
| Education, Arts & Media | 0 (0.0%) | 0 (0.0%) |
| Legal Services & Support | 0 (0.0%) | 0 (0.0%) |
| Education Instruction & Library | 0 (0.0%) | 65 (100.0%) |
| Arts, Media & Entertainment | 0 (0.0%) | 0 (0.0%) |
| Health Diagnosing & Treating | 0 (0.0%) | 23 (100.0%) |
| Health Technologists | 0 (0.0%) | 6 (100.0%) |
| Total (Category) | 28 (20.7%) | 107 (79.3%) |
| Total (Overall) | 478 (57.7%) | 351 (42.3%) |
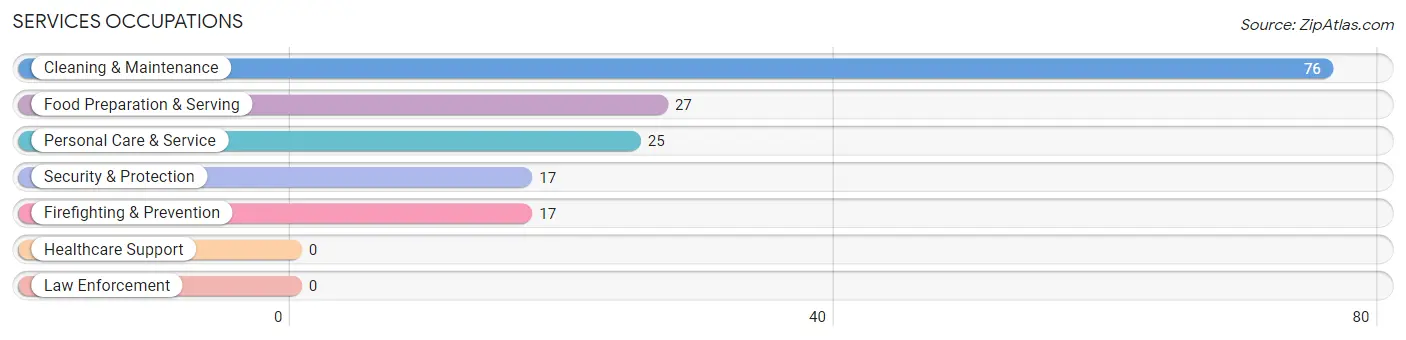
Services Occupations
The most common Services occupations in Leachville are Cleaning & Maintenance (76 | 9.2%), Food Preparation & Serving (27 | 3.3%), Personal Care & Service (25 | 3.0%), Security & Protection (17 | 2.1%), and Firefighting & Prevention (17 | 2.1%).
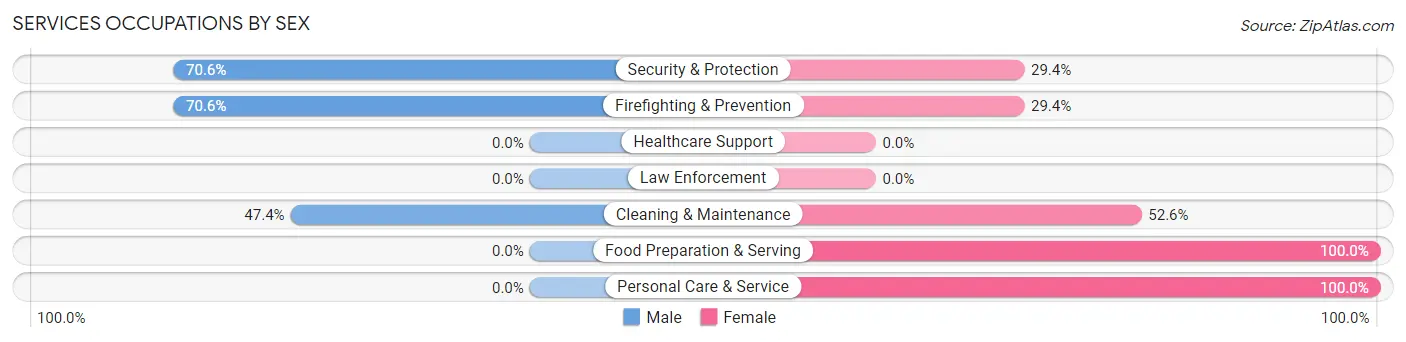
Services Occupations by Sex
Within the Services occupations in Leachville, the most male-oriented occupations are Security & Protection (70.6%), Firefighting & Prevention (70.6%), and Cleaning & Maintenance (47.4%), while the most female-oriented occupations are Food Preparation & Serving (100.0%), Personal Care & Service (100.0%), and Cleaning & Maintenance (52.6%).
| Occupation | Male | Female |
| Healthcare Support | 0 (0.0%) | 0 (0.0%) |
| Security & Protection | 12 (70.6%) | 5 (29.4%) |
| Firefighting & Prevention | 12 (70.6%) | 5 (29.4%) |
| Law Enforcement | 0 (0.0%) | 0 (0.0%) |
| Food Preparation & Serving | 0 (0.0%) | 27 (100.0%) |
| Cleaning & Maintenance | 36 (47.4%) | 40 (52.6%) |
| Personal Care & Service | 0 (0.0%) | 25 (100.0%) |
| Total (Category) | 48 (33.1%) | 97 (66.9%) |
| Total (Overall) | 478 (57.7%) | 351 (42.3%) |
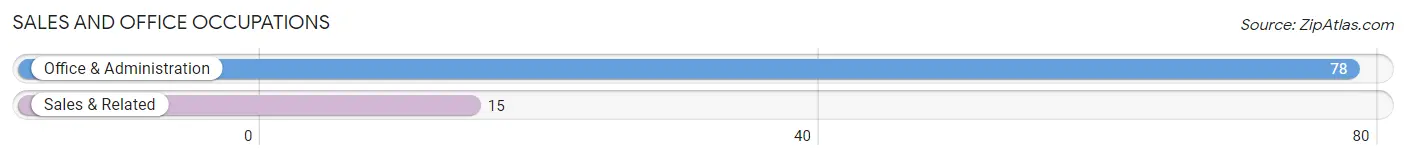
Sales and Office Occupations
The most common Sales and Office occupations in Leachville are Office & Administration (78 | 9.4%), and Sales & Related (15 | 1.8%).
Sales and Office Occupations by Sex
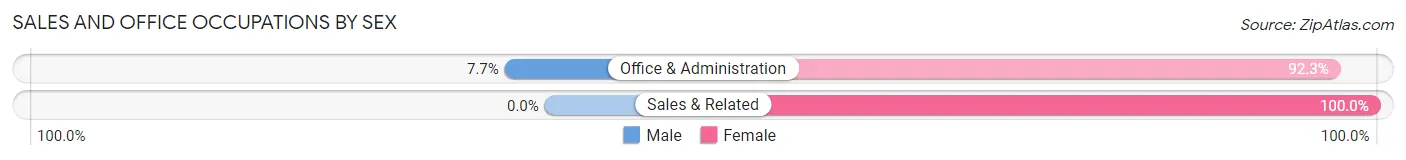
| Occupation | Male | Female |
| Sales & Related | 0 (0.0%) | 15 (100.0%) |
| Office & Administration | 6 (7.7%) | 72 (92.3%) |
| Total (Category) | 6 (6.5%) | 87 (93.5%) |
| Total (Overall) | 478 (57.7%) | 351 (42.3%) |
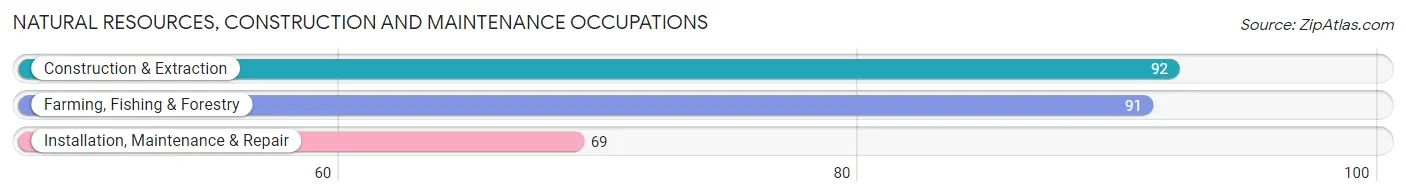
Natural Resources, Construction and Maintenance Occupations
The most common Natural Resources, Construction and Maintenance occupations in Leachville are Construction & Extraction (92 | 11.1%), Farming, Fishing & Forestry (91 | 11.0%), and Installation, Maintenance & Repair (69 | 8.3%).
Natural Resources, Construction and Maintenance Occupations by Sex
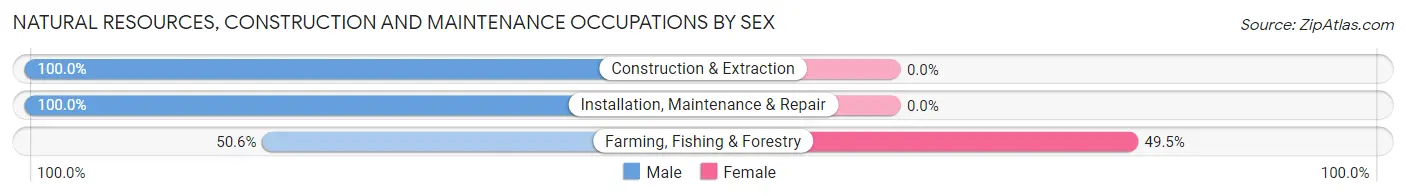
| Occupation | Male | Female |
| Farming, Fishing & Forestry | 46 (50.5%) | 45 (49.4%) |
| Construction & Extraction | 92 (100.0%) | 0 (0.0%) |
| Installation, Maintenance & Repair | 69 (100.0%) | 0 (0.0%) |
| Total (Category) | 207 (82.1%) | 45 (17.9%) |
| Total (Overall) | 478 (57.7%) | 351 (42.3%) |
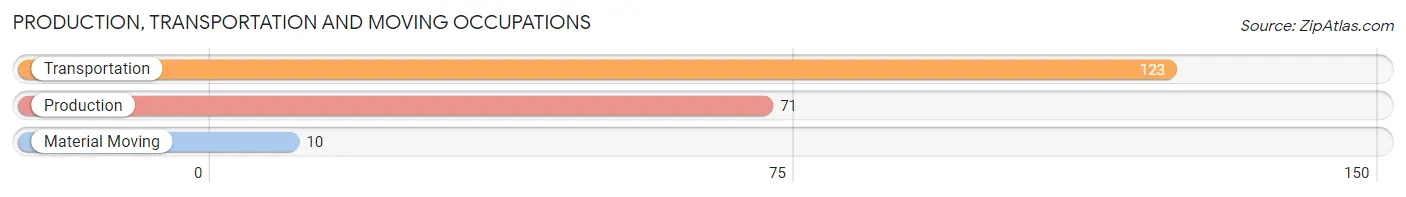
Production, Transportation and Moving Occupations
The most common Production, Transportation and Moving occupations in Leachville are Transportation (123 | 14.8%), Production (71 | 8.6%), and Material Moving (10 | 1.2%).
Production, Transportation and Moving Occupations by Sex
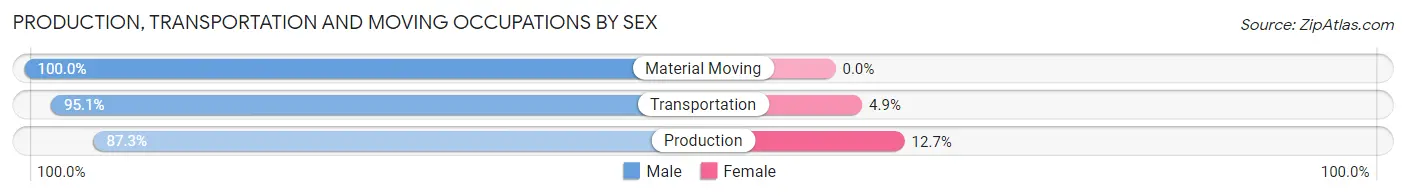
| Occupation | Male | Female |
| Production | 62 (87.3%) | 9 (12.7%) |
| Transportation | 117 (95.1%) | 6 (4.9%) |
| Material Moving | 10 (100.0%) | 0 (0.0%) |
| Total (Category) | 189 (92.6%) | 15 (7.3%) |
| Total (Overall) | 478 (57.7%) | 351 (42.3%) |
Employment Industries by Sex in Leachville
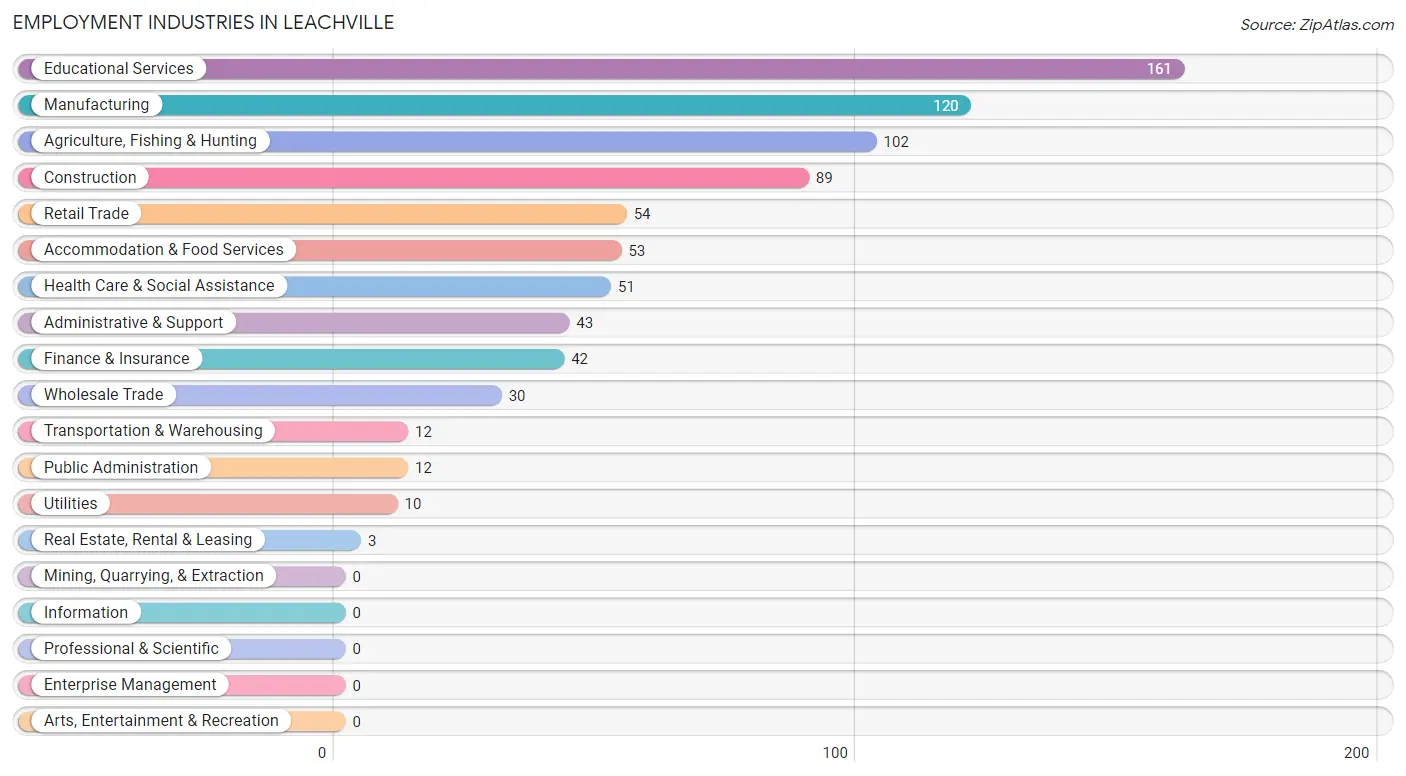
Employment Industries in Leachville
The major employment industries in Leachville include Educational Services (161 | 19.4%), Manufacturing (120 | 14.5%), Agriculture, Fishing & Hunting (102 | 12.3%), Construction (89 | 10.7%), and Retail Trade (54 | 6.5%).
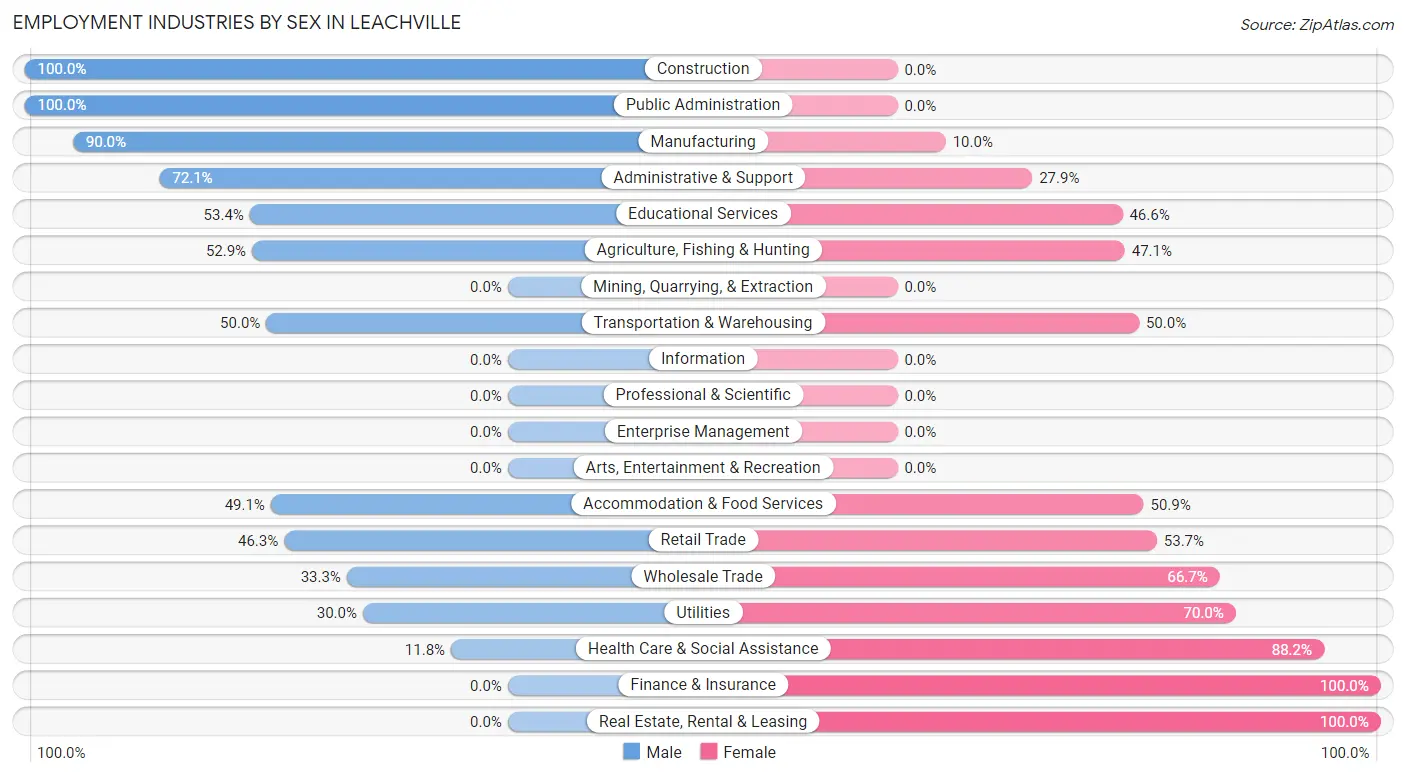
Employment Industries by Sex in Leachville
The Leachville industries that see more men than women are Construction (100.0%), Public Administration (100.0%), and Manufacturing (90.0%), whereas the industries that tend to have a higher number of women are Finance & Insurance (100.0%), Real Estate, Rental & Leasing (100.0%), and Health Care & Social Assistance (88.2%).
| Industry | Male | Female |
| Agriculture, Fishing & Hunting | 54 (52.9%) | 48 (47.1%) |
| Mining, Quarrying, & Extraction | 0 (0.0%) | 0 (0.0%) |
| Construction | 89 (100.0%) | 0 (0.0%) |
| Manufacturing | 108 (90.0%) | 12 (10.0%) |
| Wholesale Trade | 10 (33.3%) | 20 (66.7%) |
| Retail Trade | 25 (46.3%) | 29 (53.7%) |
| Transportation & Warehousing | 6 (50.0%) | 6 (50.0%) |
| Utilities | 3 (30.0%) | 7 (70.0%) |
| Information | 0 (0.0%) | 0 (0.0%) |
| Finance & Insurance | 0 (0.0%) | 42 (100.0%) |
| Real Estate, Rental & Leasing | 0 (0.0%) | 3 (100.0%) |
| Professional & Scientific | 0 (0.0%) | 0 (0.0%) |
| Enterprise Management | 0 (0.0%) | 0 (0.0%) |
| Administrative & Support | 31 (72.1%) | 12 (27.9%) |
| Educational Services | 86 (53.4%) | 75 (46.6%) |
| Health Care & Social Assistance | 6 (11.8%) | 45 (88.2%) |
| Arts, Entertainment & Recreation | 0 (0.0%) | 0 (0.0%) |
| Accommodation & Food Services | 26 (49.1%) | 27 (50.9%) |
| Public Administration | 12 (100.0%) | 0 (0.0%) |
| Total | 478 (57.7%) | 351 (42.3%) |
Education in Leachville
School Enrollment in Leachville
The most common levels of schooling among the 549 students in Leachville are high school (199 | 36.2%), elementary school (128 | 23.3%), and middle school (90 | 16.4%).
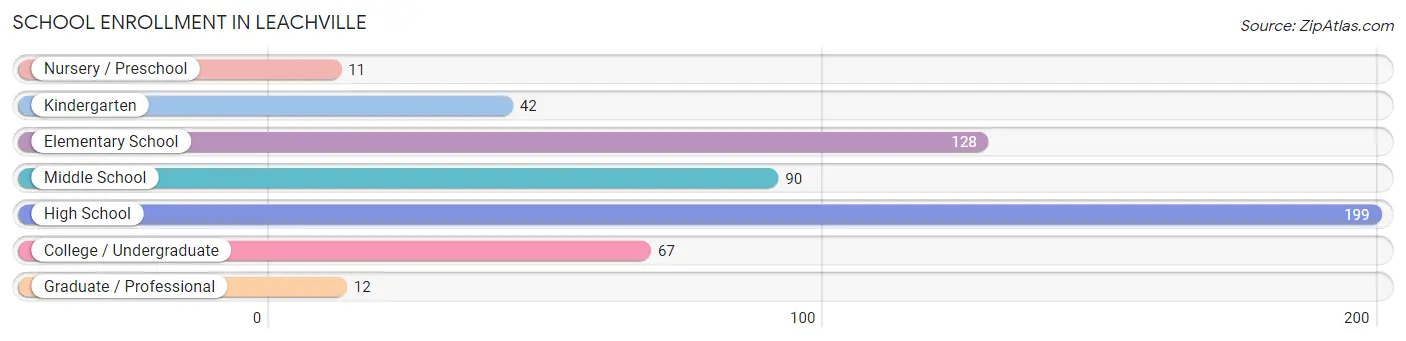
| School Level | # Students | % Students |
| Nursery / Preschool | 11 | 2.0% |
| Kindergarten | 42 | 7.6% |
| Elementary School | 128 | 23.3% |
| Middle School | 90 | 16.4% |
| High School | 199 | 36.2% |
| College / Undergraduate | 67 | 12.2% |
| Graduate / Professional | 12 | 2.2% |
| Total | 549 | 100.0% |
School Enrollment by Age by Funding Source in Leachville
Out of a total of 549 students who are enrolled in schools in Leachville, 11 (2.0%) attend a private institution, while the remaining 538 (98.0%) are enrolled in public schools. The age group of 18 to 19 year olds has the highest likelihood of being enrolled in private schools, with 11 (36.7% in the age bracket) enrolled. Conversely, the age group of 5 to 9 year old has the lowest likelihood of being enrolled in a private school, with 170 (100.0% in the age bracket) attending a public institution.
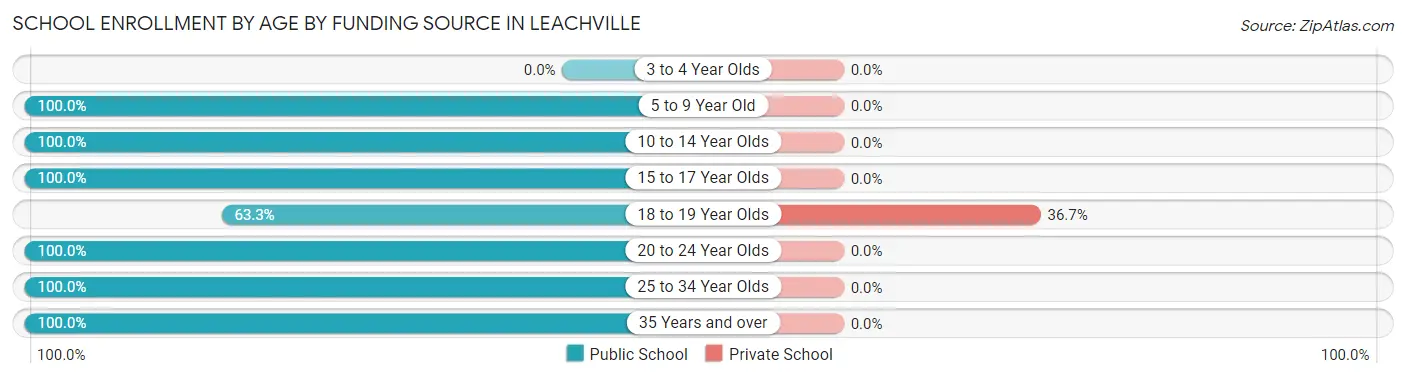
| Age Bracket | Public School | Private School |
| 3 to 4 Year Olds | 0 (0.0%) | 0 (0.0%) |
| 5 to 9 Year Old | 170 (100.0%) | 0 (0.0%) |
| 10 to 14 Year Olds | 166 (100.0%) | 0 (0.0%) |
| 15 to 17 Year Olds | 123 (100.0%) | 0 (0.0%) |
| 18 to 19 Year Olds | 19 (63.3%) | 11 (36.7%) |
| 20 to 24 Year Olds | 45 (100.0%) | 0 (0.0%) |
| 25 to 34 Year Olds | 3 (100.0%) | 0 (0.0%) |
| 35 Years and over | 12 (100.0%) | 0 (0.0%) |
| Total | 538 (98.0%) | 11 (2.0%) |
Educational Attainment by Field of Study in Leachville
Education (133 | 76.0%), engineering (16 | 9.1%), business (13 | 7.4%), social sciences (8 | 4.6%), and arts & humanities (5 | 2.9%) are the most common fields of study among 175 individuals in Leachville who have obtained a bachelor's degree or higher.
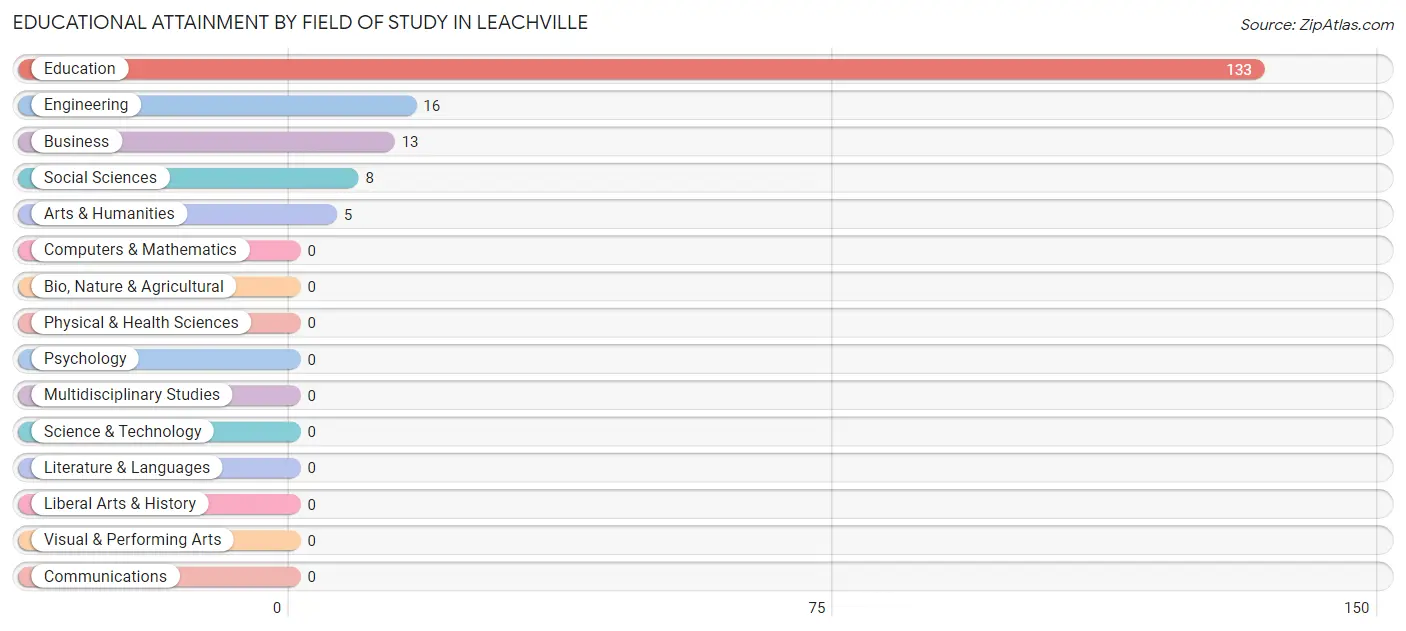
| Field of Study | # Graduates | % Graduates |
| Computers & Mathematics | 0 | 0.0% |
| Bio, Nature & Agricultural | 0 | 0.0% |
| Physical & Health Sciences | 0 | 0.0% |
| Psychology | 0 | 0.0% |
| Social Sciences | 8 | 4.6% |
| Engineering | 16 | 9.1% |
| Multidisciplinary Studies | 0 | 0.0% |
| Science & Technology | 0 | 0.0% |
| Business | 13 | 7.4% |
| Education | 133 | 76.0% |
| Literature & Languages | 0 | 0.0% |
| Liberal Arts & History | 0 | 0.0% |
| Visual & Performing Arts | 0 | 0.0% |
| Communications | 0 | 0.0% |
| Arts & Humanities | 5 | 2.9% |
| Total | 175 | 100.0% |
Transportation & Commute in Leachville
Vehicle Availability by Sex in Leachville
The most prevalent vehicle ownership categories in Leachville are males with 2 vehicles (169, accounting for 36.2%) and females with 2 vehicles (157, making up 49.4%).
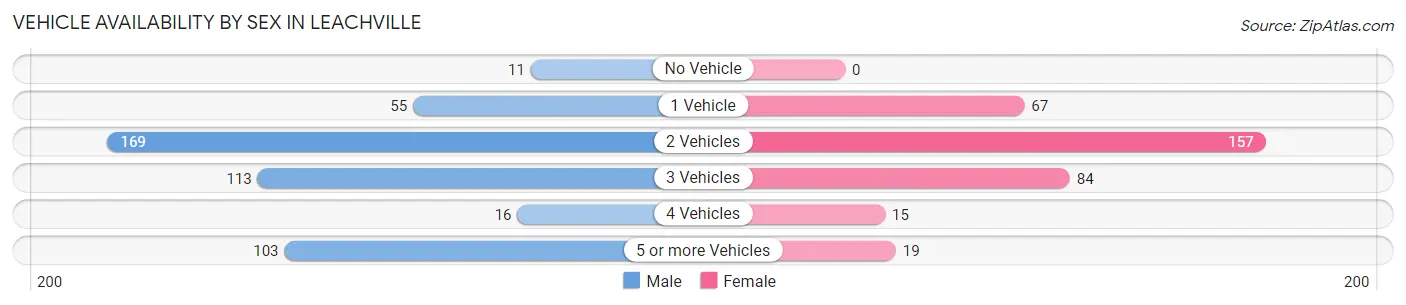
| Vehicles Available | Male | Female |
| No Vehicle | 11 (2.4%) | 0 (0.0%) |
| 1 Vehicle | 55 (11.8%) | 67 (19.6%) |
| 2 Vehicles | 169 (36.2%) | 157 (45.9%) |
| 3 Vehicles | 113 (24.2%) | 84 (24.6%) |
| 4 Vehicles | 16 (3.4%) | 15 (4.4%) |
| 5 or more Vehicles | 103 (22.1%) | 19 (5.6%) |
| Total | 467 (100.0%) | 342 (100.0%) |
Commute Time in Leachville
The most frequently occuring commute durations in Leachville are 45 to 59 minutes (217 commuters, 26.8%), less than 5 minutes (113 commuters, 14.0%), and 5 to 9 minutes (110 commuters, 13.6%).
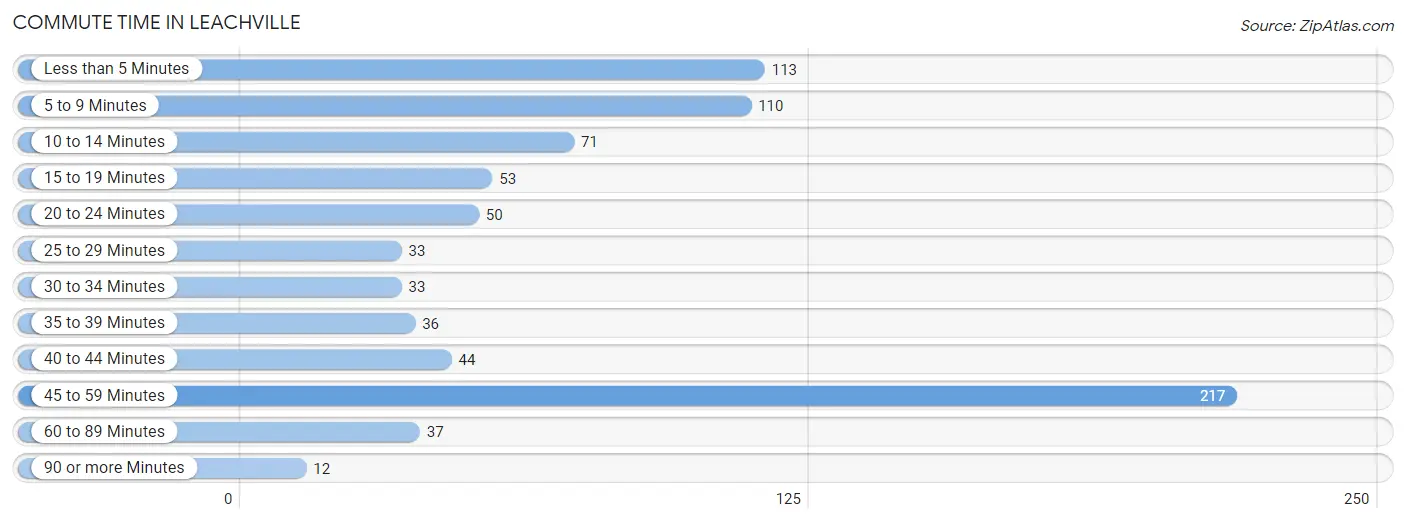
| Commute Time | # Commuters | % Commuters |
| Less than 5 Minutes | 113 | 14.0% |
| 5 to 9 Minutes | 110 | 13.6% |
| 10 to 14 Minutes | 71 | 8.8% |
| 15 to 19 Minutes | 53 | 6.6% |
| 20 to 24 Minutes | 50 | 6.2% |
| 25 to 29 Minutes | 33 | 4.1% |
| 30 to 34 Minutes | 33 | 4.1% |
| 35 to 39 Minutes | 36 | 4.4% |
| 40 to 44 Minutes | 44 | 5.4% |
| 45 to 59 Minutes | 217 | 26.8% |
| 60 to 89 Minutes | 37 | 4.6% |
| 90 or more Minutes | 12 | 1.5% |
Commute Time by Sex in Leachville
The most common commute times in Leachville are 45 to 59 minutes (149 commuters, 31.9%) for males and less than 5 minutes (84 commuters, 24.6%) for females.
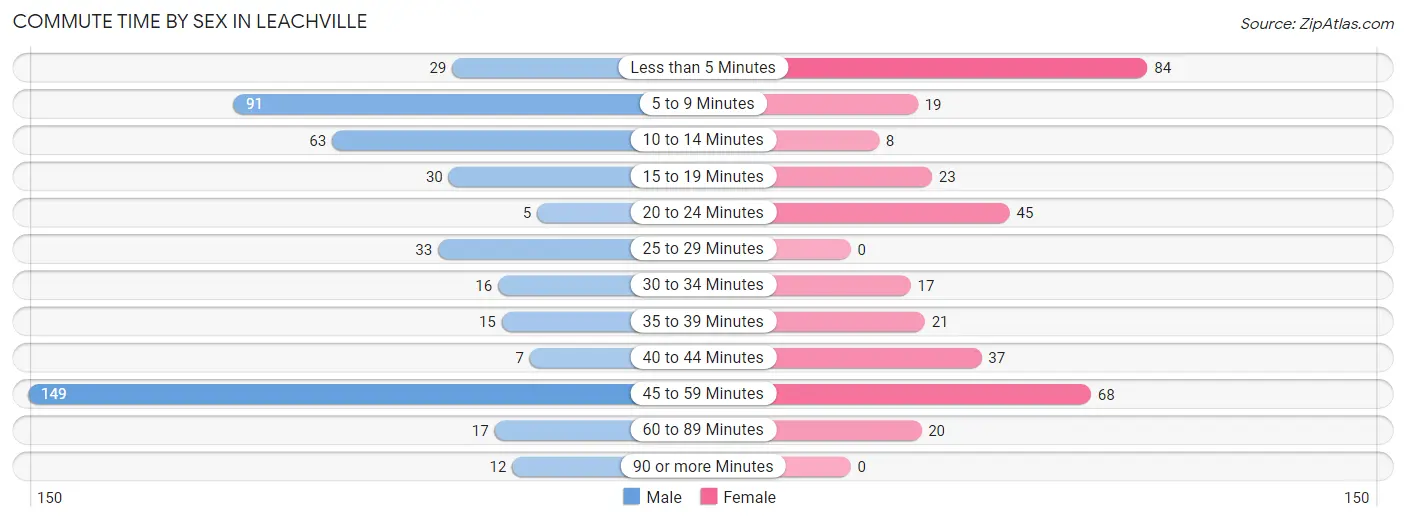
| Commute Time | Male | Female |
| Less than 5 Minutes | 29 (6.2%) | 84 (24.6%) |
| 5 to 9 Minutes | 91 (19.5%) | 19 (5.6%) |
| 10 to 14 Minutes | 63 (13.5%) | 8 (2.3%) |
| 15 to 19 Minutes | 30 (6.4%) | 23 (6.7%) |
| 20 to 24 Minutes | 5 (1.1%) | 45 (13.2%) |
| 25 to 29 Minutes | 33 (7.1%) | 0 (0.0%) |
| 30 to 34 Minutes | 16 (3.4%) | 17 (5.0%) |
| 35 to 39 Minutes | 15 (3.2%) | 21 (6.1%) |
| 40 to 44 Minutes | 7 (1.5%) | 37 (10.8%) |
| 45 to 59 Minutes | 149 (31.9%) | 68 (19.9%) |
| 60 to 89 Minutes | 17 (3.6%) | 20 (5.9%) |
| 90 or more Minutes | 12 (2.6%) | 0 (0.0%) |
Time of Departure to Work by Sex in Leachville
The most frequent times of departure to work in Leachville are 6:30 AM to 6:59 AM (122, 26.1%) for males and 6:00 AM to 6:29 AM (101, 29.5%) for females.
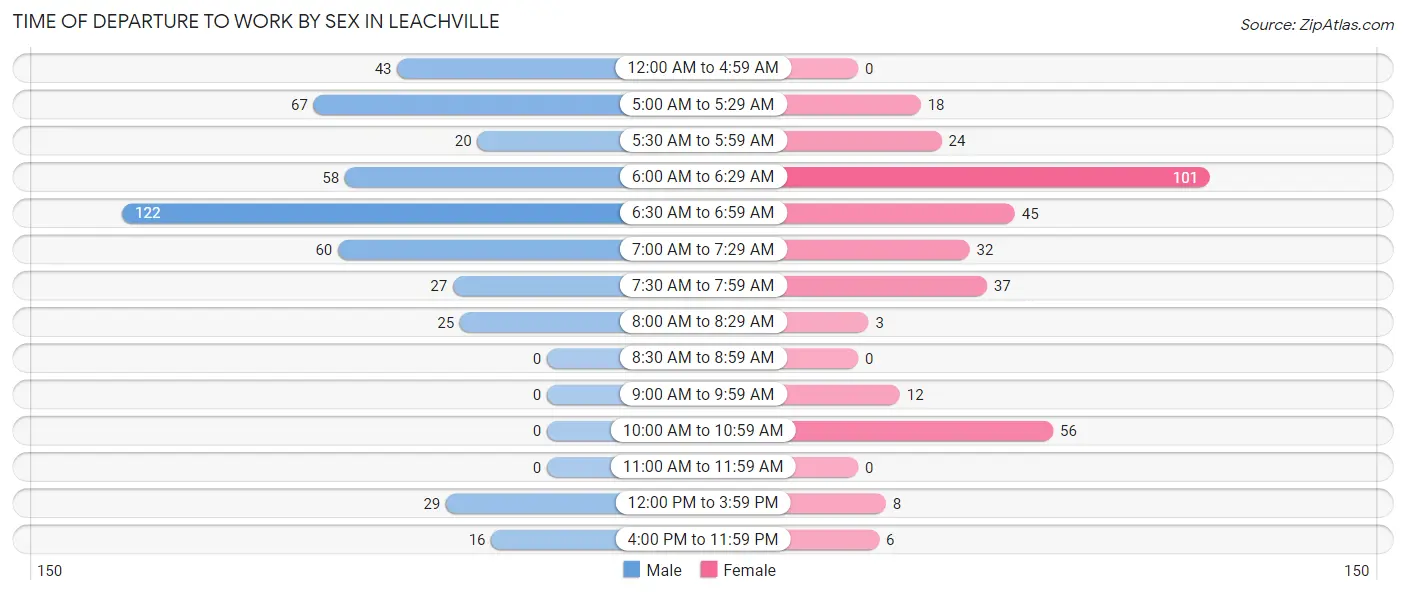
| Time of Departure | Male | Female |
| 12:00 AM to 4:59 AM | 43 (9.2%) | 0 (0.0%) |
| 5:00 AM to 5:29 AM | 67 (14.3%) | 18 (5.3%) |
| 5:30 AM to 5:59 AM | 20 (4.3%) | 24 (7.0%) |
| 6:00 AM to 6:29 AM | 58 (12.4%) | 101 (29.5%) |
| 6:30 AM to 6:59 AM | 122 (26.1%) | 45 (13.2%) |
| 7:00 AM to 7:29 AM | 60 (12.9%) | 32 (9.4%) |
| 7:30 AM to 7:59 AM | 27 (5.8%) | 37 (10.8%) |
| 8:00 AM to 8:29 AM | 25 (5.3%) | 3 (0.9%) |
| 8:30 AM to 8:59 AM | 0 (0.0%) | 0 (0.0%) |
| 9:00 AM to 9:59 AM | 0 (0.0%) | 12 (3.5%) |
| 10:00 AM to 10:59 AM | 0 (0.0%) | 56 (16.4%) |
| 11:00 AM to 11:59 AM | 0 (0.0%) | 0 (0.0%) |
| 12:00 PM to 3:59 PM | 29 (6.2%) | 8 (2.3%) |
| 4:00 PM to 11:59 PM | 16 (3.4%) | 6 (1.8%) |
| Total | 467 (100.0%) | 342 (100.0%) |
Housing Occupancy in Leachville
Occupancy by Ownership in Leachville
Of the total 833 dwellings in Leachville, owner-occupied units account for 545 (65.4%), while renter-occupied units make up 288 (34.6%).
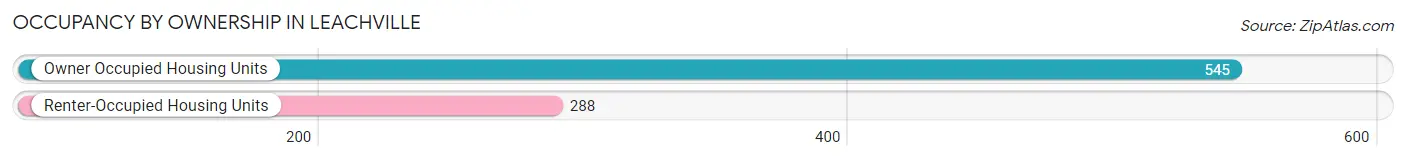
| Occupancy | # Housing Units | % Housing Units |
| Owner Occupied Housing Units | 545 | 65.4% |
| Renter-Occupied Housing Units | 288 | 34.6% |
| Total Occupied Housing Units | 833 | 100.0% |
Occupancy by Household Size in Leachville
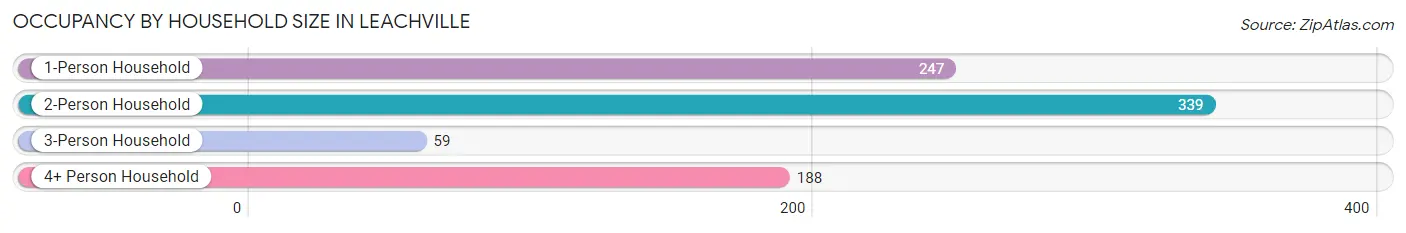
| Household Size | # Housing Units | % Housing Units |
| 1-Person Household | 247 | 29.6% |
| 2-Person Household | 339 | 40.7% |
| 3-Person Household | 59 | 7.1% |
| 4+ Person Household | 188 | 22.6% |
| Total Housing Units | 833 | 100.0% |
Occupancy by Ownership by Household Size in Leachville
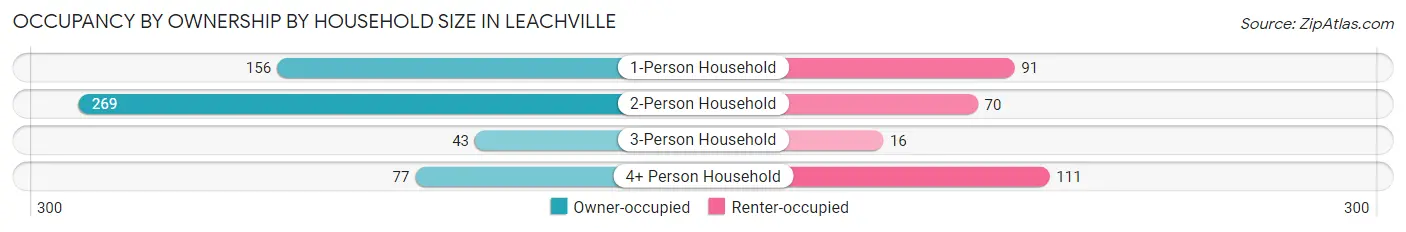
| Household Size | Owner-occupied | Renter-occupied |
| 1-Person Household | 156 (63.2%) | 91 (36.8%) |
| 2-Person Household | 269 (79.3%) | 70 (20.6%) |
| 3-Person Household | 43 (72.9%) | 16 (27.1%) |
| 4+ Person Household | 77 (41.0%) | 111 (59.0%) |
| Total Housing Units | 545 (65.4%) | 288 (34.6%) |
Occupancy by Educational Attainment in Leachville
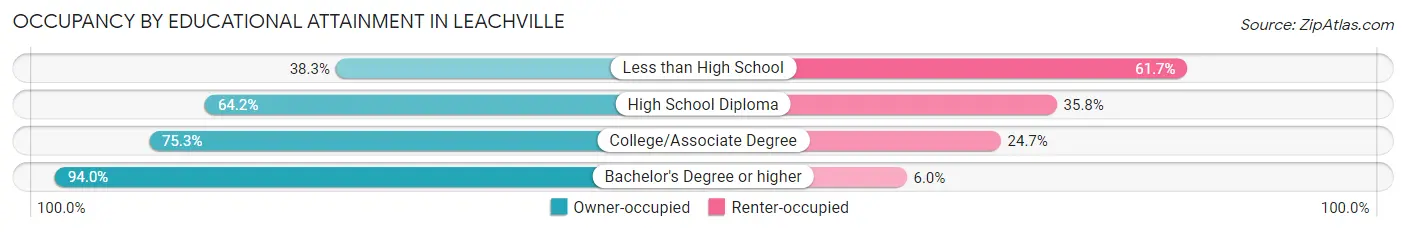
| Household Size | Owner-occupied | Renter-occupied |
| Less than High School | 59 (38.3%) | 95 (61.7%) |
| High School Diploma | 237 (64.2%) | 132 (35.8%) |
| College/Associate Degree | 171 (75.3%) | 56 (24.7%) |
| Bachelor's Degree or higher | 78 (94.0%) | 5 (6.0%) |
Occupancy by Age of Householder in Leachville
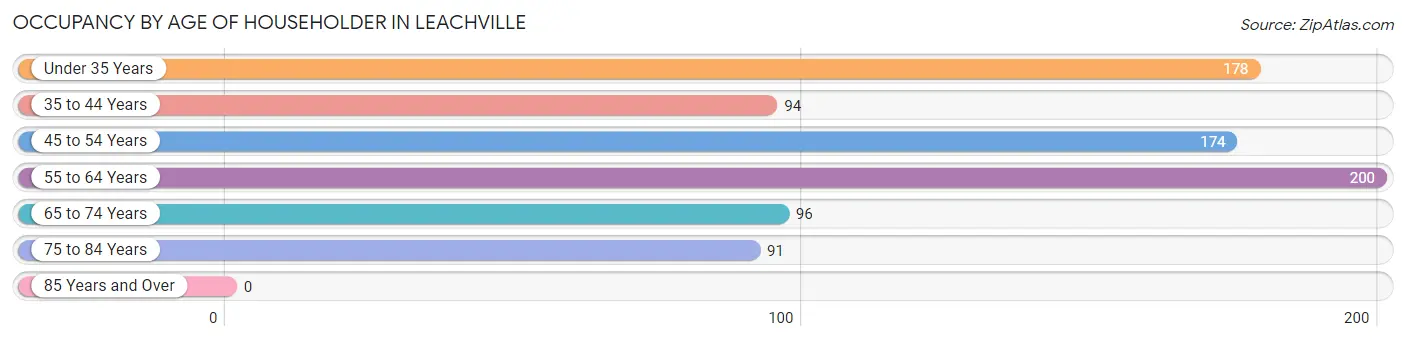
| Age Bracket | # Households | % Households |
| Under 35 Years | 178 | 21.4% |
| 35 to 44 Years | 94 | 11.3% |
| 45 to 54 Years | 174 | 20.9% |
| 55 to 64 Years | 200 | 24.0% |
| 65 to 74 Years | 96 | 11.5% |
| 75 to 84 Years | 91 | 10.9% |
| 85 Years and Over | 0 | 0.0% |
| Total | 833 | 100.0% |
Housing Finances in Leachville
Median Income by Occupancy in Leachville
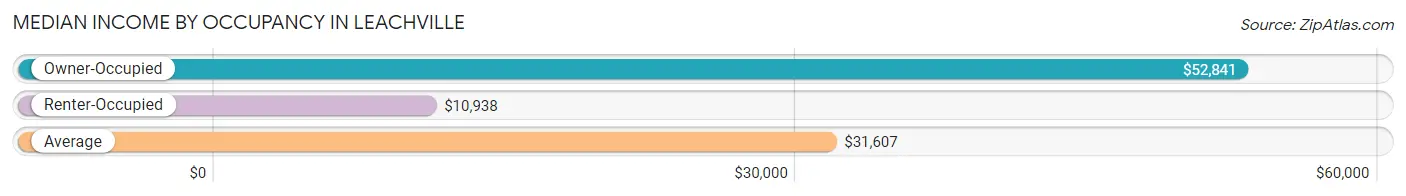
| Occupancy Type | # Households | Median Income |
| Owner-Occupied | 545 (65.4%) | $52,841 |
| Renter-Occupied | 288 (34.6%) | $10,938 |
| Average | 833 (100.0%) | $31,607 |
Occupancy by Householder Income Bracket in Leachville
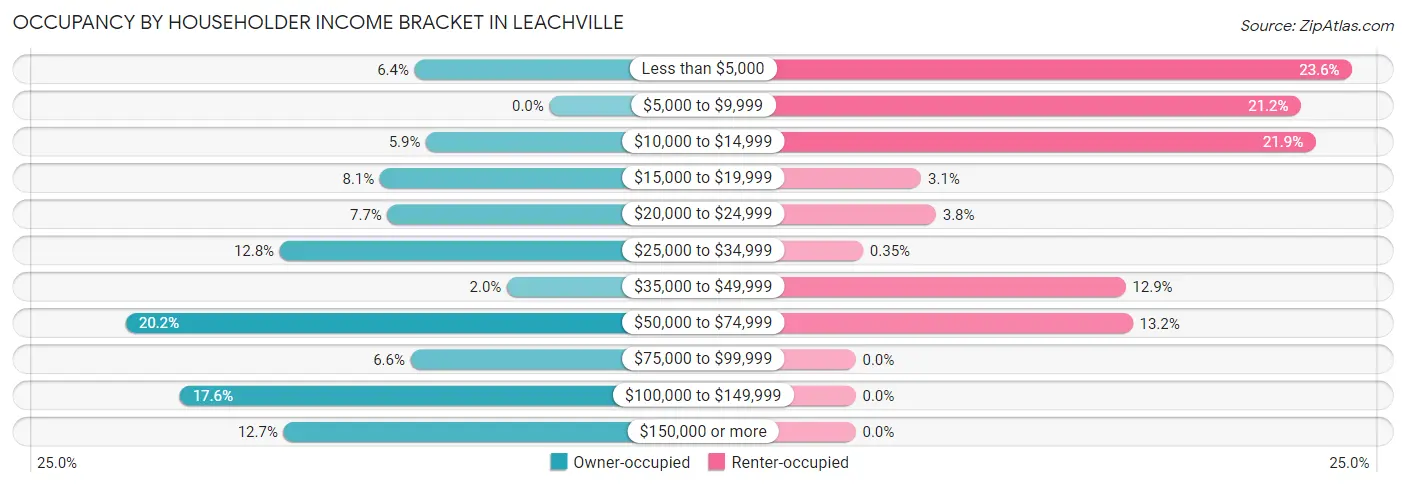
| Income Bracket | Owner-occupied | Renter-occupied |
| Less than $5,000 | 35 (6.4%) | 68 (23.6%) |
| $5,000 to $9,999 | 0 (0.0%) | 61 (21.2%) |
| $10,000 to $14,999 | 32 (5.9%) | 63 (21.9%) |
| $15,000 to $19,999 | 44 (8.1%) | 9 (3.1%) |
| $20,000 to $24,999 | 42 (7.7%) | 11 (3.8%) |
| $25,000 to $34,999 | 70 (12.8%) | 1 (0.4%) |
| $35,000 to $49,999 | 11 (2.0%) | 37 (12.9%) |
| $50,000 to $74,999 | 110 (20.2%) | 38 (13.2%) |
| $75,000 to $99,999 | 36 (6.6%) | 0 (0.0%) |
| $100,000 to $149,999 | 96 (17.6%) | 0 (0.0%) |
| $150,000 or more | 69 (12.7%) | 0 (0.0%) |
| Total | 545 (100.0%) | 288 (100.0%) |
Monthly Housing Cost Tiers in Leachville
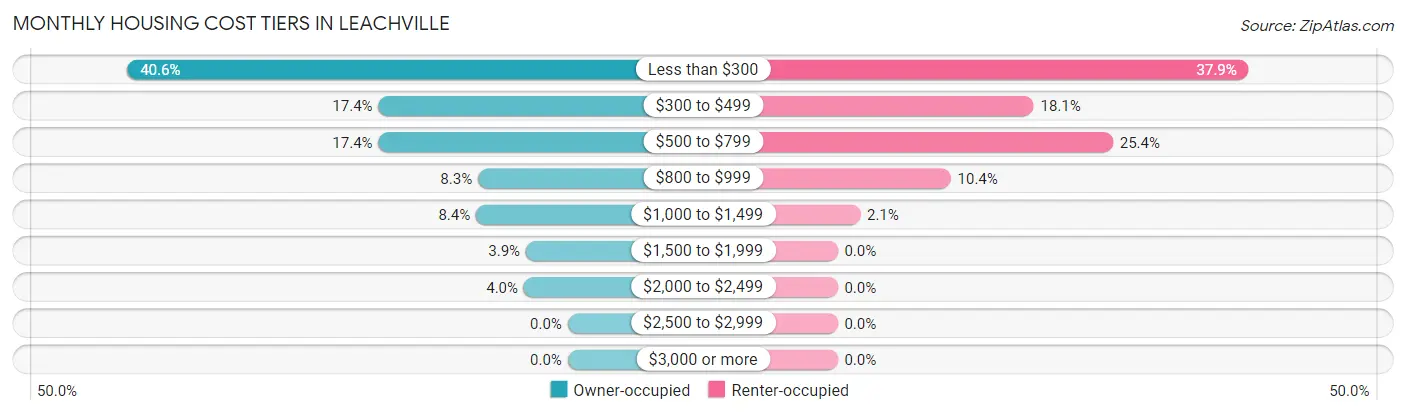
| Monthly Cost | Owner-occupied | Renter-occupied |
| Less than $300 | 221 (40.6%) | 109 (37.9%) |
| $300 to $499 | 95 (17.4%) | 52 (18.1%) |
| $500 to $799 | 95 (17.4%) | 73 (25.4%) |
| $800 to $999 | 45 (8.3%) | 30 (10.4%) |
| $1,000 to $1,499 | 46 (8.4%) | 6 (2.1%) |
| $1,500 to $1,999 | 21 (3.8%) | 0 (0.0%) |
| $2,000 to $2,499 | 22 (4.0%) | 0 (0.0%) |
| $2,500 to $2,999 | 0 (0.0%) | 0 (0.0%) |
| $3,000 or more | 0 (0.0%) | 0 (0.0%) |
| Total | 545 (100.0%) | 288 (100.0%) |
Physical Housing Characteristics in Leachville
Housing Structures in Leachville
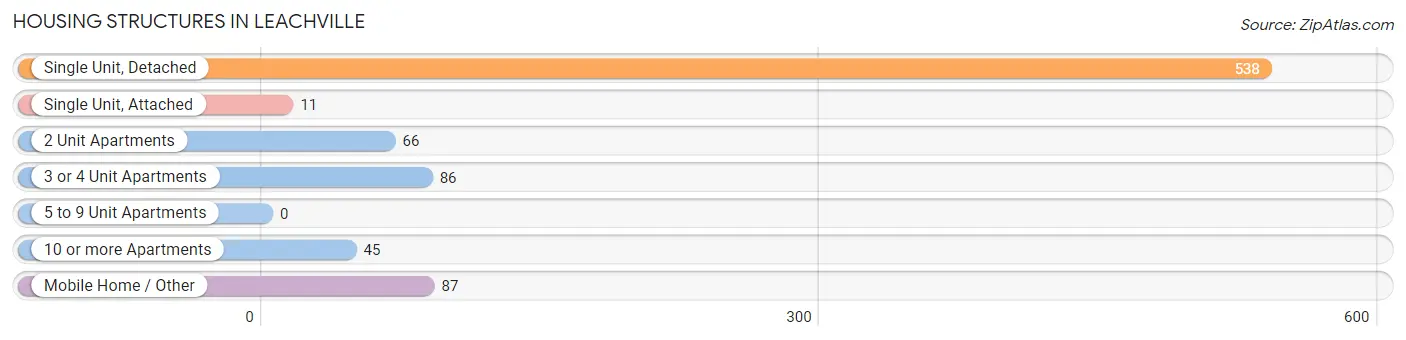
| Structure Type | # Housing Units | % Housing Units |
| Single Unit, Detached | 538 | 64.6% |
| Single Unit, Attached | 11 | 1.3% |
| 2 Unit Apartments | 66 | 7.9% |
| 3 or 4 Unit Apartments | 86 | 10.3% |
| 5 to 9 Unit Apartments | 0 | 0.0% |
| 10 or more Apartments | 45 | 5.4% |
| Mobile Home / Other | 87 | 10.4% |
| Total | 833 | 100.0% |
Housing Structures by Occupancy in Leachville
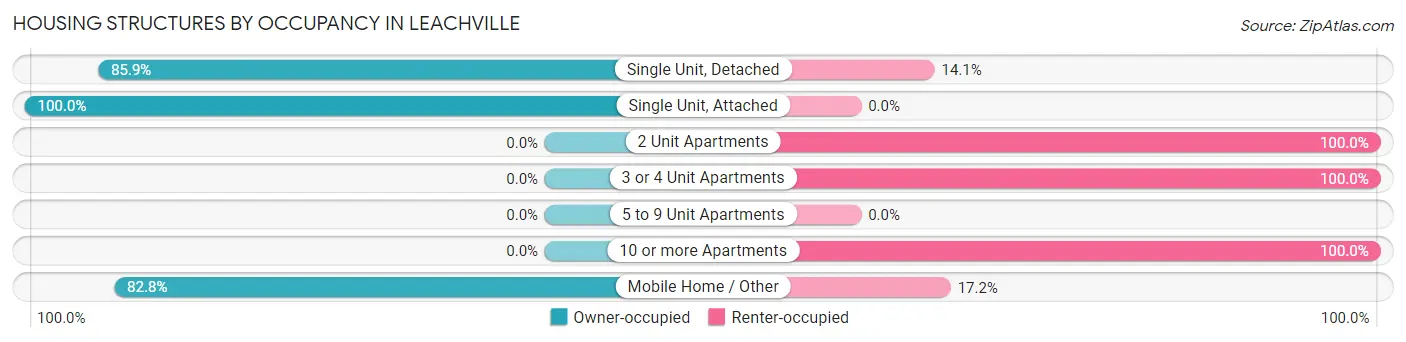
| Structure Type | Owner-occupied | Renter-occupied |
| Single Unit, Detached | 462 (85.9%) | 76 (14.1%) |
| Single Unit, Attached | 11 (100.0%) | 0 (0.0%) |
| 2 Unit Apartments | 0 (0.0%) | 66 (100.0%) |
| 3 or 4 Unit Apartments | 0 (0.0%) | 86 (100.0%) |
| 5 to 9 Unit Apartments | 0 (0.0%) | 0 (0.0%) |
| 10 or more Apartments | 0 (0.0%) | 45 (100.0%) |
| Mobile Home / Other | 72 (82.8%) | 15 (17.2%) |
| Total | 545 (65.4%) | 288 (34.6%) |
Housing Structures by Number of Rooms in Leachville
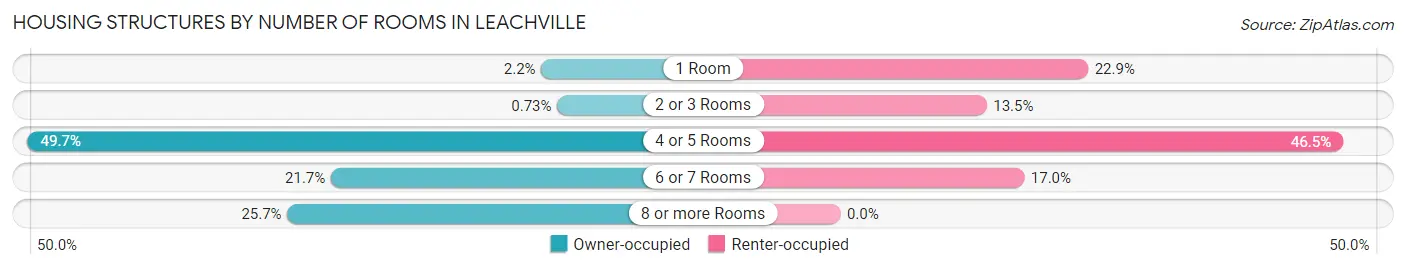
| Number of Rooms | Owner-occupied | Renter-occupied |
| 1 Room | 12 (2.2%) | 66 (22.9%) |
| 2 or 3 Rooms | 4 (0.7%) | 39 (13.5%) |
| 4 or 5 Rooms | 271 (49.7%) | 134 (46.5%) |
| 6 or 7 Rooms | 118 (21.6%) | 49 (17.0%) |
| 8 or more Rooms | 140 (25.7%) | 0 (0.0%) |
| Total | 545 (100.0%) | 288 (100.0%) |
Housing Structure by Heating Type in Leachville
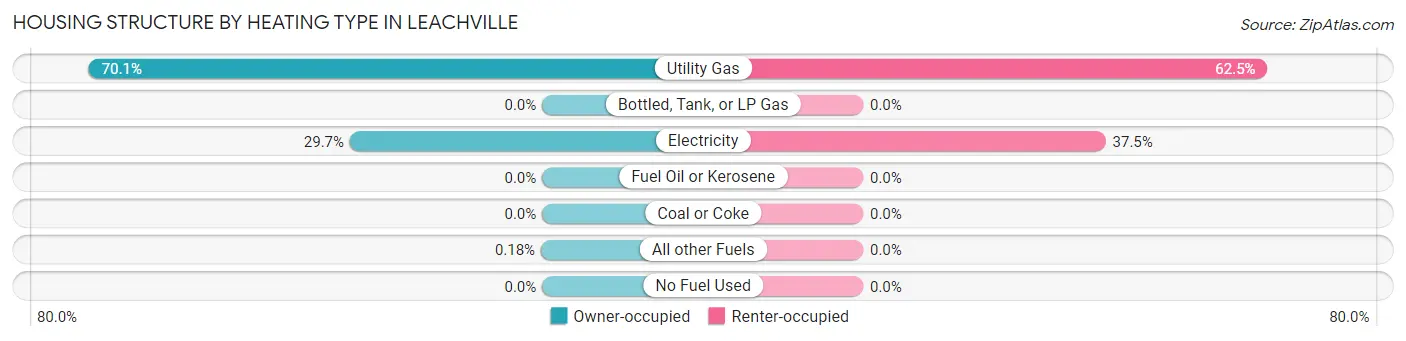
| Heating Type | Owner-occupied | Renter-occupied |
| Utility Gas | 382 (70.1%) | 180 (62.5%) |
| Bottled, Tank, or LP Gas | 0 (0.0%) | 0 (0.0%) |
| Electricity | 162 (29.7%) | 108 (37.5%) |
| Fuel Oil or Kerosene | 0 (0.0%) | 0 (0.0%) |
| Coal or Coke | 0 (0.0%) | 0 (0.0%) |
| All other Fuels | 1 (0.2%) | 0 (0.0%) |
| No Fuel Used | 0 (0.0%) | 0 (0.0%) |
| Total | 545 (100.0%) | 288 (100.0%) |
Household Vehicle Usage in Leachville
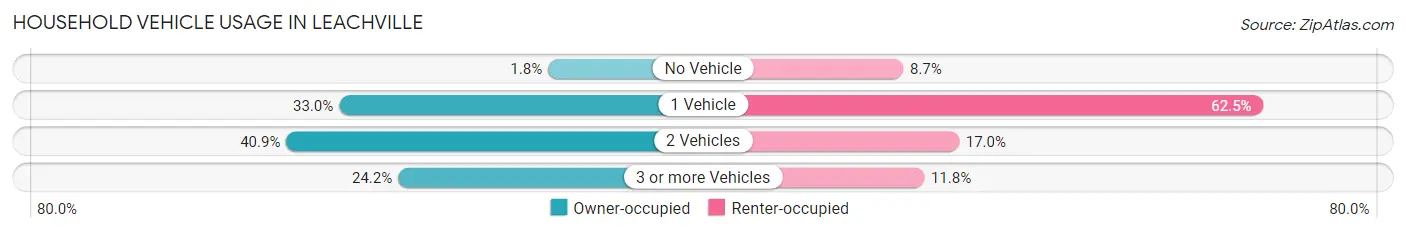
| Vehicles per Household | Owner-occupied | Renter-occupied |
| No Vehicle | 10 (1.8%) | 25 (8.7%) |
| 1 Vehicle | 180 (33.0%) | 180 (62.5%) |
| 2 Vehicles | 223 (40.9%) | 49 (17.0%) |
| 3 or more Vehicles | 132 (24.2%) | 34 (11.8%) |
| Total | 545 (100.0%) | 288 (100.0%) |
Real Estate & Mortgages in Leachville
Real Estate and Mortgage Overview in Leachville
| Characteristic | Without Mortgage | With Mortgage |
| Housing Units | 379 | 166 |
| Median Property Value | $103,900 | $157,500 |
| Median Household Income | $50,536 | $35 |
| Monthly Housing Costs | $281 | $0 |
| Real Estate Taxes | $450 | $0 |
Property Value by Mortgage Status in Leachville
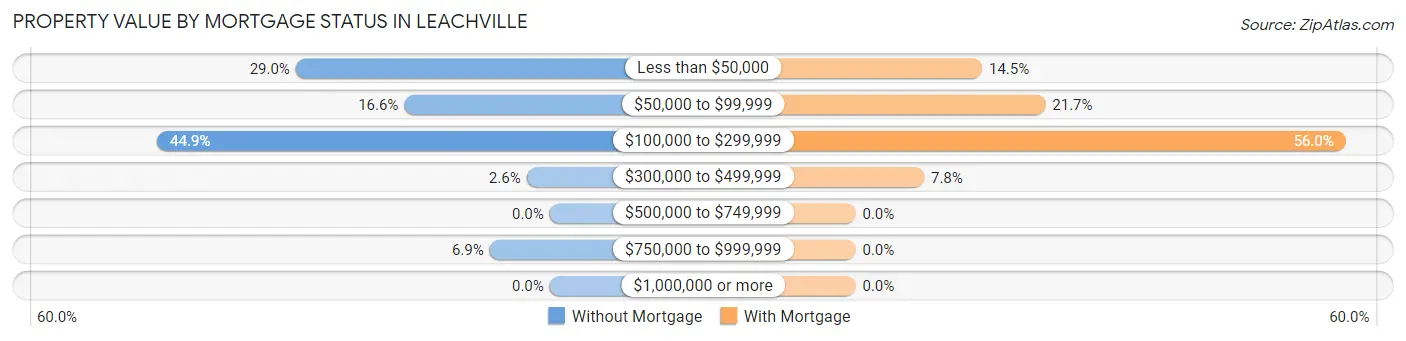
| Property Value | Without Mortgage | With Mortgage |
| Less than $50,000 | 110 (29.0%) | 24 (14.5%) |
| $50,000 to $99,999 | 63 (16.6%) | 36 (21.7%) |
| $100,000 to $299,999 | 170 (44.9%) | 93 (56.0%) |
| $300,000 to $499,999 | 10 (2.6%) | 13 (7.8%) |
| $500,000 to $749,999 | 0 (0.0%) | 0 (0.0%) |
| $750,000 to $999,999 | 26 (6.9%) | 0 (0.0%) |
| $1,000,000 or more | 0 (0.0%) | 0 (0.0%) |
| Total | 379 (100.0%) | 166 (100.0%) |
Household Income by Mortgage Status in Leachville
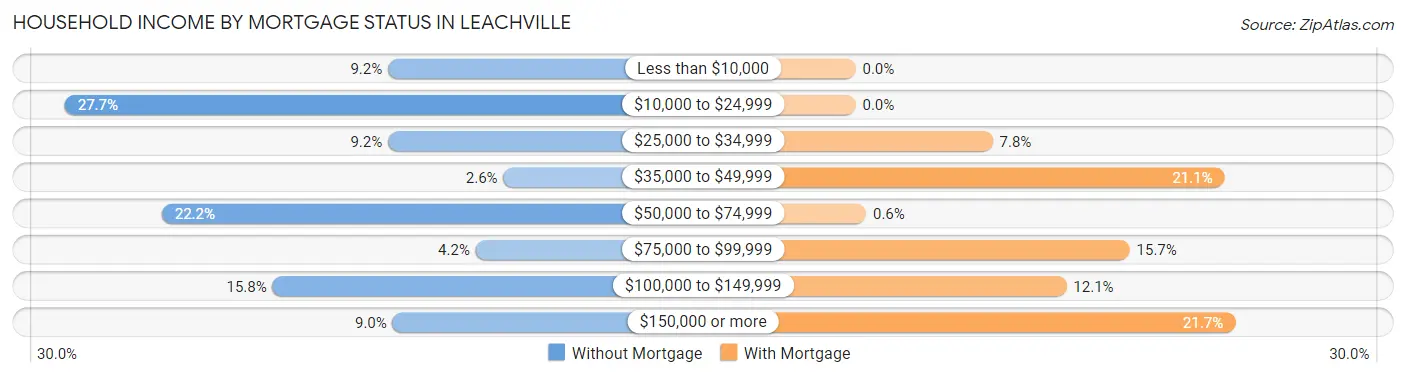
| Household Income | Without Mortgage | With Mortgage |
| Less than $10,000 | 35 (9.2%) | 0 (0.0%) |
| $10,000 to $24,999 | 105 (27.7%) | 0 (0.0%) |
| $25,000 to $34,999 | 35 (9.2%) | 13 (7.8%) |
| $35,000 to $49,999 | 10 (2.6%) | 35 (21.1%) |
| $50,000 to $74,999 | 84 (22.2%) | 1 (0.6%) |
| $75,000 to $99,999 | 16 (4.2%) | 26 (15.7%) |
| $100,000 to $149,999 | 60 (15.8%) | 20 (12.0%) |
| $150,000 or more | 34 (9.0%) | 36 (21.7%) |
| Total | 379 (100.0%) | 166 (100.0%) |
Property Value to Household Income Ratio in Leachville
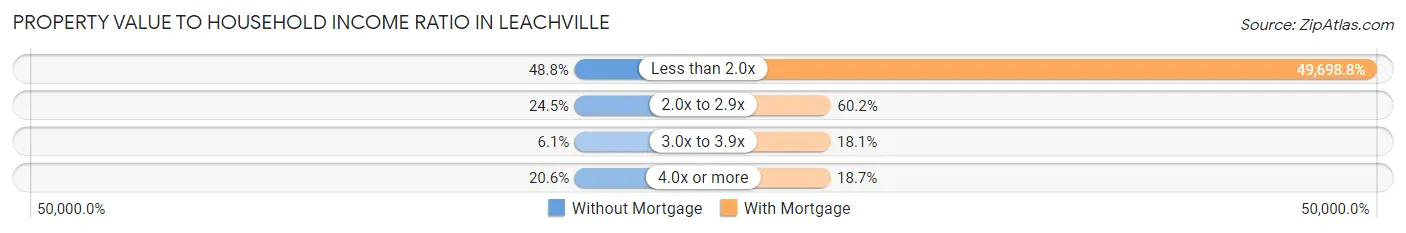
| Value-to-Income Ratio | Without Mortgage | With Mortgage |
| Less than 2.0x | 185 (48.8%) | 82,500 (49,698.8%) |
| 2.0x to 2.9x | 93 (24.5%) | 100 (60.2%) |
| 3.0x to 3.9x | 23 (6.1%) | 30 (18.1%) |
| 4.0x or more | 78 (20.6%) | 31 (18.7%) |
| Total | 379 (100.0%) | 166 (100.0%) |
Real Estate Taxes by Mortgage Status in Leachville
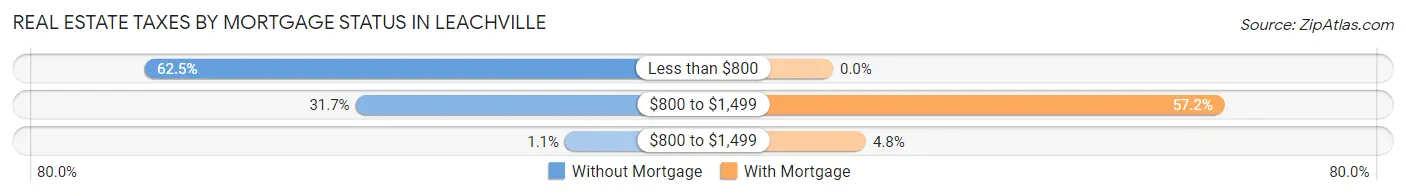
| Property Taxes | Without Mortgage | With Mortgage |
| Less than $800 | 237 (62.5%) | 0 (0.0%) |
| $800 to $1,499 | 120 (31.7%) | 95 (57.2%) |
| $800 to $1,499 | 4 (1.1%) | 8 (4.8%) |
| Total | 379 (100.0%) | 166 (100.0%) |
Health & Disability in Leachville
Health Insurance Coverage by Age in Leachville
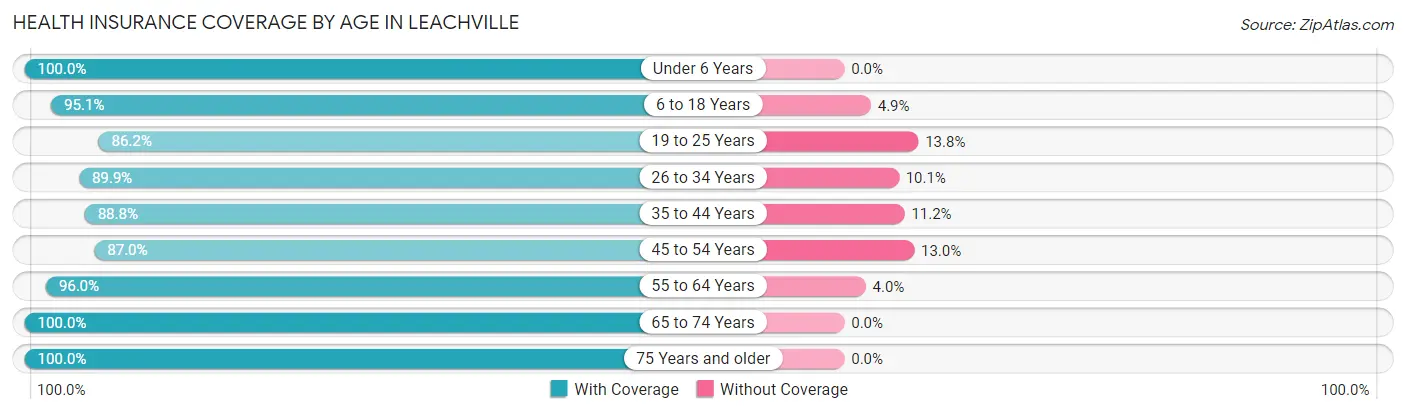
| Age Bracket | With Coverage | Without Coverage |
| Under 6 Years | 147 (100.0%) | 0 (0.0%) |
| 6 to 18 Years | 520 (95.1%) | 27 (4.9%) |
| 19 to 25 Years | 100 (86.2%) | 16 (13.8%) |
| 26 to 34 Years | 195 (89.9%) | 22 (10.1%) |
| 35 to 44 Years | 182 (88.8%) | 23 (11.2%) |
| 45 to 54 Years | 214 (87.0%) | 32 (13.0%) |
| 55 to 64 Years | 363 (96.0%) | 15 (4.0%) |
| 65 to 74 Years | 167 (100.0%) | 0 (0.0%) |
| 75 Years and older | 109 (100.0%) | 0 (0.0%) |
| Total | 1,997 (93.7%) | 135 (6.3%) |
Health Insurance Coverage by Citizenship Status in Leachville
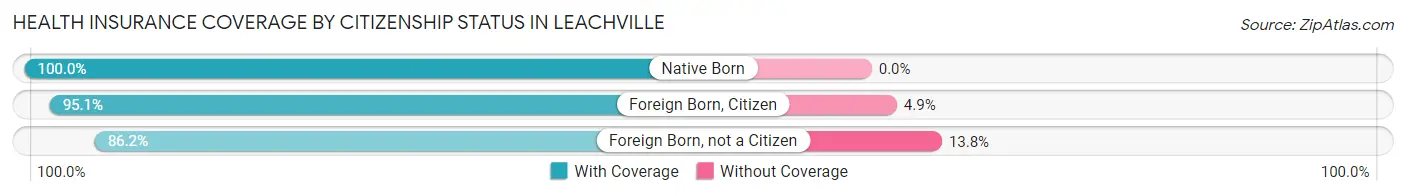
| Citizenship Status | With Coverage | Without Coverage |
| Native Born | 147 (100.0%) | 0 (0.0%) |
| Foreign Born, Citizen | 520 (95.1%) | 27 (4.9%) |
| Foreign Born, not a Citizen | 100 (86.2%) | 16 (13.8%) |
Health Insurance Coverage by Household Income in Leachville
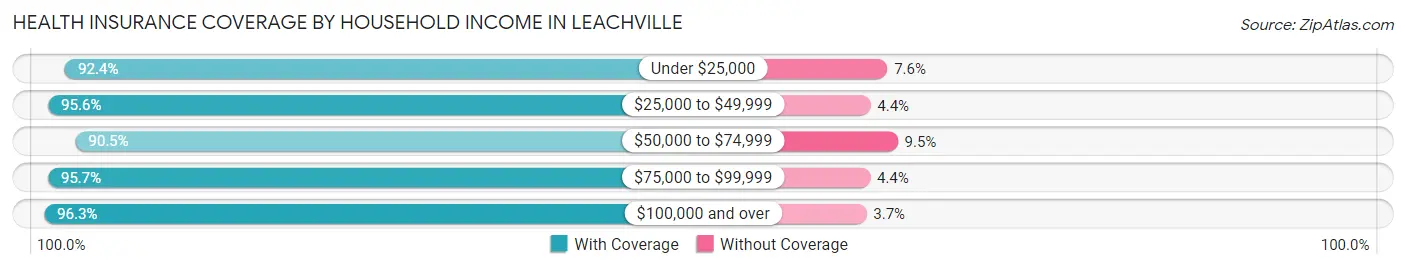
| Household Income | With Coverage | Without Coverage |
| Under $25,000 | 622 (92.4%) | 51 (7.6%) |
| $25,000 to $49,999 | 260 (95.6%) | 12 (4.4%) |
| $50,000 to $74,999 | 418 (90.5%) | 44 (9.5%) |
| $75,000 to $99,999 | 198 (95.7%) | 9 (4.3%) |
| $100,000 and over | 499 (96.3%) | 19 (3.7%) |
Public vs Private Health Insurance Coverage by Age in Leachville
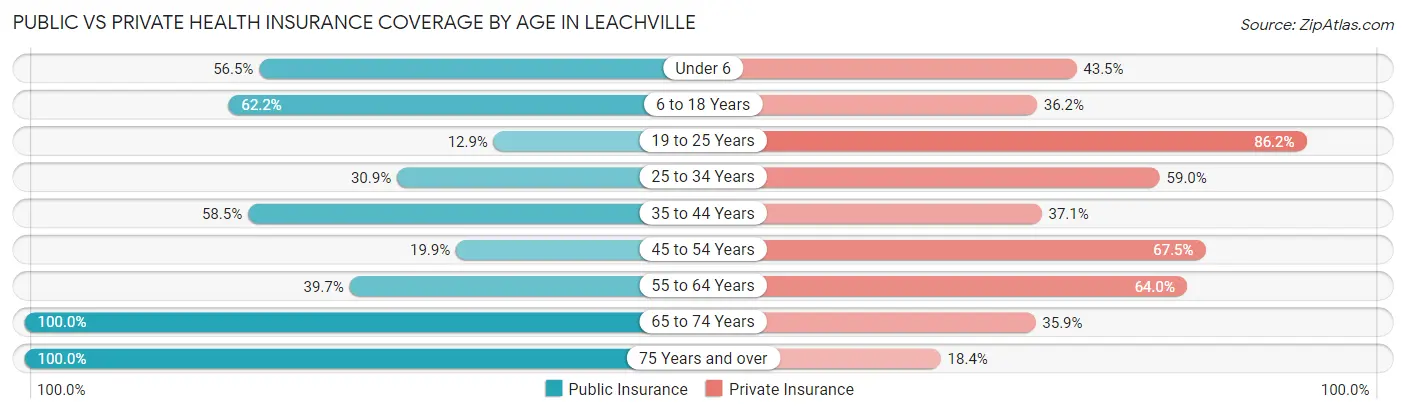
| Age Bracket | Public Insurance | Private Insurance |
| Under 6 | 83 (56.5%) | 64 (43.5%) |
| 6 to 18 Years | 340 (62.2%) | 198 (36.2%) |
| 19 to 25 Years | 15 (12.9%) | 100 (86.2%) |
| 25 to 34 Years | 67 (30.9%) | 128 (59.0%) |
| 35 to 44 Years | 120 (58.5%) | 76 (37.1%) |
| 45 to 54 Years | 49 (19.9%) | 166 (67.5%) |
| 55 to 64 Years | 150 (39.7%) | 242 (64.0%) |
| 65 to 74 Years | 167 (100.0%) | 60 (35.9%) |
| 75 Years and over | 109 (100.0%) | 20 (18.3%) |
| Total | 1,100 (51.6%) | 1,054 (49.4%) |
Disability Status by Sex by Age in Leachville
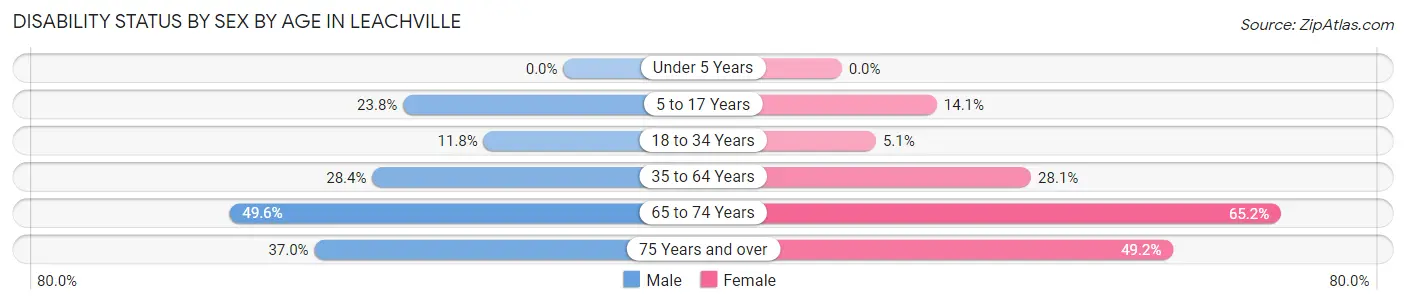
| Age Bracket | Male | Female |
| Under 5 Years | 0 (0.0%) | 0 (0.0%) |
| 5 to 17 Years | 69 (23.8%) | 36 (14.1%) |
| 18 to 34 Years | 18 (11.8%) | 10 (5.1%) |
| 35 to 64 Years | 101 (28.4%) | 133 (28.1%) |
| 65 to 74 Years | 60 (49.6%) | 30 (65.2%) |
| 75 Years and over | 17 (37.0%) | 31 (49.2%) |
Disability Class by Sex by Age in Leachville
Disability Class: Hearing Difficulty
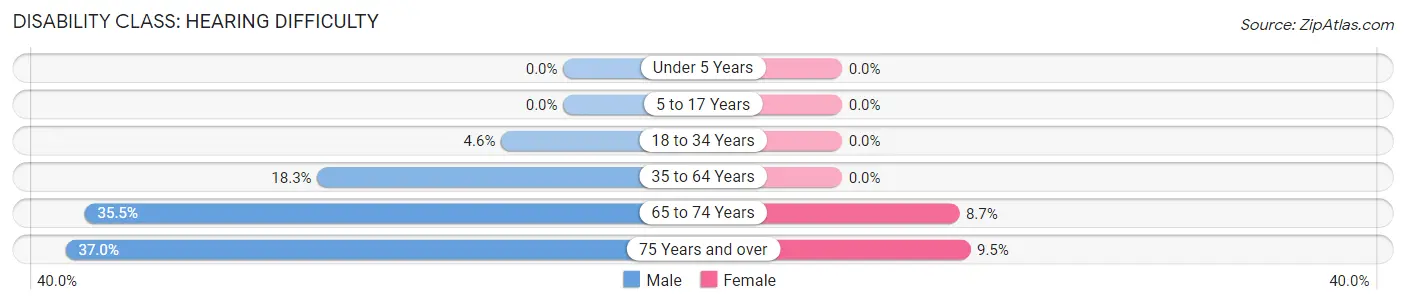
| Age Bracket | Male | Female |
| Under 5 Years | 0 (0.0%) | 0 (0.0%) |
| 5 to 17 Years | 0 (0.0%) | 0 (0.0%) |
| 18 to 34 Years | 7 (4.6%) | 0 (0.0%) |
| 35 to 64 Years | 65 (18.3%) | 0 (0.0%) |
| 65 to 74 Years | 43 (35.5%) | 4 (8.7%) |
| 75 Years and over | 17 (37.0%) | 6 (9.5%) |
Disability Class: Vision Difficulty
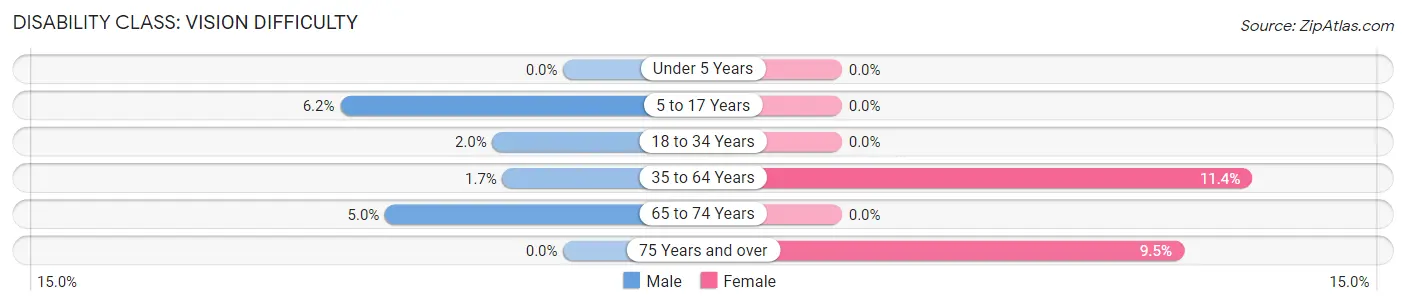
| Age Bracket | Male | Female |
| Under 5 Years | 0 (0.0%) | 0 (0.0%) |
| 5 to 17 Years | 18 (6.2%) | 0 (0.0%) |
| 18 to 34 Years | 3 (2.0%) | 0 (0.0%) |
| 35 to 64 Years | 6 (1.7%) | 54 (11.4%) |
| 65 to 74 Years | 6 (5.0%) | 0 (0.0%) |
| 75 Years and over | 0 (0.0%) | 6 (9.5%) |
Disability Class: Cognitive Difficulty
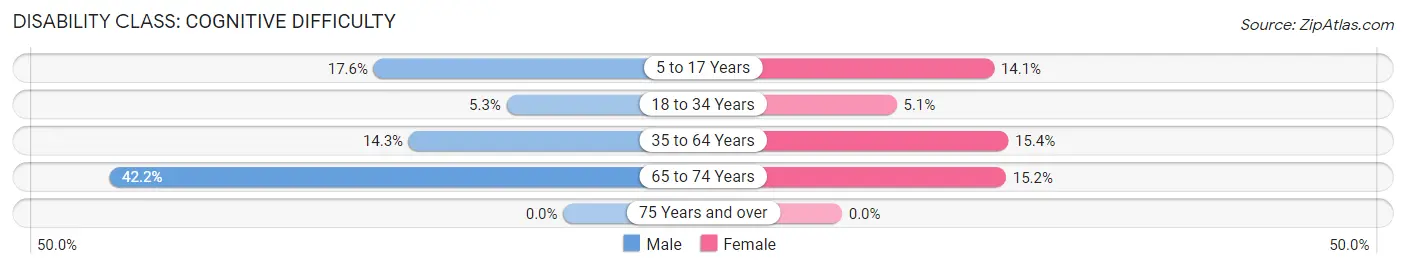
| Age Bracket | Male | Female |
| 5 to 17 Years | 51 (17.6%) | 36 (14.1%) |
| 18 to 34 Years | 8 (5.3%) | 10 (5.1%) |
| 35 to 64 Years | 51 (14.3%) | 73 (15.4%) |
| 65 to 74 Years | 51 (42.1%) | 7 (15.2%) |
| 75 Years and over | 0 (0.0%) | 0 (0.0%) |
Disability Class: Ambulatory Difficulty
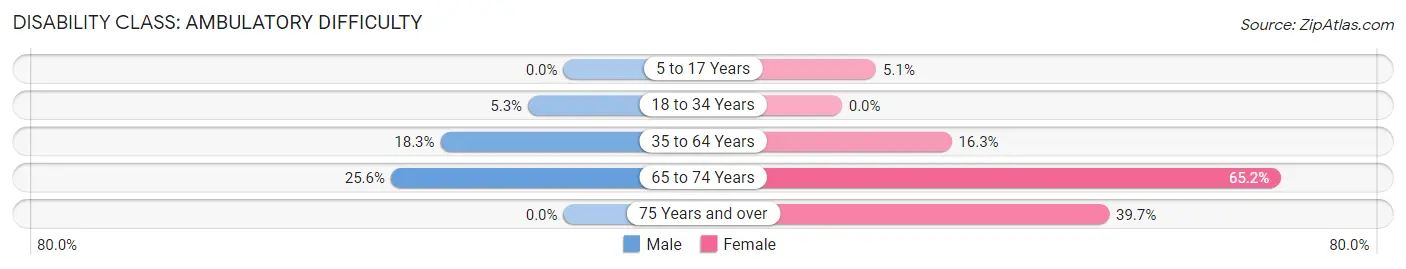
| Age Bracket | Male | Female |
| 5 to 17 Years | 0 (0.0%) | 13 (5.1%) |
| 18 to 34 Years | 8 (5.3%) | 0 (0.0%) |
| 35 to 64 Years | 65 (18.3%) | 77 (16.3%) |
| 65 to 74 Years | 31 (25.6%) | 30 (65.2%) |
| 75 Years and over | 0 (0.0%) | 25 (39.7%) |
Disability Class: Self-Care Difficulty
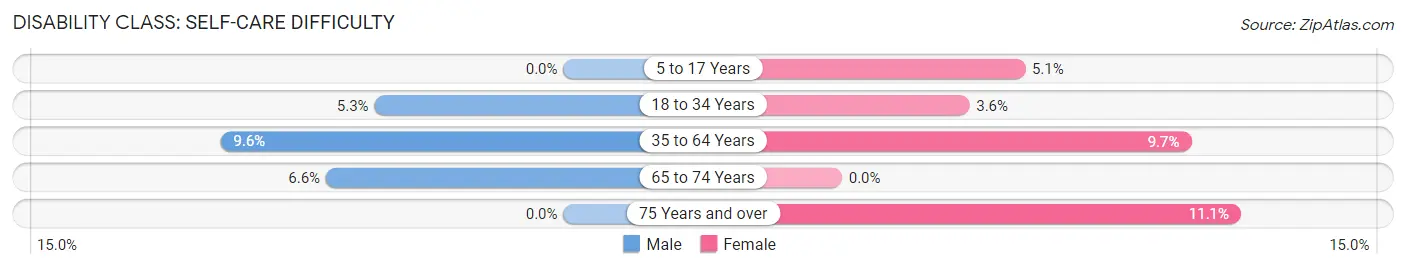
| Age Bracket | Male | Female |
| 5 to 17 Years | 0 (0.0%) | 13 (5.1%) |
| 18 to 34 Years | 8 (5.3%) | 7 (3.5%) |
| 35 to 64 Years | 34 (9.6%) | 46 (9.7%) |
| 65 to 74 Years | 8 (6.6%) | 0 (0.0%) |
| 75 Years and over | 0 (0.0%) | 7 (11.1%) |
Technology Access in Leachville
Computing Device Access in Leachville
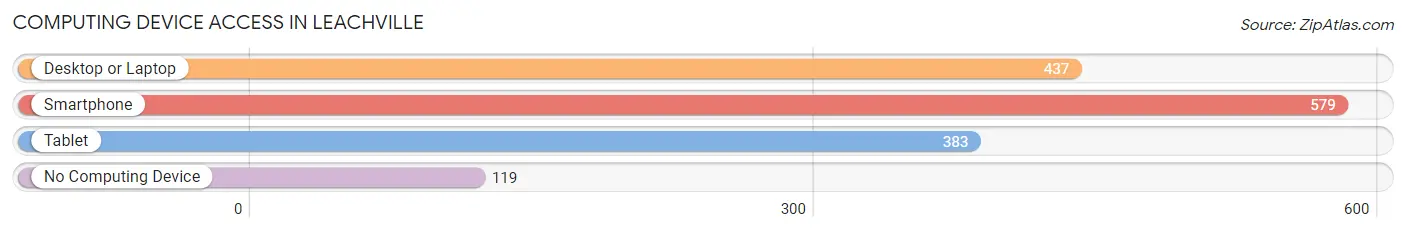
| Device Type | # Households | % Households |
| Desktop or Laptop | 437 | 52.5% |
| Smartphone | 579 | 69.5% |
| Tablet | 383 | 46.0% |
| No Computing Device | 119 | 14.3% |
| Total | 833 | 100.0% |
Internet Access in Leachville
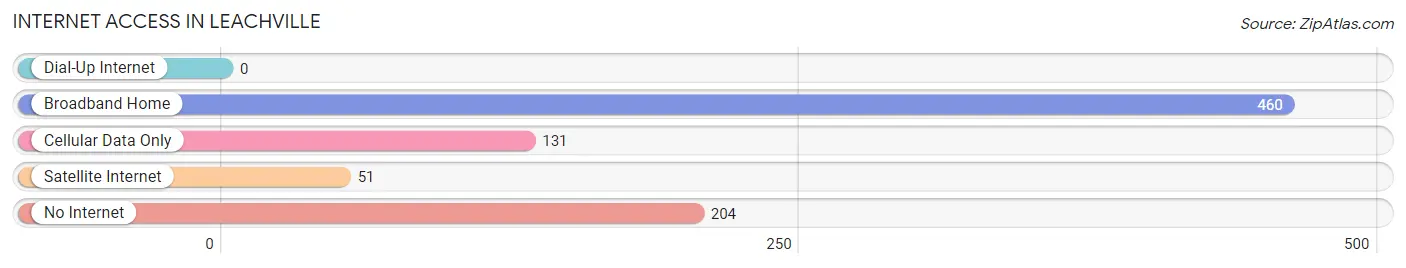
| Internet Type | # Households | % Households |
| Dial-Up Internet | 0 | 0.0% |
| Broadband Home | 460 | 55.2% |
| Cellular Data Only | 131 | 15.7% |
| Satellite Internet | 51 | 6.1% |
| No Internet | 204 | 24.5% |
| Total | 833 | 100.0% |
Leachville Summary
Leachville, Arkansas is a small town located in Mississippi County in the northeast corner of the state. It is situated on the banks of the St. Francis River, and is approximately 10 miles south of the Missouri border. The town was founded in 1883 and was named after the Leach family, who were early settlers in the area.
Geography
Leachville is located in the Mississippi Alluvial Plain, which is a flat, low-lying area of land that is prone to flooding. The town is situated on the banks of the St. Francis River, which is a tributary of the Mississippi River. The town is surrounded by agricultural land, and is located approximately 10 miles south of the Missouri border. The town has a total area of 1.2 square miles, all of which is land.
Demographics
As of the 2010 census, Leachville had a population of 1,890. The racial makeup of the town was 79.2% White, 18.2% African American, 0.3% Native American, 0.3% Asian, 0.1% Pacific Islander, 0.7% from other races, and 1.4% from two or more races. Hispanic or Latino of any race were 1.7% of the population.
Economy
Leachville’s economy is largely based on agriculture. The town is home to several large farms, and the surrounding area is used for growing cotton, soybeans, and rice. The town also has a few small businesses, including a grocery store, a hardware store, and a few restaurants.
History
Leachville was founded in 1883 by the Leach family, who were early settlers in the area. The town was originally known as Leachville Station, and was a stop on the St. Louis, Iron Mountain and Southern Railway. The town was officially incorporated in 1891, and the first post office was established in 1892.
In the early 1900s, Leachville was a thriving agricultural community. The town was home to several large farms, and the surrounding area was used for growing cotton, soybeans, and rice. The town also had a few small businesses, including a grocery store, a hardware store, and a few restaurants.
In the 1950s, the town began to decline as the railroad industry declined and the agricultural industry shifted away from cotton and soybeans. The town’s population began to decline, and by the 1970s, the town was in a state of decline.
In the 1980s, the town began to experience a resurgence as new businesses moved into the area and the population began to grow again. The town has continued to grow since then, and today it is a thriving small town with a population of nearly 2,000.
Common Questions
What is Per Capita Income in Leachville?
Per Capita income in Leachville is $23,053.
What is the Median Family Income in Leachville?
Median Family Income in Leachville is $50,588.
What is the Median Household income in Leachville?
Median Household Income in Leachville is $31,607.
What is Income or Wage Gap in Leachville?
Income or Wage Gap in Leachville is 27.2%.
Women in Leachville earn 72.8 cents for every dollar earned by a man.
What is Family Income Deficit in Leachville?
Family Income Deficit in Leachville is $15,103.
Families that are below poverty line in Leachville earn $15,103 less on average than the poverty threshold level.
What is Inequality or Gini Index in Leachville?
Inequality or Gini Index in Leachville is 0.55.
What is the Total Population of Leachville?
Total Population of Leachville is 2,132.
What is the Total Male Population of Leachville?
Total Male Population of Leachville is 1,048.
What is the Total Female Population of Leachville?
Total Female Population of Leachville is 1,084.
What is the Ratio of Males per 100 Females in Leachville?
There are 96.68 Males per 100 Females in Leachville.
What is the Ratio of Females per 100 Males in Leachville?
There are 103.44 Females per 100 Males in Leachville.
What is the Median Population Age in Leachville?
Median Population Age in Leachville is 35.9 Years.
What is the Average Family Size in Leachville
Average Family Size in Leachville is 3.0 People.
What is the Average Household Size in Leachville
Average Household Size in Leachville is 2.6 People.
How Large is the Labor Force in Leachville?
There are 865 People in the Labor Forcein in Leachville.
What is the Percentage of People in the Labor Force in Leachville?
56.0% of People are in the Labor Force in Leachville.
What is the Unemployment Rate in Leachville?
Unemployment Rate in Leachville is 4.1%.