Dennard, AR Map & Demographics
Dennard Map
Dennard Overview
$26,687
PER CAPITA INCOME
$98,455
AVG FAMILY INCOME
0.37
INEQUALITY / GINI INDEX
415
TOTAL POPULATION
240
MALE POPULATION
175
FEMALE POPULATION
137.14
MALES / 100 FEMALES
72.92
FEMALES / 100 MALES
43.1
MEDIAN AGE
2.6
AVG FAMILY SIZE
2.1
AVG HOUSEHOLD SIZE
187
LABOR FORCE [ PEOPLE ]
49.2%
PERCENT IN LABOR FORCE
Dennard Zip Codes
Dennard Area Codes
Income in Dennard
Income Overview in Dennard
| Characteristic | Number | Measure |
| Per Capita Income | 415 | $26,687 |
| Median Family Income | 114 | $98,455 |
| Mean Family Income | 114 | $80,592 |
| Median Household Income | 195 | $0 |
| Mean Household Income | 195 | $58,646 |
| Income Deficit | 114 | $0 |
| Wage / Income Gap (%) | 415 | 0.00% |
| Wage / Income Gap ($) | 415 | 100.00¢ per $1 |
| Gini / Inequality Index | 415 | 0.37 |
Earnings by Sex in Dennard
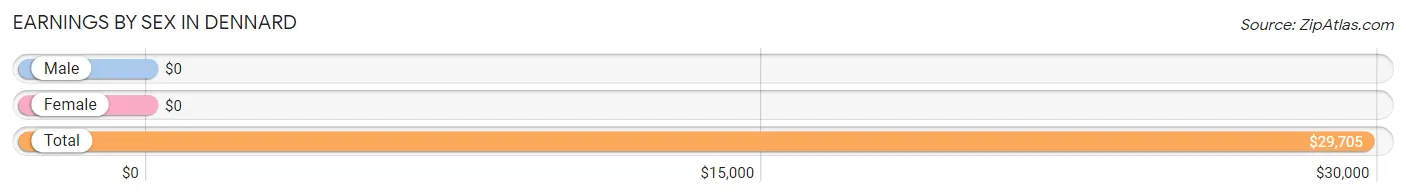
| Sex | Number | Average Earnings |
| Male | 143 (62.5%) | $0 |
| Female | 86 (37.6%) | $0 |
| Total | 229 (100.0%) | $29,705 |
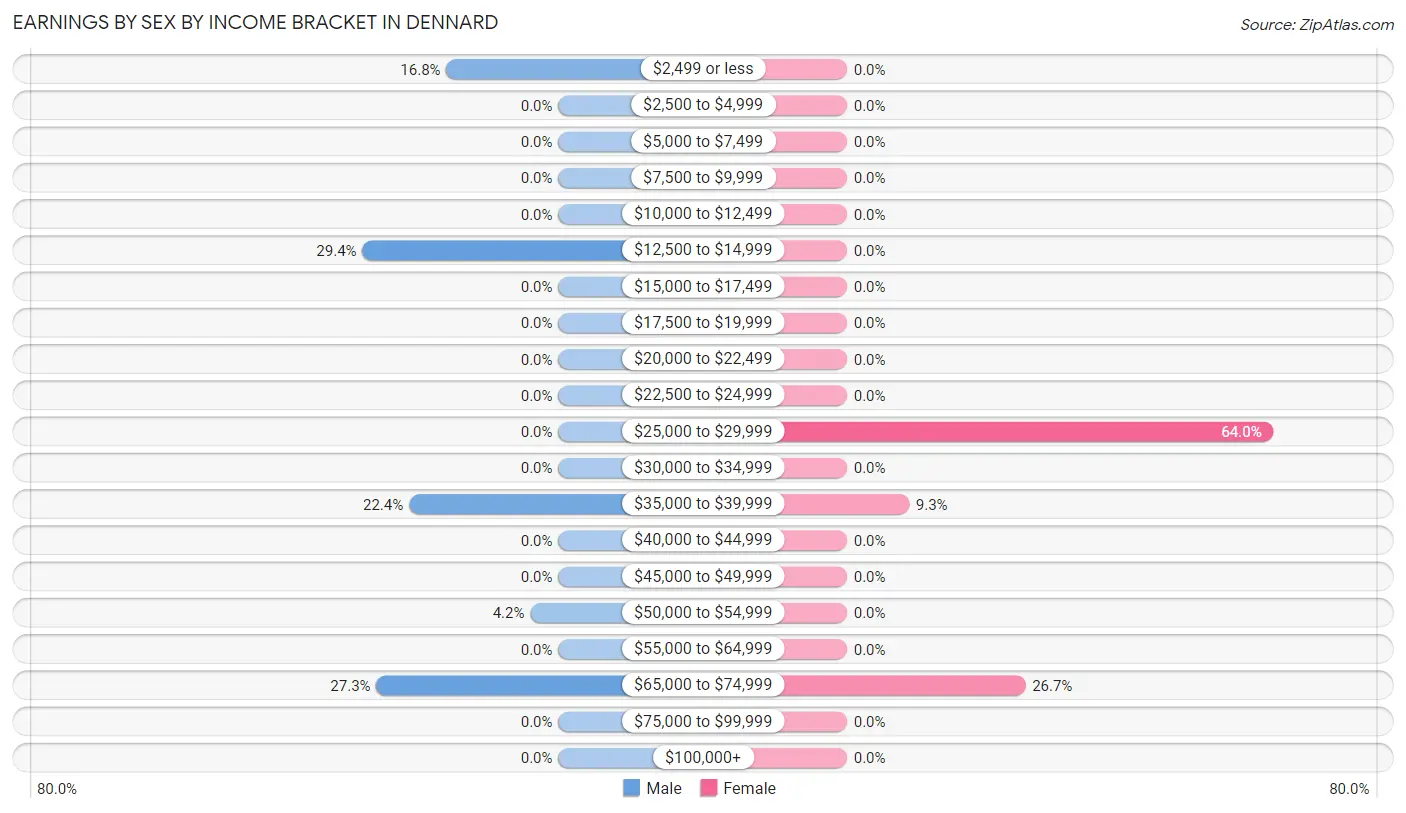
Earnings by Sex by Income Bracket in Dennard
The most common earnings brackets in Dennard are $12,500 to $14,999 for men (42 | 29.4%) and $25,000 to $29,999 for women (55 | 63.9%).
| Income | Male | Female |
| $2,499 or less | 24 (16.8%) | 0 (0.0%) |
| $2,500 to $4,999 | 0 (0.0%) | 0 (0.0%) |
| $5,000 to $7,499 | 0 (0.0%) | 0 (0.0%) |
| $7,500 to $9,999 | 0 (0.0%) | 0 (0.0%) |
| $10,000 to $12,499 | 0 (0.0%) | 0 (0.0%) |
| $12,500 to $14,999 | 42 (29.4%) | 0 (0.0%) |
| $15,000 to $17,499 | 0 (0.0%) | 0 (0.0%) |
| $17,500 to $19,999 | 0 (0.0%) | 0 (0.0%) |
| $20,000 to $22,499 | 0 (0.0%) | 0 (0.0%) |
| $22,500 to $24,999 | 0 (0.0%) | 0 (0.0%) |
| $25,000 to $29,999 | 0 (0.0%) | 55 (63.9%) |
| $30,000 to $34,999 | 0 (0.0%) | 0 (0.0%) |
| $35,000 to $39,999 | 32 (22.4%) | 8 (9.3%) |
| $40,000 to $44,999 | 0 (0.0%) | 0 (0.0%) |
| $45,000 to $49,999 | 0 (0.0%) | 0 (0.0%) |
| $50,000 to $54,999 | 6 (4.2%) | 0 (0.0%) |
| $55,000 to $64,999 | 0 (0.0%) | 0 (0.0%) |
| $65,000 to $74,999 | 39 (27.3%) | 23 (26.7%) |
| $75,000 to $99,999 | 0 (0.0%) | 0 (0.0%) |
| $100,000+ | 0 (0.0%) | 0 (0.0%) |
| Total | 143 (100.0%) | 86 (100.0%) |
Earnings by Sex by Educational Attainment in Dennard
| Educational Attainment | Male Income | Female Income |
| Less than High School | - | - |
| High School Diploma | - | - |
| College or Associate's Degree | - | - |
| Bachelor's Degree | - | - |
| Graduate Degree | - | - |
| Total | - | - |
Family Income in Dennard
Family Income Brackets in Dennard
According to the Dennard family income data, there are 55 families falling into the $75,000 to $99,999 income range, which is the most common income bracket and makes up 48.2% of all families.
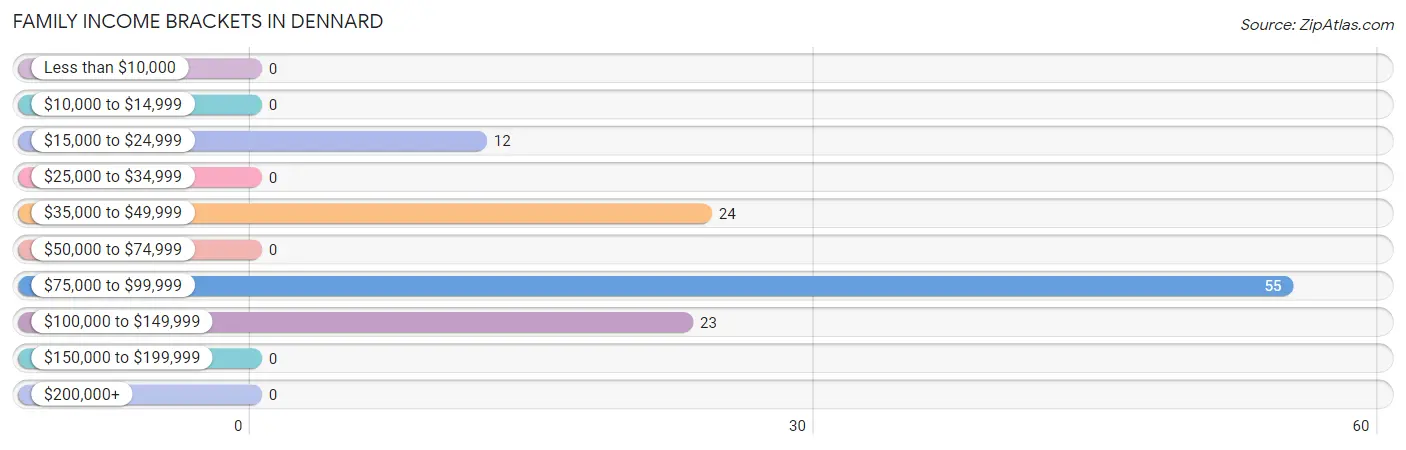
| Income Bracket | # Families | % Families |
| Less than $10,000 | 0 | 0.0% |
| $10,000 to $14,999 | 0 | 0.0% |
| $15,000 to $24,999 | 12 | 10.5% |
| $25,000 to $34,999 | 0 | 0.0% |
| $35,000 to $49,999 | 24 | 21.1% |
| $50,000 to $74,999 | 0 | 0.0% |
| $75,000 to $99,999 | 55 | 48.2% |
| $100,000 to $149,999 | 23 | 20.2% |
| $150,000 to $199,999 | 0 | 0.0% |
| $200,000+ | 0 | 0.0% |
Family Income by Famaliy Size in Dennard
| Income Bracket | # Families | Median Income |
| 2-Person Families | 49 (43.0%) | $0 |
| 3-Person Families | 65 (57.0%) | $0 |
| 4-Person Families | 0 (0.0%) | $0 |
| 5-Person Families | 0 (0.0%) | $0 |
| 6-Person Families | 0 (0.0%) | $0 |
| 7+ Person Families | 0 (0.0%) | $0 |
| Total | 114 (100.0%) | $98,455 |
Family Income by Number of Earners in Dennard
| Number of Earners | # Families | Median Income |
| No Earners | 26 (22.8%) | $0 |
| 1 Earner | 10 (8.8%) | $0 |
| 2 Earners | 78 (68.4%) | $0 |
| 3+ Earners | 0 (0.0%) | $0 |
| Total | 114 (100.0%) | $98,455 |
Household Income in Dennard
Household Income Brackets in Dennard
With 55 households falling in the category, the $75,000 to $99,999 income range is the most frequent in Dennard, accounting for 28.2% of all households.
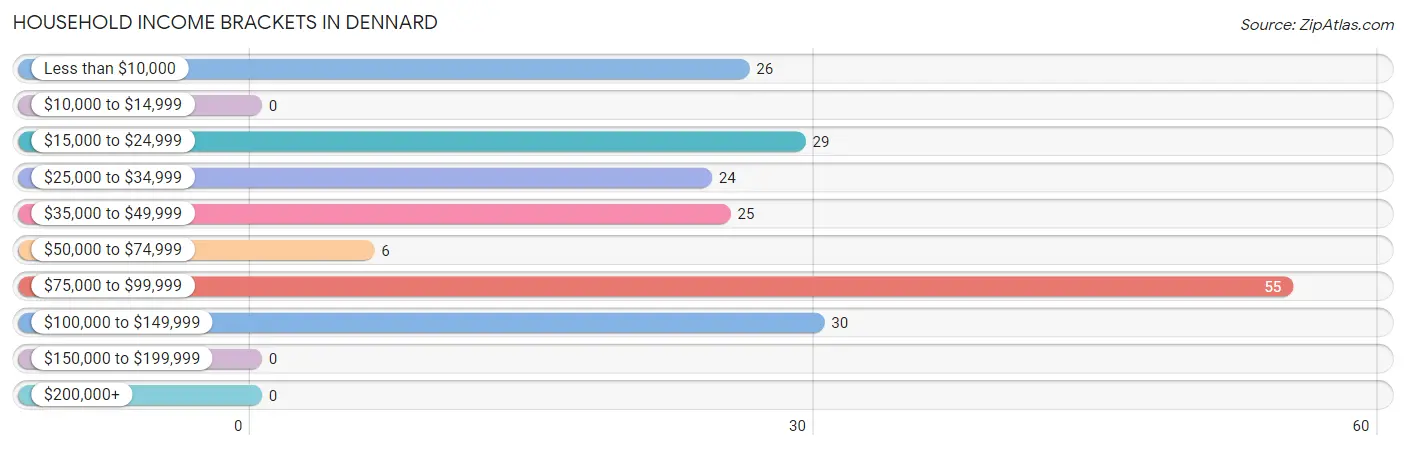
| Income Bracket | # Households | % Households |
| Less than $10,000 | 26 | 13.3% |
| $10,000 to $14,999 | 0 | 0.0% |
| $15,000 to $24,999 | 29 | 14.9% |
| $25,000 to $34,999 | 24 | 12.3% |
| $35,000 to $49,999 | 25 | 12.8% |
| $50,000 to $74,999 | 6 | 3.1% |
| $75,000 to $99,999 | 55 | 28.2% |
| $100,000 to $149,999 | 30 | 15.4% |
| $150,000 to $199,999 | 0 | 0.0% |
| $200,000+ | 0 | 0.0% |
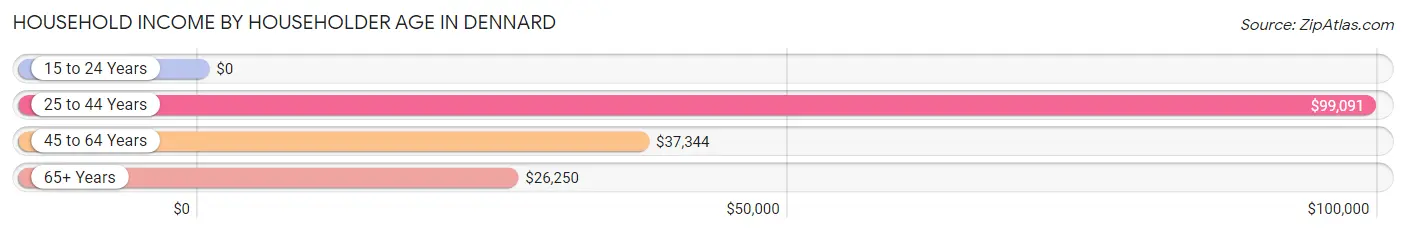
Household Income by Householder Age in Dennard
The median household income in Dennard is $0, with the highest median household income of $99,091 found in the 25 to 44 years age bracket for the primary householder. A total of 86 households (44.1%) fall into this category.
| Income Bracket | # Households | Median Income |
| 15 to 24 Years | 0 (0.0%) | $0 |
| 25 to 44 Years | 86 (44.1%) | $99,091 |
| 45 to 64 Years | 35 (17.9%) | $37,344 |
| 65+ Years | 74 (38.0%) | $26,250 |
| Total | 195 (100.0%) | $0 |
Poverty in Dennard
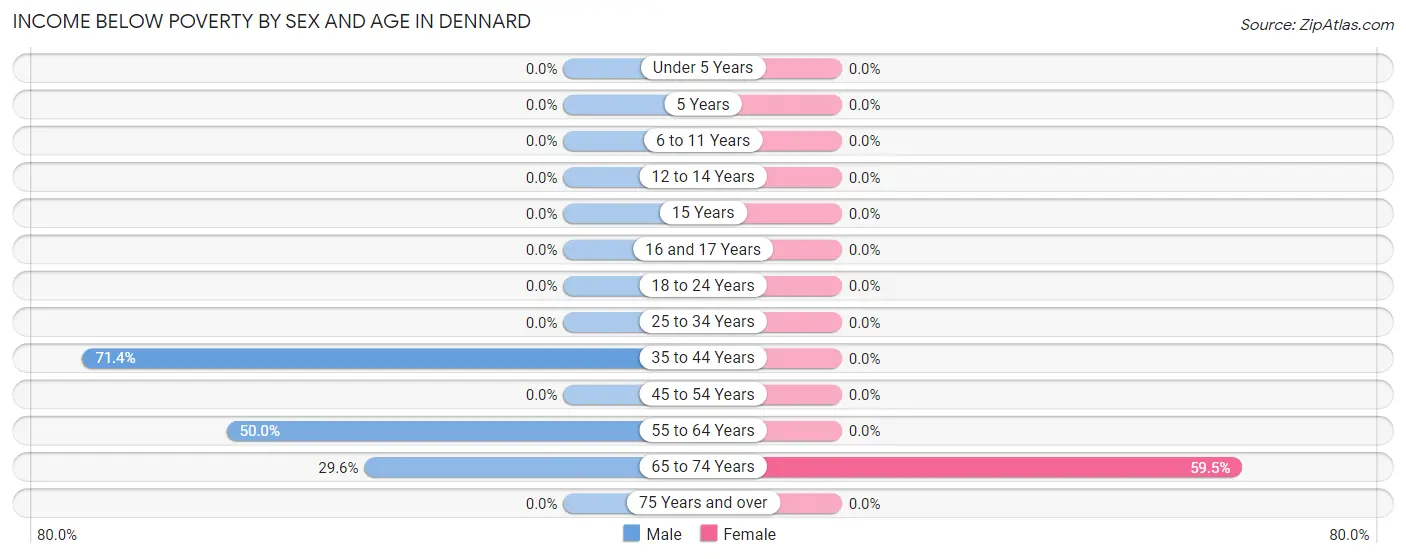
Income Below Poverty by Sex and Age in Dennard
With 15.8% poverty level for males and 25.1% for females among the residents of Dennard, 35 to 44 year old males and 65 to 74 year old females are the most vulnerable to poverty, with 15 males (71.4%) and 44 females (59.5%) in their respective age groups living below the poverty level.
| Age Bracket | Male | Female |
| Under 5 Years | 0 (0.0%) | 0 (0.0%) |
| 5 Years | 0 (0.0%) | 0 (0.0%) |
| 6 to 11 Years | 0 (0.0%) | 0 (0.0%) |
| 12 to 14 Years | 0 (0.0%) | 0 (0.0%) |
| 15 Years | 0 (0.0%) | 0 (0.0%) |
| 16 and 17 Years | 0 (0.0%) | 0 (0.0%) |
| 18 to 24 Years | 0 (0.0%) | 0 (0.0%) |
| 25 to 34 Years | 0 (0.0%) | 0 (0.0%) |
| 35 to 44 Years | 15 (71.4%) | 0 (0.0%) |
| 45 to 54 Years | 0 (0.0%) | 0 (0.0%) |
| 55 to 64 Years | 10 (50.0%) | 0 (0.0%) |
| 65 to 74 Years | 13 (29.5%) | 44 (59.5%) |
| 75 Years and over | 0 (0.0%) | 0 (0.0%) |
| Total | 38 (15.8%) | 44 (25.1%) |
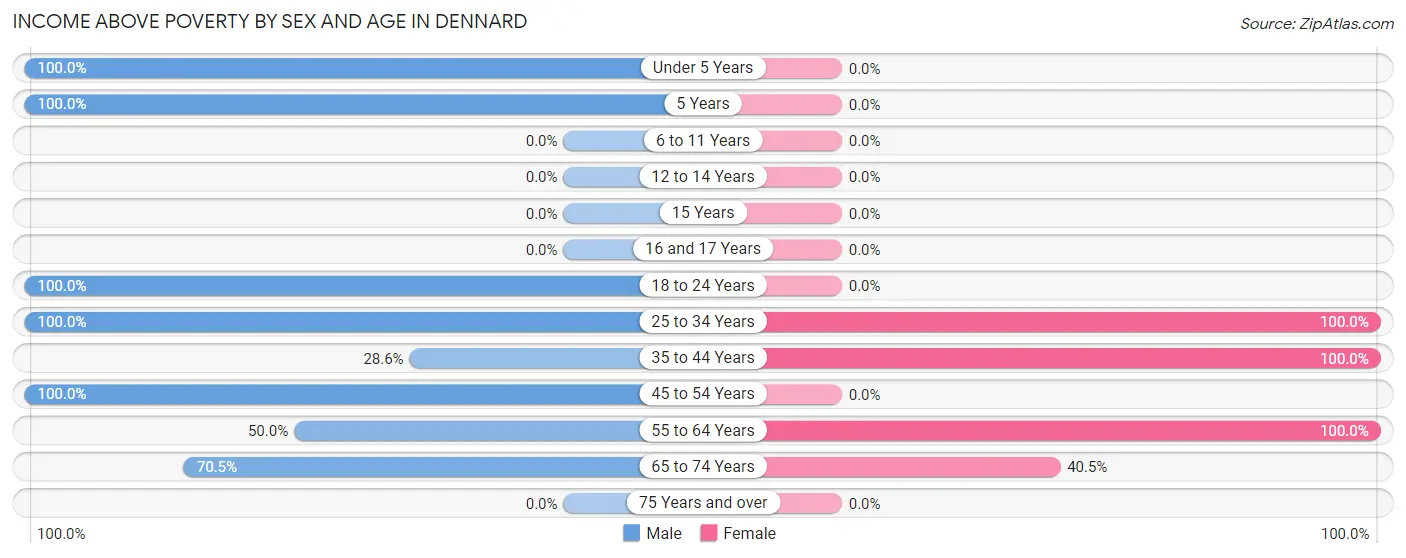
Income Above Poverty by Sex and Age in Dennard
According to the poverty statistics in Dennard, males aged under 5 years and females aged 25 to 34 years are the age groups that are most secure financially, with 100.0% of males and 100.0% of females in these age groups living above the poverty line.
| Age Bracket | Male | Female |
| Under 5 Years | 29 (100.0%) | 0 (0.0%) |
| 5 Years | 6 (100.0%) | 0 (0.0%) |
| 6 to 11 Years | 0 (0.0%) | 0 (0.0%) |
| 12 to 14 Years | 0 (0.0%) | 0 (0.0%) |
| 15 Years | 0 (0.0%) | 0 (0.0%) |
| 16 and 17 Years | 0 (0.0%) | 0 (0.0%) |
| 18 to 24 Years | 39 (100.0%) | 0 (0.0%) |
| 25 to 34 Years | 42 (100.0%) | 55 (100.0%) |
| 35 to 44 Years | 6 (28.6%) | 23 (100.0%) |
| 45 to 54 Years | 39 (100.0%) | 0 (0.0%) |
| 55 to 64 Years | 10 (50.0%) | 23 (100.0%) |
| 65 to 74 Years | 31 (70.5%) | 30 (40.5%) |
| 75 Years and over | 0 (0.0%) | 0 (0.0%) |
| Total | 202 (84.2%) | 131 (74.9%) |
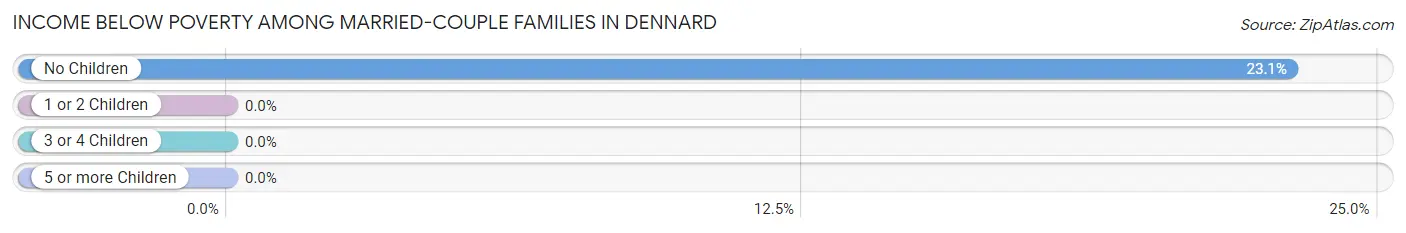
Income Below Poverty Among Married-Couple Families in Dennard
The poverty statistics for married-couple families in Dennard show that 11.2% or 12 of the total 107 families live below the poverty line. Families with no children have the highest poverty rate of 23.1%, comprising of 12 families. On the other hand, families with 1 or 2 children have the lowest poverty rate of 0.0%, which includes 0 families.
| Children | Above Poverty | Below Poverty |
| No Children | 40 (76.9%) | 12 (23.1%) |
| 1 or 2 Children | 55 (100.0%) | 0 (0.0%) |
| 3 or 4 Children | 0 (0.0%) | 0 (0.0%) |
| 5 or more Children | 0 (0.0%) | 0 (0.0%) |
| Total | 95 (88.8%) | 12 (11.2%) |
Income Below Poverty Among Single-Parent Households in Dennard
| Children | Single Father | Single Mother |
| No Children | 0 (0.0%) | 0 (0.0%) |
| 1 or 2 Children | 0 (0.0%) | 0 (0.0%) |
| 3 or 4 Children | 0 (0.0%) | 0 (0.0%) |
| 5 or more Children | 0 (0.0%) | 0 (0.0%) |
| Total | 0 (0.0%) | 0 (0.0%) |
Income Below Poverty Among Married-Couple vs Single-Parent Households in Dennard
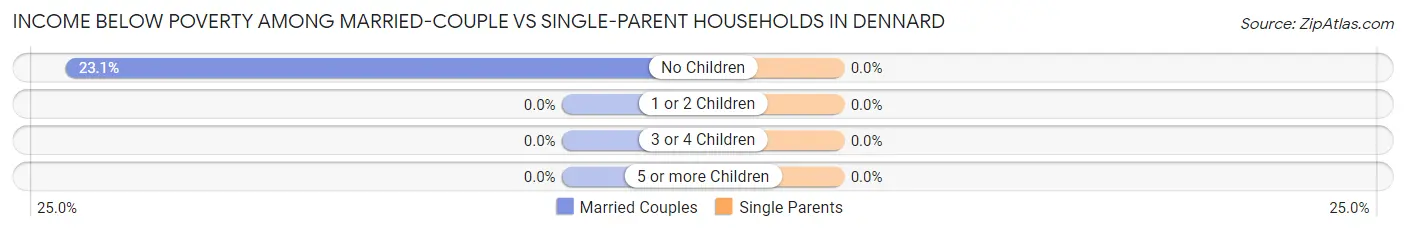
| Children | Married-Couple Families | Single-Parent Households |
| No Children | 12 (23.1%) | 0 (0.0%) |
| 1 or 2 Children | 0 (0.0%) | 0 (0.0%) |
| 3 or 4 Children | 0 (0.0%) | 0 (0.0%) |
| 5 or more Children | 0 (0.0%) | 0 (0.0%) |
| Total | 12 (11.2%) | 0 (0.0%) |
Race in Dennard
The most populous races in Dennard are White / Caucasian (409 | 98.6%), and Two or more Races (6 | 1.5%).
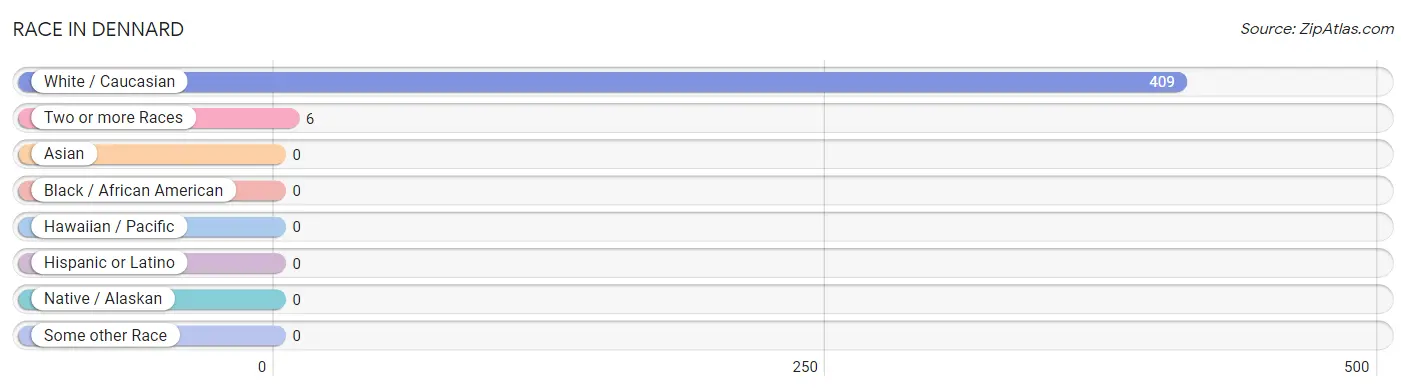
| Race | # Population | % Population |
| Asian | 0 | 0.0% |
| Black / African American | 0 | 0.0% |
| Hawaiian / Pacific | 0 | 0.0% |
| Hispanic or Latino | 0 | 0.0% |
| Native / Alaskan | 0 | 0.0% |
| White / Caucasian | 409 | 98.6% |
| Two or more Races | 6 | 1.5% |
| Some other Race | 0 | 0.0% |
| Total | 415 | 100.0% |
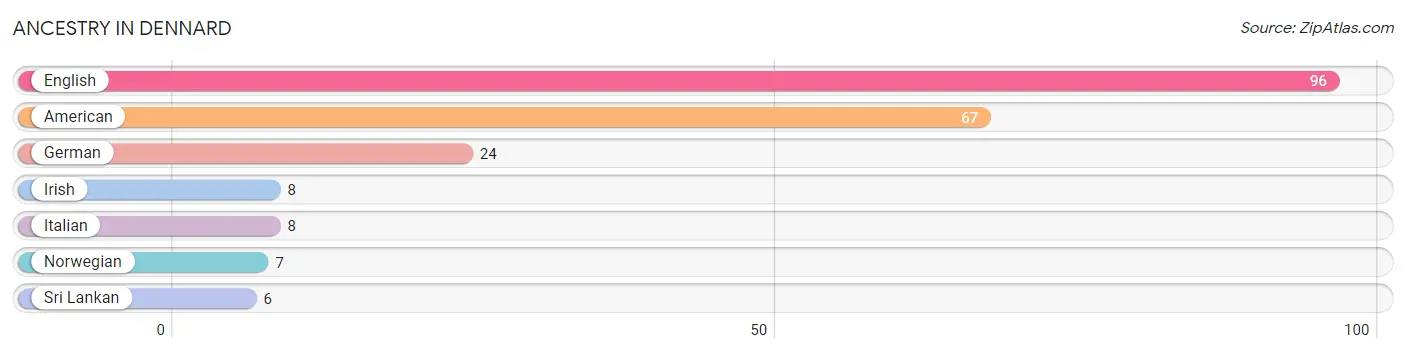
Ancestry in Dennard
The most populous ancestries reported in Dennard are English (96 | 23.1%), American (67 | 16.1%), German (24 | 5.8%), Irish (8 | 1.9%), and Italian (8 | 1.9%), together accounting for 48.9% of all Dennard residents.
| Ancestry | # Population | % Population |
| American | 67 | 16.1% |
| English | 96 | 23.1% |
| German | 24 | 5.8% |
| Irish | 8 | 1.9% |
| Italian | 8 | 1.9% |
| Norwegian | 7 | 1.7% |
| Sri Lankan | 6 | 1.5% | View All 7 Rows |
Immigrants in Dennard

| Immigration Origin | # Population | % Population | View All 0 Rows |
Sex and Age in Dennard
Sex and Age in Dennard
The most populous age groups in Dennard are 30 to 34 Years (42 | 17.5%) for men and 25 to 29 Years (55 | 31.4%) for women.
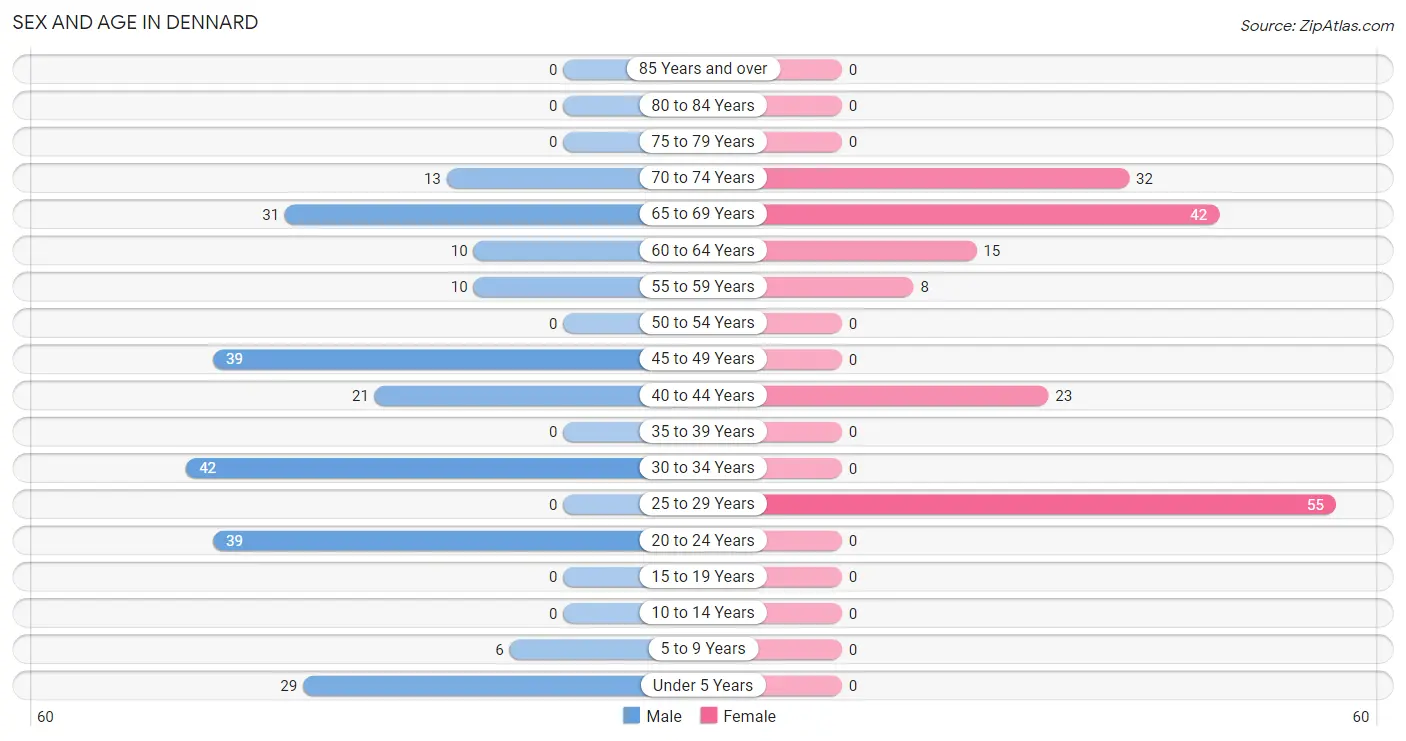
| Age Bracket | Male | Female |
| Under 5 Years | 29 (12.1%) | 0 (0.0%) |
| 5 to 9 Years | 6 (2.5%) | 0 (0.0%) |
| 10 to 14 Years | 0 (0.0%) | 0 (0.0%) |
| 15 to 19 Years | 0 (0.0%) | 0 (0.0%) |
| 20 to 24 Years | 39 (16.3%) | 0 (0.0%) |
| 25 to 29 Years | 0 (0.0%) | 55 (31.4%) |
| 30 to 34 Years | 42 (17.5%) | 0 (0.0%) |
| 35 to 39 Years | 0 (0.0%) | 0 (0.0%) |
| 40 to 44 Years | 21 (8.7%) | 23 (13.1%) |
| 45 to 49 Years | 39 (16.3%) | 0 (0.0%) |
| 50 to 54 Years | 0 (0.0%) | 0 (0.0%) |
| 55 to 59 Years | 10 (4.2%) | 8 (4.6%) |
| 60 to 64 Years | 10 (4.2%) | 15 (8.6%) |
| 65 to 69 Years | 31 (12.9%) | 42 (24.0%) |
| 70 to 74 Years | 13 (5.4%) | 32 (18.3%) |
| 75 to 79 Years | 0 (0.0%) | 0 (0.0%) |
| 80 to 84 Years | 0 (0.0%) | 0 (0.0%) |
| 85 Years and over | 0 (0.0%) | 0 (0.0%) |
| Total | 240 (100.0%) | 175 (100.0%) |
Families and Households in Dennard
Median Family Size in Dennard
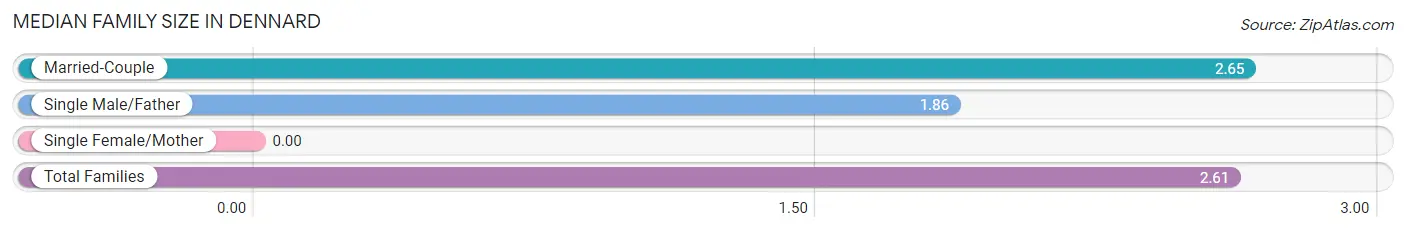
| Family Type | # Families | Family Size |
| Married-Couple | 107 (93.9%) | 2.65 |
| Single Male/Father | 7 (6.1%) | 1.86 |
| Single Female/Mother | 0 (0.0%) | - |
| Total Families | 114 (100.0%) | 2.61 |
Median Household Size in Dennard
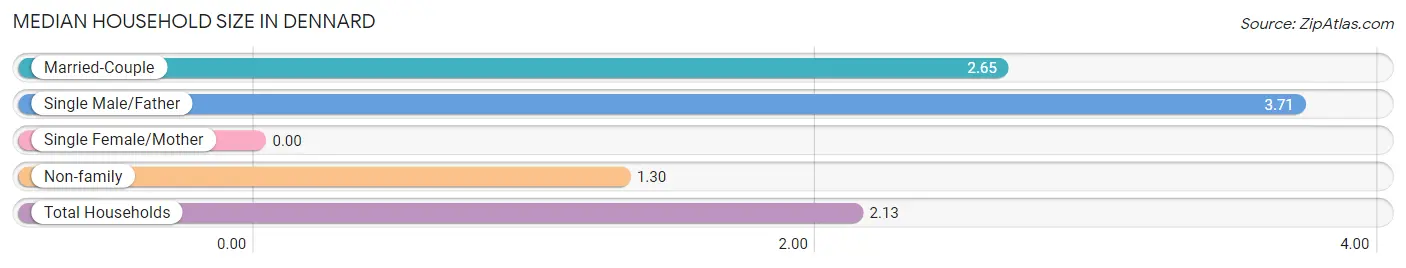
| Household Type | # Households | Household Size |
| Married-Couple | 107 (54.9%) | 2.65 |
| Single Male/Father | 7 (3.6%) | 3.71 |
| Single Female/Mother | 0 (0.0%) | - |
| Non-family | 81 (41.5%) | 1.30 |
| Total Households | 195 (100.0%) | 2.13 |
Household Size by Marriage Status in Dennard
Out of a total of 195 households in Dennard, 114 (58.5%) are family households, while 81 (41.5%) are nonfamily households. The most numerous type of family households are 3-person households, comprising 65, and the most common type of nonfamily households are 1-person households, comprising 57.
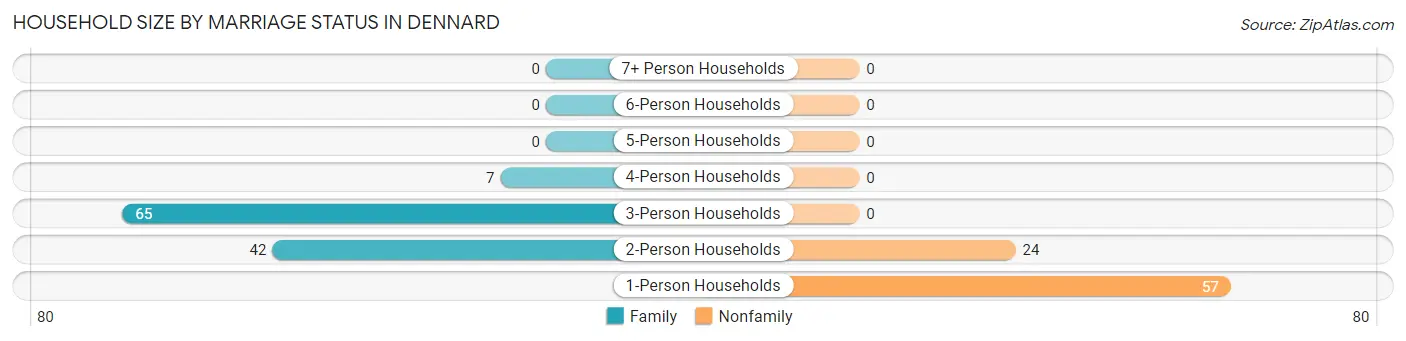
| Household Size | Family Households | Nonfamily Households |
| 1-Person Households | - | 57 (29.2%) |
| 2-Person Households | 42 (21.5%) | 24 (12.3%) |
| 3-Person Households | 65 (33.3%) | 0 (0.0%) |
| 4-Person Households | 7 (3.6%) | 0 (0.0%) |
| 5-Person Households | 0 (0.0%) | 0 (0.0%) |
| 6-Person Households | 0 (0.0%) | 0 (0.0%) |
| 7+ Person Households | 0 (0.0%) | 0 (0.0%) |
| Total | 114 (58.5%) | 81 (41.5%) |
Female Fertility in Dennard
Fertility by Age in Dennard
Average fertility rate in Dennard is 705.0 births per 1,000 women. Women in the age bracket of 20 to 34 years have the highest fertility rate with 1,000.0 births per 1,000 women. Women in the age bracket of 20 to 34 years acount for 100.0% of all women with births.
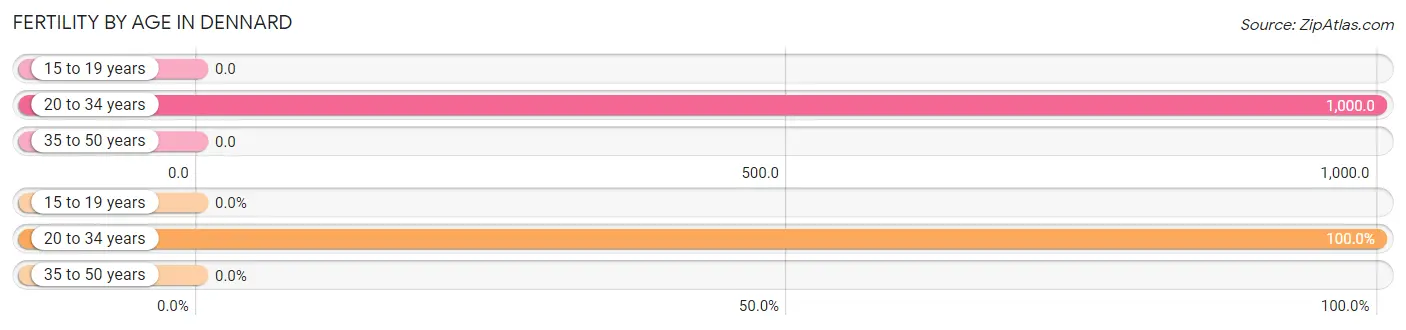
| Age Bracket | Women with Births | Births / 1,000 Women |
| 15 to 19 years | 0 (0.0%) | 0.0 |
| 20 to 34 years | 55 (100.0%) | 1,000.0 |
| 35 to 50 years | 0 (0.0%) | 0.0 |
| Total | 55 (100.0%) | 705.0 |
Fertility by Age by Marriage Status in Dennard
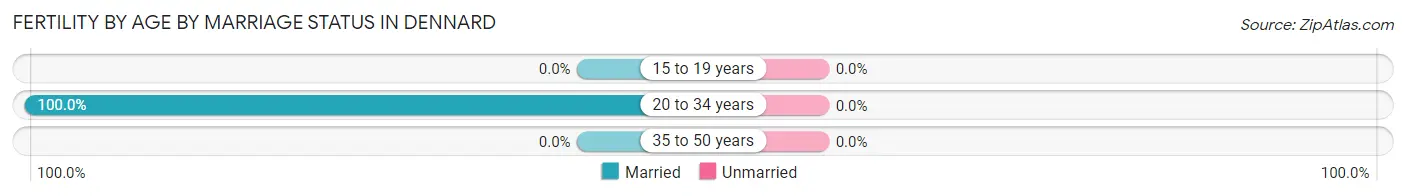
| Age Bracket | Married | Unmarried |
| 15 to 19 years | 0 (0.0%) | 0 (0.0%) |
| 20 to 34 years | 55 (100.0%) | 0 (0.0%) |
| 35 to 50 years | 0 (0.0%) | 0 (0.0%) |
| Total | 55 (100.0%) | 0 (0.0%) |
Fertility by Education in Dennard
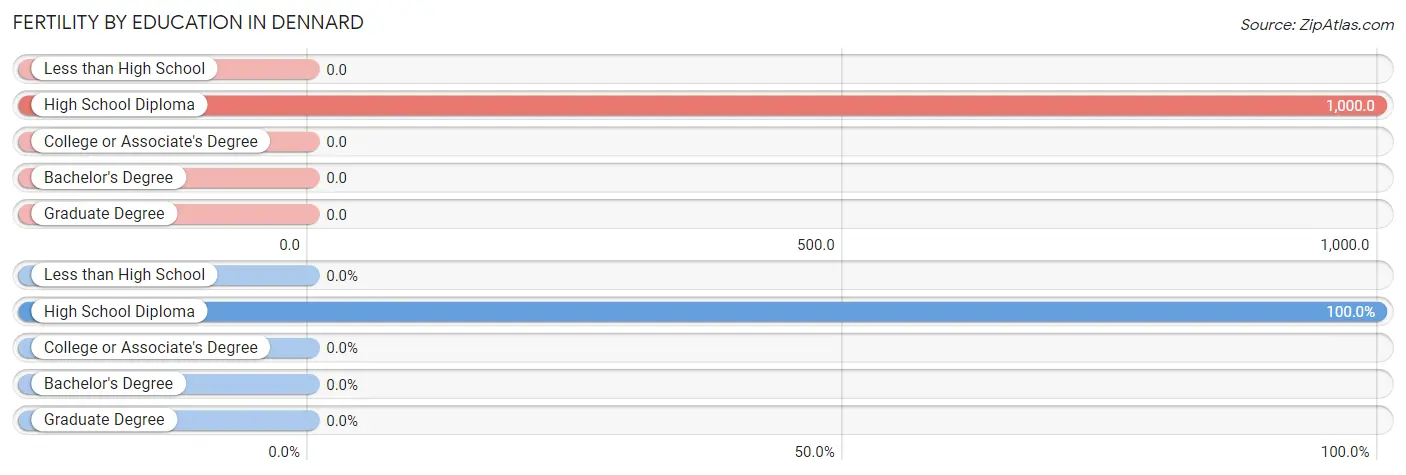
| Educational Attainment | Women with Births | Births / 1,000 Women |
| Less than High School | 0 (0.0%) | 0.0 |
| High School Diploma | 55 (100.0%) | 1,000.0 |
| College or Associate's Degree | 0 (0.0%) | 0.0 |
| Bachelor's Degree | 0 (0.0%) | 0.0 |
| Graduate Degree | 0 (0.0%) | 0.0 |
| Total | 55 (100.0%) | 705.0 |
Fertility by Education by Marriage Status in Dennard
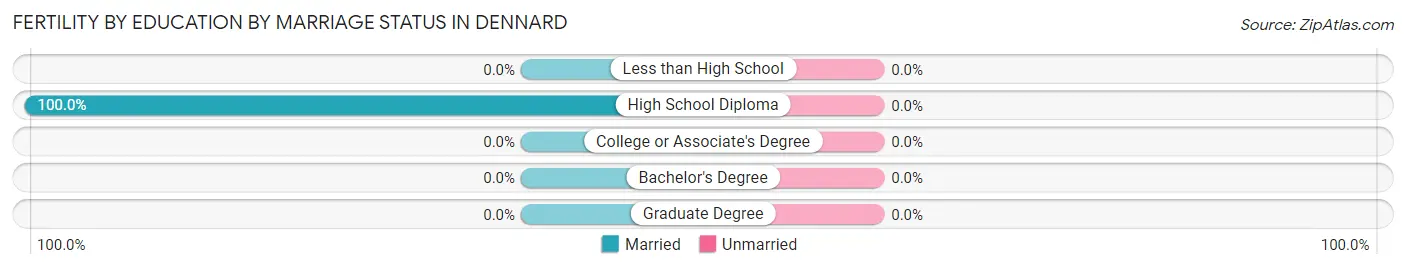
| Educational Attainment | Married | Unmarried |
| Less than High School | 0 (0.0%) | 0 (0.0%) |
| High School Diploma | 55 (100.0%) | 0 (0.0%) |
| College or Associate's Degree | 0 (0.0%) | 0 (0.0%) |
| Bachelor's Degree | 0 (0.0%) | 0 (0.0%) |
| Graduate Degree | 0 (0.0%) | 0 (0.0%) |
| Total | 55 (100.0%) | 0 (0.0%) |
Employment Characteristics in Dennard
Employment by Class of Employer in Dennard
Among the 187 employed individuals in Dennard, private company employees (126 | 67.4%), self-employed (incorporated) (24 | 12.8%), and not-for-profit organizations (23 | 12.3%) make up the most common classes of employment.
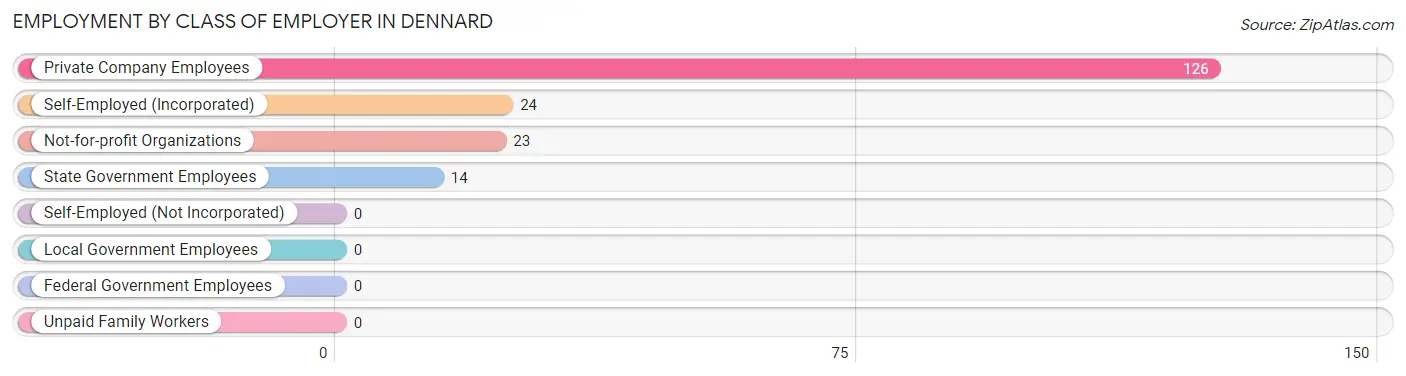
| Employer Class | # Employees | % Employees |
| Private Company Employees | 126 | 67.4% |
| Self-Employed (Incorporated) | 24 | 12.8% |
| Self-Employed (Not Incorporated) | 0 | 0.0% |
| Not-for-profit Organizations | 23 | 12.3% |
| Local Government Employees | 0 | 0.0% |
| State Government Employees | 14 | 7.5% |
| Federal Government Employees | 0 | 0.0% |
| Unpaid Family Workers | 0 | 0.0% |
| Total | 187 | 100.0% |
Employment Status by Age in Dennard
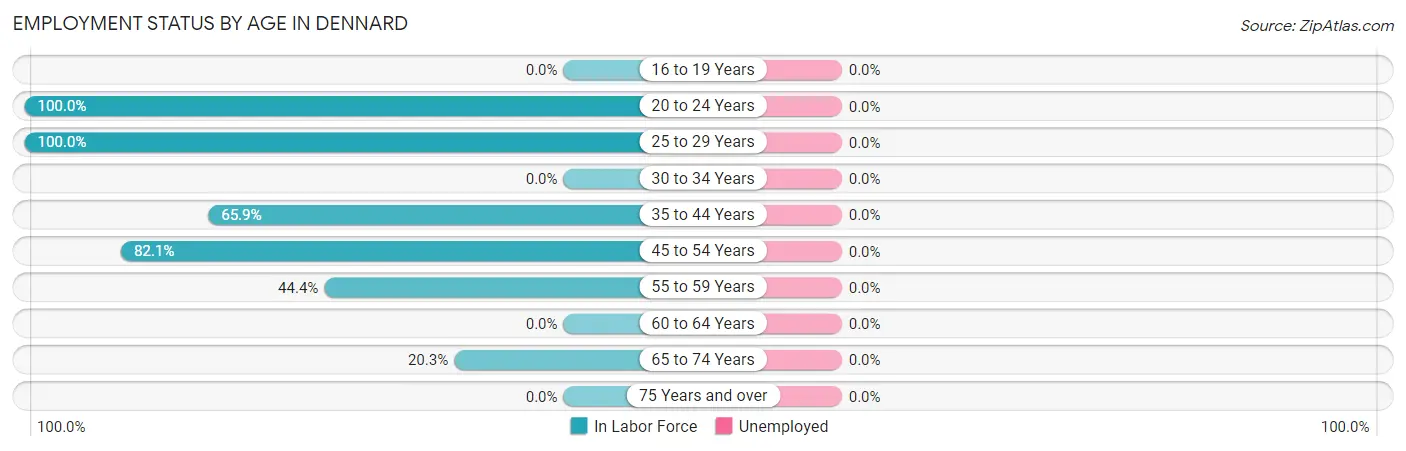
| Age Bracket | In Labor Force | Unemployed |
| 16 to 19 Years | 0 (0.0%) | 0 (0.0%) |
| 20 to 24 Years | 39 (100.0%) | 0 (0.0%) |
| 25 to 29 Years | 55 (100.0%) | 0 (0.0%) |
| 30 to 34 Years | 0 (0.0%) | 0 (0.0%) |
| 35 to 44 Years | 29 (65.9%) | 0 (0.0%) |
| 45 to 54 Years | 32 (82.1%) | 0 (0.0%) |
| 55 to 59 Years | 8 (44.4%) | 0 (0.0%) |
| 60 to 64 Years | 0 (0.0%) | 0 (0.0%) |
| 65 to 74 Years | 24 (20.3%) | 0 (0.0%) |
| 75 Years and over | 0 (0.0%) | 0 (0.0%) |
| Total | 187 (49.2%) | 0 (0.0%) |
Employment Status by Educational Attainment in Dennard
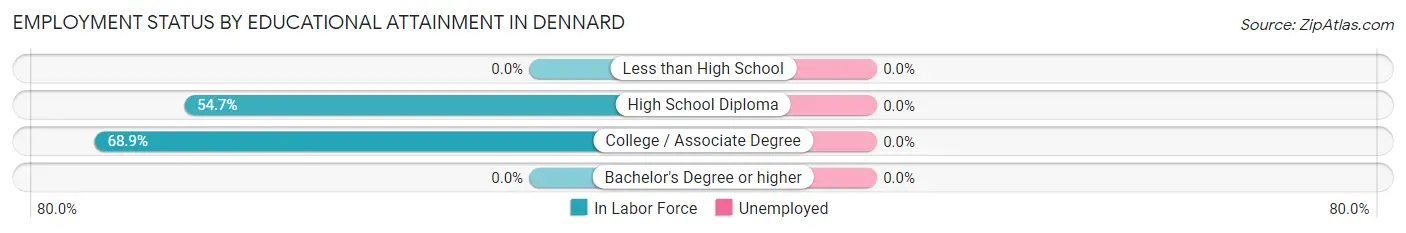
| Educational Attainment | In Labor Force | Unemployed |
| Less than High School | 0 (0.0%) | 0 (0.0%) |
| High School Diploma | 93 (54.7%) | 0 (0.0%) |
| College / Associate Degree | 31 (68.9%) | 0 (0.0%) |
| Bachelor's Degree or higher | 0 (0.0%) | 0 (0.0%) |
| Total | 124 (55.6%) | 0 (0.0%) |
Employment Occupations by Sex in Dennard
Management, Business, Science and Arts Occupations
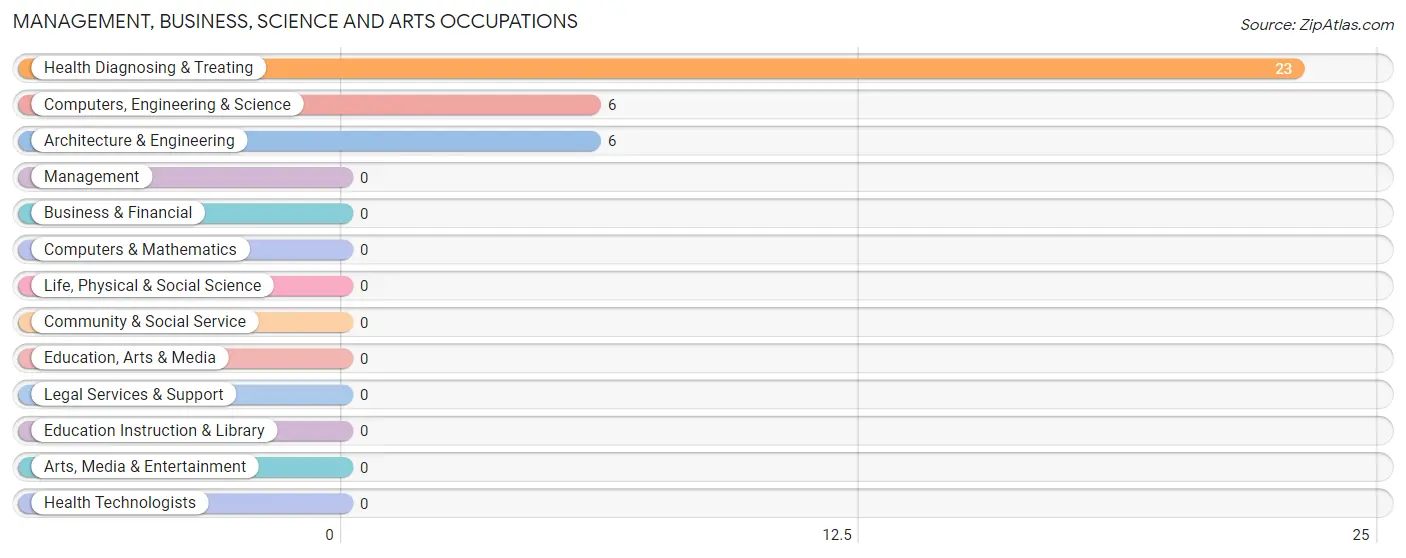
The most common Management, Business, Science and Arts occupations in Dennard are Health Diagnosing & Treating (23 | 12.3%), Computers, Engineering & Science (6 | 3.2%), and Architecture & Engineering (6 | 3.2%).
Management, Business, Science and Arts Occupations by Sex
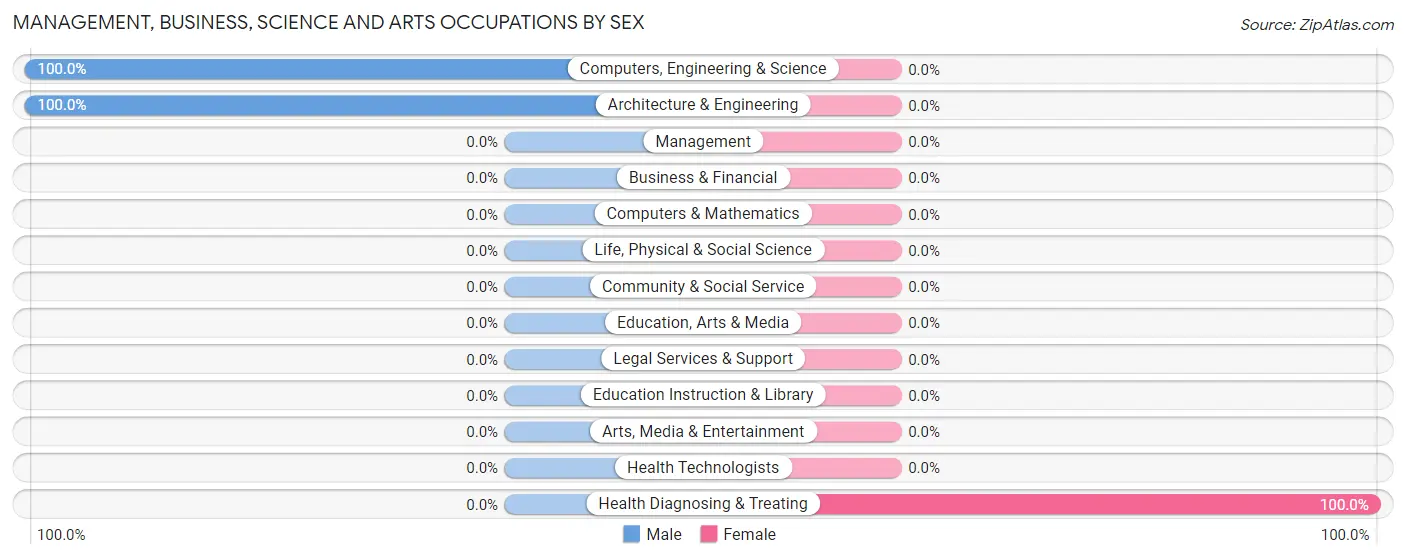
| Occupation | Male | Female |
| Management | 0 (0.0%) | 0 (0.0%) |
| Business & Financial | 0 (0.0%) | 0 (0.0%) |
| Computers, Engineering & Science | 6 (100.0%) | 0 (0.0%) |
| Computers & Mathematics | 0 (0.0%) | 0 (0.0%) |
| Architecture & Engineering | 6 (100.0%) | 0 (0.0%) |
| Life, Physical & Social Science | 0 (0.0%) | 0 (0.0%) |
| Community & Social Service | 0 (0.0%) | 0 (0.0%) |
| Education, Arts & Media | 0 (0.0%) | 0 (0.0%) |
| Legal Services & Support | 0 (0.0%) | 0 (0.0%) |
| Education Instruction & Library | 0 (0.0%) | 0 (0.0%) |
| Arts, Media & Entertainment | 0 (0.0%) | 0 (0.0%) |
| Health Diagnosing & Treating | 0 (0.0%) | 23 (100.0%) |
| Health Technologists | 0 (0.0%) | 0 (0.0%) |
| Total (Category) | 6 (20.7%) | 23 (79.3%) |
| Total (Overall) | 101 (54.0%) | 86 (46.0%) |
Services Occupations
Services Occupations by Sex
| Occupation | Male | Female |
| Healthcare Support | 0 (0.0%) | 0 (0.0%) |
| Security & Protection | 0 (0.0%) | 0 (0.0%) |
| Firefighting & Prevention | 0 (0.0%) | 0 (0.0%) |
| Law Enforcement | 0 (0.0%) | 0 (0.0%) |
| Food Preparation & Serving | 0 (0.0%) | 0 (0.0%) |
| Cleaning & Maintenance | 0 (0.0%) | 0 (0.0%) |
| Personal Care & Service | 0 (0.0%) | 0 (0.0%) |
| Total (Category) | 0 (0.0%) | 0 (0.0%) |
| Total (Overall) | 101 (54.0%) | 86 (46.0%) |
Sales and Office Occupations
The most common Sales and Office occupations in Dennard are , and Office & Administration (63 | 33.7%).
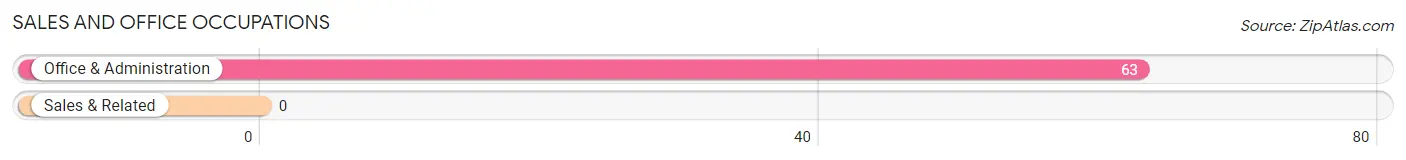
Sales and Office Occupations by Sex
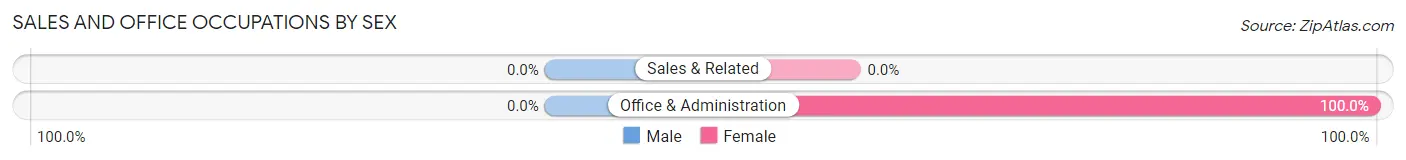
| Occupation | Male | Female |
| Sales & Related | 0 (0.0%) | 0 (0.0%) |
| Office & Administration | 0 (0.0%) | 63 (100.0%) |
| Total (Category) | 0 (0.0%) | 63 (100.0%) |
| Total (Overall) | 101 (54.0%) | 86 (46.0%) |
Natural Resources, Construction and Maintenance Occupations
The most common Natural Resources, Construction and Maintenance occupations in Dennard are , and Installation, Maintenance & Repair (24 | 12.8%).
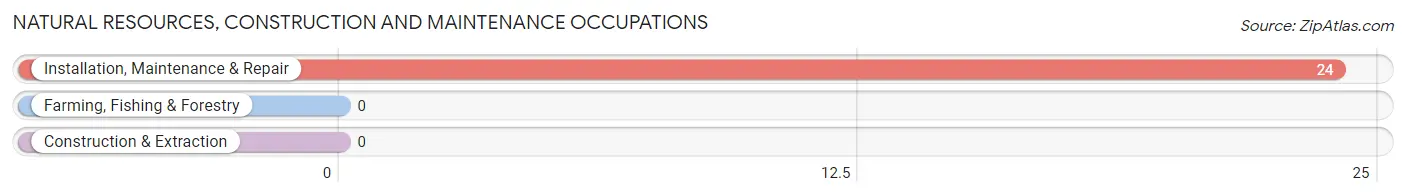
Natural Resources, Construction and Maintenance Occupations by Sex
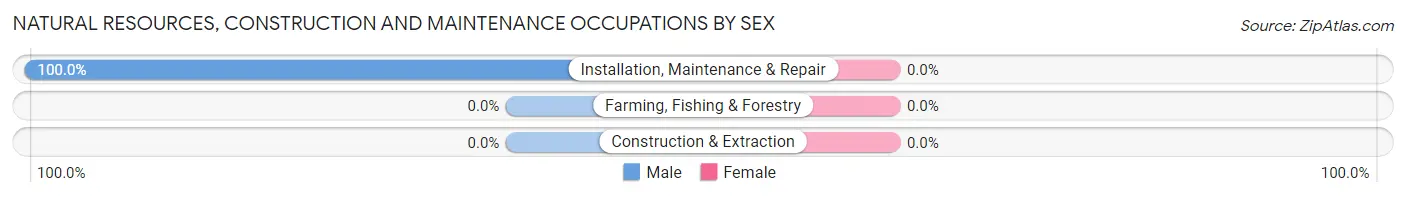
| Occupation | Male | Female |
| Farming, Fishing & Forestry | 0 (0.0%) | 0 (0.0%) |
| Construction & Extraction | 0 (0.0%) | 0 (0.0%) |
| Installation, Maintenance & Repair | 24 (100.0%) | 0 (0.0%) |
| Total (Category) | 24 (100.0%) | 0 (0.0%) |
| Total (Overall) | 101 (54.0%) | 86 (46.0%) |
Production, Transportation and Moving Occupations
The most common Production, Transportation and Moving occupations in Dennard are , and Production (71 | 38.0%).
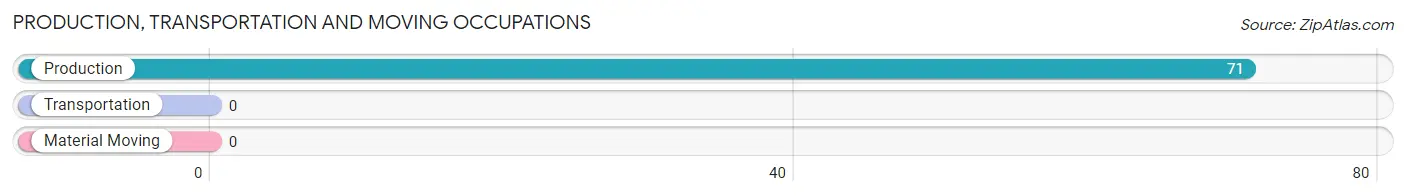
Production, Transportation and Moving Occupations by Sex
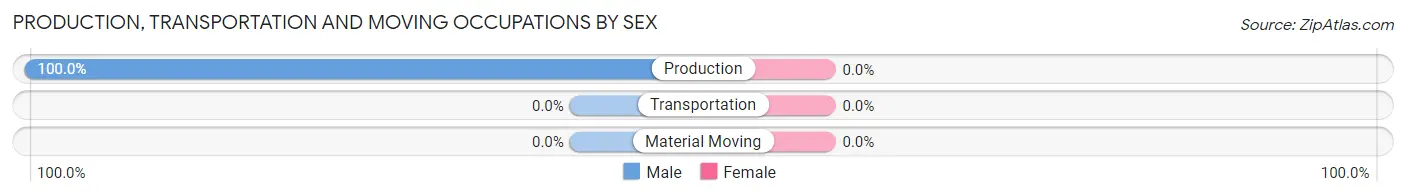
| Occupation | Male | Female |
| Production | 71 (100.0%) | 0 (0.0%) |
| Transportation | 0 (0.0%) | 0 (0.0%) |
| Material Moving | 0 (0.0%) | 0 (0.0%) |
| Total (Category) | 71 (100.0%) | 0 (0.0%) |
| Total (Overall) | 101 (54.0%) | 86 (46.0%) |
Employment Industries by Sex in Dennard
Employment Industries in Dennard
The major employment industries in Dennard include Manufacturing (71 | 38.0%), Real Estate, Rental & Leasing (55 | 29.4%), Health Care & Social Assistance (23 | 12.3%), and Public Administration (14 | 7.5%).
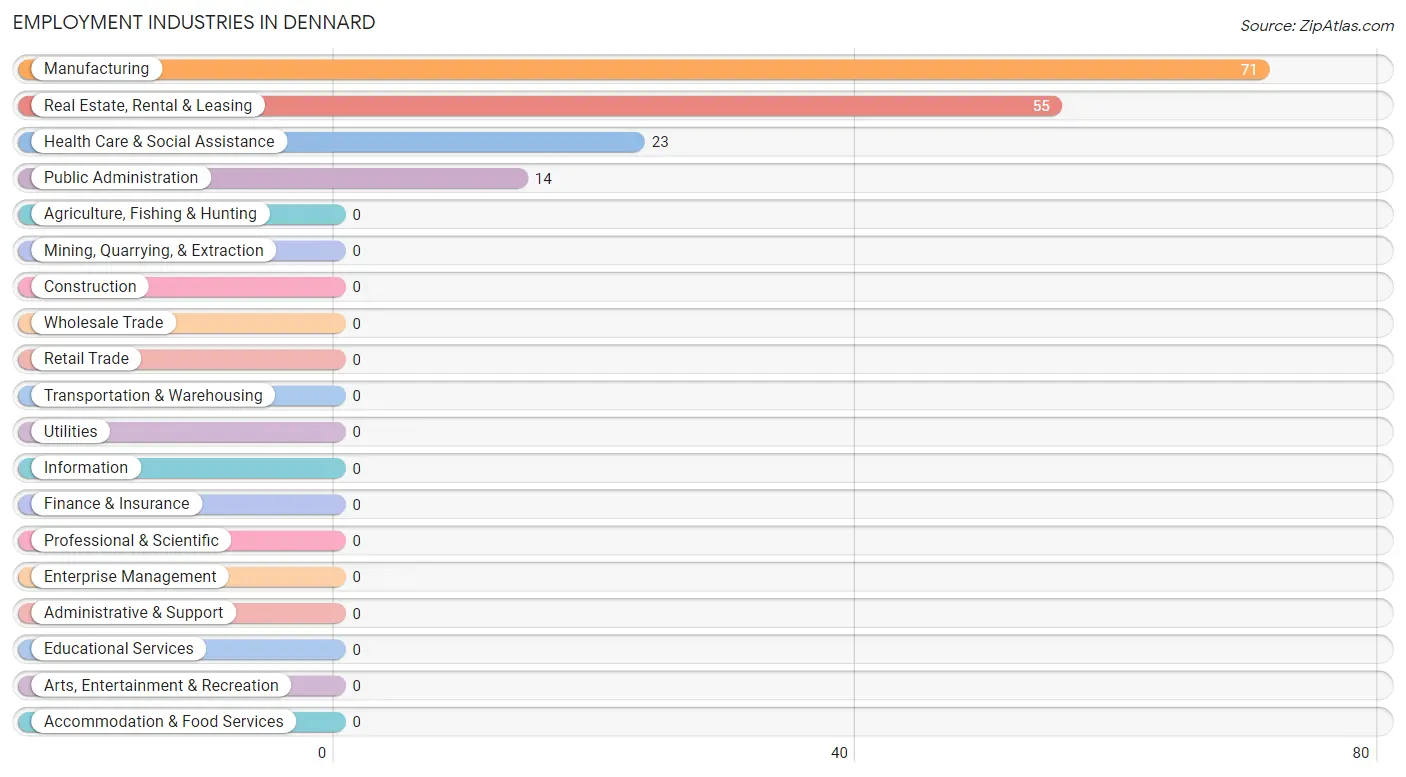
Employment Industries by Sex in Dennard
The Dennard industries that see more men than women are Manufacturing (100.0%), and Public Administration (42.9%), whereas the industries that tend to have a higher number of women are Real Estate, Rental & Leasing (100.0%), Health Care & Social Assistance (100.0%), and Public Administration (57.1%).
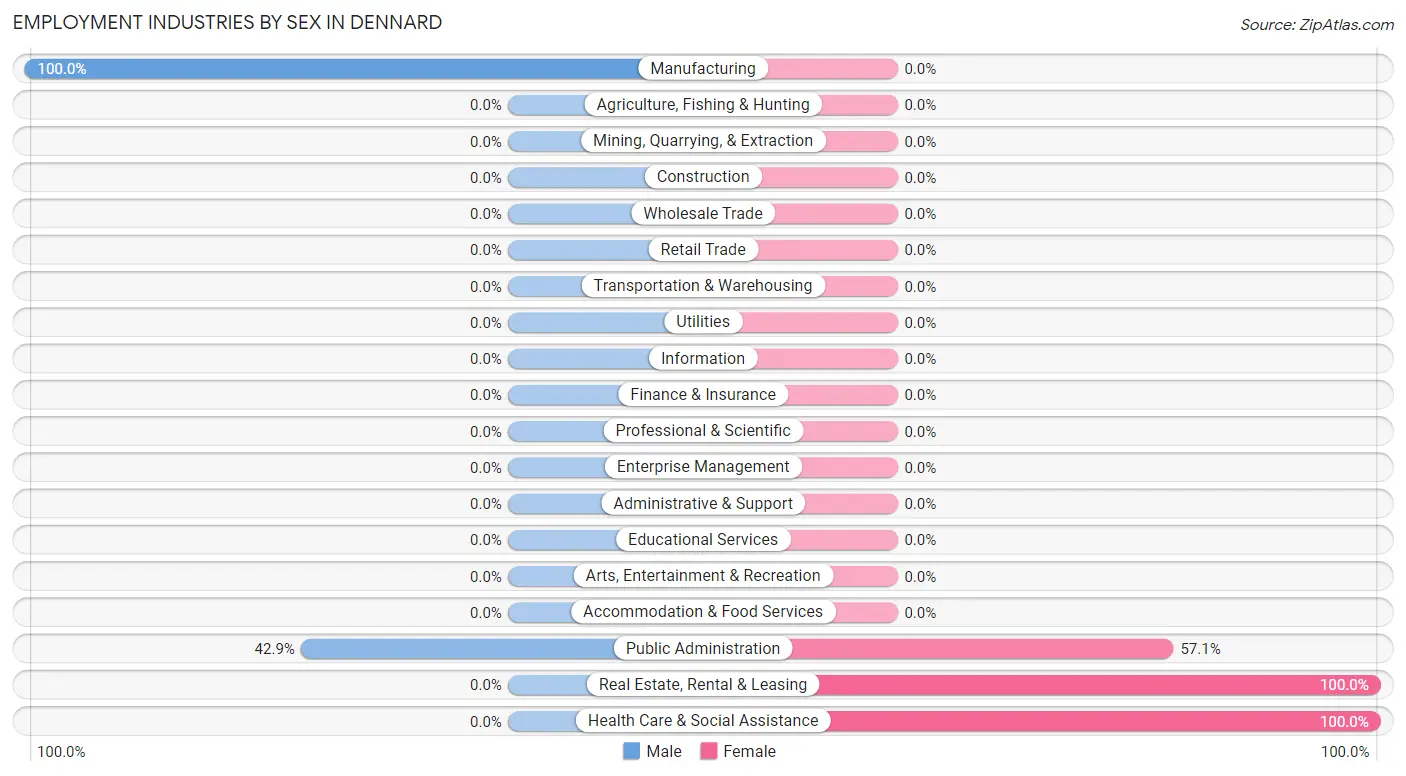
| Industry | Male | Female |
| Agriculture, Fishing & Hunting | 0 (0.0%) | 0 (0.0%) |
| Mining, Quarrying, & Extraction | 0 (0.0%) | 0 (0.0%) |
| Construction | 0 (0.0%) | 0 (0.0%) |
| Manufacturing | 71 (100.0%) | 0 (0.0%) |
| Wholesale Trade | 0 (0.0%) | 0 (0.0%) |
| Retail Trade | 0 (0.0%) | 0 (0.0%) |
| Transportation & Warehousing | 0 (0.0%) | 0 (0.0%) |
| Utilities | 0 (0.0%) | 0 (0.0%) |
| Information | 0 (0.0%) | 0 (0.0%) |
| Finance & Insurance | 0 (0.0%) | 0 (0.0%) |
| Real Estate, Rental & Leasing | 0 (0.0%) | 55 (100.0%) |
| Professional & Scientific | 0 (0.0%) | 0 (0.0%) |
| Enterprise Management | 0 (0.0%) | 0 (0.0%) |
| Administrative & Support | 0 (0.0%) | 0 (0.0%) |
| Educational Services | 0 (0.0%) | 0 (0.0%) |
| Health Care & Social Assistance | 0 (0.0%) | 23 (100.0%) |
| Arts, Entertainment & Recreation | 0 (0.0%) | 0 (0.0%) |
| Accommodation & Food Services | 0 (0.0%) | 0 (0.0%) |
| Public Administration | 6 (42.9%) | 8 (57.1%) |
| Total | 101 (54.0%) | 86 (46.0%) |
Education in Dennard
School Enrollment in Dennard
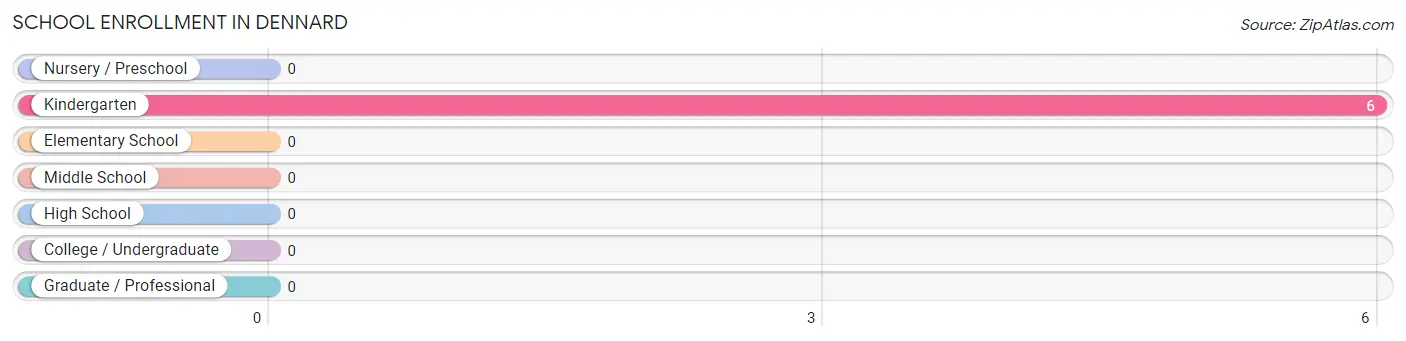
| School Level | # Students | % Students |
| Nursery / Preschool | 0 | 0.0% |
| Kindergarten | 6 | 100.0% |
| Elementary School | 0 | 0.0% |
| Middle School | 0 | 0.0% |
| High School | 0 | 0.0% |
| College / Undergraduate | 0 | 0.0% |
| Graduate / Professional | 0 | 0.0% |
| Total | 6 | 100.0% |
School Enrollment by Age by Funding Source in Dennard
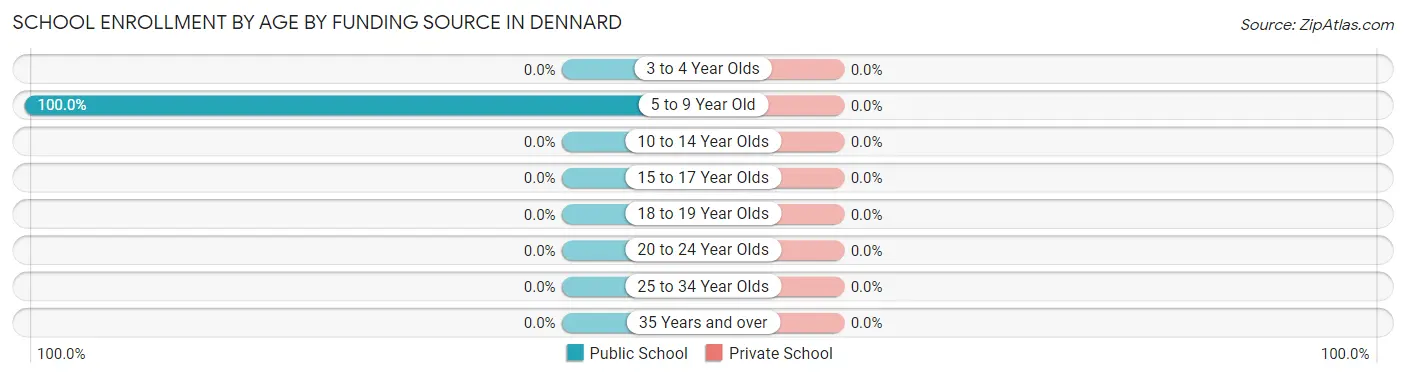
| Age Bracket | Public School | Private School |
| 3 to 4 Year Olds | 0 (0.0%) | 0 (0.0%) |
| 5 to 9 Year Old | 6 (100.0%) | 0 (0.0%) |
| 10 to 14 Year Olds | 0 (0.0%) | 0 (0.0%) |
| 15 to 17 Year Olds | 0 (0.0%) | 0 (0.0%) |
| 18 to 19 Year Olds | 0 (0.0%) | 0 (0.0%) |
| 20 to 24 Year Olds | 0 (0.0%) | 0 (0.0%) |
| 25 to 34 Year Olds | 0 (0.0%) | 0 (0.0%) |
| 35 Years and over | 0 (0.0%) | 0 (0.0%) |
| Total | 6 (100.0%) | 0 (0.0%) |
Educational Attainment by Field of Study in Dennard
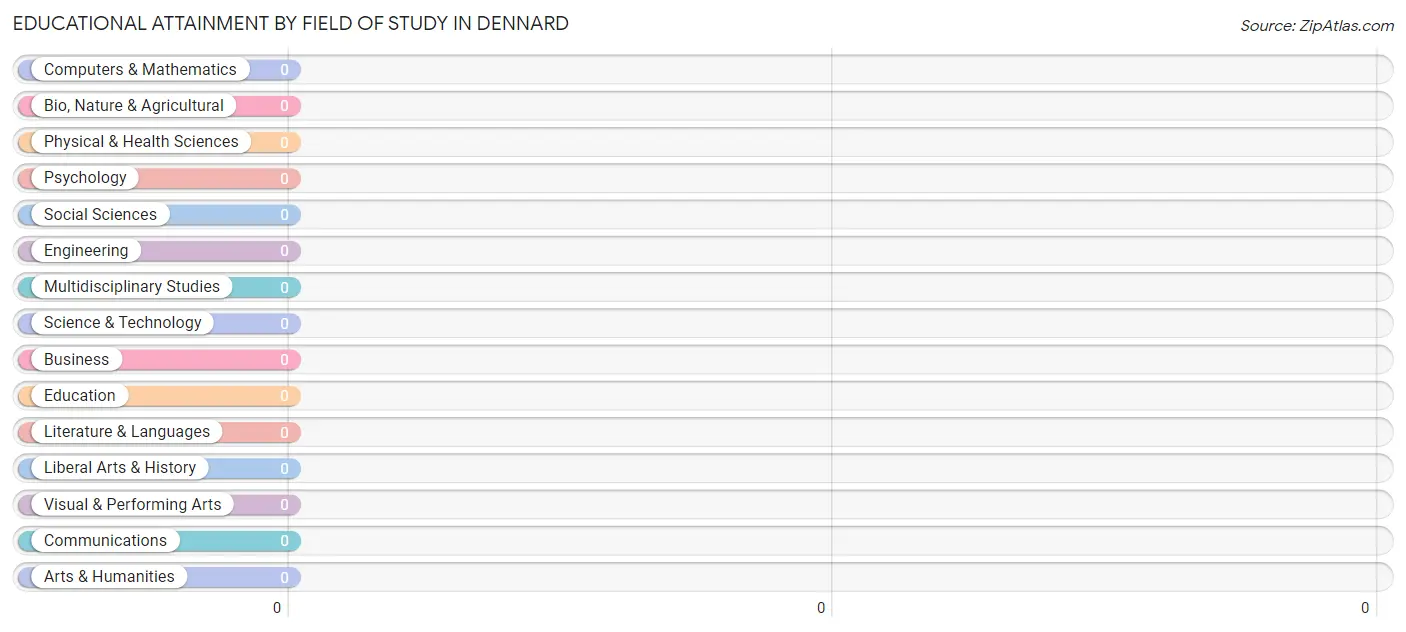
| Field of Study | # Graduates | % Graduates |
| Computers & Mathematics | 0 | 0.0% |
| Bio, Nature & Agricultural | 0 | 0.0% |
| Physical & Health Sciences | 0 | 0.0% |
| Psychology | 0 | 0.0% |
| Social Sciences | 0 | 0.0% |
| Engineering | 0 | 0.0% |
| Multidisciplinary Studies | 0 | 0.0% |
| Science & Technology | 0 | 0.0% |
| Business | 0 | 0.0% |
| Education | 0 | 0.0% |
| Literature & Languages | 0 | 0.0% |
| Liberal Arts & History | 0 | 0.0% |
| Visual & Performing Arts | 0 | 0.0% |
| Communications | 0 | 0.0% |
| Arts & Humanities | 0 | 0.0% |
| Total | 0 | 0.0% |
Transportation & Commute in Dennard
Vehicle Availability by Sex in Dennard
The most prevalent vehicle ownership categories in Dennard are males with 2 vehicles (39, accounting for 38.6%) and females with 2 vehicles (63, making up 45.4%).
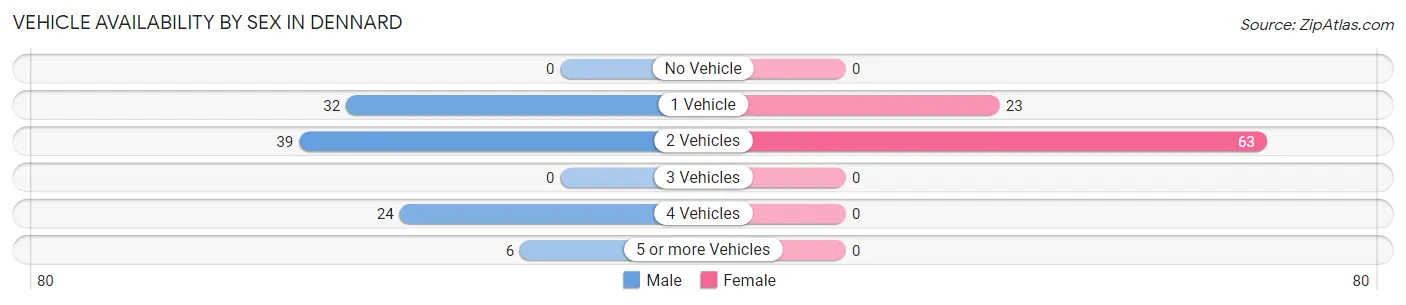
| Vehicles Available | Male | Female |
| No Vehicle | 0 (0.0%) | 0 (0.0%) |
| 1 Vehicle | 32 (31.7%) | 23 (26.7%) |
| 2 Vehicles | 39 (38.6%) | 63 (73.3%) |
| 3 Vehicles | 0 (0.0%) | 0 (0.0%) |
| 4 Vehicles | 24 (23.8%) | 0 (0.0%) |
| 5 or more Vehicles | 6 (5.9%) | 0 (0.0%) |
| Total | 101 (100.0%) | 86 (100.0%) |
Commute Time in Dennard
The most frequently occuring commute durations in Dennard are 60 to 89 minutes (110 commuters, 58.8%), 30 to 34 minutes (39 commuters, 20.9%), and 15 to 19 minutes (24 commuters, 12.8%).
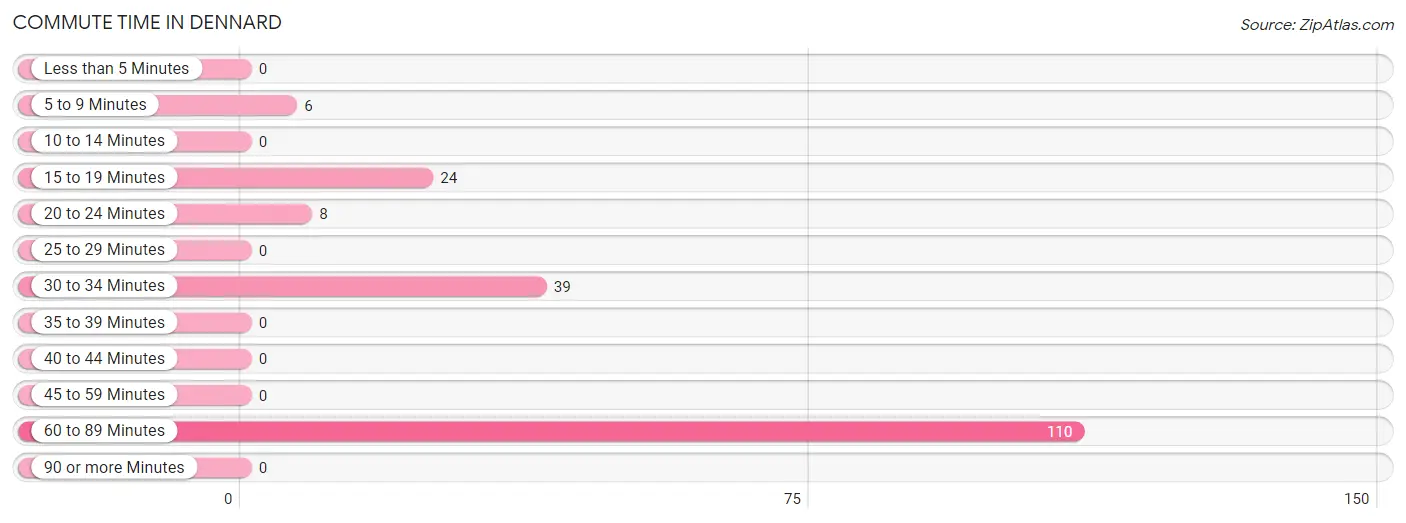
| Commute Time | # Commuters | % Commuters |
| Less than 5 Minutes | 0 | 0.0% |
| 5 to 9 Minutes | 6 | 3.2% |
| 10 to 14 Minutes | 0 | 0.0% |
| 15 to 19 Minutes | 24 | 12.8% |
| 20 to 24 Minutes | 8 | 4.3% |
| 25 to 29 Minutes | 0 | 0.0% |
| 30 to 34 Minutes | 39 | 20.9% |
| 35 to 39 Minutes | 0 | 0.0% |
| 40 to 44 Minutes | 0 | 0.0% |
| 45 to 59 Minutes | 0 | 0.0% |
| 60 to 89 Minutes | 110 | 58.8% |
| 90 or more Minutes | 0 | 0.0% |
Commute Time by Sex in Dennard
The most common commute times in Dennard are 30 to 34 minutes (39 commuters, 38.6%) for males and 60 to 89 minutes (78 commuters, 90.7%) for females.
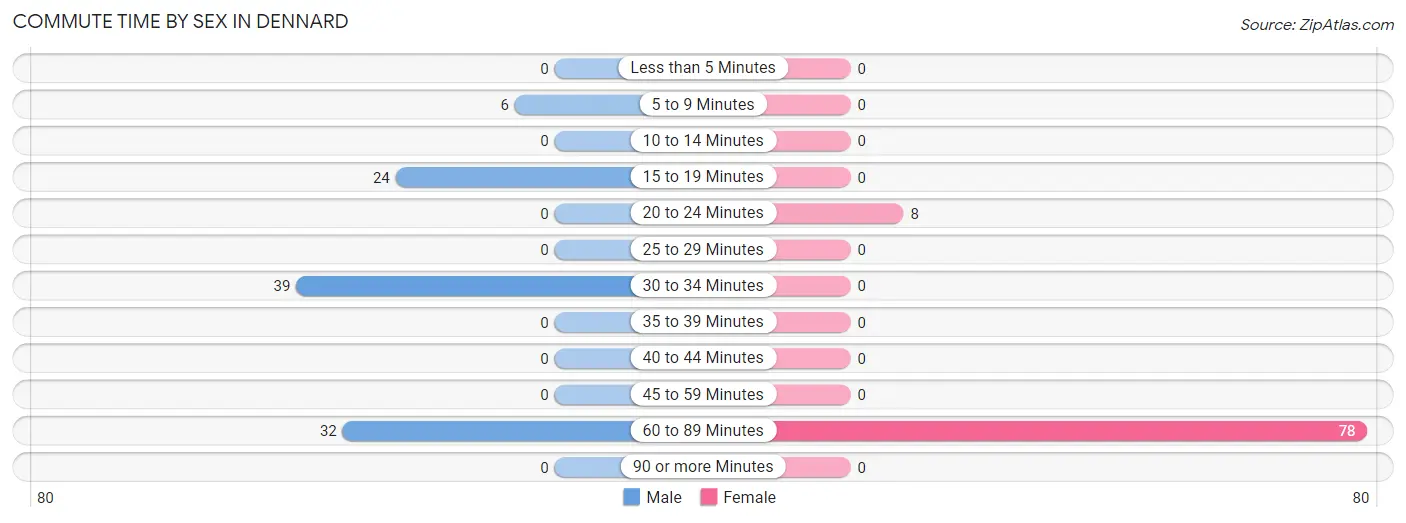
| Commute Time | Male | Female |
| Less than 5 Minutes | 0 (0.0%) | 0 (0.0%) |
| 5 to 9 Minutes | 6 (5.9%) | 0 (0.0%) |
| 10 to 14 Minutes | 0 (0.0%) | 0 (0.0%) |
| 15 to 19 Minutes | 24 (23.8%) | 0 (0.0%) |
| 20 to 24 Minutes | 0 (0.0%) | 8 (9.3%) |
| 25 to 29 Minutes | 0 (0.0%) | 0 (0.0%) |
| 30 to 34 Minutes | 39 (38.6%) | 0 (0.0%) |
| 35 to 39 Minutes | 0 (0.0%) | 0 (0.0%) |
| 40 to 44 Minutes | 0 (0.0%) | 0 (0.0%) |
| 45 to 59 Minutes | 0 (0.0%) | 0 (0.0%) |
| 60 to 89 Minutes | 32 (31.7%) | 78 (90.7%) |
| 90 or more Minutes | 0 (0.0%) | 0 (0.0%) |
Time of Departure to Work by Sex in Dennard
The most frequent times of departure to work in Dennard are 9:00 AM to 9:59 AM (69, 68.3%) for males and 7:00 AM to 7:29 AM (63, 73.3%) for females.
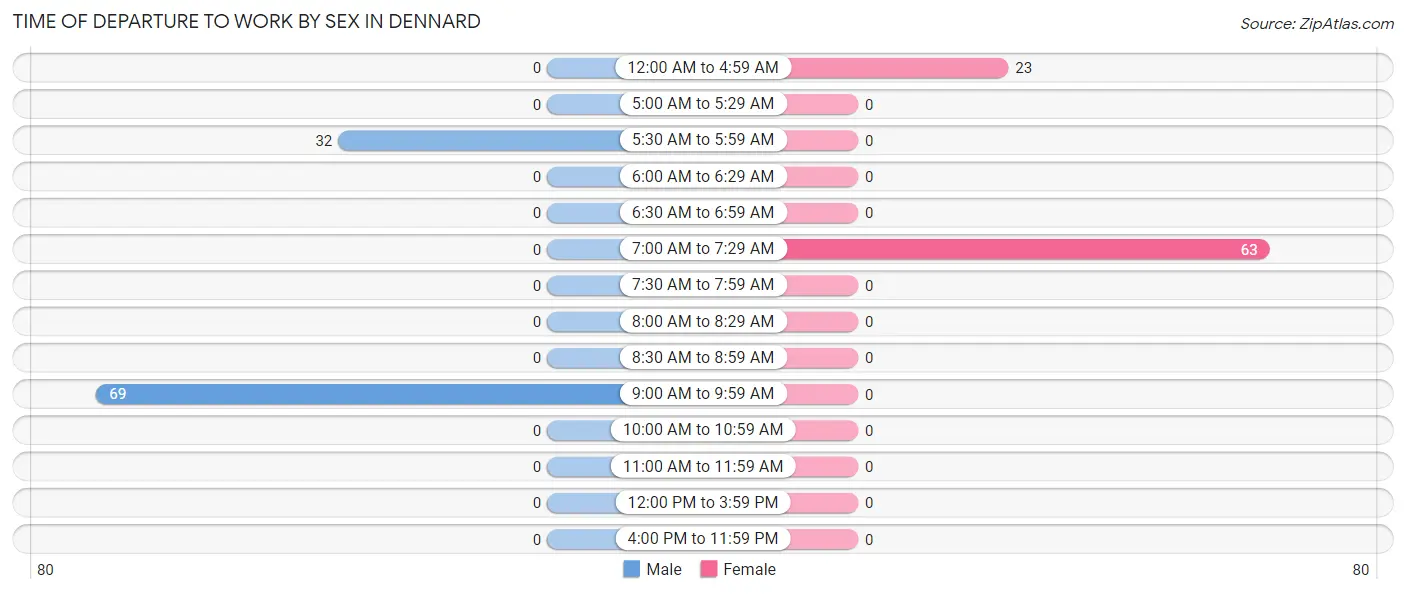
| Time of Departure | Male | Female |
| 12:00 AM to 4:59 AM | 0 (0.0%) | 23 (26.7%) |
| 5:00 AM to 5:29 AM | 0 (0.0%) | 0 (0.0%) |
| 5:30 AM to 5:59 AM | 32 (31.7%) | 0 (0.0%) |
| 6:00 AM to 6:29 AM | 0 (0.0%) | 0 (0.0%) |
| 6:30 AM to 6:59 AM | 0 (0.0%) | 0 (0.0%) |
| 7:00 AM to 7:29 AM | 0 (0.0%) | 63 (73.3%) |
| 7:30 AM to 7:59 AM | 0 (0.0%) | 0 (0.0%) |
| 8:00 AM to 8:29 AM | 0 (0.0%) | 0 (0.0%) |
| 8:30 AM to 8:59 AM | 0 (0.0%) | 0 (0.0%) |
| 9:00 AM to 9:59 AM | 69 (68.3%) | 0 (0.0%) |
| 10:00 AM to 10:59 AM | 0 (0.0%) | 0 (0.0%) |
| 11:00 AM to 11:59 AM | 0 (0.0%) | 0 (0.0%) |
| 12:00 PM to 3:59 PM | 0 (0.0%) | 0 (0.0%) |
| 4:00 PM to 11:59 PM | 0 (0.0%) | 0 (0.0%) |
| Total | 101 (100.0%) | 86 (100.0%) |
Housing Occupancy in Dennard
Occupancy by Ownership in Dennard
Of the total 195 dwellings in Dennard, owner-occupied units account for 187 (95.9%), while renter-occupied units make up 8 (4.1%).
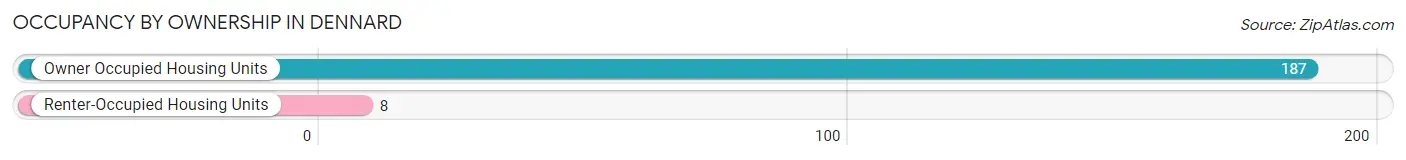
| Occupancy | # Housing Units | % Housing Units |
| Owner Occupied Housing Units | 187 | 95.9% |
| Renter-Occupied Housing Units | 8 | 4.1% |
| Total Occupied Housing Units | 195 | 100.0% |
Occupancy by Household Size in Dennard
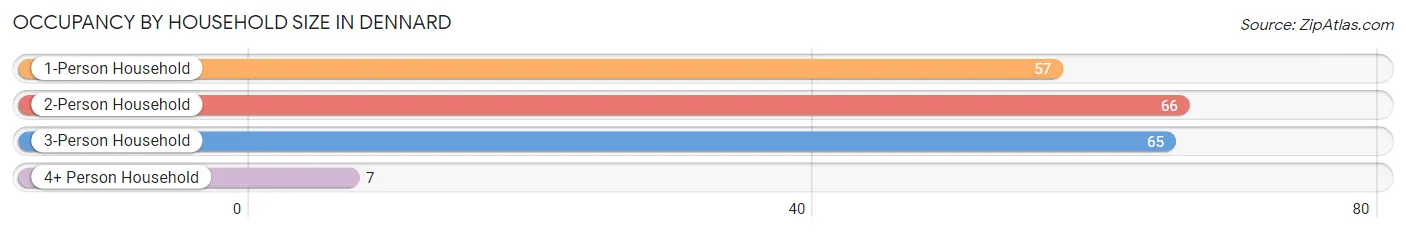
| Household Size | # Housing Units | % Housing Units |
| 1-Person Household | 57 | 29.2% |
| 2-Person Household | 66 | 33.9% |
| 3-Person Household | 65 | 33.3% |
| 4+ Person Household | 7 | 3.6% |
| Total Housing Units | 195 | 100.0% |
Occupancy by Ownership by Household Size in Dennard
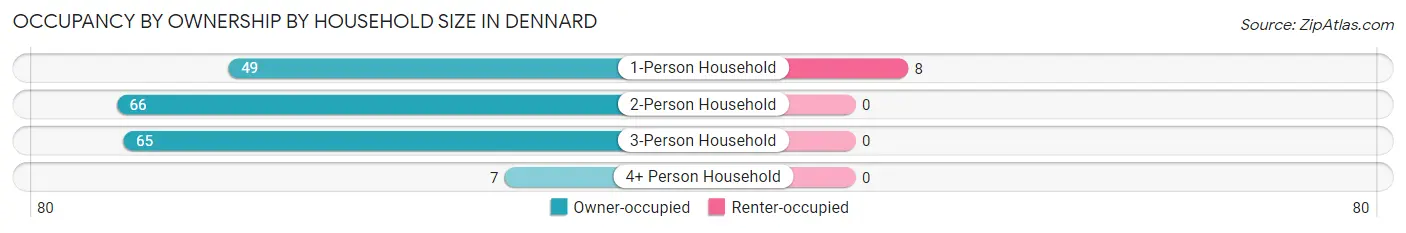
| Household Size | Owner-occupied | Renter-occupied |
| 1-Person Household | 49 (86.0%) | 8 (14.0%) |
| 2-Person Household | 66 (100.0%) | 0 (0.0%) |
| 3-Person Household | 65 (100.0%) | 0 (0.0%) |
| 4+ Person Household | 7 (100.0%) | 0 (0.0%) |
| Total Housing Units | 187 (95.9%) | 8 (4.1%) |
Occupancy by Educational Attainment in Dennard
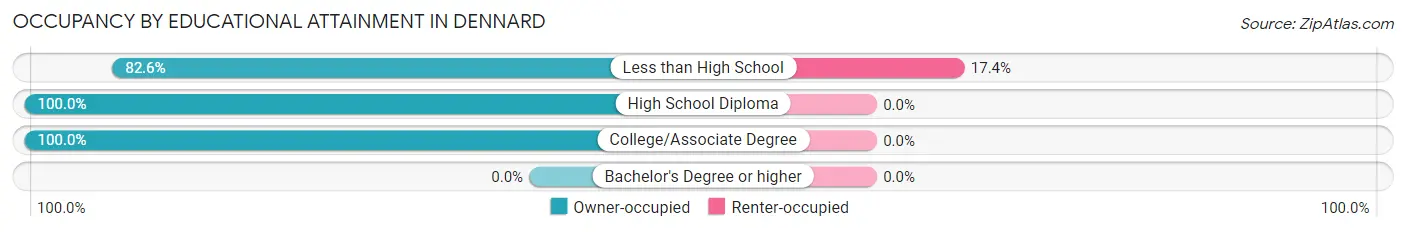
| Household Size | Owner-occupied | Renter-occupied |
| Less than High School | 38 (82.6%) | 8 (17.4%) |
| High School Diploma | 94 (100.0%) | 0 (0.0%) |
| College/Associate Degree | 55 (100.0%) | 0 (0.0%) |
| Bachelor's Degree or higher | 0 (0.0%) | 0 (0.0%) |
Occupancy by Age of Householder in Dennard
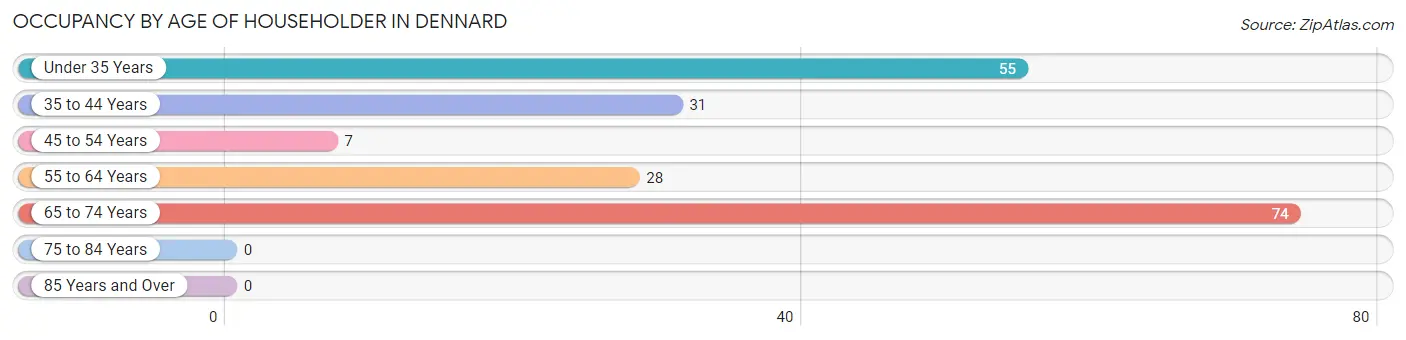
| Age Bracket | # Households | % Households |
| Under 35 Years | 55 | 28.2% |
| 35 to 44 Years | 31 | 15.9% |
| 45 to 54 Years | 7 | 3.6% |
| 55 to 64 Years | 28 | 14.4% |
| 65 to 74 Years | 74 | 38.0% |
| 75 to 84 Years | 0 | 0.0% |
| 85 Years and Over | 0 | 0.0% |
| Total | 195 | 100.0% |
Housing Finances in Dennard
Median Income by Occupancy in Dennard
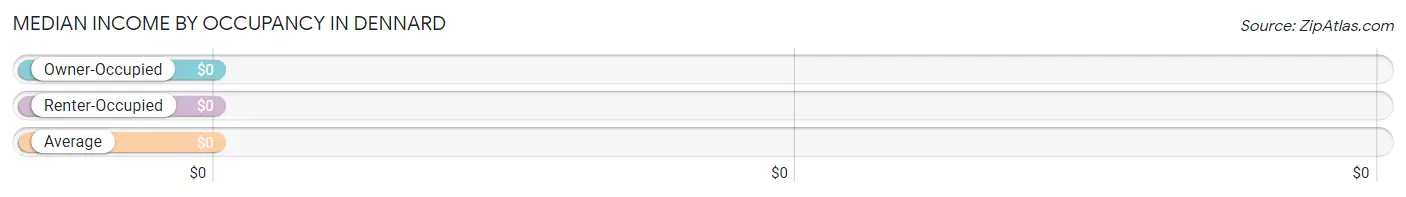
| Occupancy Type | # Households | Median Income |
| Owner-Occupied | 187 (95.9%) | $0 |
| Renter-Occupied | 8 (4.1%) | $0 |
| Average | 195 (100.0%) | $0 |
Occupancy by Householder Income Bracket in Dennard
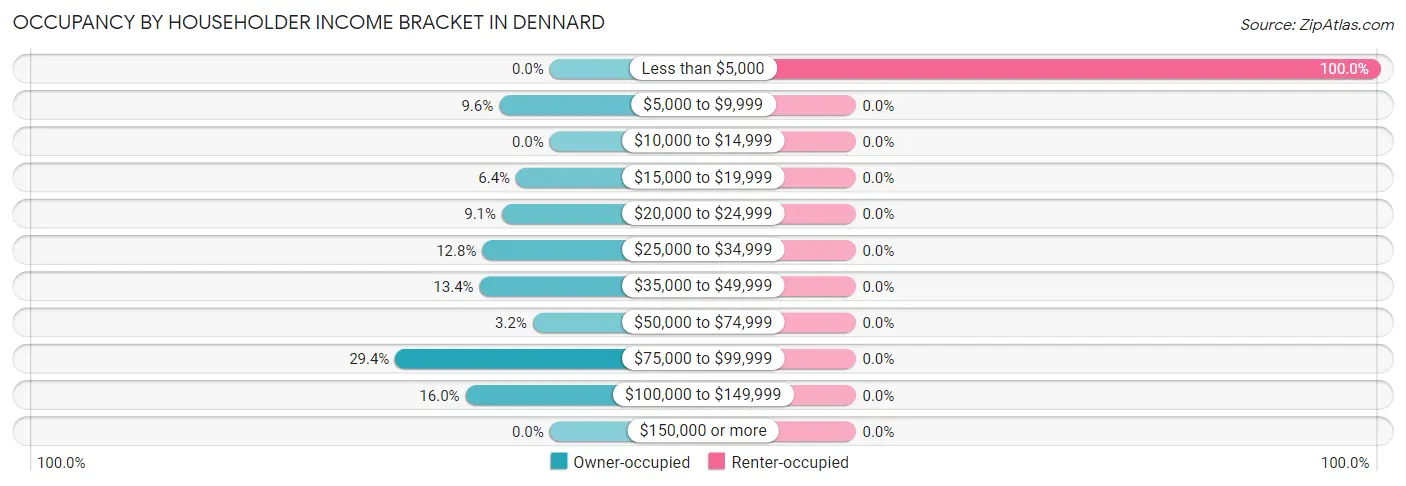
| Income Bracket | Owner-occupied | Renter-occupied |
| Less than $5,000 | 0 (0.0%) | 8 (100.0%) |
| $5,000 to $9,999 | 18 (9.6%) | 0 (0.0%) |
| $10,000 to $14,999 | 0 (0.0%) | 0 (0.0%) |
| $15,000 to $19,999 | 12 (6.4%) | 0 (0.0%) |
| $20,000 to $24,999 | 17 (9.1%) | 0 (0.0%) |
| $25,000 to $34,999 | 24 (12.8%) | 0 (0.0%) |
| $35,000 to $49,999 | 25 (13.4%) | 0 (0.0%) |
| $50,000 to $74,999 | 6 (3.2%) | 0 (0.0%) |
| $75,000 to $99,999 | 55 (29.4%) | 0 (0.0%) |
| $100,000 to $149,999 | 30 (16.0%) | 0 (0.0%) |
| $150,000 or more | 0 (0.0%) | 0 (0.0%) |
| Total | 187 (100.0%) | 8 (100.0%) |
Monthly Housing Cost Tiers in Dennard
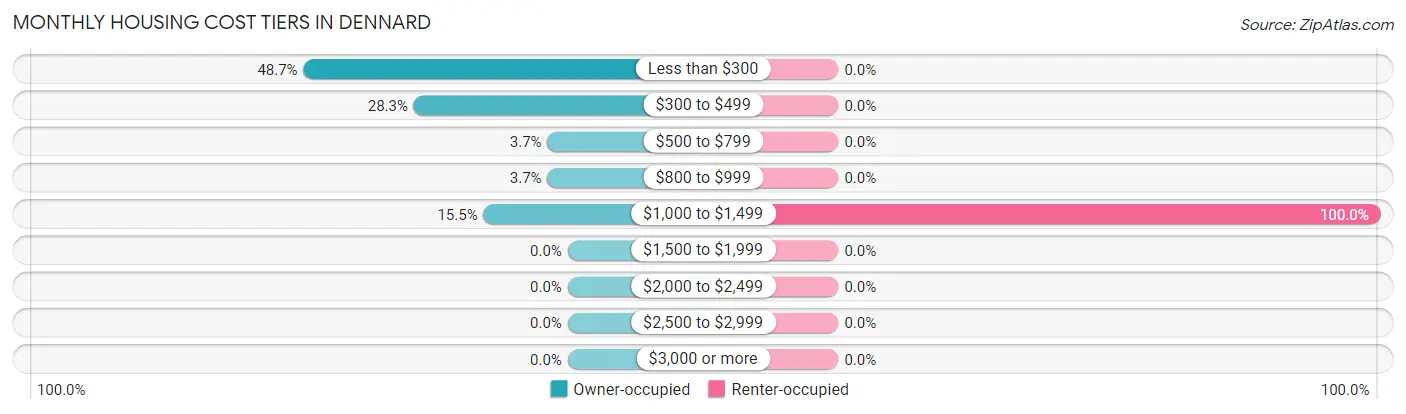
| Monthly Cost | Owner-occupied | Renter-occupied |
| Less than $300 | 91 (48.7%) | 0 (0.0%) |
| $300 to $499 | 53 (28.3%) | 0 (0.0%) |
| $500 to $799 | 7 (3.7%) | 0 (0.0%) |
| $800 to $999 | 7 (3.7%) | 0 (0.0%) |
| $1,000 to $1,499 | 29 (15.5%) | 8 (100.0%) |
| $1,500 to $1,999 | 0 (0.0%) | 0 (0.0%) |
| $2,000 to $2,499 | 0 (0.0%) | 0 (0.0%) |
| $2,500 to $2,999 | 0 (0.0%) | 0 (0.0%) |
| $3,000 or more | 0 (0.0%) | 0 (0.0%) |
| Total | 187 (100.0%) | 8 (100.0%) |
Physical Housing Characteristics in Dennard
Housing Structures in Dennard
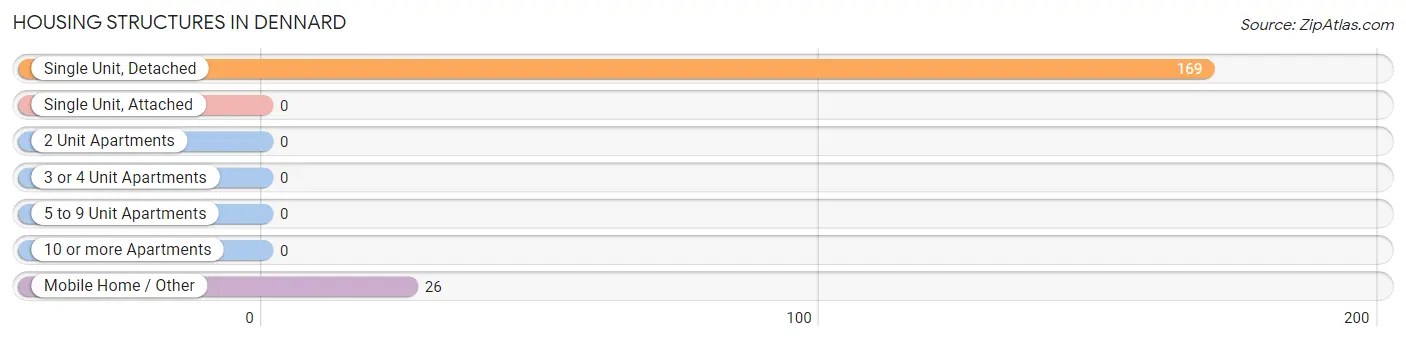
| Structure Type | # Housing Units | % Housing Units |
| Single Unit, Detached | 169 | 86.7% |
| Single Unit, Attached | 0 | 0.0% |
| 2 Unit Apartments | 0 | 0.0% |
| 3 or 4 Unit Apartments | 0 | 0.0% |
| 5 to 9 Unit Apartments | 0 | 0.0% |
| 10 or more Apartments | 0 | 0.0% |
| Mobile Home / Other | 26 | 13.3% |
| Total | 195 | 100.0% |
Housing Structures by Occupancy in Dennard
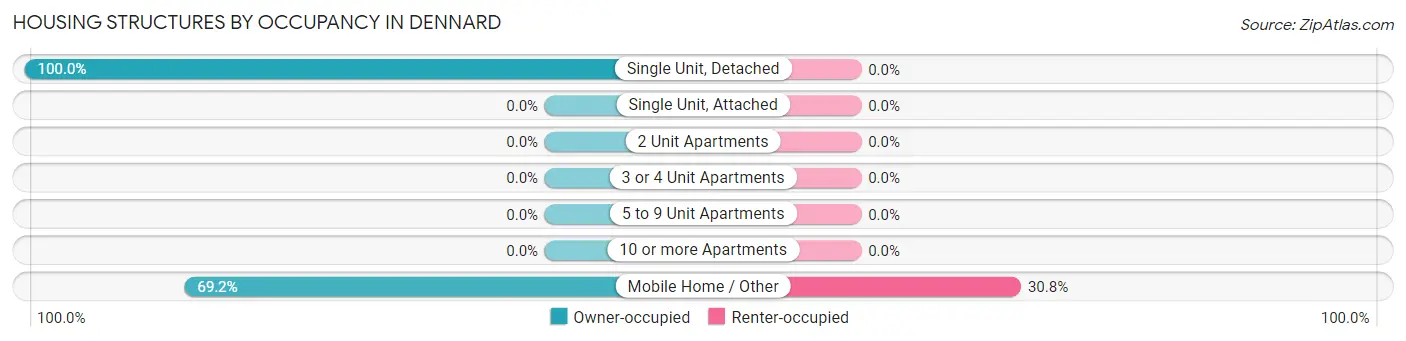
| Structure Type | Owner-occupied | Renter-occupied |
| Single Unit, Detached | 169 (100.0%) | 0 (0.0%) |
| Single Unit, Attached | 0 (0.0%) | 0 (0.0%) |
| 2 Unit Apartments | 0 (0.0%) | 0 (0.0%) |
| 3 or 4 Unit Apartments | 0 (0.0%) | 0 (0.0%) |
| 5 to 9 Unit Apartments | 0 (0.0%) | 0 (0.0%) |
| 10 or more Apartments | 0 (0.0%) | 0 (0.0%) |
| Mobile Home / Other | 18 (69.2%) | 8 (30.8%) |
| Total | 187 (95.9%) | 8 (4.1%) |
Housing Structures by Number of Rooms in Dennard
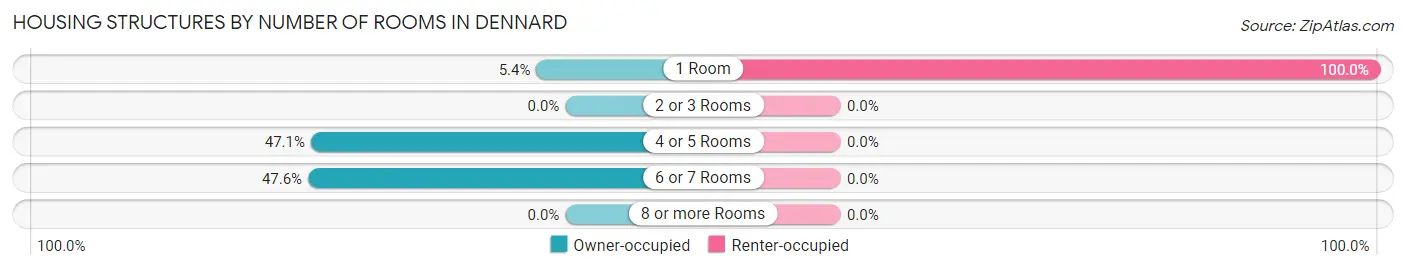
| Number of Rooms | Owner-occupied | Renter-occupied |
| 1 Room | 10 (5.3%) | 8 (100.0%) |
| 2 or 3 Rooms | 0 (0.0%) | 0 (0.0%) |
| 4 or 5 Rooms | 88 (47.1%) | 0 (0.0%) |
| 6 or 7 Rooms | 89 (47.6%) | 0 (0.0%) |
| 8 or more Rooms | 0 (0.0%) | 0 (0.0%) |
| Total | 187 (100.0%) | 8 (100.0%) |
Housing Structure by Heating Type in Dennard
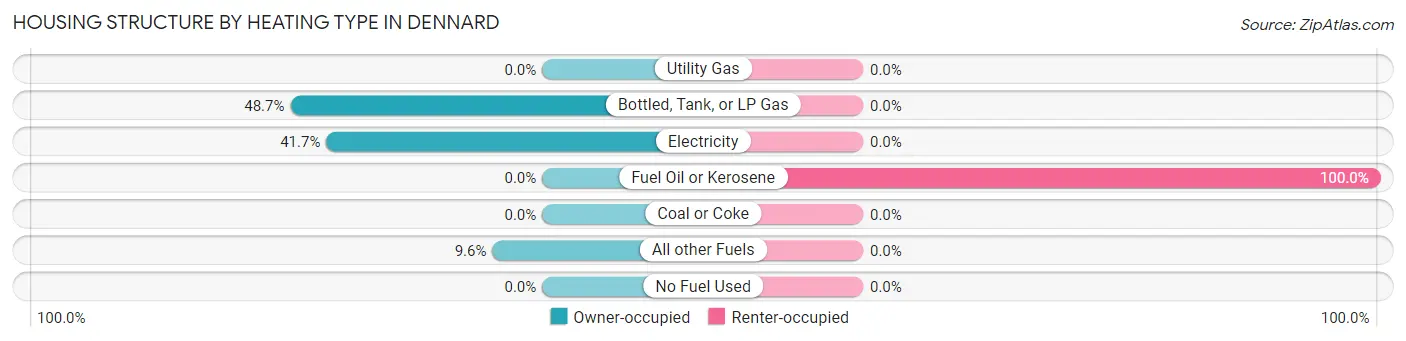
| Heating Type | Owner-occupied | Renter-occupied |
| Utility Gas | 0 (0.0%) | 0 (0.0%) |
| Bottled, Tank, or LP Gas | 91 (48.7%) | 0 (0.0%) |
| Electricity | 78 (41.7%) | 0 (0.0%) |
| Fuel Oil or Kerosene | 0 (0.0%) | 8 (100.0%) |
| Coal or Coke | 0 (0.0%) | 0 (0.0%) |
| All other Fuels | 18 (9.6%) | 0 (0.0%) |
| No Fuel Used | 0 (0.0%) | 0 (0.0%) |
| Total | 187 (100.0%) | 8 (100.0%) |
Household Vehicle Usage in Dennard
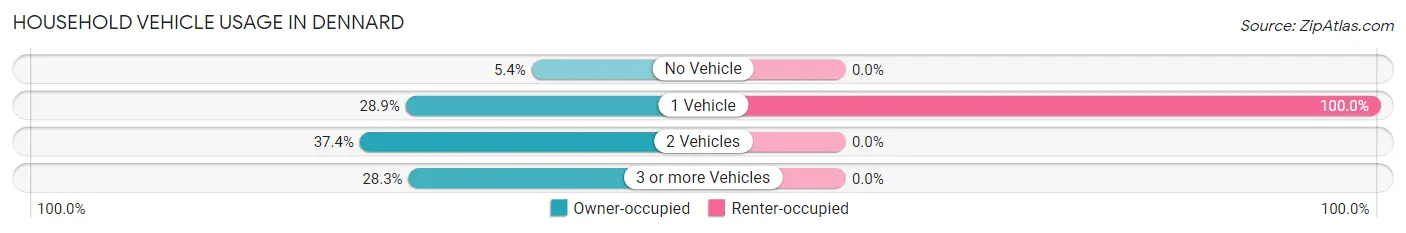
| Vehicles per Household | Owner-occupied | Renter-occupied |
| No Vehicle | 10 (5.3%) | 0 (0.0%) |
| 1 Vehicle | 54 (28.9%) | 8 (100.0%) |
| 2 Vehicles | 70 (37.4%) | 0 (0.0%) |
| 3 or more Vehicles | 53 (28.3%) | 0 (0.0%) |
| Total | 187 (100.0%) | 8 (100.0%) |
Real Estate & Mortgages in Dennard
Real Estate and Mortgage Overview in Dennard
| Characteristic | Without Mortgage | With Mortgage |
| Housing Units | 151 | 36 |
| Median Property Value | - | - |
| Median Household Income | - | - |
| Monthly Housing Costs | $244 | $0 |
| Real Estate Taxes | $199 | $0 |
Property Value by Mortgage Status in Dennard
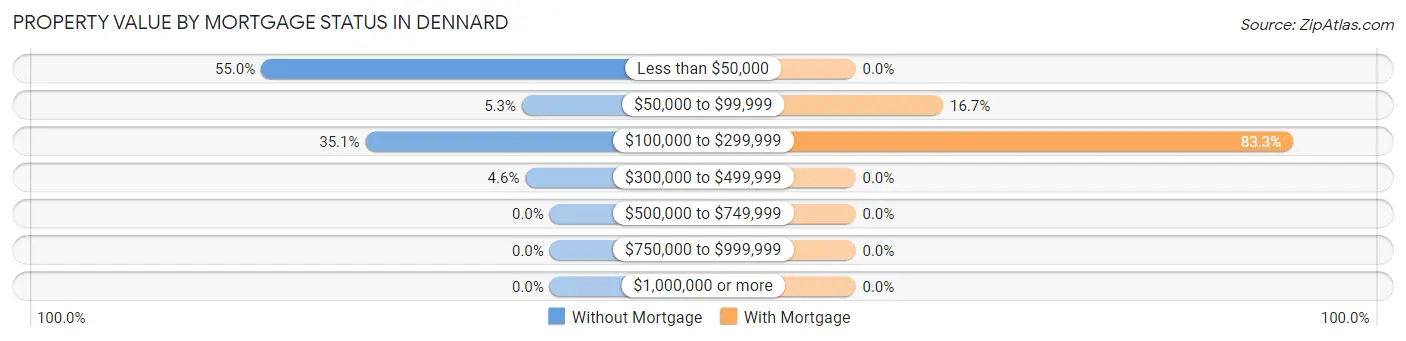
| Property Value | Without Mortgage | With Mortgage |
| Less than $50,000 | 83 (55.0%) | 0 (0.0%) |
| $50,000 to $99,999 | 8 (5.3%) | 6 (16.7%) |
| $100,000 to $299,999 | 53 (35.1%) | 30 (83.3%) |
| $300,000 to $499,999 | 7 (4.6%) | 0 (0.0%) |
| $500,000 to $749,999 | 0 (0.0%) | 0 (0.0%) |
| $750,000 to $999,999 | 0 (0.0%) | 0 (0.0%) |
| $1,000,000 or more | 0 (0.0%) | 0 (0.0%) |
| Total | 151 (100.0%) | 36 (100.0%) |
Household Income by Mortgage Status in Dennard
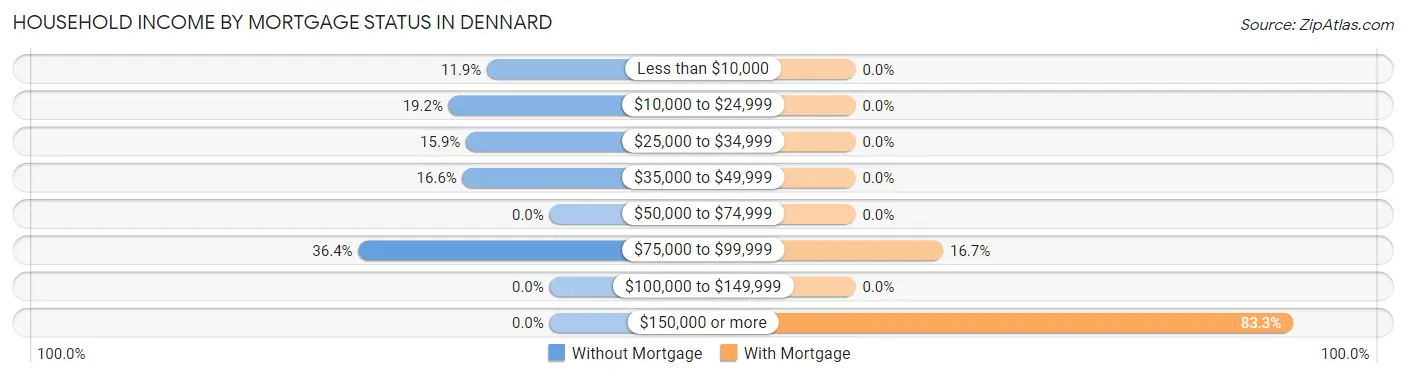
| Household Income | Without Mortgage | With Mortgage |
| Less than $10,000 | 18 (11.9%) | 0 (0.0%) |
| $10,000 to $24,999 | 29 (19.2%) | 0 (0.0%) |
| $25,000 to $34,999 | 24 (15.9%) | 0 (0.0%) |
| $35,000 to $49,999 | 25 (16.6%) | 0 (0.0%) |
| $50,000 to $74,999 | 0 (0.0%) | 0 (0.0%) |
| $75,000 to $99,999 | 55 (36.4%) | 6 (16.7%) |
| $100,000 to $149,999 | 0 (0.0%) | 0 (0.0%) |
| $150,000 or more | 0 (0.0%) | 30 (83.3%) |
| Total | 151 (100.0%) | 36 (100.0%) |
Property Value to Household Income Ratio in Dennard
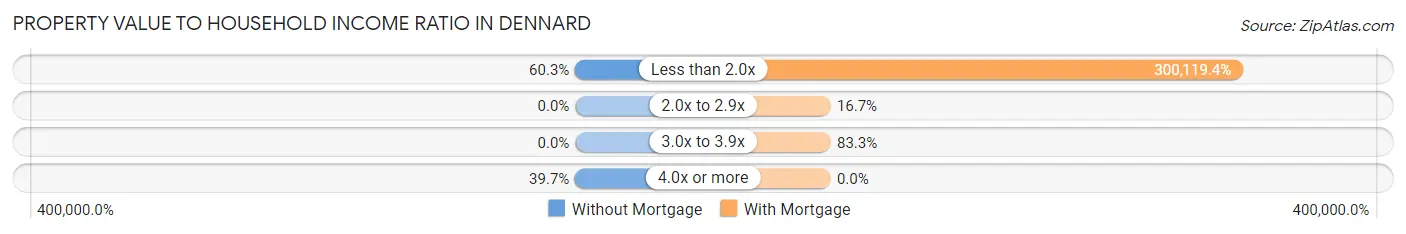
| Value-to-Income Ratio | Without Mortgage | With Mortgage |
| Less than 2.0x | 91 (60.3%) | 108,043 (300,119.4%) |
| 2.0x to 2.9x | 0 (0.0%) | 6 (16.7%) |
| 3.0x to 3.9x | 0 (0.0%) | 30 (83.3%) |
| 4.0x or more | 60 (39.7%) | 0 (0.0%) |
| Total | 151 (100.0%) | 36 (100.0%) |
Real Estate Taxes by Mortgage Status in Dennard
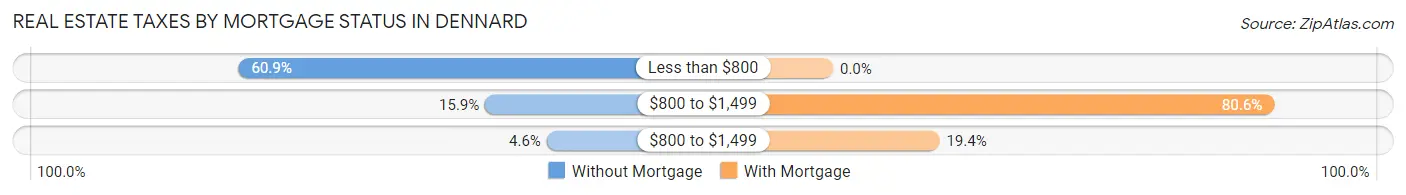
| Property Taxes | Without Mortgage | With Mortgage |
| Less than $800 | 92 (60.9%) | 0 (0.0%) |
| $800 to $1,499 | 24 (15.9%) | 29 (80.6%) |
| $800 to $1,499 | 7 (4.6%) | 7 (19.4%) |
| Total | 151 (100.0%) | 36 (100.0%) |
Health & Disability in Dennard
Health Insurance Coverage by Age in Dennard
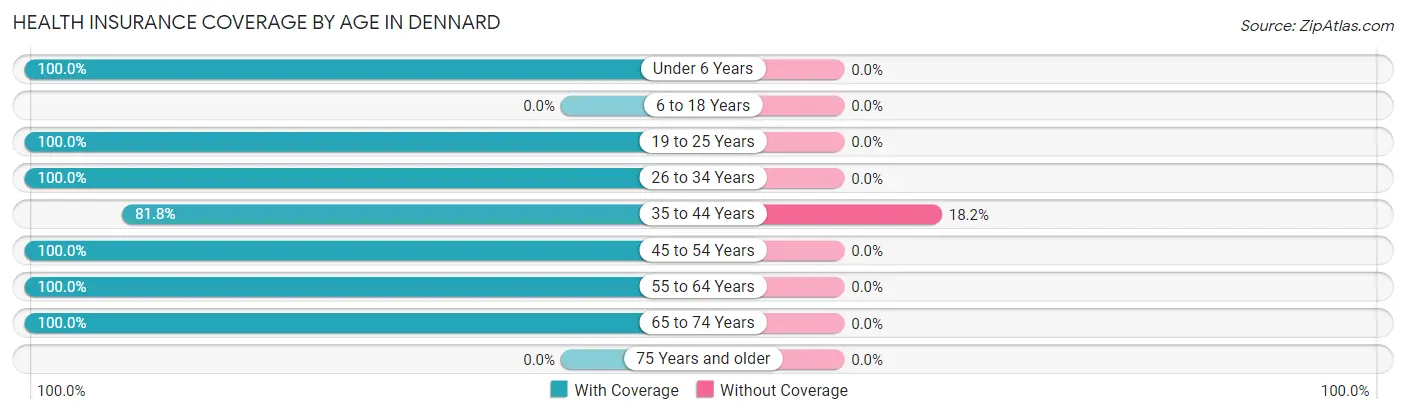
| Age Bracket | With Coverage | Without Coverage |
| Under 6 Years | 35 (100.0%) | 0 (0.0%) |
| 6 to 18 Years | 0 (0.0%) | 0 (0.0%) |
| 19 to 25 Years | 94 (100.0%) | 0 (0.0%) |
| 26 to 34 Years | 42 (100.0%) | 0 (0.0%) |
| 35 to 44 Years | 36 (81.8%) | 8 (18.2%) |
| 45 to 54 Years | 39 (100.0%) | 0 (0.0%) |
| 55 to 64 Years | 43 (100.0%) | 0 (0.0%) |
| 65 to 74 Years | 118 (100.0%) | 0 (0.0%) |
| 75 Years and older | 0 (0.0%) | 0 (0.0%) |
| Total | 407 (98.1%) | 8 (1.9%) |
Health Insurance Coverage by Citizenship Status in Dennard
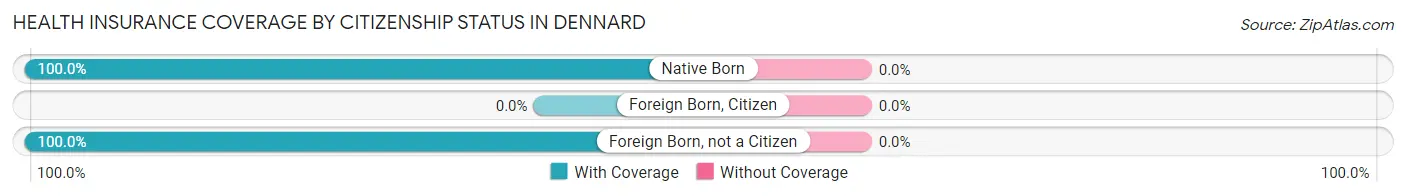
| Citizenship Status | With Coverage | Without Coverage |
| Native Born | 35 (100.0%) | 0 (0.0%) |
| Foreign Born, Citizen | 0 (0.0%) | 0 (0.0%) |
| Foreign Born, not a Citizen | 94 (100.0%) | 0 (0.0%) |
Health Insurance Coverage by Household Income in Dennard
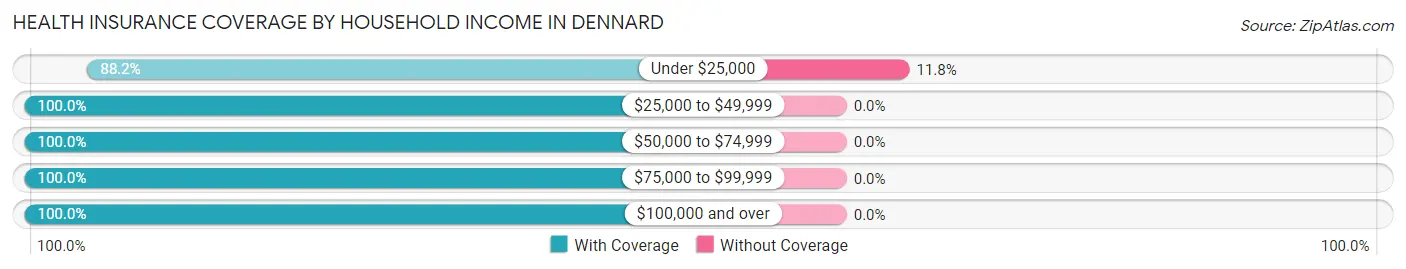
| Household Income | With Coverage | Without Coverage |
| Under $25,000 | 60 (88.2%) | 8 (11.8%) |
| $25,000 to $49,999 | 137 (100.0%) | 0 (0.0%) |
| $50,000 to $74,999 | 6 (100.0%) | 0 (0.0%) |
| $75,000 to $99,999 | 123 (100.0%) | 0 (0.0%) |
| $100,000 and over | 81 (100.0%) | 0 (0.0%) |
Public vs Private Health Insurance Coverage by Age in Dennard
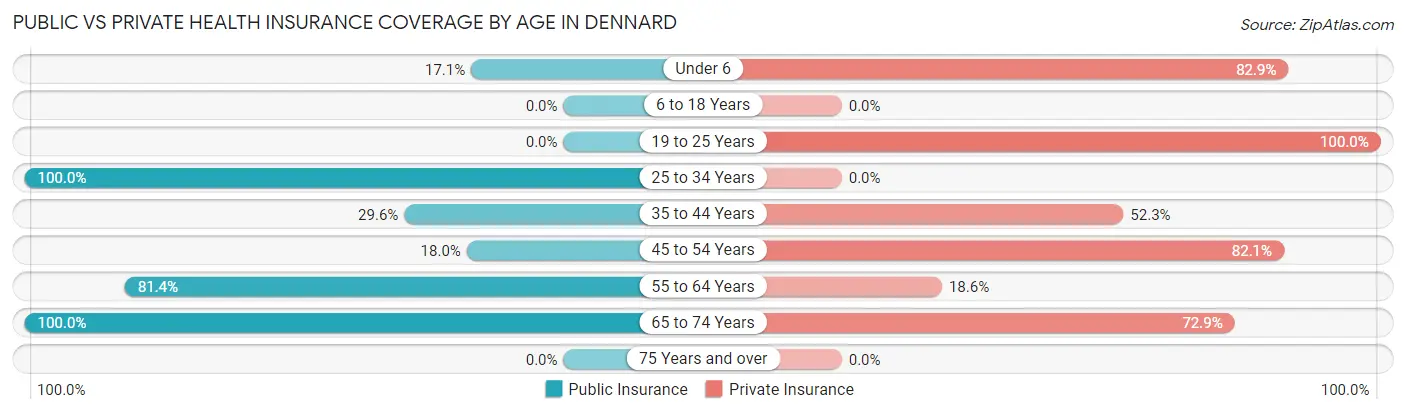
| Age Bracket | Public Insurance | Private Insurance |
| Under 6 | 6 (17.1%) | 29 (82.9%) |
| 6 to 18 Years | 0 (0.0%) | 0 (0.0%) |
| 19 to 25 Years | 0 (0.0%) | 94 (100.0%) |
| 25 to 34 Years | 42 (100.0%) | 0 (0.0%) |
| 35 to 44 Years | 13 (29.5%) | 23 (52.3%) |
| 45 to 54 Years | 7 (17.9%) | 32 (82.1%) |
| 55 to 64 Years | 35 (81.4%) | 8 (18.6%) |
| 65 to 74 Years | 118 (100.0%) | 86 (72.9%) |
| 75 Years and over | 0 (0.0%) | 0 (0.0%) |
| Total | 221 (53.2%) | 272 (65.5%) |
Disability Status by Sex by Age in Dennard
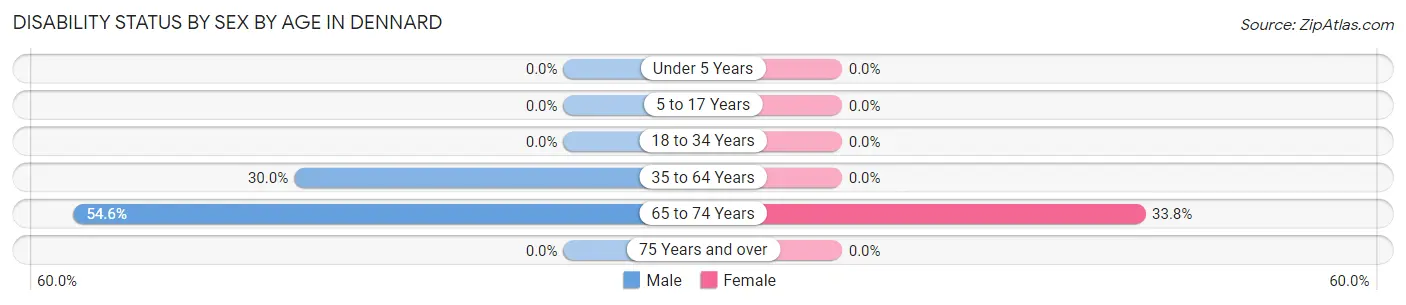
| Age Bracket | Male | Female |
| Under 5 Years | 0 (0.0%) | 0 (0.0%) |
| 5 to 17 Years | 0 (0.0%) | 0 (0.0%) |
| 18 to 34 Years | 0 (0.0%) | 0 (0.0%) |
| 35 to 64 Years | 24 (30.0%) | 0 (0.0%) |
| 65 to 74 Years | 24 (54.5%) | 25 (33.8%) |
| 75 Years and over | 0 (0.0%) | 0 (0.0%) |
Disability Class by Sex by Age in Dennard
Disability Class: Hearing Difficulty
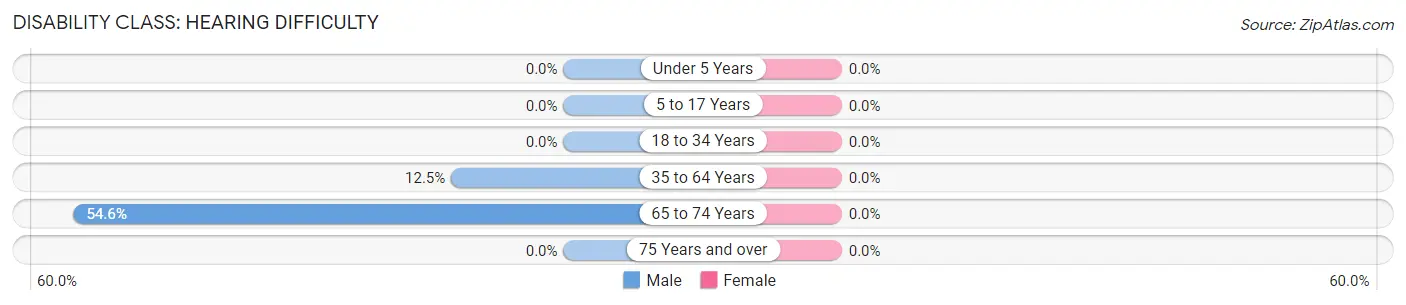
| Age Bracket | Male | Female |
| Under 5 Years | 0 (0.0%) | 0 (0.0%) |
| 5 to 17 Years | 0 (0.0%) | 0 (0.0%) |
| 18 to 34 Years | 0 (0.0%) | 0 (0.0%) |
| 35 to 64 Years | 10 (12.5%) | 0 (0.0%) |
| 65 to 74 Years | 24 (54.5%) | 0 (0.0%) |
| 75 Years and over | 0 (0.0%) | 0 (0.0%) |
Disability Class: Vision Difficulty
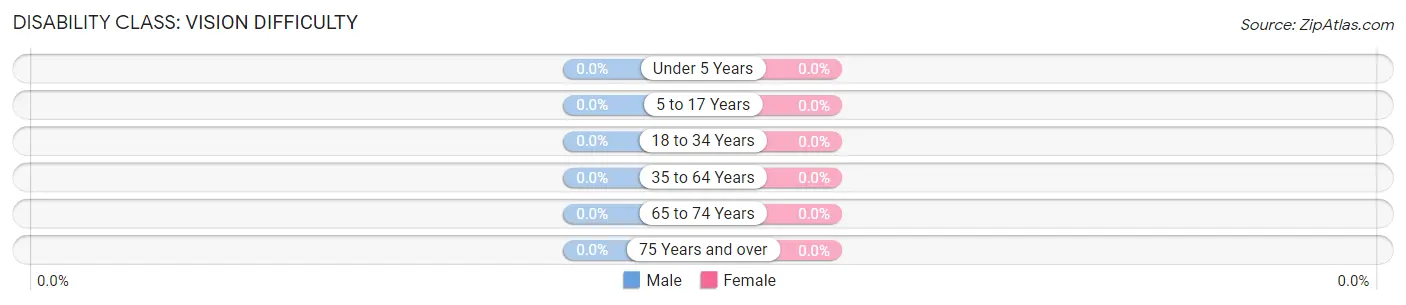
| Age Bracket | Male | Female |
| Under 5 Years | 0 (0.0%) | 0 (0.0%) |
| 5 to 17 Years | 0 (0.0%) | 0 (0.0%) |
| 18 to 34 Years | 0 (0.0%) | 0 (0.0%) |
| 35 to 64 Years | 0 (0.0%) | 0 (0.0%) |
| 65 to 74 Years | 0 (0.0%) | 0 (0.0%) |
| 75 Years and over | 0 (0.0%) | 0 (0.0%) |
Disability Class: Cognitive Difficulty
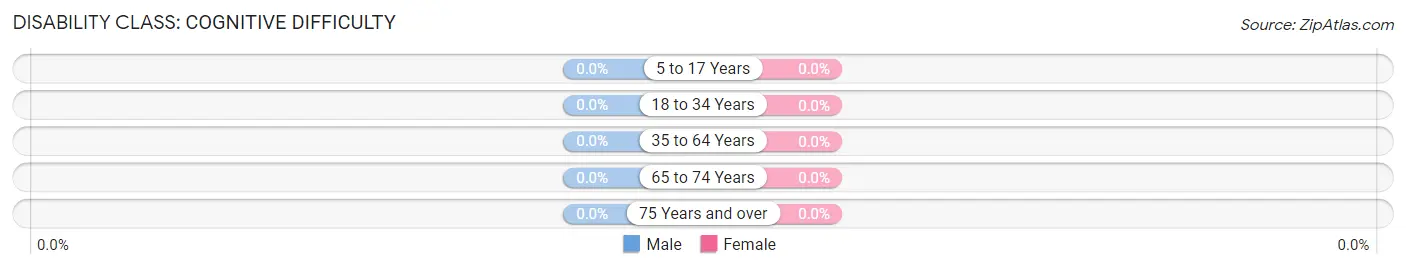
| Age Bracket | Male | Female |
| 5 to 17 Years | 0 (0.0%) | 0 (0.0%) |
| 18 to 34 Years | 0 (0.0%) | 0 (0.0%) |
| 35 to 64 Years | 0 (0.0%) | 0 (0.0%) |
| 65 to 74 Years | 0 (0.0%) | 0 (0.0%) |
| 75 Years and over | 0 (0.0%) | 0 (0.0%) |
Disability Class: Ambulatory Difficulty
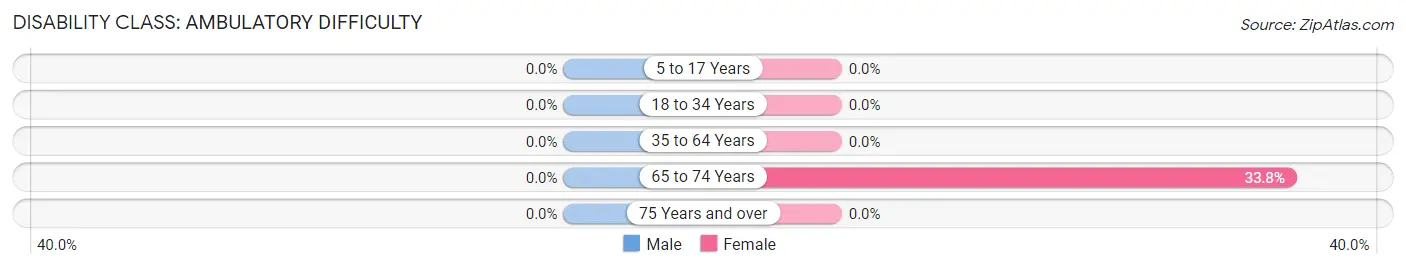
| Age Bracket | Male | Female |
| 5 to 17 Years | 0 (0.0%) | 0 (0.0%) |
| 18 to 34 Years | 0 (0.0%) | 0 (0.0%) |
| 35 to 64 Years | 0 (0.0%) | 0 (0.0%) |
| 65 to 74 Years | 0 (0.0%) | 25 (33.8%) |
| 75 Years and over | 0 (0.0%) | 0 (0.0%) |
Disability Class: Self-Care Difficulty
| Age Bracket | Male | Female |
| 5 to 17 Years | 0 (0.0%) | 0 (0.0%) |
| 18 to 34 Years | 0 (0.0%) | 0 (0.0%) |
| 35 to 64 Years | 0 (0.0%) | 0 (0.0%) |
| 65 to 74 Years | 0 (0.0%) | 0 (0.0%) |
| 75 Years and over | 0 (0.0%) | 0 (0.0%) |
Technology Access in Dennard
Computing Device Access in Dennard
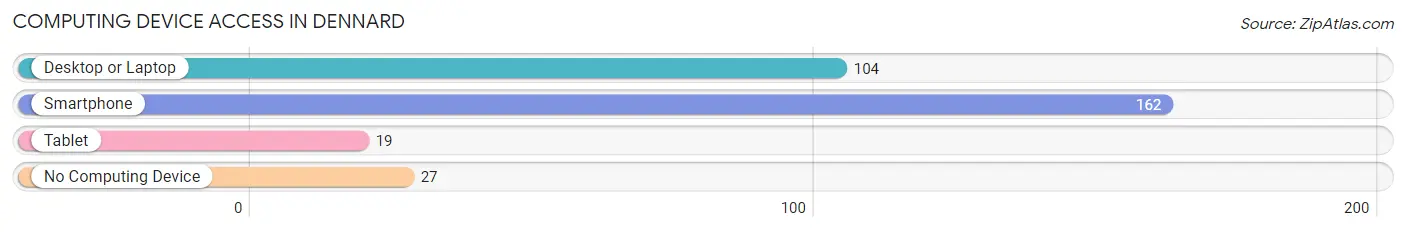
| Device Type | # Households | % Households |
| Desktop or Laptop | 104 | 53.3% |
| Smartphone | 162 | 83.1% |
| Tablet | 19 | 9.7% |
| No Computing Device | 27 | 13.9% |
| Total | 195 | 100.0% |
Internet Access in Dennard
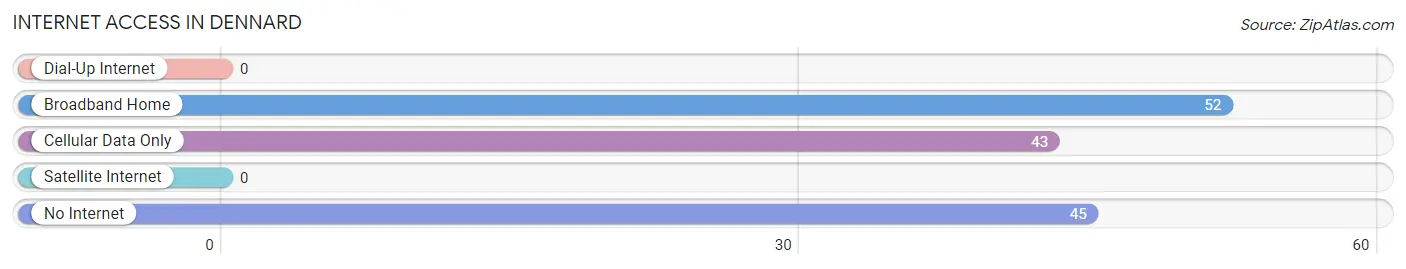
| Internet Type | # Households | % Households |
| Dial-Up Internet | 0 | 0.0% |
| Broadband Home | 52 | 26.7% |
| Cellular Data Only | 43 | 22.1% |
| Satellite Internet | 0 | 0.0% |
| No Internet | 45 | 23.1% |
| Total | 195 | 100.0% |
Dennard Summary
Dennard is an unincorporated community located in Van Buren County, Arkansas. It is situated in the Ozark Mountains, approximately 10 miles south of Clinton and 25 miles north of Russellville. The community is named after the Dennard family, who were among the first settlers in the area.
History
The first settlers in the area were the Dennard family, who arrived in the late 1800s. The family established a homestead and began farming the land. The community was officially established in the early 1900s, when a post office was opened. The post office was named after the Dennard family, and the community was soon known as Dennard.
In the early 1900s, the community was a thriving agricultural center. The main crops grown in the area were cotton, corn, and hay. The community also had a sawmill, a gristmill, and a general store.
In the mid-1900s, the community began to decline. The sawmill and gristmill closed, and the general store was sold. The population of the community began to decline as well, as many of the residents moved away in search of better economic opportunities.
Geography
Dennard is located in the Ozark Mountains of northwestern Arkansas. The community is situated in Van Buren County, approximately 10 miles south of Clinton and 25 miles north of Russellville. The terrain in the area is hilly and heavily forested. The climate is humid subtropical, with hot summers and mild winters.
Economy
The economy of Dennard is largely based on agriculture. The main crops grown in the area are cotton, corn, and hay. The community also has a few small businesses, including a gas station and a convenience store.
Demographics
As of the 2010 census, the population of Dennard was 545. The racial makeup of the community was 97.3% White, 0.2% African American, 0.4% Native American, 0.2% Asian, and 1.9% from other races. The median household income was $30,000, and the median family income was $35,000. The per capita income was $14,000.
Common Questions
What is Per Capita Income in Dennard?
Per Capita income in Dennard is $26,687.
What is the Median Family Income in Dennard?
Median Family Income in Dennard is $98,455.
What is Inequality or Gini Index in Dennard?
Inequality or Gini Index in Dennard is 0.37.
What is the Total Population of Dennard?
Total Population of Dennard is 415.
What is the Total Male Population of Dennard?
Total Male Population of Dennard is 240.
What is the Total Female Population of Dennard?
Total Female Population of Dennard is 175.
What is the Ratio of Males per 100 Females in Dennard?
There are 137.14 Males per 100 Females in Dennard.
What is the Ratio of Females per 100 Males in Dennard?
There are 72.92 Females per 100 Males in Dennard.
What is the Median Population Age in Dennard?
Median Population Age in Dennard is 43.1 Years.
What is the Average Family Size in Dennard
Average Family Size in Dennard is 2.6 People.
What is the Average Household Size in Dennard
Average Household Size in Dennard is 2.1 People.
How Large is the Labor Force in Dennard?
There are 187 People in the Labor Forcein in Dennard.
What is the Percentage of People in the Labor Force in Dennard?
49.2% of People are in the Labor Force in Dennard.