Southside, AR Map & Demographics
Southside Map
Southside Overview
$19,274
PER CAPITA INCOME
$55,106
AVG FAMILY INCOME
$49,063
AVG HOUSEHOLD INCOME
17.1%
WAGE / INCOME GAP [ % ]
82.9¢/ $1
WAGE / INCOME GAP [ $ ]
0.38
INEQUALITY / GINI INDEX
4,247
TOTAL POPULATION
1,931
MALE POPULATION
2,316
FEMALE POPULATION
83.38
MALES / 100 FEMALES
119.94
FEMALES / 100 MALES
34.4
MEDIAN AGE
3.4
AVG FAMILY SIZE
3.0
AVG HOUSEHOLD SIZE
1,931
LABOR FORCE [ PEOPLE ]
62.5%
PERCENT IN LABOR FORCE
6.6%
UNEMPLOYMENT RATE
Southside Area Codes
Income in Southside
Income Overview in Southside
Per Capita Income in Southside is $19,274, while median incomes of families and households are $55,106 and $49,063 respectively.
| Characteristic | Number | Measure |
| Per Capita Income | 4,247 | $19,274 |
| Median Family Income | 1,030 | $55,106 |
| Mean Family Income | 1,030 | $63,462 |
| Median Household Income | 1,379 | $49,063 |
| Mean Household Income | 1,379 | $56,088 |
| Income Deficit | 1,030 | $0 |
| Wage / Income Gap (%) | 4,247 | 17.12% |
| Wage / Income Gap ($) | 4,247 | 82.88¢ per $1 |
| Gini / Inequality Index | 4,247 | 0.38 |
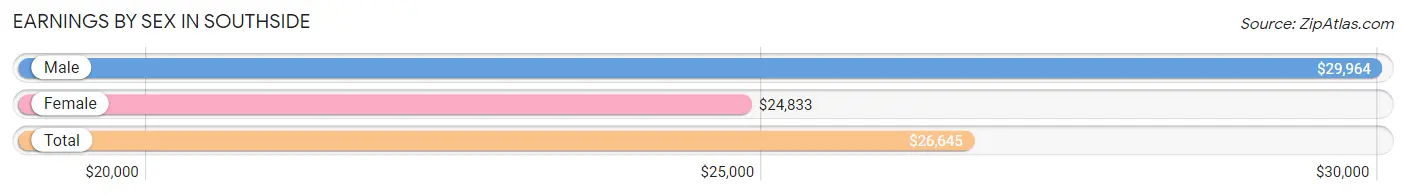
Earnings by Sex in Southside
Average Earnings in Southside are $26,645, $29,964 for men and $24,833 for women, a difference of 17.1%.
| Sex | Number | Average Earnings |
| Male | 998 (52.4%) | $29,964 |
| Female | 906 (47.6%) | $24,833 |
| Total | 1,904 (100.0%) | $26,645 |
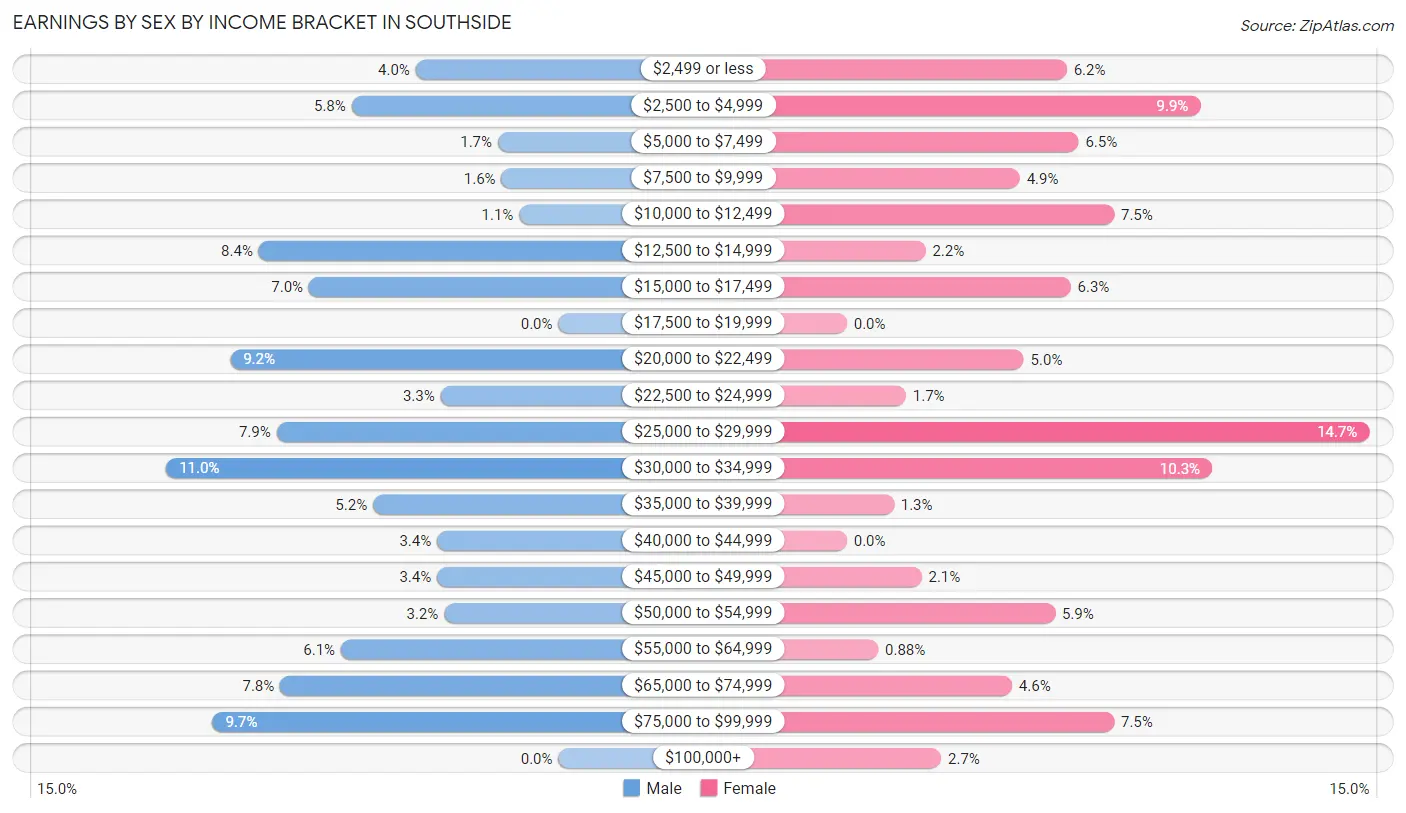
Earnings by Sex by Income Bracket in Southside
The most common earnings brackets in Southside are $30,000 to $34,999 for men (110 | 11.0%) and $25,000 to $29,999 for women (133 | 14.7%).
| Income | Male | Female |
| $2,499 or less | 40 (4.0%) | 56 (6.2%) |
| $2,500 to $4,999 | 58 (5.8%) | 90 (9.9%) |
| $5,000 to $7,499 | 17 (1.7%) | 59 (6.5%) |
| $7,500 to $9,999 | 16 (1.6%) | 44 (4.9%) |
| $10,000 to $12,499 | 11 (1.1%) | 68 (7.5%) |
| $12,500 to $14,999 | 84 (8.4%) | 20 (2.2%) |
| $15,000 to $17,499 | 70 (7.0%) | 57 (6.3%) |
| $17,500 to $19,999 | 0 (0.0%) | 0 (0.0%) |
| $20,000 to $22,499 | 92 (9.2%) | 45 (5.0%) |
| $22,500 to $24,999 | 33 (3.3%) | 15 (1.7%) |
| $25,000 to $29,999 | 79 (7.9%) | 133 (14.7%) |
| $30,000 to $34,999 | 110 (11.0%) | 93 (10.3%) |
| $35,000 to $39,999 | 52 (5.2%) | 12 (1.3%) |
| $40,000 to $44,999 | 34 (3.4%) | 0 (0.0%) |
| $45,000 to $49,999 | 34 (3.4%) | 19 (2.1%) |
| $50,000 to $54,999 | 32 (3.2%) | 53 (5.9%) |
| $55,000 to $64,999 | 61 (6.1%) | 8 (0.9%) |
| $65,000 to $74,999 | 78 (7.8%) | 42 (4.6%) |
| $75,000 to $99,999 | 97 (9.7%) | 68 (7.5%) |
| $100,000+ | 0 (0.0%) | 24 (2.6%) |
| Total | 998 (100.0%) | 906 (100.0%) |
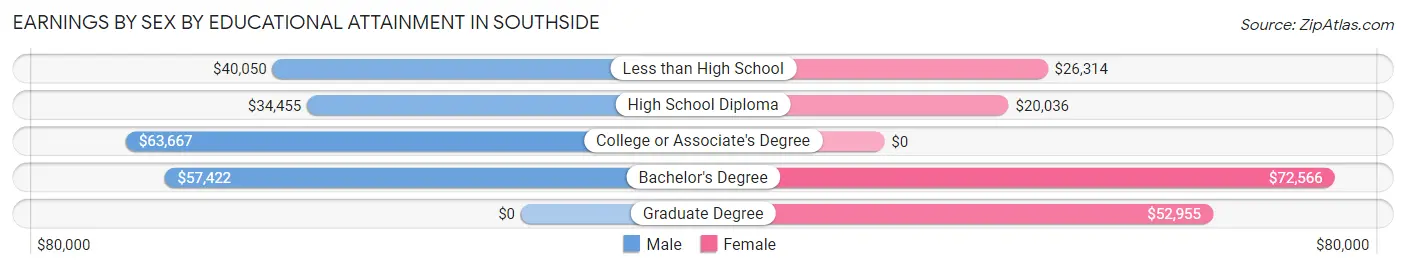
Earnings by Sex by Educational Attainment in Southside
Average earnings in Southside are $38,875 for men and $26,412 for women, a difference of 32.1%. Men with an educational attainment of college or associate's degree enjoy the highest average annual earnings of $63,667, while those with high school diploma education earn the least with $34,455. Women with an educational attainment of bachelor's degree earn the most with the average annual earnings of $72,566, while those with high school diploma education have the smallest earnings of $20,036.
| Educational Attainment | Male Income | Female Income |
| Less than High School | $40,050 | $26,314 |
| High School Diploma | $34,455 | $20,036 |
| College or Associate's Degree | $63,667 | $0 |
| Bachelor's Degree | $57,422 | $72,566 |
| Graduate Degree | - | - |
| Total | $38,875 | $26,412 |
Family Income in Southside
Family Income Brackets in Southside
According to the Southside family income data, there are 234 families falling into the $50,000 to $74,999 income range, which is the most common income bracket and makes up 22.7% of all families.
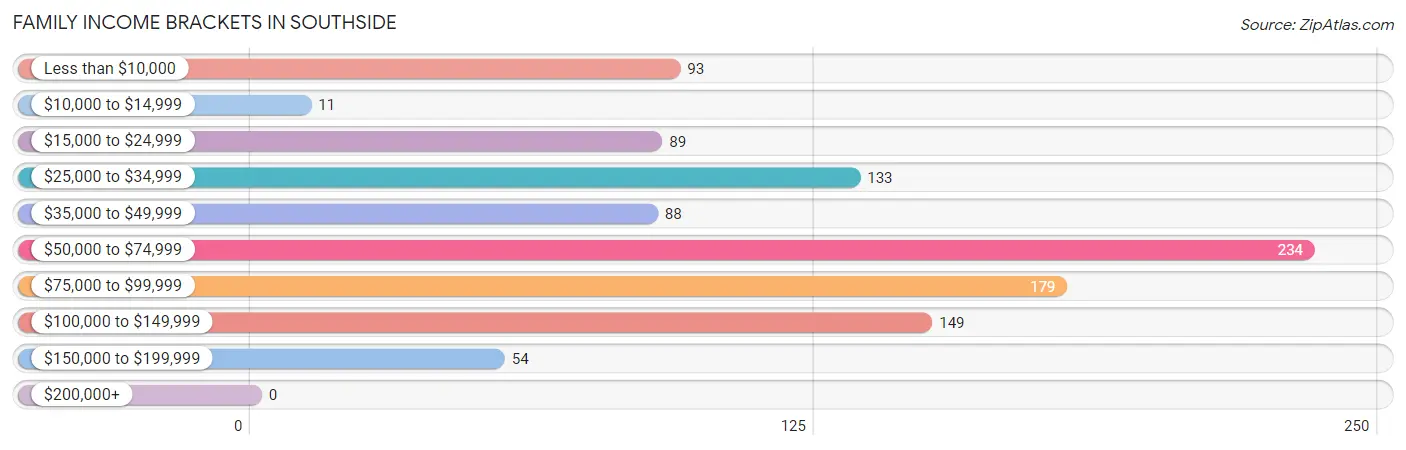
| Income Bracket | # Families | % Families |
| Less than $10,000 | 93 | 9.0% |
| $10,000 to $14,999 | 11 | 1.1% |
| $15,000 to $24,999 | 89 | 8.6% |
| $25,000 to $34,999 | 133 | 12.9% |
| $35,000 to $49,999 | 88 | 8.5% |
| $50,000 to $74,999 | 234 | 22.7% |
| $75,000 to $99,999 | 179 | 17.4% |
| $100,000 to $149,999 | 149 | 14.5% |
| $150,000 to $199,999 | 54 | 5.2% |
| $200,000+ | 0 | 0.0% |
Family Income by Famaliy Size in Southside
4-person families (175 | 17.0%) account for the highest median family income in Southside with $82,179 per family, while 2-person families (442 | 42.9%) have the highest median income of $22,868 per family member.
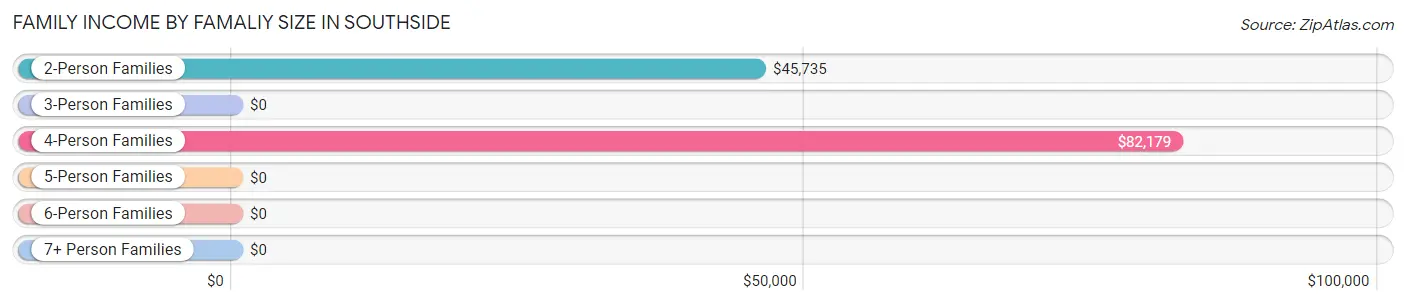
| Income Bracket | # Families | Median Income |
| 2-Person Families | 442 (42.9%) | $45,735 |
| 3-Person Families | 207 (20.1%) | $0 |
| 4-Person Families | 175 (17.0%) | $82,179 |
| 5-Person Families | 116 (11.3%) | $0 |
| 6-Person Families | 90 (8.7%) | $0 |
| 7+ Person Families | 0 (0.0%) | $0 |
| Total | 1,030 (100.0%) | $55,106 |
Family Income by Number of Earners in Southside
The median family income in Southside is $55,106, with families comprising 3+ earners (158) having the highest median family income of $100,950, while families with no earners (237) have the lowest median family income of $45,662, accounting for 15.3% and 23.0% of families, respectively.
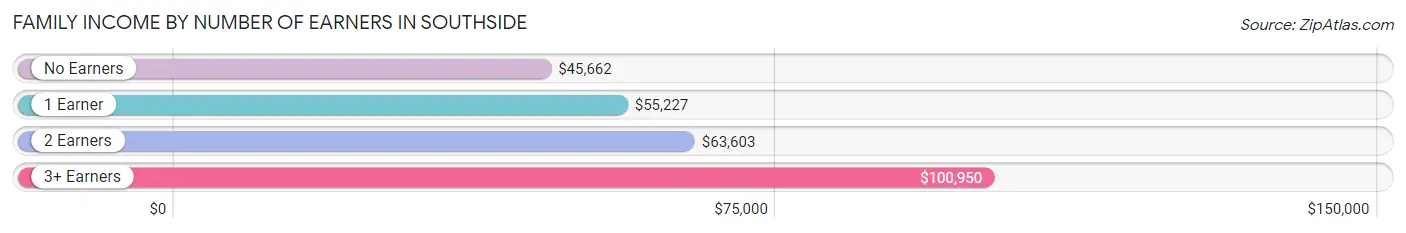
| Number of Earners | # Families | Median Income |
| No Earners | 237 (23.0%) | $45,662 |
| 1 Earner | 304 (29.5%) | $55,227 |
| 2 Earners | 331 (32.1%) | $63,603 |
| 3+ Earners | 158 (15.3%) | $100,950 |
| Total | 1,030 (100.0%) | $55,106 |
Household Income in Southside
Household Income Brackets in Southside
With 296 households falling in the category, the $25,000 to $34,999 income range is the most frequent in Southside, accounting for 21.5% of all households.
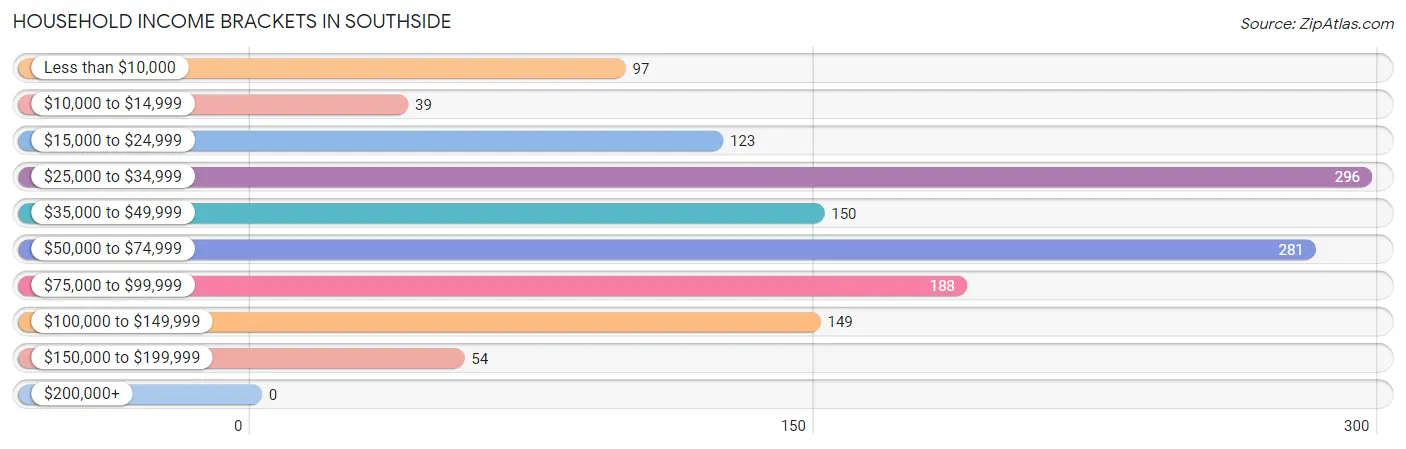
| Income Bracket | # Households | % Households |
| Less than $10,000 | 97 | 7.0% |
| $10,000 to $14,999 | 39 | 2.8% |
| $15,000 to $24,999 | 123 | 8.9% |
| $25,000 to $34,999 | 296 | 21.5% |
| $35,000 to $49,999 | 150 | 10.9% |
| $50,000 to $74,999 | 281 | 20.4% |
| $75,000 to $99,999 | 188 | 13.6% |
| $100,000 to $149,999 | 149 | 10.8% |
| $150,000 to $199,999 | 54 | 3.9% |
| $200,000+ | 0 | 0.0% |
Household Income by Householder Age in Southside
The median household income in Southside is $49,063, with the highest median household income of $57,031 found in the 25 to 44 years age bracket for the primary householder. A total of 444 households (32.2%) fall into this category. Meanwhile, the 15 to 24 years age bracket for the primary householder has the lowest median household income of $0, with 84 households (6.1%) in this group.
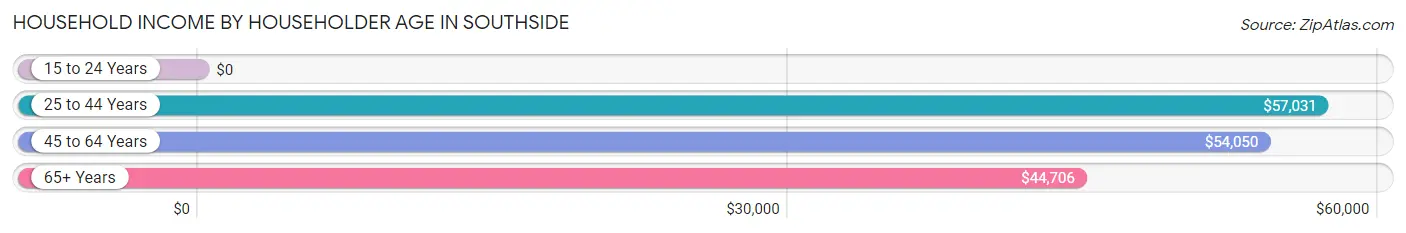
| Income Bracket | # Households | Median Income |
| 15 to 24 Years | 84 (6.1%) | $0 |
| 25 to 44 Years | 444 (32.2%) | $57,031 |
| 45 to 64 Years | 501 (36.3%) | $54,050 |
| 65+ Years | 350 (25.4%) | $44,706 |
| Total | 1,379 (100.0%) | $49,063 |
Poverty in Southside
Income Below Poverty by Sex and Age in Southside
With 17.6% poverty level for males and 21.3% for females among the residents of Southside, 25 to 34 year old males and 75 year old and over females are the most vulnerable to poverty, with 86 males (51.5%) and 41 females (39.8%) in their respective age groups living below the poverty level.
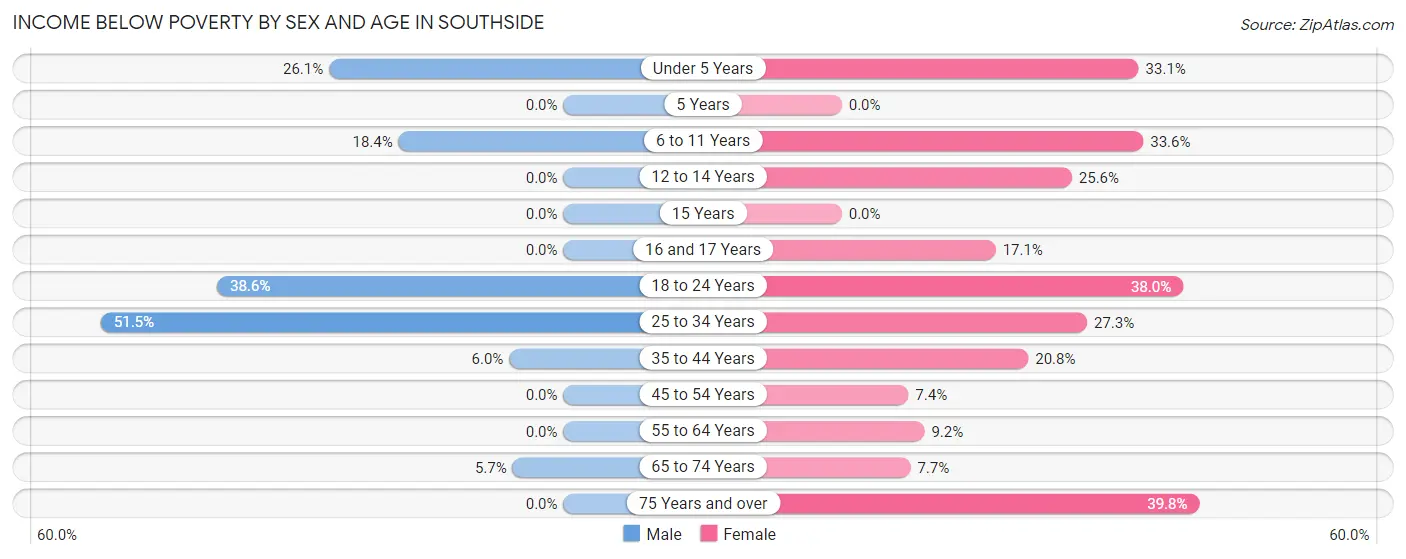
| Age Bracket | Male | Female |
| Under 5 Years | 42 (26.1%) | 82 (33.1%) |
| 5 Years | 0 (0.0%) | 0 (0.0%) |
| 6 to 11 Years | 20 (18.3%) | 89 (33.6%) |
| 12 to 14 Years | 0 (0.0%) | 41 (25.6%) |
| 15 Years | 0 (0.0%) | 0 (0.0%) |
| 16 and 17 Years | 0 (0.0%) | 18 (17.1%) |
| 18 to 24 Years | 155 (38.6%) | 38 (38.0%) |
| 25 to 34 Years | 86 (51.5%) | 65 (27.3%) |
| 35 to 44 Years | 17 (6.0%) | 43 (20.8%) |
| 45 to 54 Years | 0 (0.0%) | 19 (7.4%) |
| 55 to 64 Years | 0 (0.0%) | 28 (9.2%) |
| 65 to 74 Years | 15 (5.7%) | 14 (7.6%) |
| 75 Years and over | 0 (0.0%) | 41 (39.8%) |
| Total | 335 (17.6%) | 478 (21.3%) |
Income Above Poverty by Sex and Age in Southside
According to the poverty statistics in Southside, males aged 5 years and females aged 15 years are the age groups that are most secure financially, with 100.0% of males and 100.0% of females in these age groups living above the poverty line.
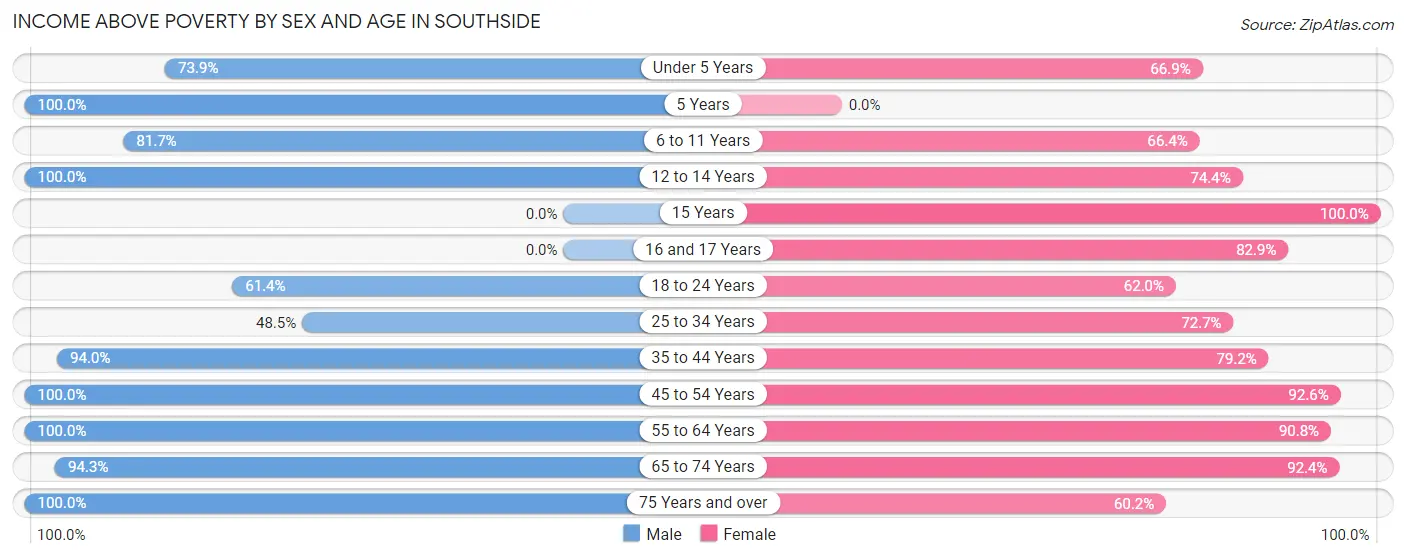
| Age Bracket | Male | Female |
| Under 5 Years | 119 (73.9%) | 166 (66.9%) |
| 5 Years | 57 (100.0%) | 0 (0.0%) |
| 6 to 11 Years | 89 (81.7%) | 176 (66.4%) |
| 12 to 14 Years | 81 (100.0%) | 119 (74.4%) |
| 15 Years | 0 (0.0%) | 77 (100.0%) |
| 16 and 17 Years | 0 (0.0%) | 87 (82.9%) |
| 18 to 24 Years | 247 (61.4%) | 62 (62.0%) |
| 25 to 34 Years | 81 (48.5%) | 173 (72.7%) |
| 35 to 44 Years | 265 (94.0%) | 164 (79.2%) |
| 45 to 54 Years | 200 (100.0%) | 237 (92.6%) |
| 55 to 64 Years | 143 (100.0%) | 276 (90.8%) |
| 65 to 74 Years | 250 (94.3%) | 169 (92.3%) |
| 75 Years and over | 34 (100.0%) | 62 (60.2%) |
| Total | 1,566 (82.4%) | 1,768 (78.7%) |
Income Below Poverty Among Married-Couple Families in Southside
The poverty statistics for married-couple families in Southside show that 10.7% or 75 of the total 702 families live below the poverty line. Families with 3 or 4 children have the highest poverty rate of 47.8%, comprising of 32 families. On the other hand, families with 1 or 2 children have the lowest poverty rate of 3.3%, which includes 11 families.
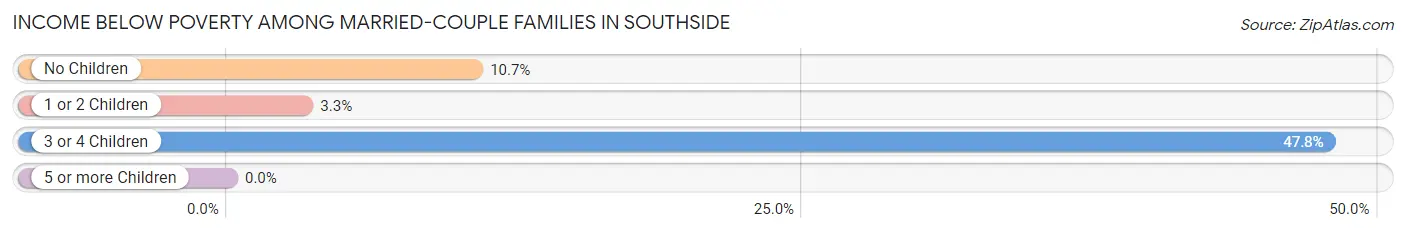
| Children | Above Poverty | Below Poverty |
| No Children | 268 (89.3%) | 32 (10.7%) |
| 1 or 2 Children | 324 (96.7%) | 11 (3.3%) |
| 3 or 4 Children | 35 (52.2%) | 32 (47.8%) |
| 5 or more Children | 0 (0.0%) | 0 (0.0%) |
| Total | 627 (89.3%) | 75 (10.7%) |
Income Below Poverty Among Single-Parent Households in Southside
According to the poverty data in Southside, 23.3% or 40 single-father households and 42.9% or 67 single-mother households are living below the poverty line. Among single-father households, those with 1 or 2 children have the highest poverty rate, with 12 households (100.0%) experiencing poverty. Likewise, among single-mother households, those with 3 or 4 children have the highest poverty rate, with 21 households (58.3%) falling below the poverty line.
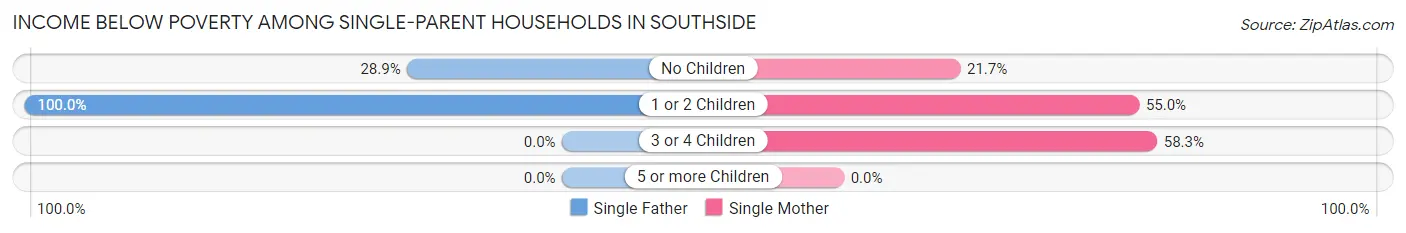
| Children | Single Father | Single Mother |
| No Children | 28 (28.9%) | 13 (21.7%) |
| 1 or 2 Children | 12 (100.0%) | 33 (55.0%) |
| 3 or 4 Children | 0 (0.0%) | 21 (58.3%) |
| 5 or more Children | 0 (0.0%) | 0 (0.0%) |
| Total | 40 (23.3%) | 67 (42.9%) |
Income Below Poverty Among Married-Couple vs Single-Parent Households in Southside
The poverty data for Southside shows that 75 of the married-couple family households (10.7%) and 107 of the single-parent households (32.6%) are living below the poverty level. Within the married-couple family households, those with 3 or 4 children have the highest poverty rate, with 32 households (47.8%) falling below the poverty line. Among the single-parent households, those with 1 or 2 children have the highest poverty rate, with 45 household (62.5%) living below poverty.
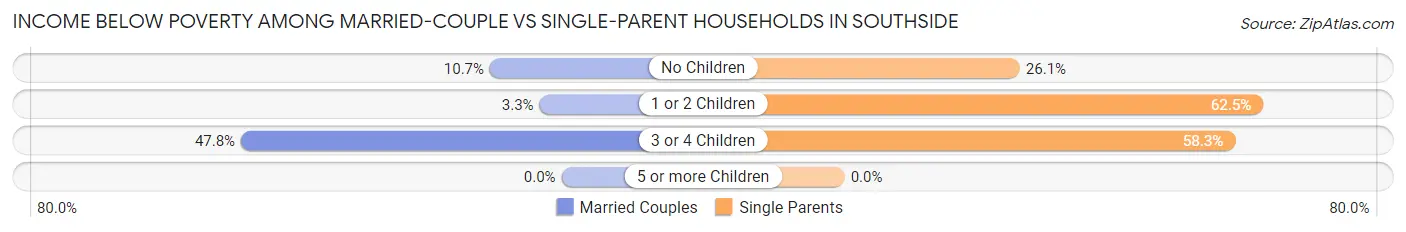
| Children | Married-Couple Families | Single-Parent Households |
| No Children | 32 (10.7%) | 41 (26.1%) |
| 1 or 2 Children | 11 (3.3%) | 45 (62.5%) |
| 3 or 4 Children | 32 (47.8%) | 21 (58.3%) |
| 5 or more Children | 0 (0.0%) | 0 (0.0%) |
| Total | 75 (10.7%) | 107 (32.6%) |
Race in Southside
The most populous races in Southside are White / Caucasian (3,404 | 80.1%), Two or more Races (530 | 12.5%), and Hispanic or Latino (241 | 5.7%).
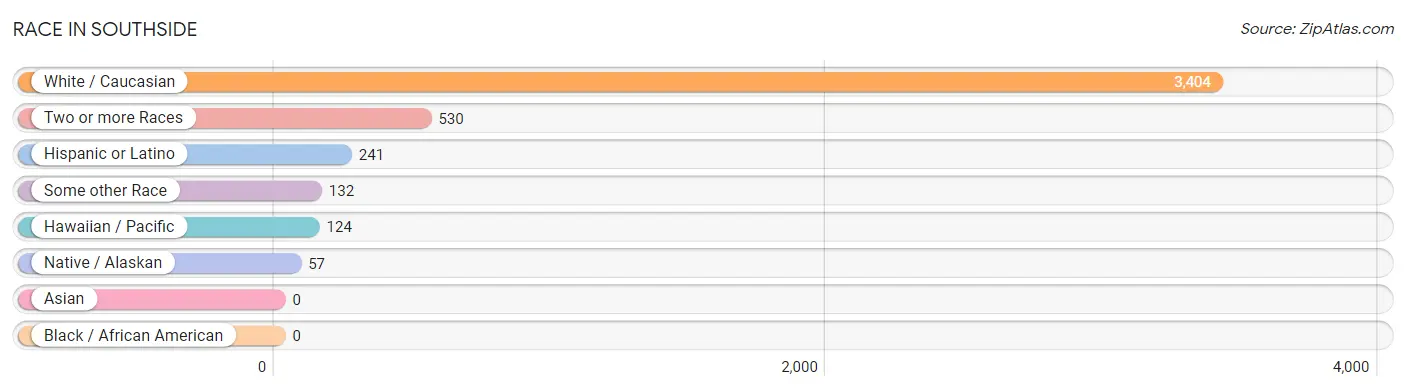
| Race | # Population | % Population |
| Asian | 0 | 0.0% |
| Black / African American | 0 | 0.0% |
| Hawaiian / Pacific | 124 | 2.9% |
| Hispanic or Latino | 241 | 5.7% |
| Native / Alaskan | 57 | 1.3% |
| White / Caucasian | 3,404 | 80.1% |
| Two or more Races | 530 | 12.5% |
| Some other Race | 132 | 3.1% |
| Total | 4,247 | 100.0% |
Ancestry in Southside
The most populous ancestries reported in Southside are English (871 | 20.5%), American (721 | 17.0%), German (294 | 6.9%), Irish (285 | 6.7%), and Mexican (176 | 4.1%), together accounting for 55.3% of all Southside residents.
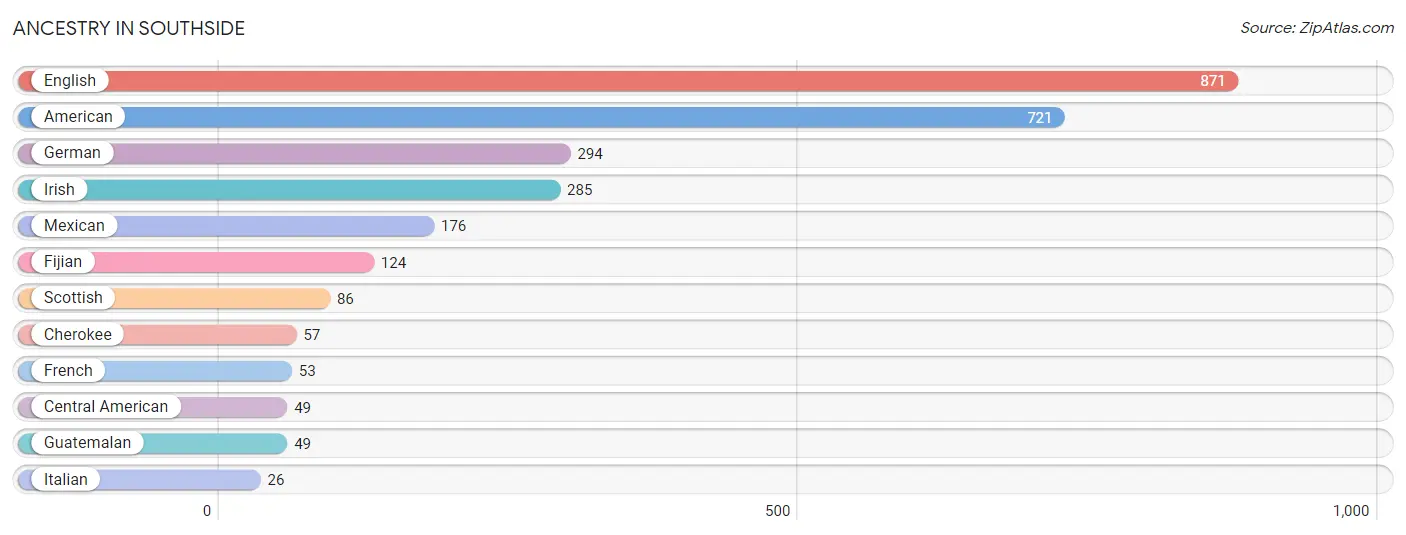
| Ancestry | # Population | % Population |
| American | 721 | 17.0% |
| Central American | 49 | 1.1% |
| Cherokee | 57 | 1.3% |
| English | 871 | 20.5% |
| Fijian | 124 | 2.9% |
| French | 53 | 1.3% |
| German | 294 | 6.9% |
| Guatemalan | 49 | 1.1% |
| Irish | 285 | 6.7% |
| Italian | 26 | 0.6% |
| Mexican | 176 | 4.1% |
| Scottish | 86 | 2.0% | View All 12 Rows |
Immigrants in Southside
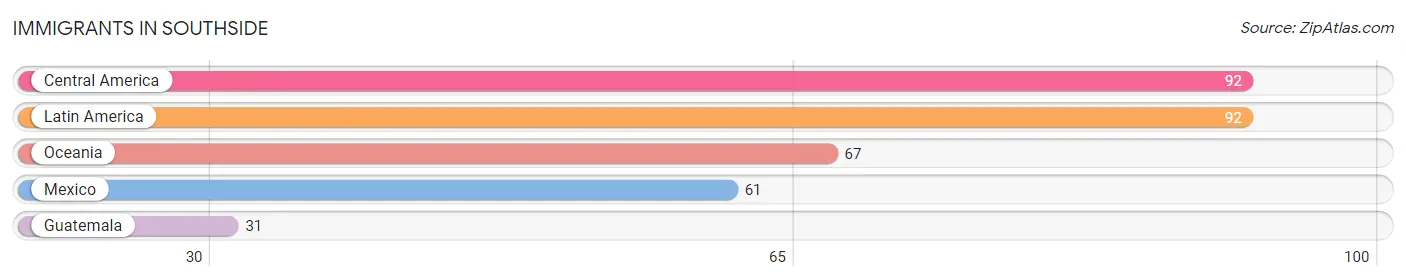
The most numerous immigrant groups reported in Southside came from Central America (92 | 2.2%), Latin America (92 | 2.2%), Oceania (67 | 1.6%), Mexico (61 | 1.4%), and Guatemala (31 | 0.7%), together accounting for 8.1% of all Southside residents.
| Immigration Origin | # Population | % Population |
| Central America | 92 | 2.2% |
| Guatemala | 31 | 0.7% |
| Latin America | 92 | 2.2% |
| Mexico | 61 | 1.4% |
| Oceania | 67 | 1.6% | View All 5 Rows |
Sex and Age in Southside
Sex and Age in Southside
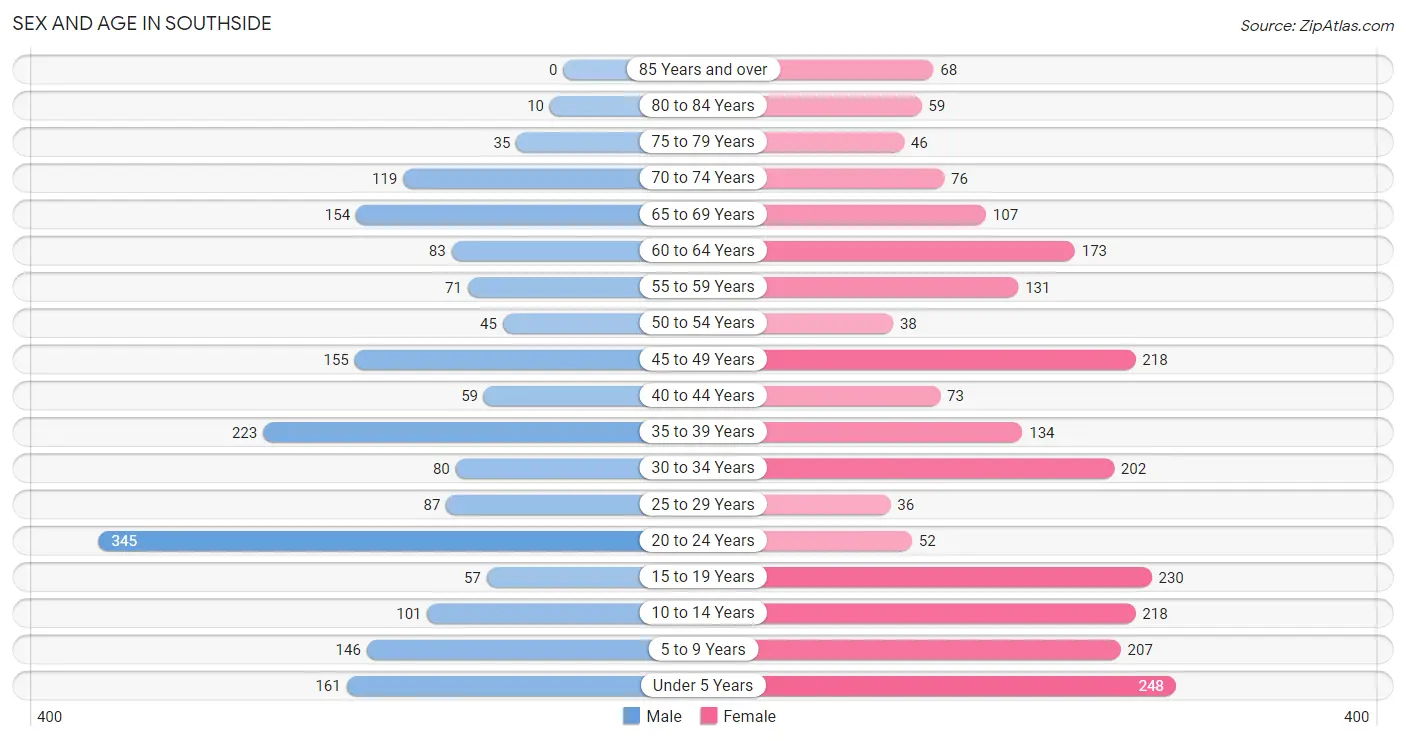
The most populous age groups in Southside are 20 to 24 Years (345 | 17.9%) for men and Under 5 Years (248 | 10.7%) for women.
| Age Bracket | Male | Female |
| Under 5 Years | 161 (8.3%) | 248 (10.7%) |
| 5 to 9 Years | 146 (7.6%) | 207 (8.9%) |
| 10 to 14 Years | 101 (5.2%) | 218 (9.4%) |
| 15 to 19 Years | 57 (2.9%) | 230 (9.9%) |
| 20 to 24 Years | 345 (17.9%) | 52 (2.2%) |
| 25 to 29 Years | 87 (4.5%) | 36 (1.5%) |
| 30 to 34 Years | 80 (4.1%) | 202 (8.7%) |
| 35 to 39 Years | 223 (11.6%) | 134 (5.8%) |
| 40 to 44 Years | 59 (3.1%) | 73 (3.2%) |
| 45 to 49 Years | 155 (8.0%) | 218 (9.4%) |
| 50 to 54 Years | 45 (2.3%) | 38 (1.6%) |
| 55 to 59 Years | 71 (3.7%) | 131 (5.7%) |
| 60 to 64 Years | 83 (4.3%) | 173 (7.5%) |
| 65 to 69 Years | 154 (8.0%) | 107 (4.6%) |
| 70 to 74 Years | 119 (6.2%) | 76 (3.3%) |
| 75 to 79 Years | 35 (1.8%) | 46 (2.0%) |
| 80 to 84 Years | 10 (0.5%) | 59 (2.5%) |
| 85 Years and over | 0 (0.0%) | 68 (2.9%) |
| Total | 1,931 (100.0%) | 2,316 (100.0%) |
Families and Households in Southside
Median Family Size in Southside
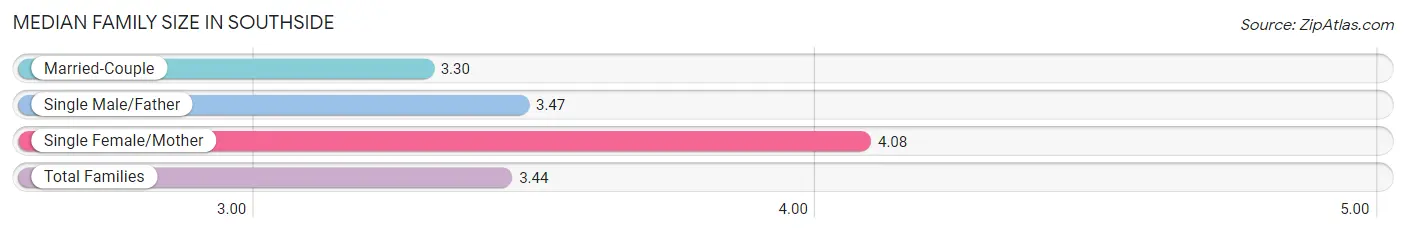
The median family size in Southside is 3.44 persons per family, with single female/mother families (156 | 15.1%) accounting for the largest median family size of 4.08 persons per family. On the other hand, married-couple families (702 | 68.2%) represent the smallest median family size with 3.30 persons per family.
| Family Type | # Families | Family Size |
| Married-Couple | 702 (68.2%) | 3.30 |
| Single Male/Father | 172 (16.7%) | 3.47 |
| Single Female/Mother | 156 (15.1%) | 4.08 |
| Total Families | 1,030 (100.0%) | 3.44 |
Median Household Size in Southside
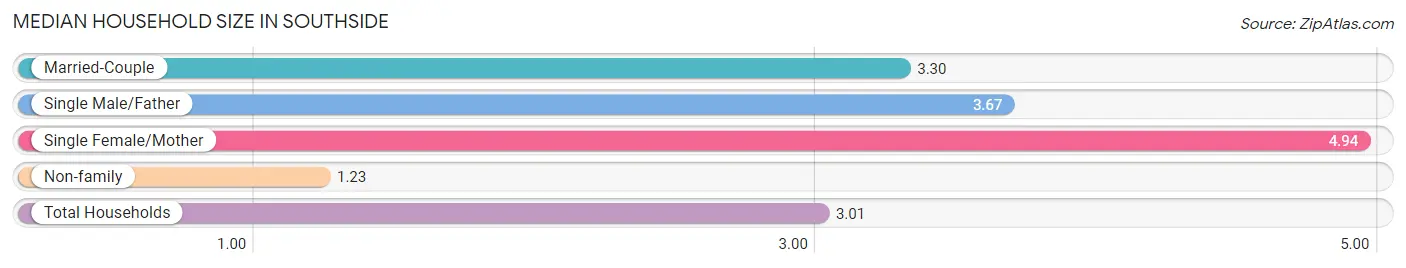
The median household size in Southside is 3.01 persons per household, with single female/mother households (156 | 11.3%) accounting for the largest median household size of 4.94 persons per household. non-family households (349 | 25.3%) represent the smallest median household size with 1.23 persons per household.
| Household Type | # Households | Household Size |
| Married-Couple | 702 (50.9%) | 3.30 |
| Single Male/Father | 172 (12.5%) | 3.67 |
| Single Female/Mother | 156 (11.3%) | 4.94 |
| Non-family | 349 (25.3%) | 1.23 |
| Total Households | 1,379 (100.0%) | 3.01 |
Household Size by Marriage Status in Southside
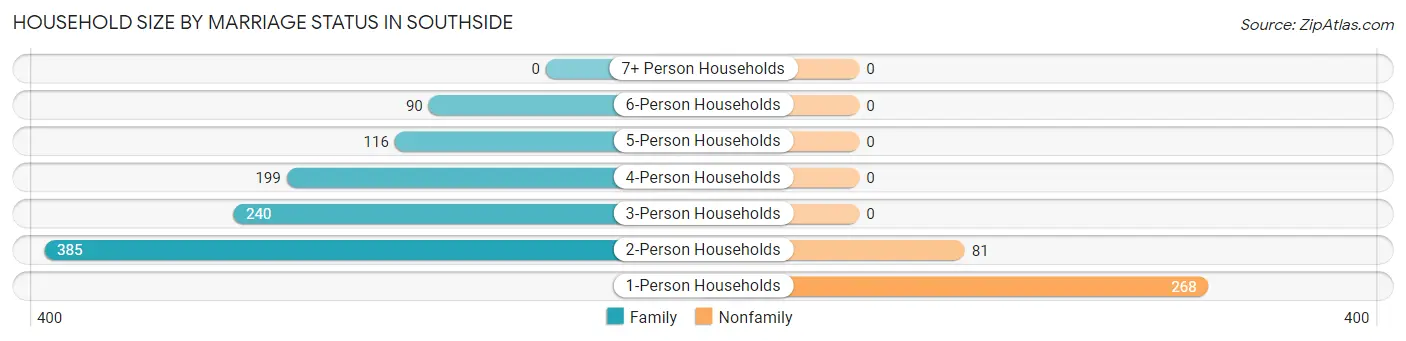
Out of a total of 1,379 households in Southside, 1,030 (74.7%) are family households, while 349 (25.3%) are nonfamily households. The most numerous type of family households are 2-person households, comprising 385, and the most common type of nonfamily households are 1-person households, comprising 268.
| Household Size | Family Households | Nonfamily Households |
| 1-Person Households | - | 268 (19.4%) |
| 2-Person Households | 385 (27.9%) | 81 (5.9%) |
| 3-Person Households | 240 (17.4%) | 0 (0.0%) |
| 4-Person Households | 199 (14.4%) | 0 (0.0%) |
| 5-Person Households | 116 (8.4%) | 0 (0.0%) |
| 6-Person Households | 90 (6.5%) | 0 (0.0%) |
| 7+ Person Households | 0 (0.0%) | 0 (0.0%) |
| Total | 1,030 (74.7%) | 349 (25.3%) |
Female Fertility in Southside
Fertility by Age in Southside
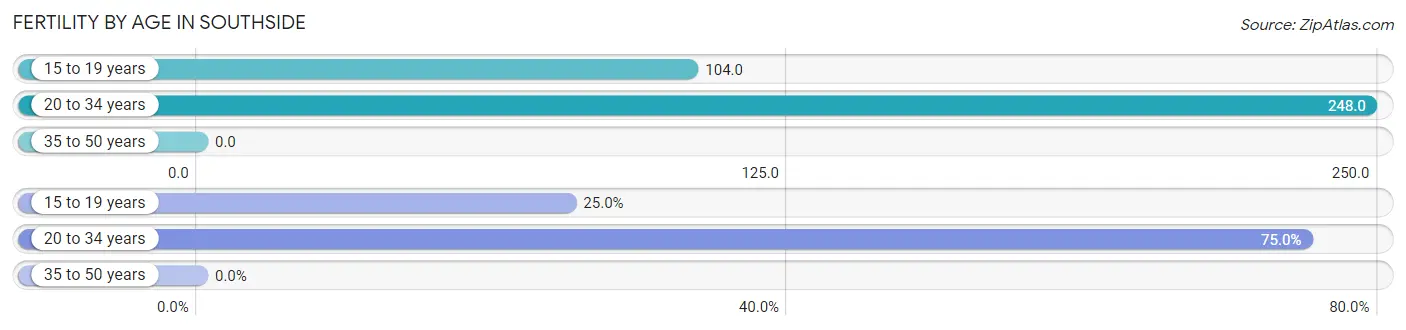
Average fertility rate in Southside is 99.0 births per 1,000 women. Women in the age bracket of 20 to 34 years have the highest fertility rate with 248.0 births per 1,000 women. Women in the age bracket of 20 to 34 years acount for 75.0% of all women with births.
| Age Bracket | Women with Births | Births / 1,000 Women |
| 15 to 19 years | 24 (25.0%) | 104.0 |
| 20 to 34 years | 72 (75.0%) | 248.0 |
| 35 to 50 years | 0 (0.0%) | 0.0 |
| Total | 96 (100.0%) | 99.0 |
Fertility by Age by Marriage Status in Southside
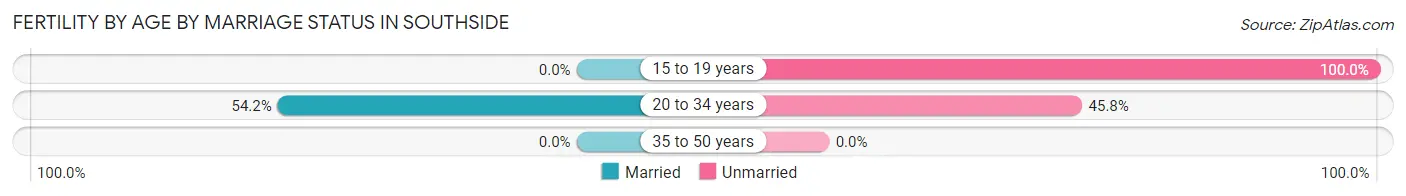
40.6% of women with births (96) in Southside are married. The highest percentage of unmarried women with births falls into 15 to 19 years age bracket with 100.0% of them unmarried at the time of birth, while the lowest percentage of unmarried women with births belong to 20 to 34 years age bracket with 45.8% of them unmarried.
| Age Bracket | Married | Unmarried |
| 15 to 19 years | 0 (0.0%) | 24 (100.0%) |
| 20 to 34 years | 39 (54.2%) | 33 (45.8%) |
| 35 to 50 years | 0 (0.0%) | 0 (0.0%) |
| Total | 39 (40.6%) | 57 (59.4%) |
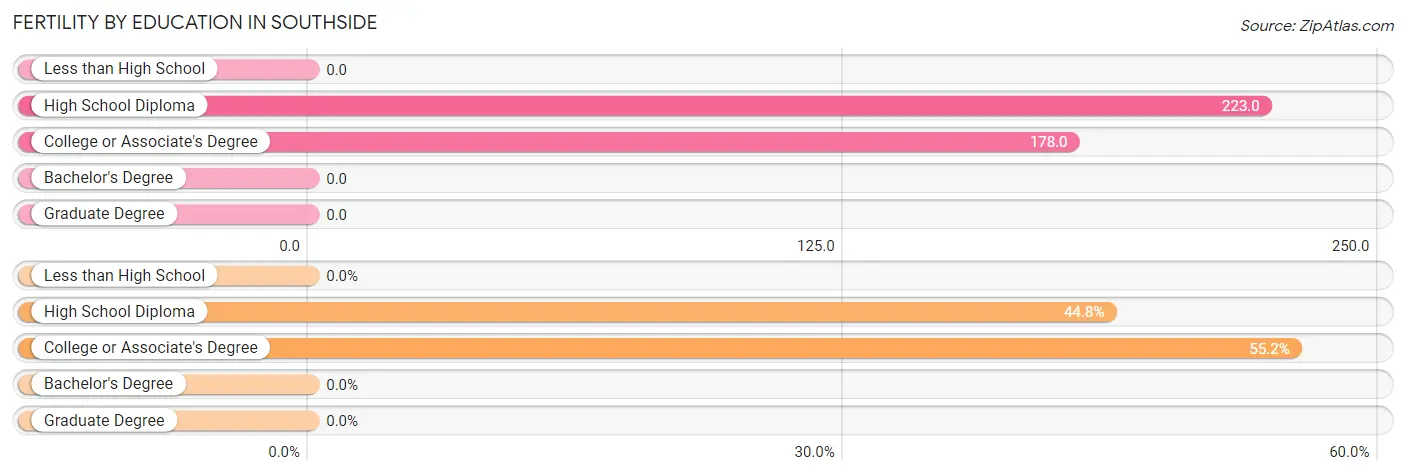
Fertility by Education in Southside
| Educational Attainment | Women with Births | Births / 1,000 Women |
| Less than High School | 0 (0.0%) | 0.0 |
| High School Diploma | 43 (44.8%) | 223.0 |
| College or Associate's Degree | 53 (55.2%) | 178.0 |
| Bachelor's Degree | 0 (0.0%) | 0.0 |
| Graduate Degree | 0 (0.0%) | 0.0 |
| Total | 96 (100.0%) | 99.0 |
Fertility by Education by Marriage Status in Southside
59.4% of women with births in Southside are unmarried. Women with the educational attainment of high school diploma are most likely to be married with 58.1% of them married at childbirth, while women with the educational attainment of college or associate's degree are least likely to be married with 73.6% of them unmarried at childbirth.
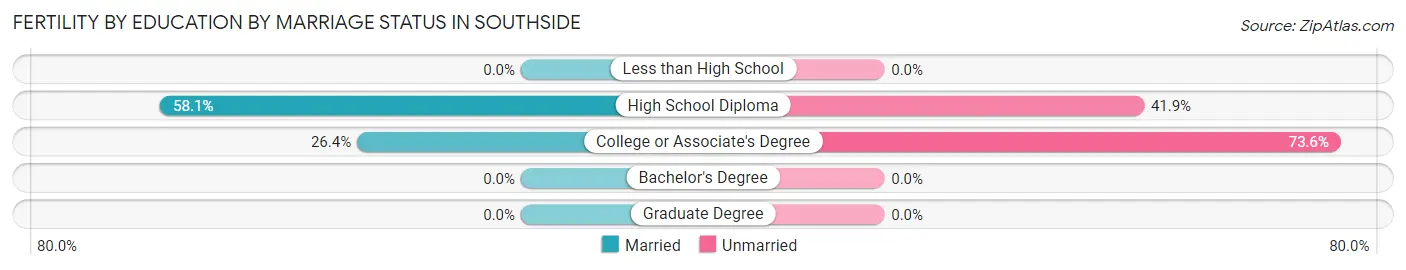
| Educational Attainment | Married | Unmarried |
| Less than High School | 0 (0.0%) | 0 (0.0%) |
| High School Diploma | 25 (58.1%) | 18 (41.9%) |
| College or Associate's Degree | 14 (26.4%) | 39 (73.6%) |
| Bachelor's Degree | 0 (0.0%) | 0 (0.0%) |
| Graduate Degree | 0 (0.0%) | 0 (0.0%) |
| Total | 39 (40.6%) | 57 (59.4%) |
Employment Characteristics in Southside
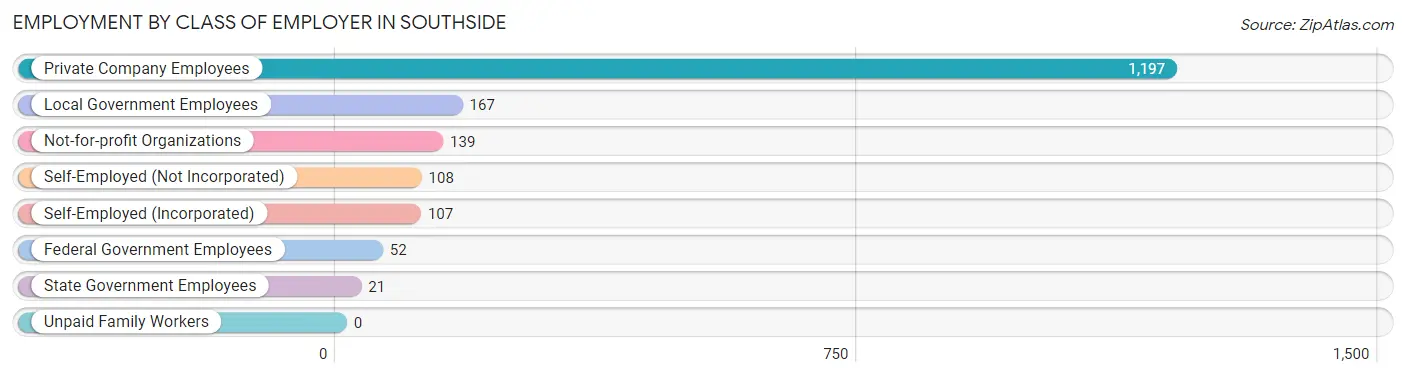
Employment by Class of Employer in Southside
Among the 1,791 employed individuals in Southside, private company employees (1,197 | 66.8%), local government employees (167 | 9.3%), and not-for-profit organizations (139 | 7.8%) make up the most common classes of employment.
| Employer Class | # Employees | % Employees |
| Private Company Employees | 1,197 | 66.8% |
| Self-Employed (Incorporated) | 107 | 6.0% |
| Self-Employed (Not Incorporated) | 108 | 6.0% |
| Not-for-profit Organizations | 139 | 7.8% |
| Local Government Employees | 167 | 9.3% |
| State Government Employees | 21 | 1.2% |
| Federal Government Employees | 52 | 2.9% |
| Unpaid Family Workers | 0 | 0.0% |
| Total | 1,791 | 100.0% |
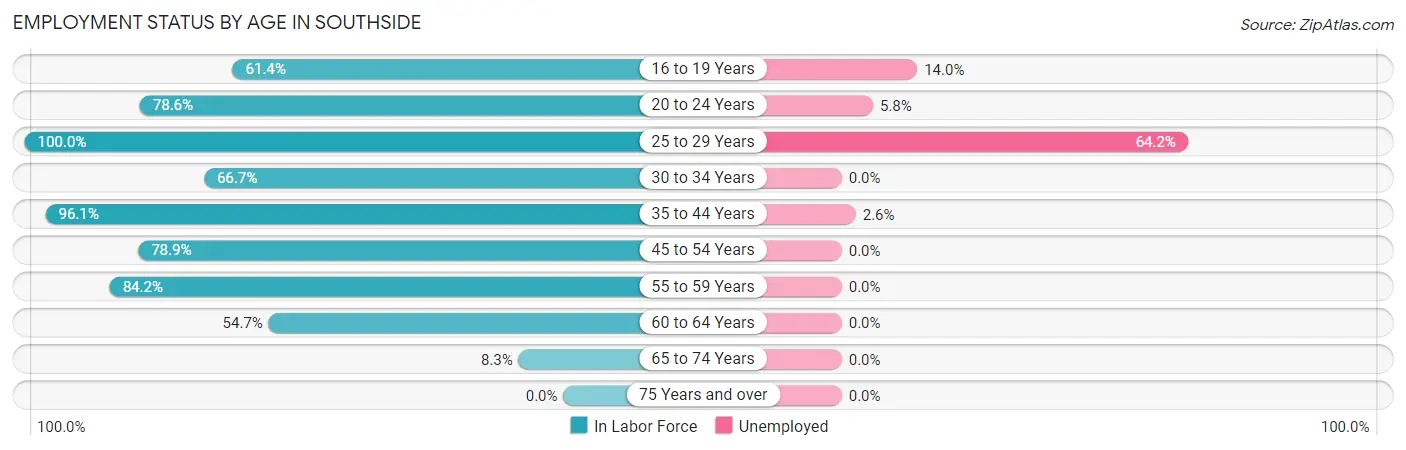
Employment Status by Age in Southside
According to the labor force statistics for Southside, out of the total population over 16 years of age (3,089), 62.5% or 1,931 individuals are in the labor force, with 6.6% or 127 of them unemployed. The age group with the highest labor force participation rate is 25 to 29 years, with 100.0% or 123 individuals in the labor force. Within the labor force, the 25 to 29 years age range has the highest percentage of unemployed individuals, with 64.2% or 79 of them being unemployed.
| Age Bracket | In Labor Force | Unemployed |
| 16 to 19 Years | 129 (61.4%) | 18 (14.0%) |
| 20 to 24 Years | 312 (78.6%) | 18 (5.8%) |
| 25 to 29 Years | 123 (100.0%) | 79 (64.2%) |
| 30 to 34 Years | 188 (66.7%) | 0 (0.0%) |
| 35 to 44 Years | 470 (96.1%) | 12 (2.6%) |
| 45 to 54 Years | 360 (78.9%) | 0 (0.0%) |
| 55 to 59 Years | 170 (84.2%) | 0 (0.0%) |
| 60 to 64 Years | 140 (54.7%) | 0 (0.0%) |
| 65 to 74 Years | 38 (8.3%) | 0 (0.0%) |
| 75 Years and over | 0 (0.0%) | 0 (0.0%) |
| Total | 1,931 (62.5%) | 127 (6.6%) |
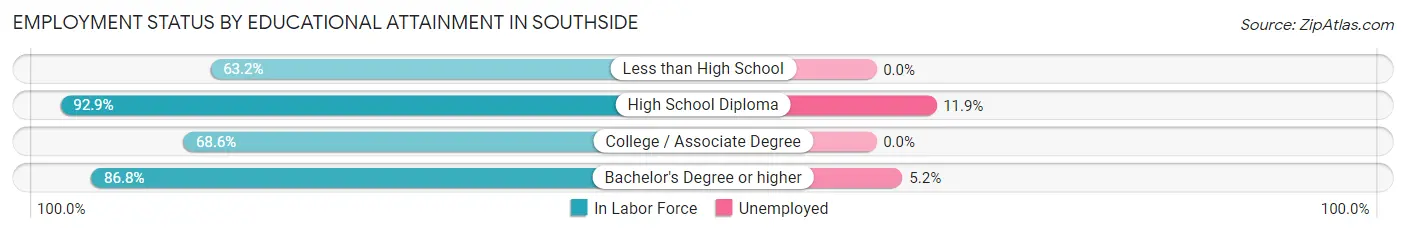
Employment Status by Educational Attainment in Southside
According to labor force statistics for Southside, 80.3% of individuals (1,452) out of the total population between 25 and 64 years of age (1,808) are in the labor force, with 6.3% or 91 of them being unemployed. The group with the highest labor force participation rate are those with the educational attainment of high school diploma, with 92.9% or 664 individuals in the labor force. Within the labor force, individuals with high school diploma education have the highest percentage of unemployment, with 11.9% or 79 of them being unemployed.
| Educational Attainment | In Labor Force | Unemployed |
| Less than High School | 134 (63.2%) | 0 (0.0%) |
| High School Diploma | 664 (92.9%) | 85 (11.9%) |
| College / Associate Degree | 422 (68.6%) | 0 (0.0%) |
| Bachelor's Degree or higher | 231 (86.8%) | 14 (5.2%) |
| Total | 1,452 (80.3%) | 114 (6.3%) |
Employment Occupations by Sex in Southside
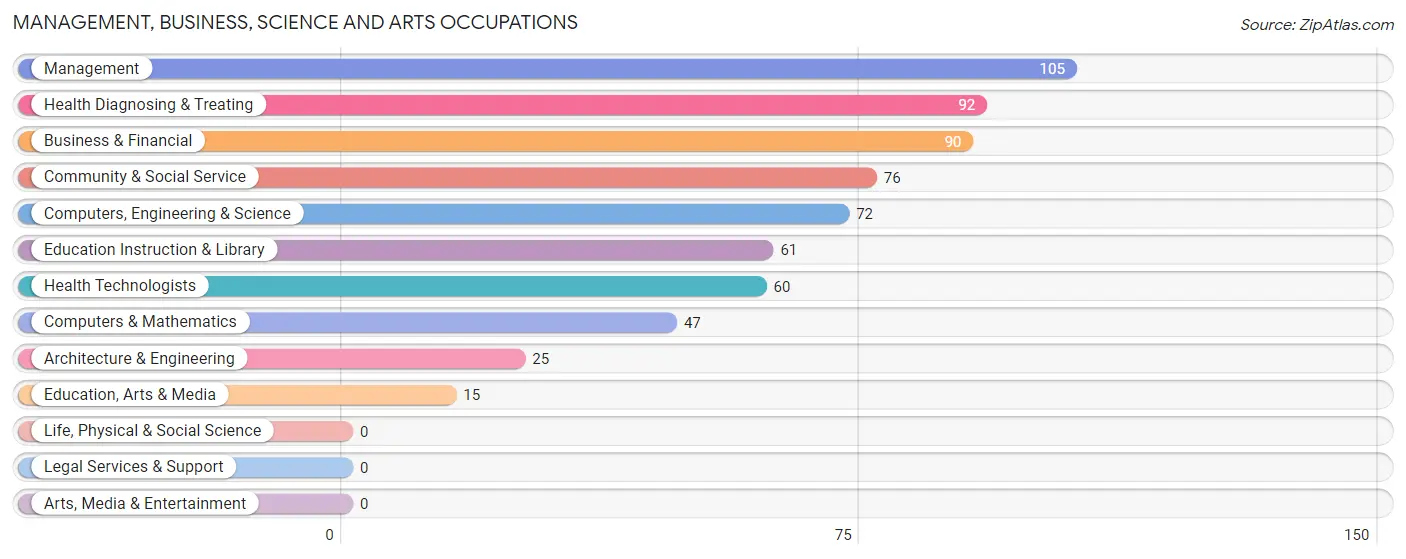
Management, Business, Science and Arts Occupations
The most common Management, Business, Science and Arts occupations in Southside are Management (105 | 5.8%), Health Diagnosing & Treating (92 | 5.1%), Business & Financial (90 | 5.0%), Community & Social Service (76 | 4.2%), and Computers, Engineering & Science (72 | 4.0%).
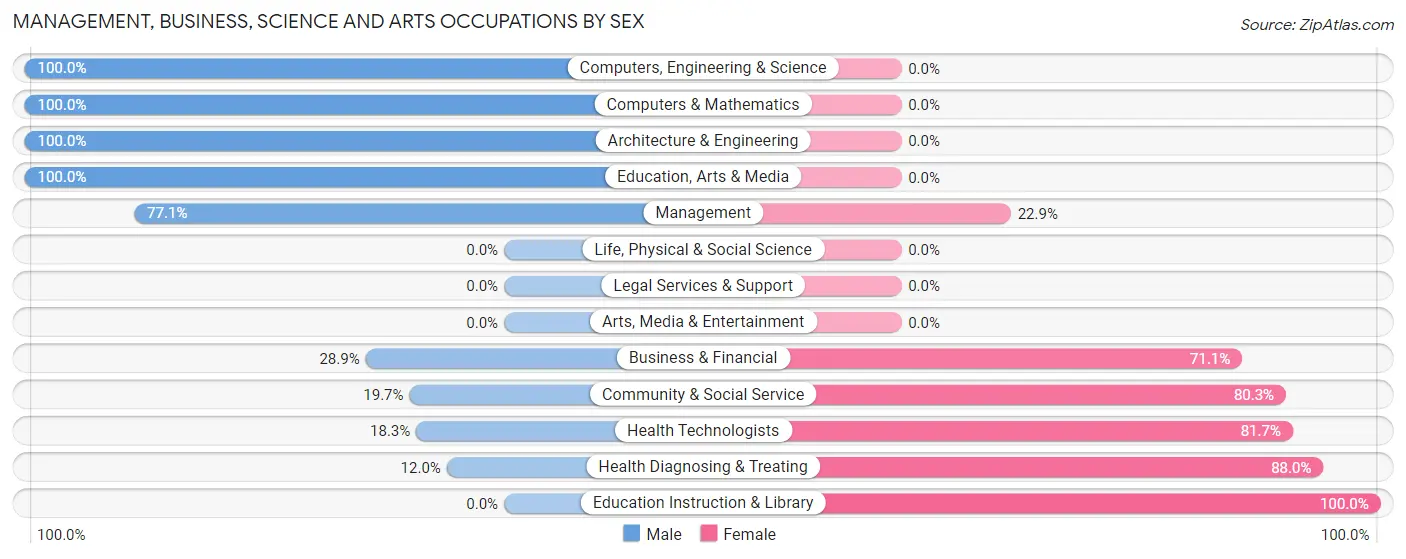
Management, Business, Science and Arts Occupations by Sex
Within the Management, Business, Science and Arts occupations in Southside, the most male-oriented occupations are Computers, Engineering & Science (100.0%), Computers & Mathematics (100.0%), and Architecture & Engineering (100.0%), while the most female-oriented occupations are Education Instruction & Library (100.0%), Health Diagnosing & Treating (88.0%), and Health Technologists (81.7%).
| Occupation | Male | Female |
| Management | 81 (77.1%) | 24 (22.9%) |
| Business & Financial | 26 (28.9%) | 64 (71.1%) |
| Computers, Engineering & Science | 72 (100.0%) | 0 (0.0%) |
| Computers & Mathematics | 47 (100.0%) | 0 (0.0%) |
| Architecture & Engineering | 25 (100.0%) | 0 (0.0%) |
| Life, Physical & Social Science | 0 (0.0%) | 0 (0.0%) |
| Community & Social Service | 15 (19.7%) | 61 (80.3%) |
| Education, Arts & Media | 15 (100.0%) | 0 (0.0%) |
| Legal Services & Support | 0 (0.0%) | 0 (0.0%) |
| Education Instruction & Library | 0 (0.0%) | 61 (100.0%) |
| Arts, Media & Entertainment | 0 (0.0%) | 0 (0.0%) |
| Health Diagnosing & Treating | 11 (12.0%) | 81 (88.0%) |
| Health Technologists | 11 (18.3%) | 49 (81.7%) |
| Total (Category) | 205 (47.1%) | 230 (52.9%) |
| Total (Overall) | 975 (54.1%) | 828 (45.9%) |
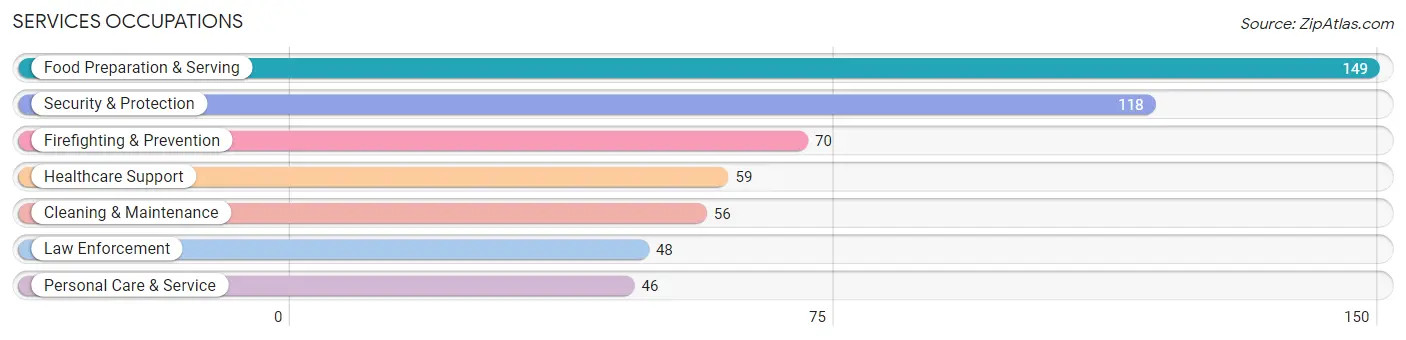
Services Occupations
The most common Services occupations in Southside are Food Preparation & Serving (149 | 8.3%), Security & Protection (118 | 6.5%), Firefighting & Prevention (70 | 3.9%), Healthcare Support (59 | 3.3%), and Cleaning & Maintenance (56 | 3.1%).
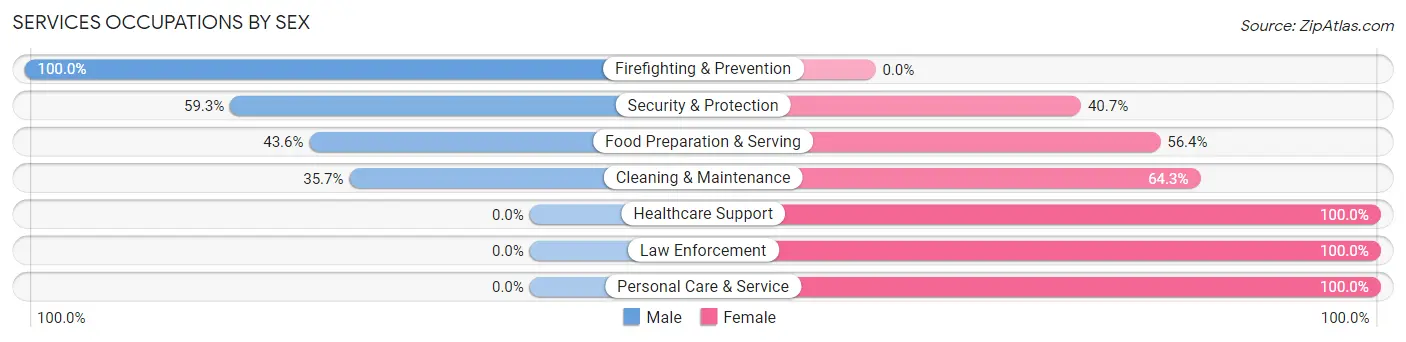
Services Occupations by Sex
Within the Services occupations in Southside, the most male-oriented occupations are Firefighting & Prevention (100.0%), Security & Protection (59.3%), and Food Preparation & Serving (43.6%), while the most female-oriented occupations are Healthcare Support (100.0%), Law Enforcement (100.0%), and Personal Care & Service (100.0%).
| Occupation | Male | Female |
| Healthcare Support | 0 (0.0%) | 59 (100.0%) |
| Security & Protection | 70 (59.3%) | 48 (40.7%) |
| Firefighting & Prevention | 70 (100.0%) | 0 (0.0%) |
| Law Enforcement | 0 (0.0%) | 48 (100.0%) |
| Food Preparation & Serving | 65 (43.6%) | 84 (56.4%) |
| Cleaning & Maintenance | 20 (35.7%) | 36 (64.3%) |
| Personal Care & Service | 0 (0.0%) | 46 (100.0%) |
| Total (Category) | 155 (36.2%) | 273 (63.8%) |
| Total (Overall) | 975 (54.1%) | 828 (45.9%) |
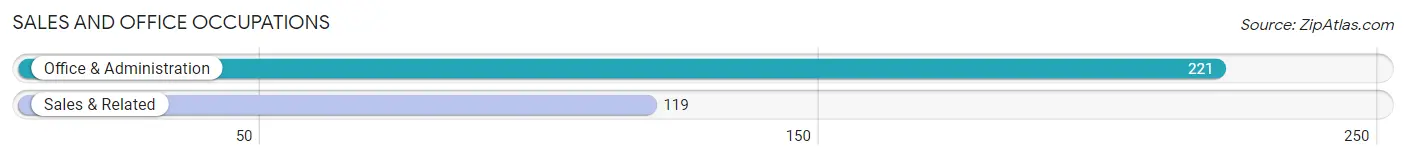
Sales and Office Occupations
The most common Sales and Office occupations in Southside are Office & Administration (221 | 12.3%), and Sales & Related (119 | 6.6%).
Sales and Office Occupations by Sex
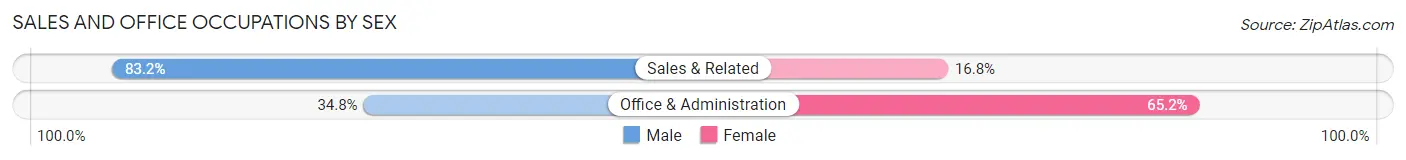
| Occupation | Male | Female |
| Sales & Related | 99 (83.2%) | 20 (16.8%) |
| Office & Administration | 77 (34.8%) | 144 (65.2%) |
| Total (Category) | 176 (51.8%) | 164 (48.2%) |
| Total (Overall) | 975 (54.1%) | 828 (45.9%) |
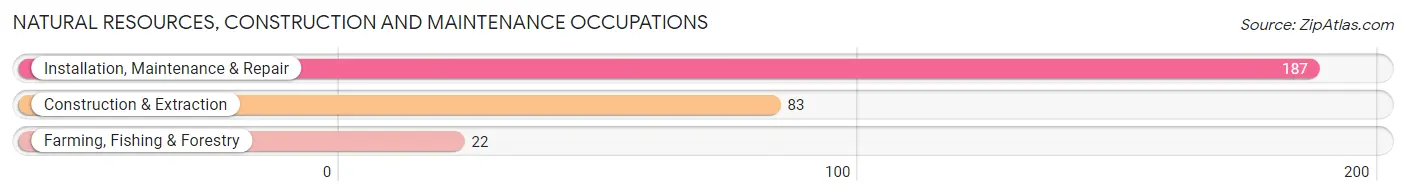
Natural Resources, Construction and Maintenance Occupations
The most common Natural Resources, Construction and Maintenance occupations in Southside are Installation, Maintenance & Repair (187 | 10.4%), Construction & Extraction (83 | 4.6%), and Farming, Fishing & Forestry (22 | 1.2%).
Natural Resources, Construction and Maintenance Occupations by Sex
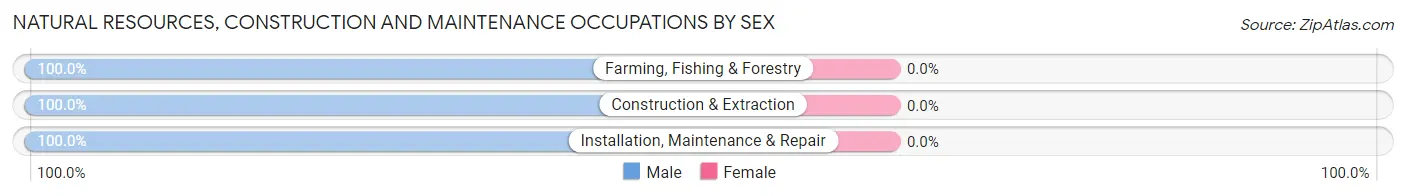
| Occupation | Male | Female |
| Farming, Fishing & Forestry | 22 (100.0%) | 0 (0.0%) |
| Construction & Extraction | 83 (100.0%) | 0 (0.0%) |
| Installation, Maintenance & Repair | 187 (100.0%) | 0 (0.0%) |
| Total (Category) | 292 (100.0%) | 0 (0.0%) |
| Total (Overall) | 975 (54.1%) | 828 (45.9%) |
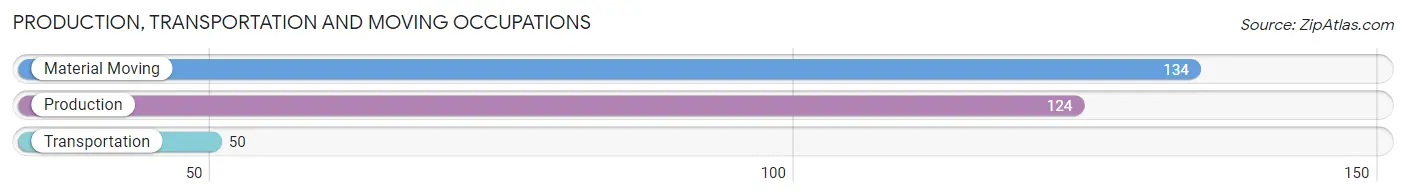
Production, Transportation and Moving Occupations
The most common Production, Transportation and Moving occupations in Southside are Material Moving (134 | 7.4%), Production (124 | 6.9%), and Transportation (50 | 2.8%).
Production, Transportation and Moving Occupations by Sex
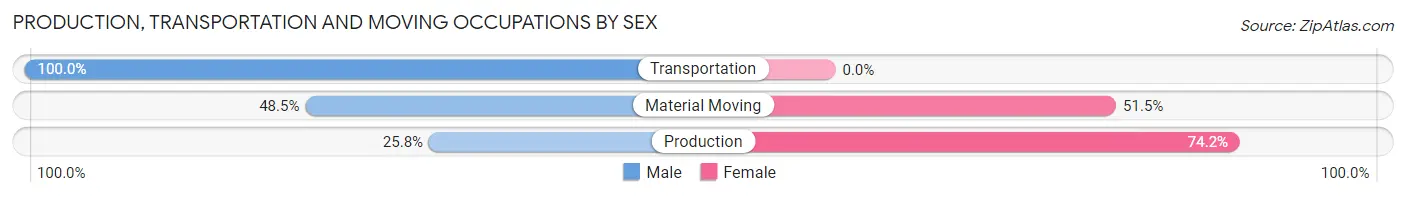
| Occupation | Male | Female |
| Production | 32 (25.8%) | 92 (74.2%) |
| Transportation | 50 (100.0%) | 0 (0.0%) |
| Material Moving | 65 (48.5%) | 69 (51.5%) |
| Total (Category) | 147 (47.7%) | 161 (52.3%) |
| Total (Overall) | 975 (54.1%) | 828 (45.9%) |
Employment Industries by Sex in Southside
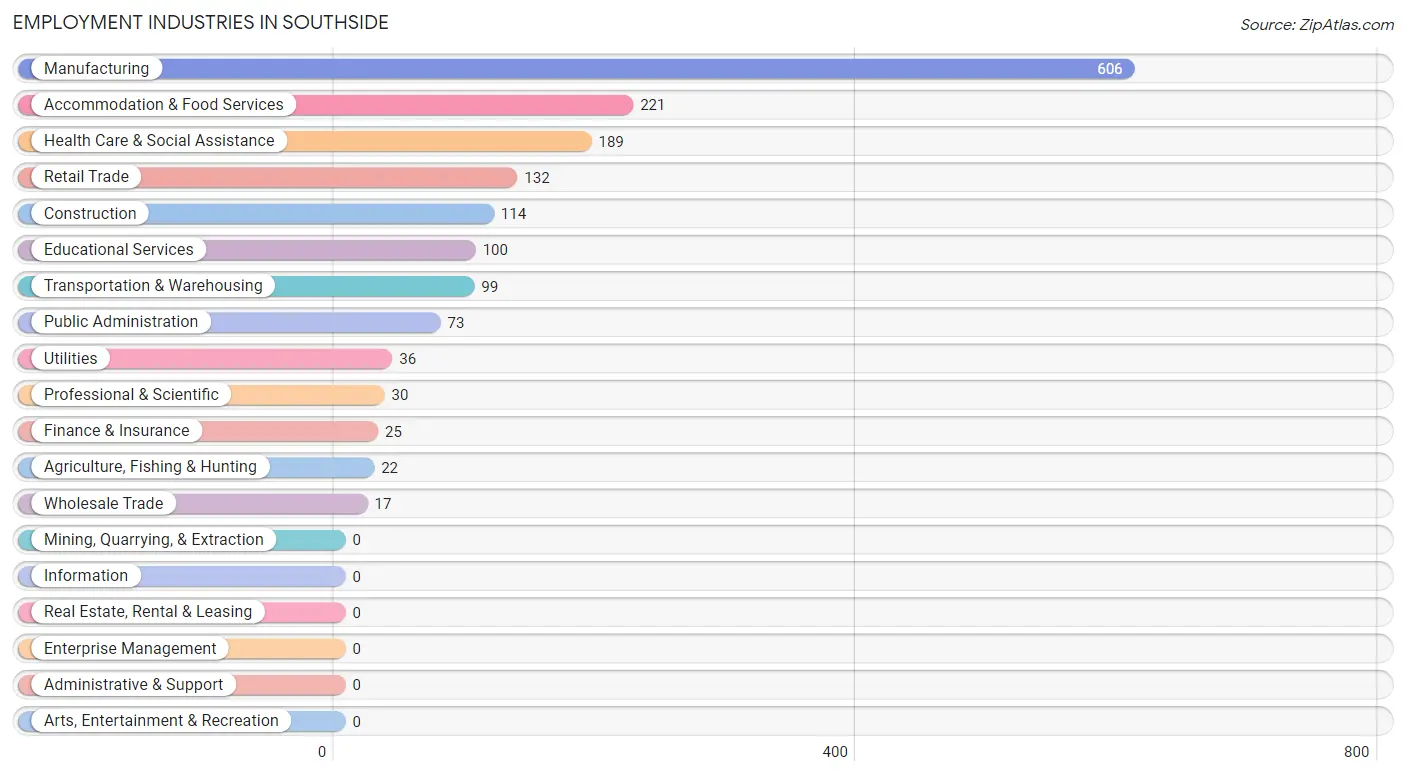
Employment Industries in Southside
The major employment industries in Southside include Manufacturing (606 | 33.6%), Accommodation & Food Services (221 | 12.3%), Health Care & Social Assistance (189 | 10.5%), Retail Trade (132 | 7.3%), and Construction (114 | 6.3%).
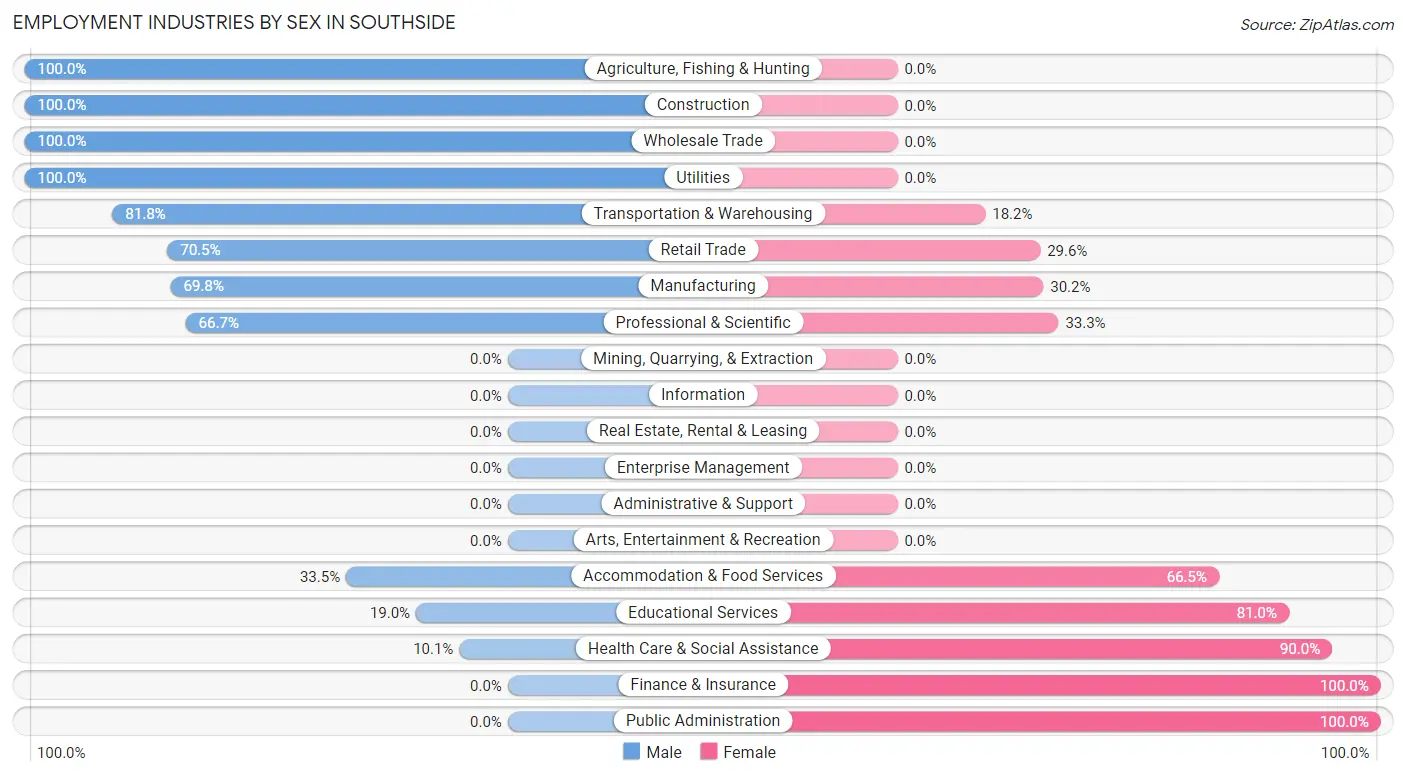
Employment Industries by Sex in Southside
The Southside industries that see more men than women are Agriculture, Fishing & Hunting (100.0%), Construction (100.0%), and Wholesale Trade (100.0%), whereas the industries that tend to have a higher number of women are Finance & Insurance (100.0%), Public Administration (100.0%), and Health Care & Social Assistance (89.9%).
| Industry | Male | Female |
| Agriculture, Fishing & Hunting | 22 (100.0%) | 0 (0.0%) |
| Mining, Quarrying, & Extraction | 0 (0.0%) | 0 (0.0%) |
| Construction | 114 (100.0%) | 0 (0.0%) |
| Manufacturing | 423 (69.8%) | 183 (30.2%) |
| Wholesale Trade | 17 (100.0%) | 0 (0.0%) |
| Retail Trade | 93 (70.5%) | 39 (29.5%) |
| Transportation & Warehousing | 81 (81.8%) | 18 (18.2%) |
| Utilities | 36 (100.0%) | 0 (0.0%) |
| Information | 0 (0.0%) | 0 (0.0%) |
| Finance & Insurance | 0 (0.0%) | 25 (100.0%) |
| Real Estate, Rental & Leasing | 0 (0.0%) | 0 (0.0%) |
| Professional & Scientific | 20 (66.7%) | 10 (33.3%) |
| Enterprise Management | 0 (0.0%) | 0 (0.0%) |
| Administrative & Support | 0 (0.0%) | 0 (0.0%) |
| Educational Services | 19 (19.0%) | 81 (81.0%) |
| Health Care & Social Assistance | 19 (10.1%) | 170 (89.9%) |
| Arts, Entertainment & Recreation | 0 (0.0%) | 0 (0.0%) |
| Accommodation & Food Services | 74 (33.5%) | 147 (66.5%) |
| Public Administration | 0 (0.0%) | 73 (100.0%) |
| Total | 975 (54.1%) | 828 (45.9%) |
Education in Southside
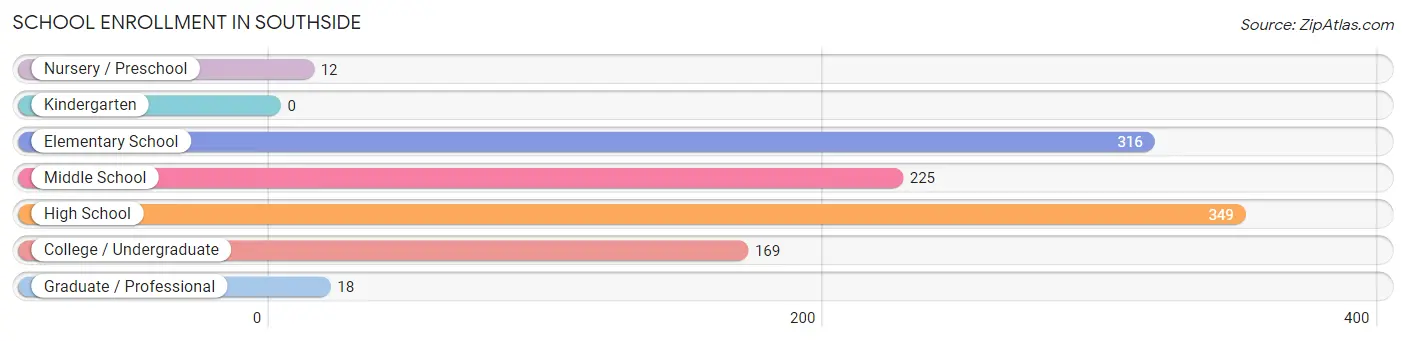
School Enrollment in Southside
The most common levels of schooling among the 1,089 students in Southside are high school (349 | 32.1%), elementary school (316 | 29.0%), and middle school (225 | 20.7%).
| School Level | # Students | % Students |
| Nursery / Preschool | 12 | 1.1% |
| Kindergarten | 0 | 0.0% |
| Elementary School | 316 | 29.0% |
| Middle School | 225 | 20.7% |
| High School | 349 | 32.1% |
| College / Undergraduate | 169 | 15.5% |
| Graduate / Professional | 18 | 1.7% |
| Total | 1,089 | 100.0% |
School Enrollment by Age by Funding Source in Southside
Out of a total of 1,089 students who are enrolled in schools in Southside, 73 (6.7%) attend a private institution, while the remaining 1,016 (93.3%) are enrolled in public schools. The age group of 3 to 4 year olds has the highest likelihood of being enrolled in private schools, with 12 (100.0% in the age bracket) enrolled. Conversely, the age group of 10 to 14 year olds has the lowest likelihood of being enrolled in a private school, with 319 (100.0% in the age bracket) attending a public institution.
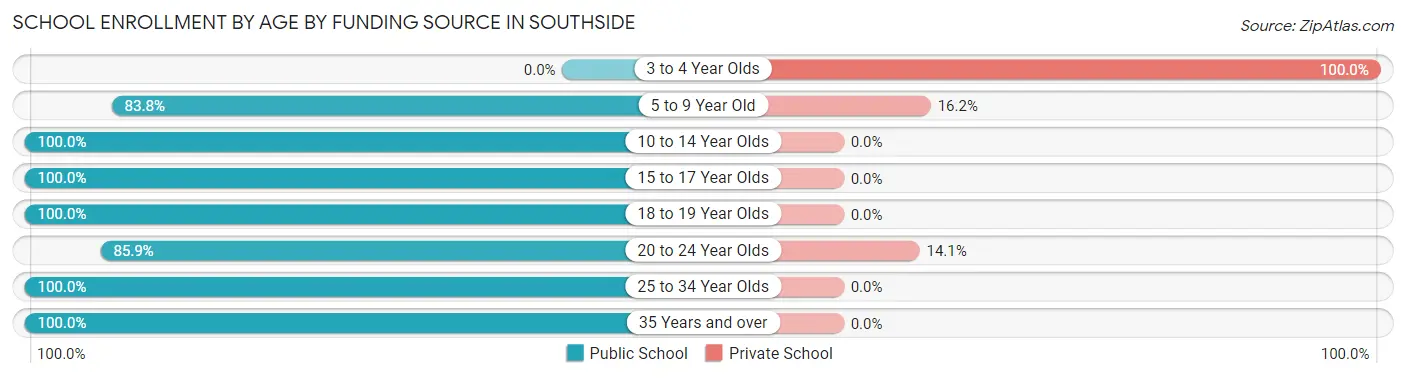
| Age Bracket | Public School | Private School |
| 3 to 4 Year Olds | 0 (0.0%) | 12 (100.0%) |
| 5 to 9 Year Old | 248 (83.8%) | 48 (16.2%) |
| 10 to 14 Year Olds | 319 (100.0%) | 0 (0.0%) |
| 15 to 17 Year Olds | 182 (100.0%) | 0 (0.0%) |
| 18 to 19 Year Olds | 105 (100.0%) | 0 (0.0%) |
| 20 to 24 Year Olds | 79 (85.9%) | 13 (14.1%) |
| 25 to 34 Year Olds | 55 (100.0%) | 0 (0.0%) |
| 35 Years and over | 28 (100.0%) | 0 (0.0%) |
| Total | 1,016 (93.3%) | 73 (6.7%) |
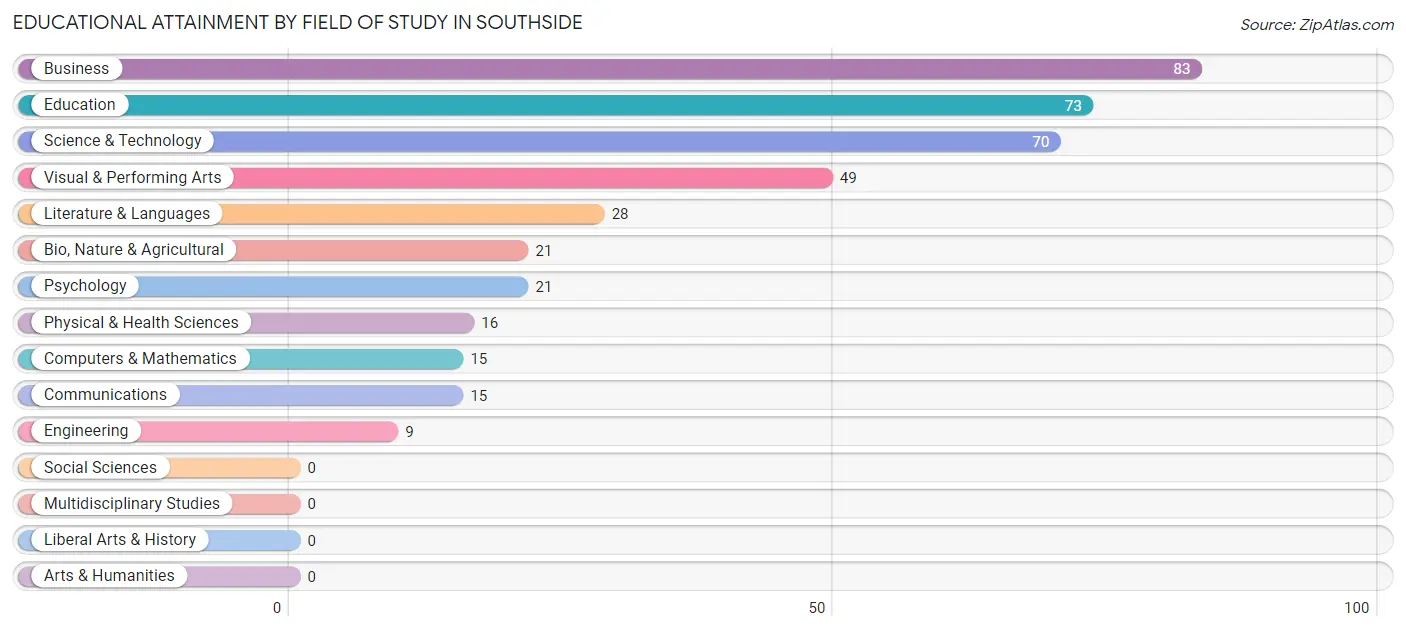
Educational Attainment by Field of Study in Southside
Business (83 | 20.7%), education (73 | 18.2%), science & technology (70 | 17.5%), visual & performing arts (49 | 12.2%), and literature & languages (28 | 7.0%) are the most common fields of study among 400 individuals in Southside who have obtained a bachelor's degree or higher.
| Field of Study | # Graduates | % Graduates |
| Computers & Mathematics | 15 | 3.7% |
| Bio, Nature & Agricultural | 21 | 5.2% |
| Physical & Health Sciences | 16 | 4.0% |
| Psychology | 21 | 5.2% |
| Social Sciences | 0 | 0.0% |
| Engineering | 9 | 2.2% |
| Multidisciplinary Studies | 0 | 0.0% |
| Science & Technology | 70 | 17.5% |
| Business | 83 | 20.7% |
| Education | 73 | 18.2% |
| Literature & Languages | 28 | 7.0% |
| Liberal Arts & History | 0 | 0.0% |
| Visual & Performing Arts | 49 | 12.2% |
| Communications | 15 | 3.7% |
| Arts & Humanities | 0 | 0.0% |
| Total | 400 | 100.0% |
Transportation & Commute in Southside
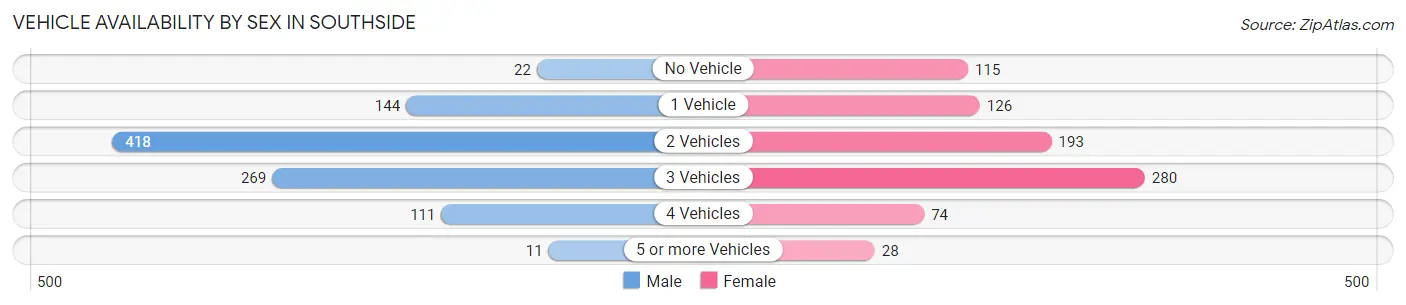
Vehicle Availability by Sex in Southside
The most prevalent vehicle ownership categories in Southside are males with 2 vehicles (418, accounting for 42.9%) and females with 2 vehicles (193, making up 51.2%).
| Vehicles Available | Male | Female |
| No Vehicle | 22 (2.3%) | 115 (14.1%) |
| 1 Vehicle | 144 (14.8%) | 126 (15.4%) |
| 2 Vehicles | 418 (42.9%) | 193 (23.6%) |
| 3 Vehicles | 269 (27.6%) | 280 (34.3%) |
| 4 Vehicles | 111 (11.4%) | 74 (9.1%) |
| 5 or more Vehicles | 11 (1.1%) | 28 (3.4%) |
| Total | 975 (100.0%) | 816 (100.0%) |
Commute Time in Southside
The most frequently occuring commute durations in Southside are 15 to 19 minutes (602 commuters, 34.2%), 10 to 14 minutes (484 commuters, 27.5%), and 5 to 9 minutes (277 commuters, 15.8%).
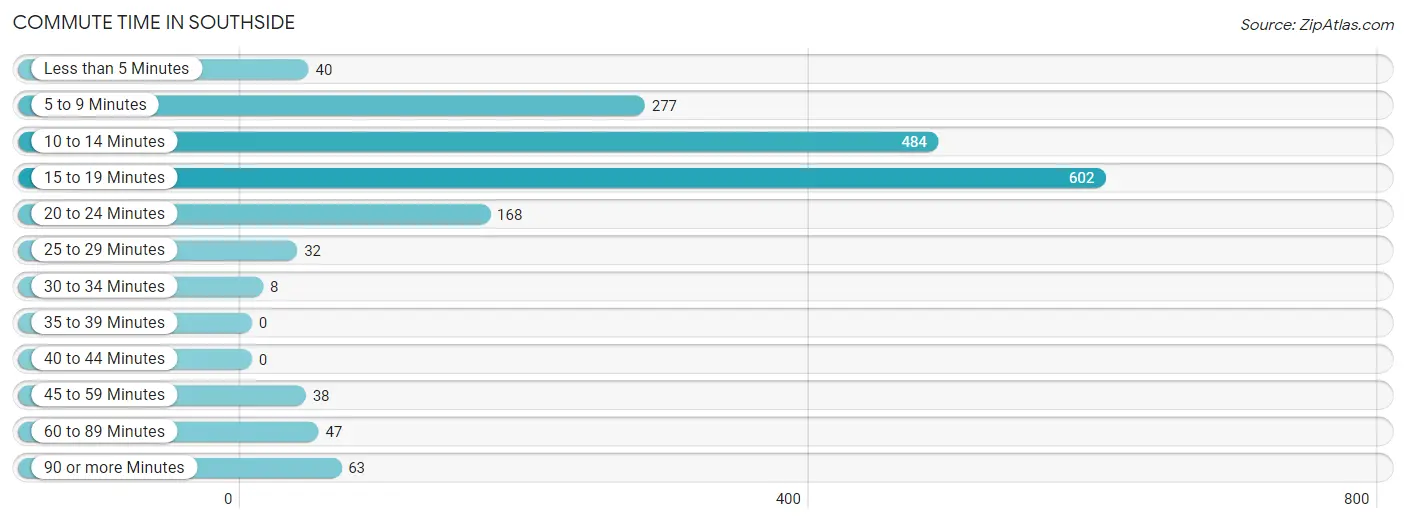
| Commute Time | # Commuters | % Commuters |
| Less than 5 Minutes | 40 | 2.3% |
| 5 to 9 Minutes | 277 | 15.8% |
| 10 to 14 Minutes | 484 | 27.5% |
| 15 to 19 Minutes | 602 | 34.2% |
| 20 to 24 Minutes | 168 | 9.6% |
| 25 to 29 Minutes | 32 | 1.8% |
| 30 to 34 Minutes | 8 | 0.4% |
| 35 to 39 Minutes | 0 | 0.0% |
| 40 to 44 Minutes | 0 | 0.0% |
| 45 to 59 Minutes | 38 | 2.2% |
| 60 to 89 Minutes | 47 | 2.7% |
| 90 or more Minutes | 63 | 3.6% |
Commute Time by Sex in Southside
The most common commute times in Southside are 15 to 19 minutes (375 commuters, 39.2%) for males and 10 to 14 minutes (278 commuters, 34.6%) for females.
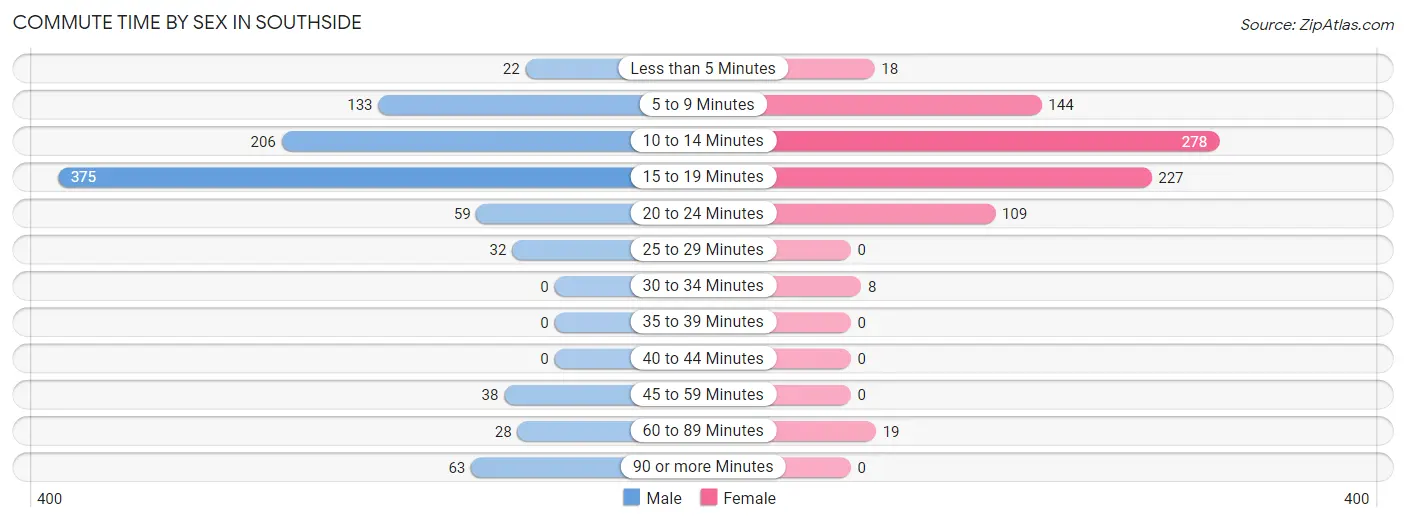
| Commute Time | Male | Female |
| Less than 5 Minutes | 22 (2.3%) | 18 (2.2%) |
| 5 to 9 Minutes | 133 (13.9%) | 144 (17.9%) |
| 10 to 14 Minutes | 206 (21.5%) | 278 (34.6%) |
| 15 to 19 Minutes | 375 (39.2%) | 227 (28.3%) |
| 20 to 24 Minutes | 59 (6.2%) | 109 (13.6%) |
| 25 to 29 Minutes | 32 (3.4%) | 0 (0.0%) |
| 30 to 34 Minutes | 0 (0.0%) | 8 (1.0%) |
| 35 to 39 Minutes | 0 (0.0%) | 0 (0.0%) |
| 40 to 44 Minutes | 0 (0.0%) | 0 (0.0%) |
| 45 to 59 Minutes | 38 (4.0%) | 0 (0.0%) |
| 60 to 89 Minutes | 28 (2.9%) | 19 (2.4%) |
| 90 or more Minutes | 63 (6.6%) | 0 (0.0%) |
Time of Departure to Work by Sex in Southside
The most frequent times of departure to work in Southside are 12:00 PM to 3:59 PM (248, 25.9%) for males and 7:30 AM to 7:59 AM (142, 17.7%) for females.
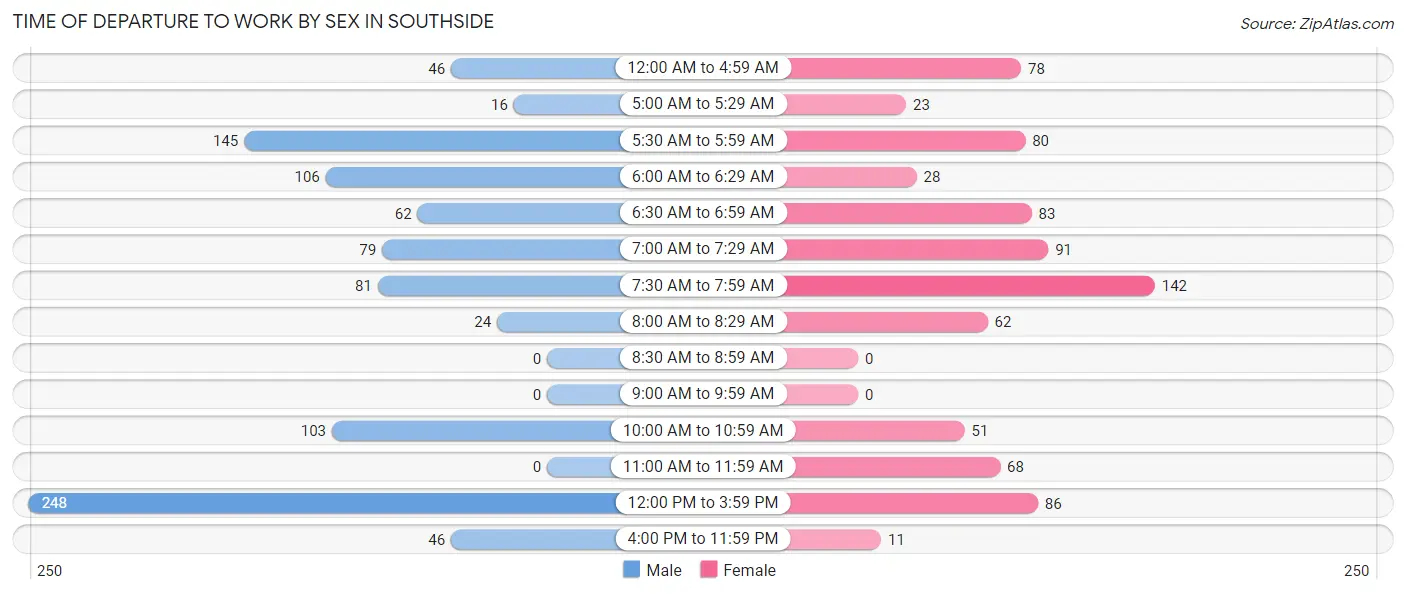
| Time of Departure | Male | Female |
| 12:00 AM to 4:59 AM | 46 (4.8%) | 78 (9.7%) |
| 5:00 AM to 5:29 AM | 16 (1.7%) | 23 (2.9%) |
| 5:30 AM to 5:59 AM | 145 (15.2%) | 80 (10.0%) |
| 6:00 AM to 6:29 AM | 106 (11.1%) | 28 (3.5%) |
| 6:30 AM to 6:59 AM | 62 (6.5%) | 83 (10.3%) |
| 7:00 AM to 7:29 AM | 79 (8.3%) | 91 (11.3%) |
| 7:30 AM to 7:59 AM | 81 (8.5%) | 142 (17.7%) |
| 8:00 AM to 8:29 AM | 24 (2.5%) | 62 (7.7%) |
| 8:30 AM to 8:59 AM | 0 (0.0%) | 0 (0.0%) |
| 9:00 AM to 9:59 AM | 0 (0.0%) | 0 (0.0%) |
| 10:00 AM to 10:59 AM | 103 (10.8%) | 51 (6.4%) |
| 11:00 AM to 11:59 AM | 0 (0.0%) | 68 (8.5%) |
| 12:00 PM to 3:59 PM | 248 (25.9%) | 86 (10.7%) |
| 4:00 PM to 11:59 PM | 46 (4.8%) | 11 (1.4%) |
| Total | 956 (100.0%) | 803 (100.0%) |
Housing Occupancy in Southside
Occupancy by Ownership in Southside
Of the total 1,379 dwellings in Southside, owner-occupied units account for 991 (71.9%), while renter-occupied units make up 388 (28.1%).
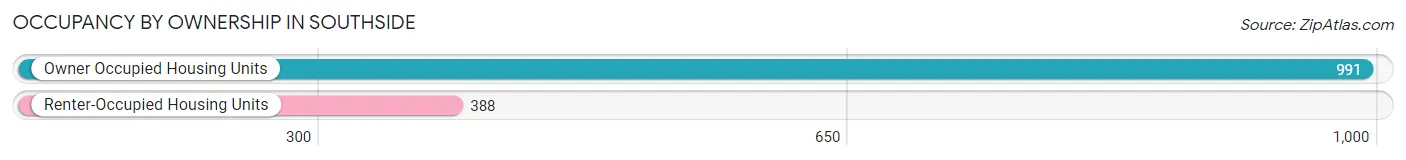
| Occupancy | # Housing Units | % Housing Units |
| Owner Occupied Housing Units | 991 | 71.9% |
| Renter-Occupied Housing Units | 388 | 28.1% |
| Total Occupied Housing Units | 1,379 | 100.0% |
Occupancy by Household Size in Southside
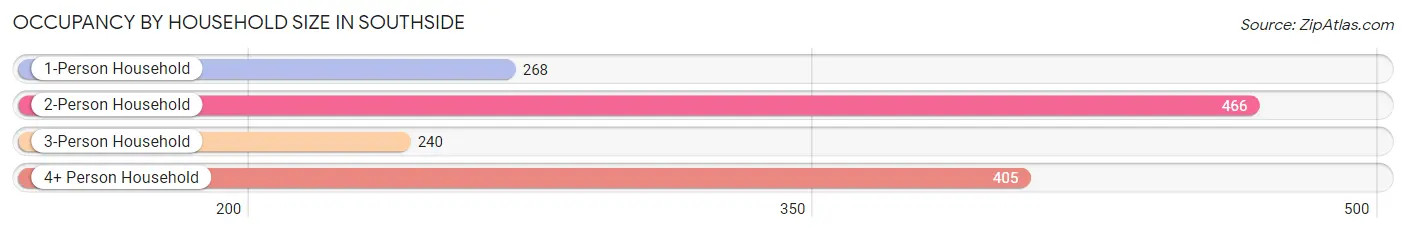
| Household Size | # Housing Units | % Housing Units |
| 1-Person Household | 268 | 19.4% |
| 2-Person Household | 466 | 33.8% |
| 3-Person Household | 240 | 17.4% |
| 4+ Person Household | 405 | 29.4% |
| Total Housing Units | 1,379 | 100.0% |
Occupancy by Ownership by Household Size in Southside
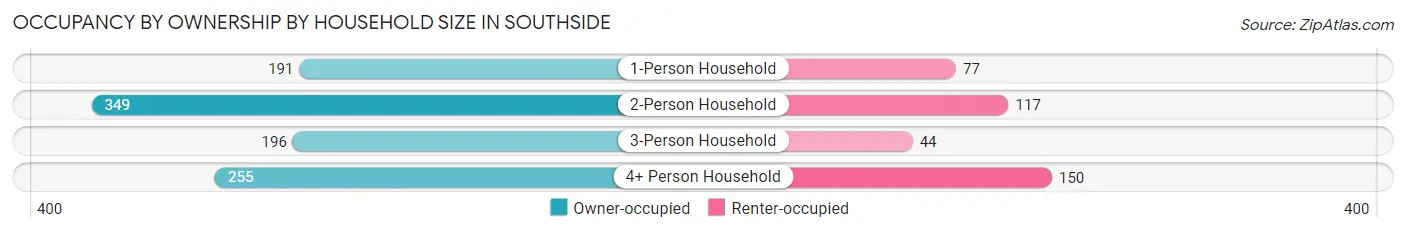
| Household Size | Owner-occupied | Renter-occupied |
| 1-Person Household | 191 (71.3%) | 77 (28.7%) |
| 2-Person Household | 349 (74.9%) | 117 (25.1%) |
| 3-Person Household | 196 (81.7%) | 44 (18.3%) |
| 4+ Person Household | 255 (63.0%) | 150 (37.0%) |
| Total Housing Units | 991 (71.9%) | 388 (28.1%) |
Occupancy by Educational Attainment in Southside
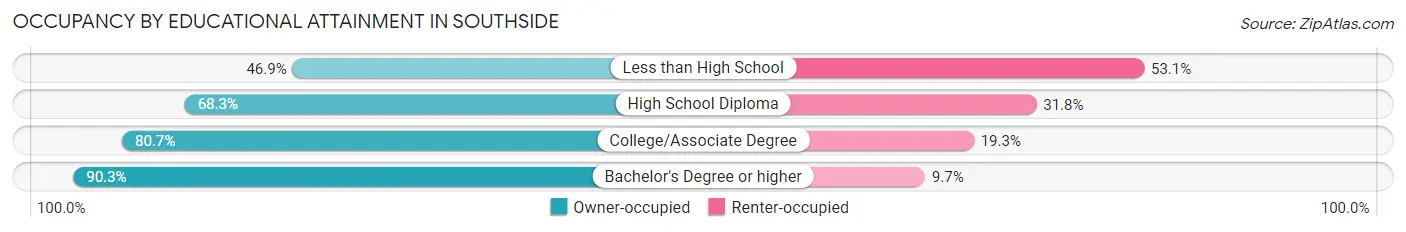
| Household Size | Owner-occupied | Renter-occupied |
| Less than High School | 83 (46.9%) | 94 (53.1%) |
| High School Diploma | 432 (68.2%) | 201 (31.8%) |
| College/Associate Degree | 317 (80.7%) | 76 (19.3%) |
| Bachelor's Degree or higher | 159 (90.3%) | 17 (9.7%) |
Occupancy by Age of Householder in Southside
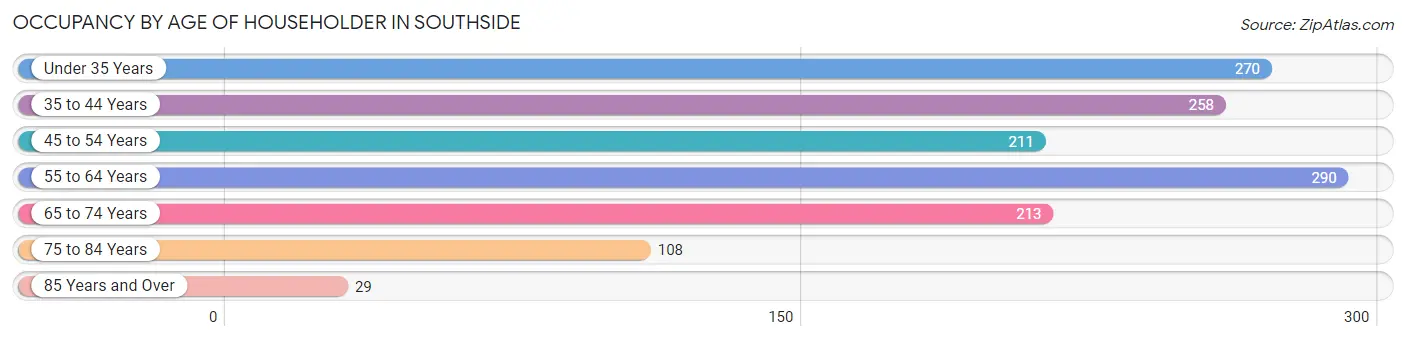
| Age Bracket | # Households | % Households |
| Under 35 Years | 270 | 19.6% |
| 35 to 44 Years | 258 | 18.7% |
| 45 to 54 Years | 211 | 15.3% |
| 55 to 64 Years | 290 | 21.0% |
| 65 to 74 Years | 213 | 15.4% |
| 75 to 84 Years | 108 | 7.8% |
| 85 Years and Over | 29 | 2.1% |
| Total | 1,379 | 100.0% |
Housing Finances in Southside
Median Income by Occupancy in Southside
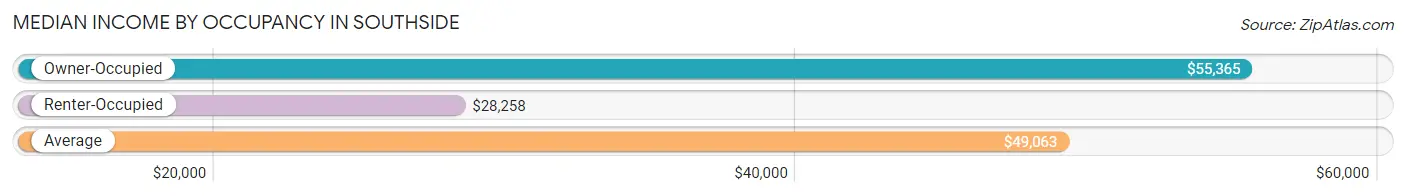
| Occupancy Type | # Households | Median Income |
| Owner-Occupied | 991 (71.9%) | $55,365 |
| Renter-Occupied | 388 (28.1%) | $28,258 |
| Average | 1,379 (100.0%) | $49,063 |
Occupancy by Householder Income Bracket in Southside
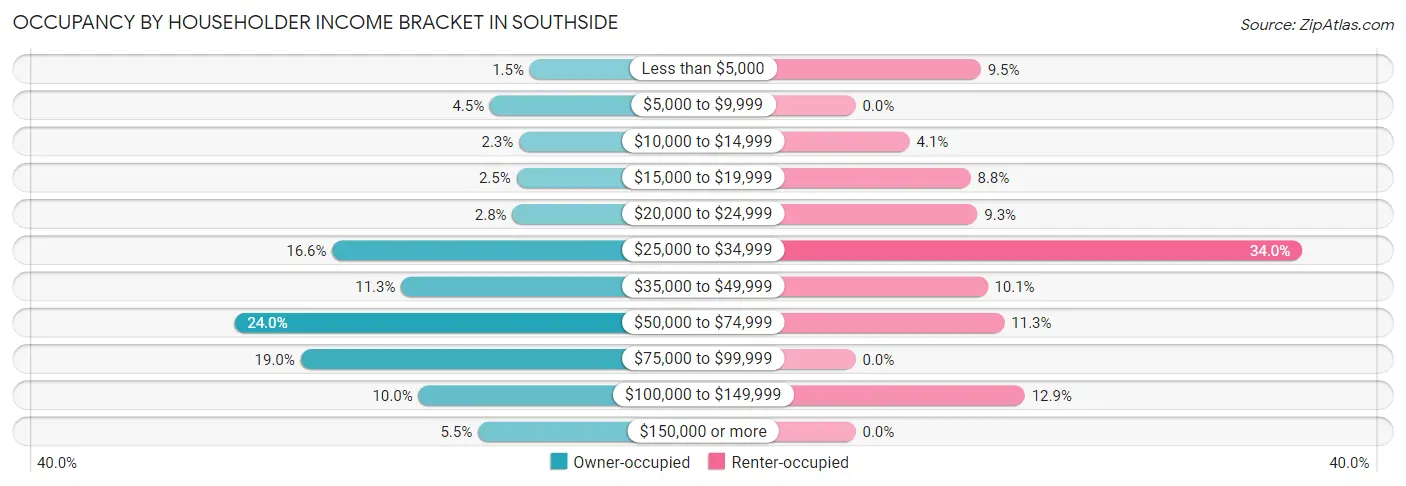
| Income Bracket | Owner-occupied | Renter-occupied |
| Less than $5,000 | 15 (1.5%) | 37 (9.5%) |
| $5,000 to $9,999 | 45 (4.5%) | 0 (0.0%) |
| $10,000 to $14,999 | 23 (2.3%) | 16 (4.1%) |
| $15,000 to $19,999 | 25 (2.5%) | 34 (8.8%) |
| $20,000 to $24,999 | 28 (2.8%) | 36 (9.3%) |
| $25,000 to $34,999 | 164 (16.6%) | 132 (34.0%) |
| $35,000 to $49,999 | 112 (11.3%) | 39 (10.1%) |
| $50,000 to $74,999 | 238 (24.0%) | 44 (11.3%) |
| $75,000 to $99,999 | 188 (19.0%) | 0 (0.0%) |
| $100,000 to $149,999 | 99 (10.0%) | 50 (12.9%) |
| $150,000 or more | 54 (5.4%) | 0 (0.0%) |
| Total | 991 (100.0%) | 388 (100.0%) |
Monthly Housing Cost Tiers in Southside
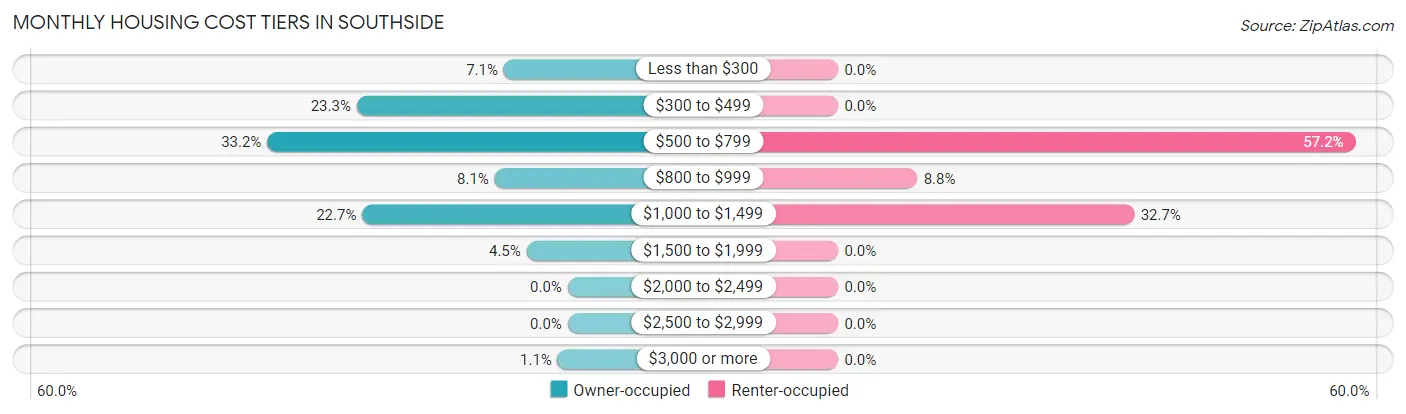
| Monthly Cost | Owner-occupied | Renter-occupied |
| Less than $300 | 70 (7.1%) | 0 (0.0%) |
| $300 to $499 | 231 (23.3%) | 0 (0.0%) |
| $500 to $799 | 329 (33.2%) | 222 (57.2%) |
| $800 to $999 | 80 (8.1%) | 34 (8.8%) |
| $1,000 to $1,499 | 225 (22.7%) | 127 (32.7%) |
| $1,500 to $1,999 | 45 (4.5%) | 0 (0.0%) |
| $2,000 to $2,499 | 0 (0.0%) | 0 (0.0%) |
| $2,500 to $2,999 | 0 (0.0%) | 0 (0.0%) |
| $3,000 or more | 11 (1.1%) | 0 (0.0%) |
| Total | 991 (100.0%) | 388 (100.0%) |
Physical Housing Characteristics in Southside
Housing Structures in Southside
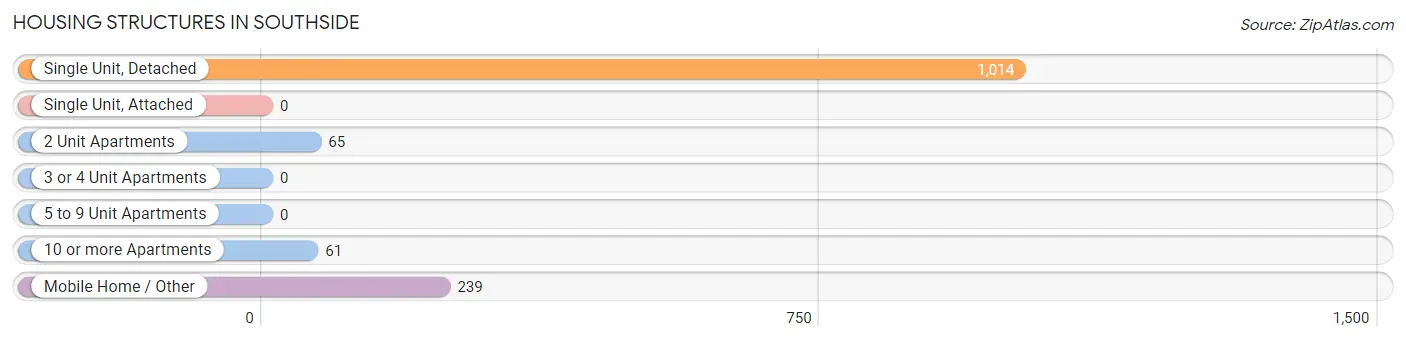
| Structure Type | # Housing Units | % Housing Units |
| Single Unit, Detached | 1,014 | 73.5% |
| Single Unit, Attached | 0 | 0.0% |
| 2 Unit Apartments | 65 | 4.7% |
| 3 or 4 Unit Apartments | 0 | 0.0% |
| 5 to 9 Unit Apartments | 0 | 0.0% |
| 10 or more Apartments | 61 | 4.4% |
| Mobile Home / Other | 239 | 17.3% |
| Total | 1,379 | 100.0% |
Housing Structures by Occupancy in Southside
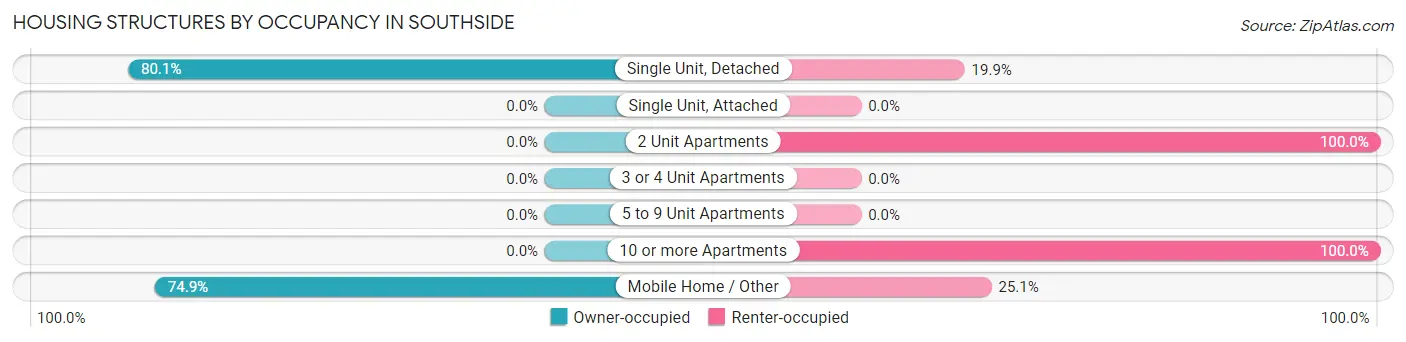
| Structure Type | Owner-occupied | Renter-occupied |
| Single Unit, Detached | 812 (80.1%) | 202 (19.9%) |
| Single Unit, Attached | 0 (0.0%) | 0 (0.0%) |
| 2 Unit Apartments | 0 (0.0%) | 65 (100.0%) |
| 3 or 4 Unit Apartments | 0 (0.0%) | 0 (0.0%) |
| 5 to 9 Unit Apartments | 0 (0.0%) | 0 (0.0%) |
| 10 or more Apartments | 0 (0.0%) | 61 (100.0%) |
| Mobile Home / Other | 179 (74.9%) | 60 (25.1%) |
| Total | 991 (71.9%) | 388 (28.1%) |
Housing Structures by Number of Rooms in Southside
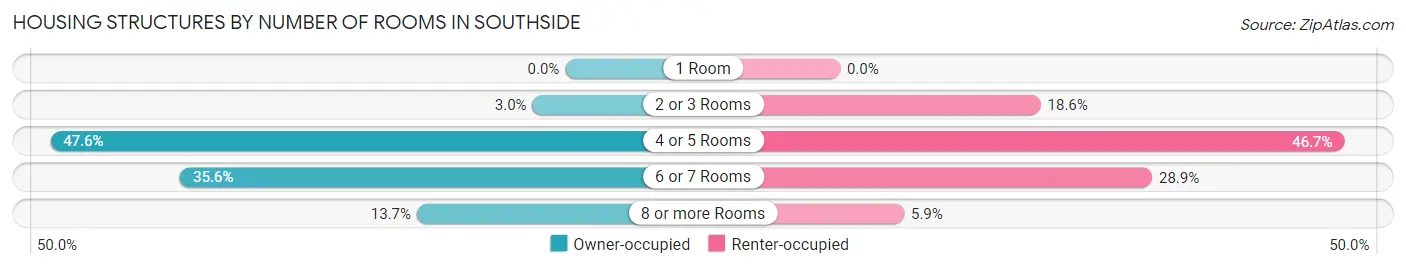
| Number of Rooms | Owner-occupied | Renter-occupied |
| 1 Room | 0 (0.0%) | 0 (0.0%) |
| 2 or 3 Rooms | 30 (3.0%) | 72 (18.6%) |
| 4 or 5 Rooms | 472 (47.6%) | 181 (46.7%) |
| 6 or 7 Rooms | 353 (35.6%) | 112 (28.9%) |
| 8 or more Rooms | 136 (13.7%) | 23 (5.9%) |
| Total | 991 (100.0%) | 388 (100.0%) |
Housing Structure by Heating Type in Southside
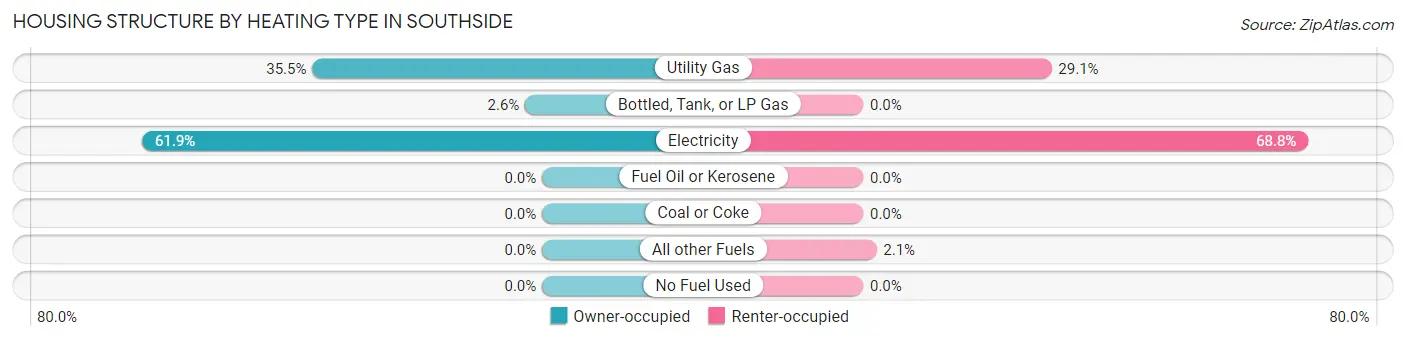
| Heating Type | Owner-occupied | Renter-occupied |
| Utility Gas | 352 (35.5%) | 113 (29.1%) |
| Bottled, Tank, or LP Gas | 26 (2.6%) | 0 (0.0%) |
| Electricity | 613 (61.9%) | 267 (68.8%) |
| Fuel Oil or Kerosene | 0 (0.0%) | 0 (0.0%) |
| Coal or Coke | 0 (0.0%) | 0 (0.0%) |
| All other Fuels | 0 (0.0%) | 8 (2.1%) |
| No Fuel Used | 0 (0.0%) | 0 (0.0%) |
| Total | 991 (100.0%) | 388 (100.0%) |
Household Vehicle Usage in Southside
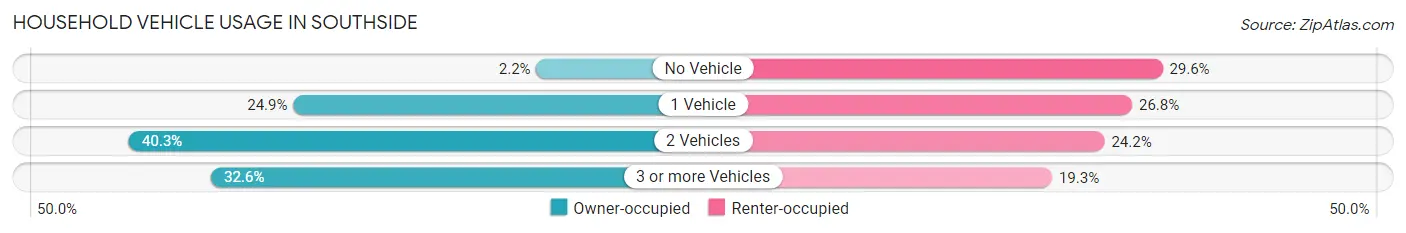
| Vehicles per Household | Owner-occupied | Renter-occupied |
| No Vehicle | 22 (2.2%) | 115 (29.6%) |
| 1 Vehicle | 247 (24.9%) | 104 (26.8%) |
| 2 Vehicles | 399 (40.3%) | 94 (24.2%) |
| 3 or more Vehicles | 323 (32.6%) | 75 (19.3%) |
| Total | 991 (100.0%) | 388 (100.0%) |
Real Estate & Mortgages in Southside
Real Estate and Mortgage Overview in Southside
| Characteristic | Without Mortgage | With Mortgage |
| Housing Units | 409 | 582 |
| Median Property Value | $100,900 | $112,100 |
| Median Household Income | $50,933 | $37 |
| Monthly Housing Costs | $410 | $11 |
| Real Estate Taxes | $883 | $29 |
Property Value by Mortgage Status in Southside
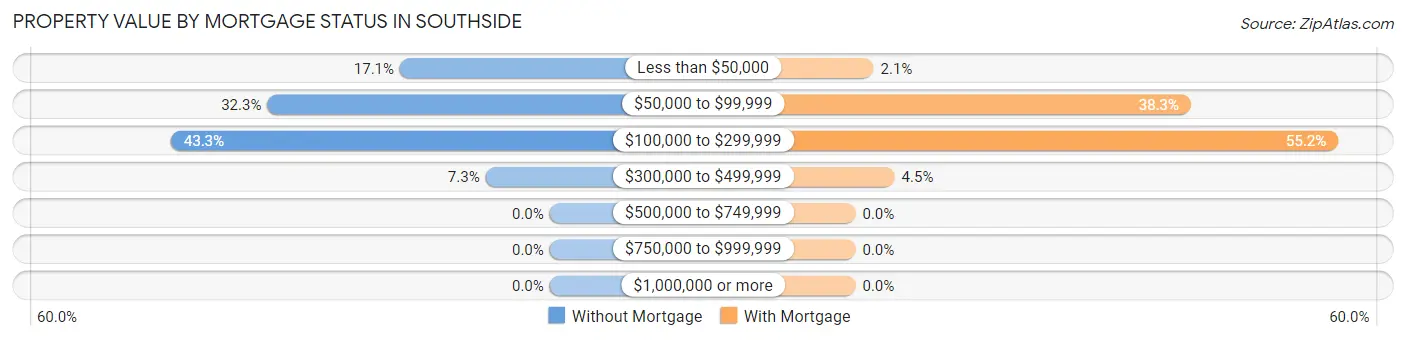
| Property Value | Without Mortgage | With Mortgage |
| Less than $50,000 | 70 (17.1%) | 12 (2.1%) |
| $50,000 to $99,999 | 132 (32.3%) | 223 (38.3%) |
| $100,000 to $299,999 | 177 (43.3%) | 321 (55.1%) |
| $300,000 to $499,999 | 30 (7.3%) | 26 (4.5%) |
| $500,000 to $749,999 | 0 (0.0%) | 0 (0.0%) |
| $750,000 to $999,999 | 0 (0.0%) | 0 (0.0%) |
| $1,000,000 or more | 0 (0.0%) | 0 (0.0%) |
| Total | 409 (100.0%) | 582 (100.0%) |
Household Income by Mortgage Status in Southside
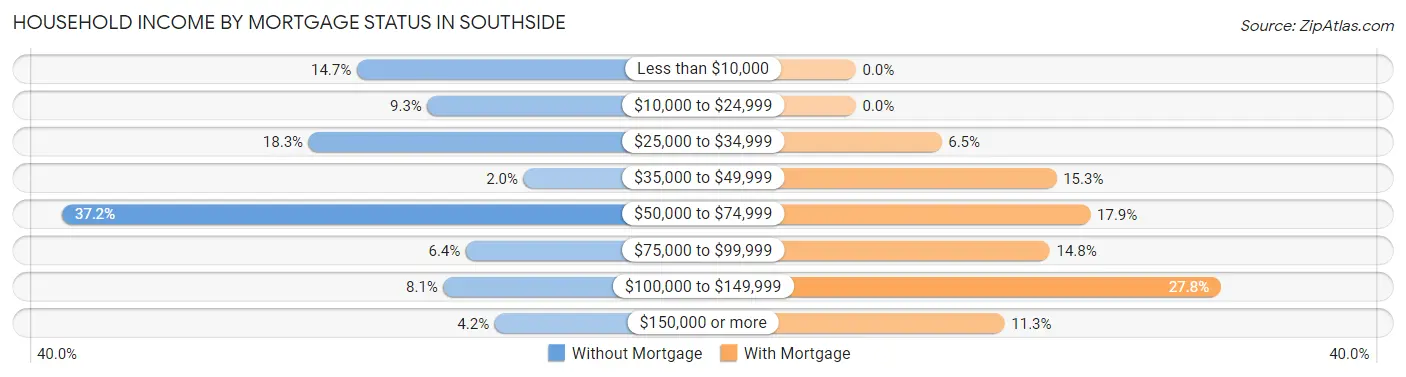
| Household Income | Without Mortgage | With Mortgage |
| Less than $10,000 | 60 (14.7%) | 0 (0.0%) |
| $10,000 to $24,999 | 38 (9.3%) | 0 (0.0%) |
| $25,000 to $34,999 | 75 (18.3%) | 38 (6.5%) |
| $35,000 to $49,999 | 8 (2.0%) | 89 (15.3%) |
| $50,000 to $74,999 | 152 (37.2%) | 104 (17.9%) |
| $75,000 to $99,999 | 26 (6.4%) | 86 (14.8%) |
| $100,000 to $149,999 | 33 (8.1%) | 162 (27.8%) |
| $150,000 or more | 17 (4.2%) | 66 (11.3%) |
| Total | 409 (100.0%) | 582 (100.0%) |
Property Value to Household Income Ratio in Southside
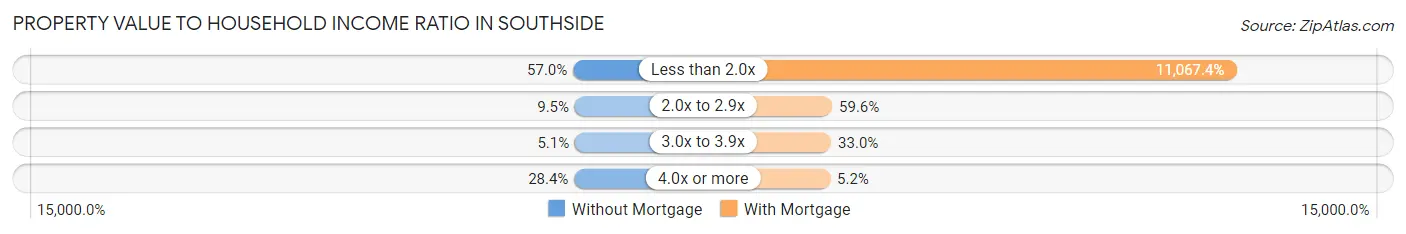
| Value-to-Income Ratio | Without Mortgage | With Mortgage |
| Less than 2.0x | 233 (57.0%) | 64,412 (11,067.4%) |
| 2.0x to 2.9x | 39 (9.5%) | 347 (59.6%) |
| 3.0x to 3.9x | 21 (5.1%) | 192 (33.0%) |
| 4.0x or more | 116 (28.4%) | 30 (5.1%) |
| Total | 409 (100.0%) | 582 (100.0%) |
Real Estate Taxes by Mortgage Status in Southside
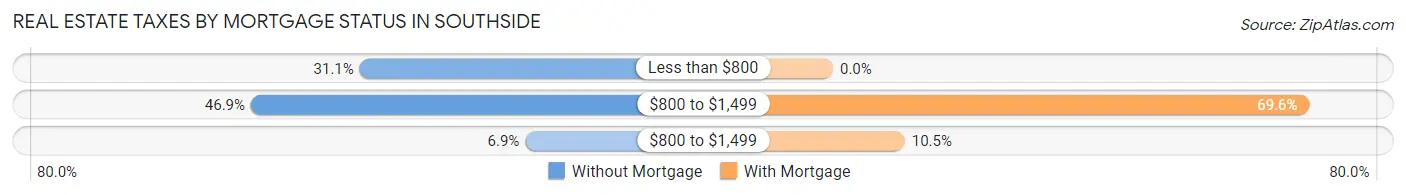
| Property Taxes | Without Mortgage | With Mortgage |
| Less than $800 | 127 (31.0%) | 0 (0.0%) |
| $800 to $1,499 | 192 (46.9%) | 405 (69.6%) |
| $800 to $1,499 | 28 (6.9%) | 61 (10.5%) |
| Total | 409 (100.0%) | 582 (100.0%) |
Health & Disability in Southside
Health Insurance Coverage by Age in Southside
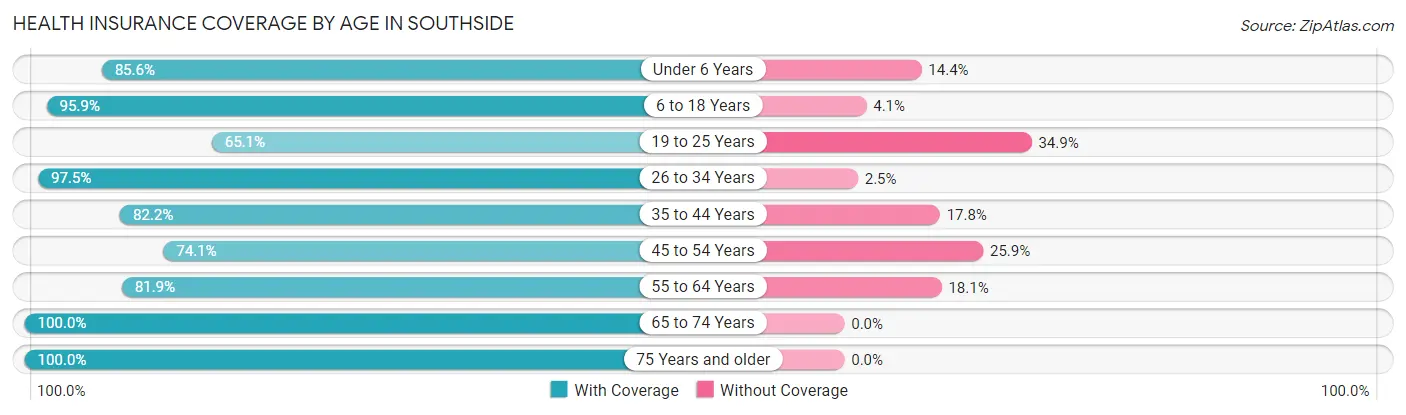
| Age Bracket | With Coverage | Without Coverage |
| Under 6 Years | 399 (85.6%) | 67 (14.4%) |
| 6 to 18 Years | 865 (95.9%) | 37 (4.1%) |
| 19 to 25 Years | 289 (65.1%) | 155 (34.9%) |
| 26 to 34 Years | 349 (97.5%) | 9 (2.5%) |
| 35 to 44 Years | 402 (82.2%) | 87 (17.8%) |
| 45 to 54 Years | 338 (74.1%) | 118 (25.9%) |
| 55 to 64 Years | 366 (81.9%) | 81 (18.1%) |
| 65 to 74 Years | 448 (100.0%) | 0 (0.0%) |
| 75 Years and older | 137 (100.0%) | 0 (0.0%) |
| Total | 3,593 (86.6%) | 554 (13.4%) |
Health Insurance Coverage by Citizenship Status in Southside
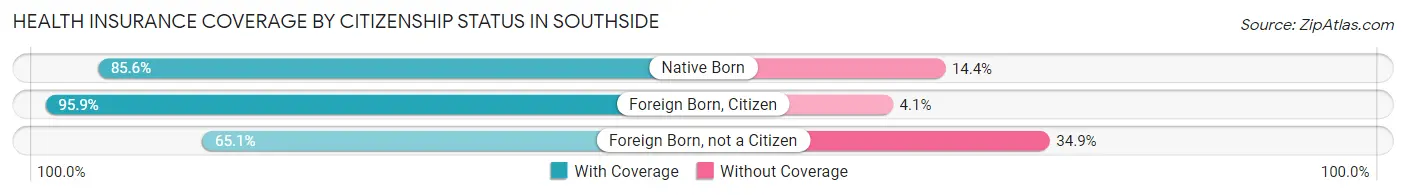
| Citizenship Status | With Coverage | Without Coverage |
| Native Born | 399 (85.6%) | 67 (14.4%) |
| Foreign Born, Citizen | 865 (95.9%) | 37 (4.1%) |
| Foreign Born, not a Citizen | 289 (65.1%) | 155 (34.9%) |
Health Insurance Coverage by Household Income in Southside
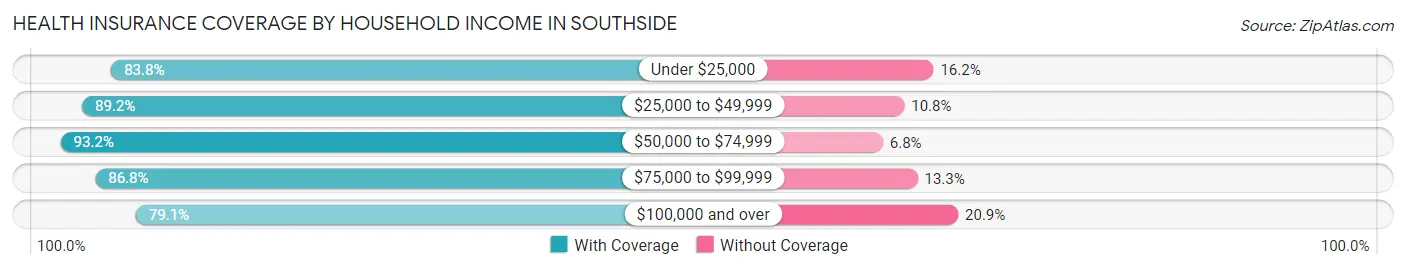
| Household Income | With Coverage | Without Coverage |
| Under $25,000 | 423 (83.8%) | 82 (16.2%) |
| $25,000 to $49,999 | 1,092 (89.2%) | 132 (10.8%) |
| $50,000 to $74,999 | 662 (93.2%) | 48 (6.8%) |
| $75,000 to $99,999 | 733 (86.8%) | 112 (13.3%) |
| $100,000 and over | 683 (79.1%) | 180 (20.9%) |
Public vs Private Health Insurance Coverage by Age in Southside
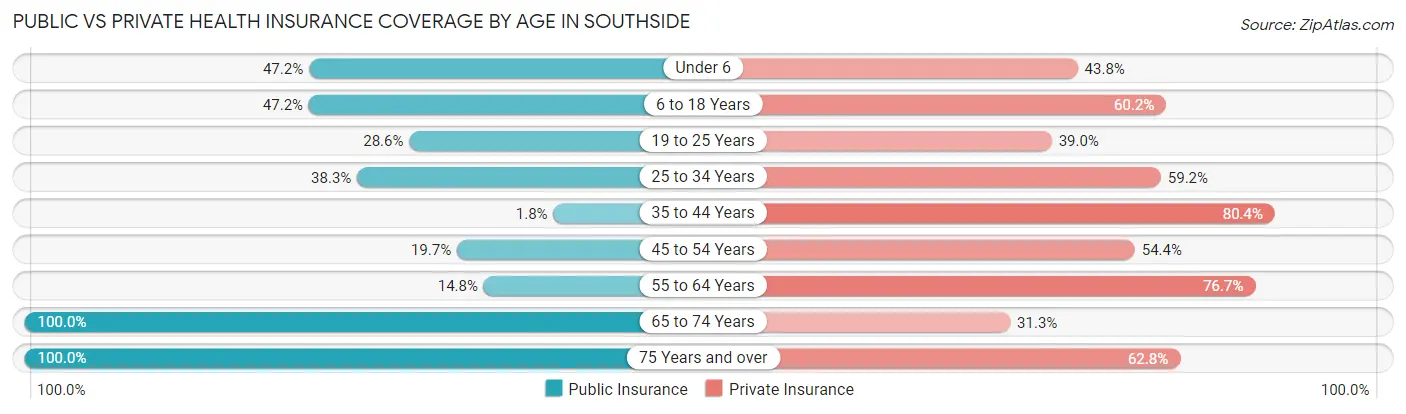
| Age Bracket | Public Insurance | Private Insurance |
| Under 6 | 220 (47.2%) | 204 (43.8%) |
| 6 to 18 Years | 426 (47.2%) | 543 (60.2%) |
| 19 to 25 Years | 127 (28.6%) | 173 (39.0%) |
| 25 to 34 Years | 137 (38.3%) | 212 (59.2%) |
| 35 to 44 Years | 9 (1.8%) | 393 (80.4%) |
| 45 to 54 Years | 90 (19.7%) | 248 (54.4%) |
| 55 to 64 Years | 66 (14.8%) | 343 (76.7%) |
| 65 to 74 Years | 448 (100.0%) | 140 (31.2%) |
| 75 Years and over | 137 (100.0%) | 86 (62.8%) |
| Total | 1,660 (40.0%) | 2,342 (56.5%) |
Disability Status by Sex by Age in Southside
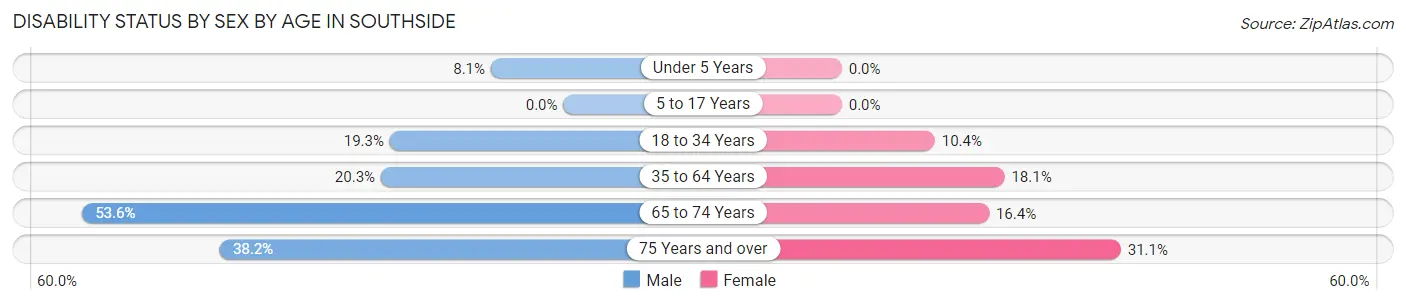
| Age Bracket | Male | Female |
| Under 5 Years | 13 (8.1%) | 0 (0.0%) |
| 5 to 17 Years | 0 (0.0%) | 0 (0.0%) |
| 18 to 34 Years | 110 (19.3%) | 35 (10.4%) |
| 35 to 64 Years | 127 (20.3%) | 139 (18.1%) |
| 65 to 74 Years | 142 (53.6%) | 30 (16.4%) |
| 75 Years and over | 13 (38.2%) | 32 (31.1%) |
Disability Class by Sex by Age in Southside
Disability Class: Hearing Difficulty
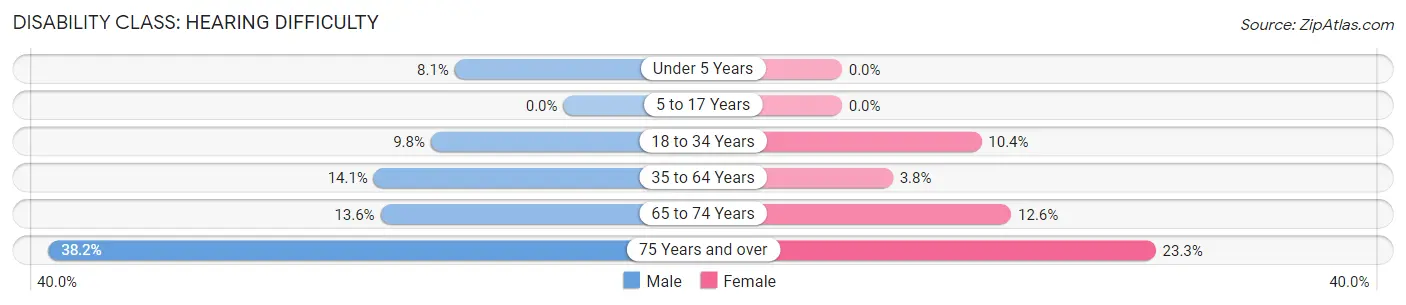
| Age Bracket | Male | Female |
| Under 5 Years | 13 (8.1%) | 0 (0.0%) |
| 5 to 17 Years | 0 (0.0%) | 0 (0.0%) |
| 18 to 34 Years | 56 (9.8%) | 35 (10.4%) |
| 35 to 64 Years | 88 (14.1%) | 29 (3.8%) |
| 65 to 74 Years | 36 (13.6%) | 23 (12.6%) |
| 75 Years and over | 13 (38.2%) | 24 (23.3%) |
Disability Class: Vision Difficulty
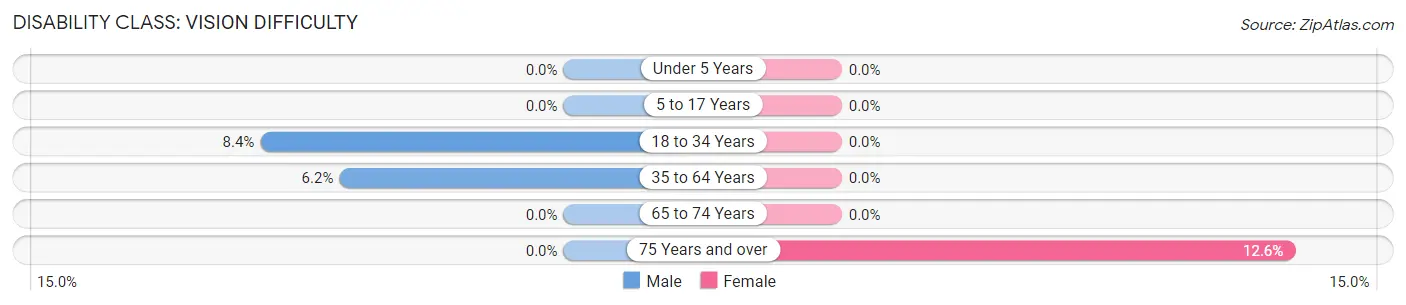
| Age Bracket | Male | Female |
| Under 5 Years | 0 (0.0%) | 0 (0.0%) |
| 5 to 17 Years | 0 (0.0%) | 0 (0.0%) |
| 18 to 34 Years | 48 (8.4%) | 0 (0.0%) |
| 35 to 64 Years | 39 (6.2%) | 0 (0.0%) |
| 65 to 74 Years | 0 (0.0%) | 0 (0.0%) |
| 75 Years and over | 0 (0.0%) | 13 (12.6%) |
Disability Class: Cognitive Difficulty
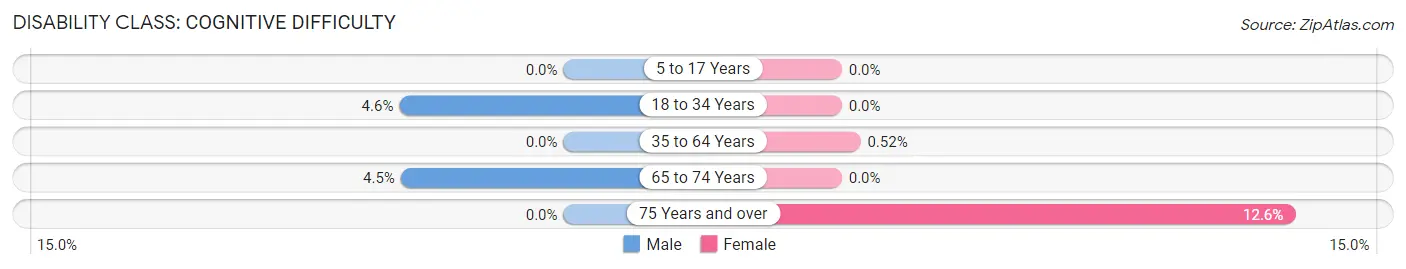
| Age Bracket | Male | Female |
| 5 to 17 Years | 0 (0.0%) | 0 (0.0%) |
| 18 to 34 Years | 26 (4.6%) | 0 (0.0%) |
| 35 to 64 Years | 0 (0.0%) | 4 (0.5%) |
| 65 to 74 Years | 12 (4.5%) | 0 (0.0%) |
| 75 Years and over | 0 (0.0%) | 13 (12.6%) |
Disability Class: Ambulatory Difficulty
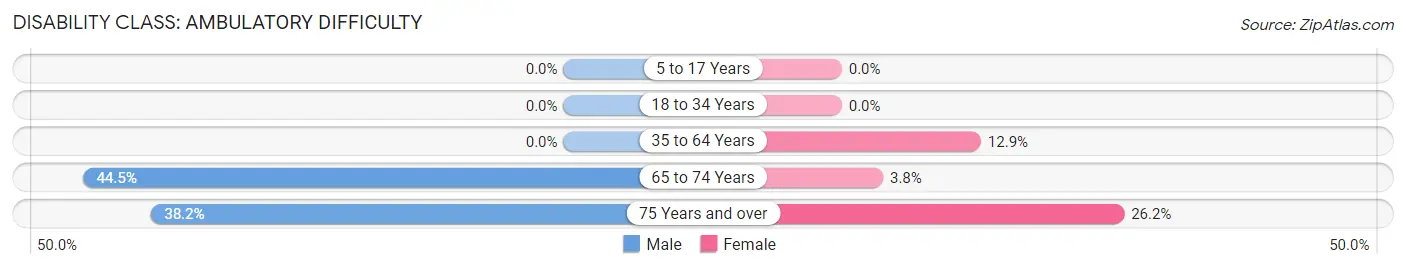
| Age Bracket | Male | Female |
| 5 to 17 Years | 0 (0.0%) | 0 (0.0%) |
| 18 to 34 Years | 0 (0.0%) | 0 (0.0%) |
| 35 to 64 Years | 0 (0.0%) | 99 (12.9%) |
| 65 to 74 Years | 118 (44.5%) | 7 (3.8%) |
| 75 Years and over | 13 (38.2%) | 27 (26.2%) |
Disability Class: Self-Care Difficulty
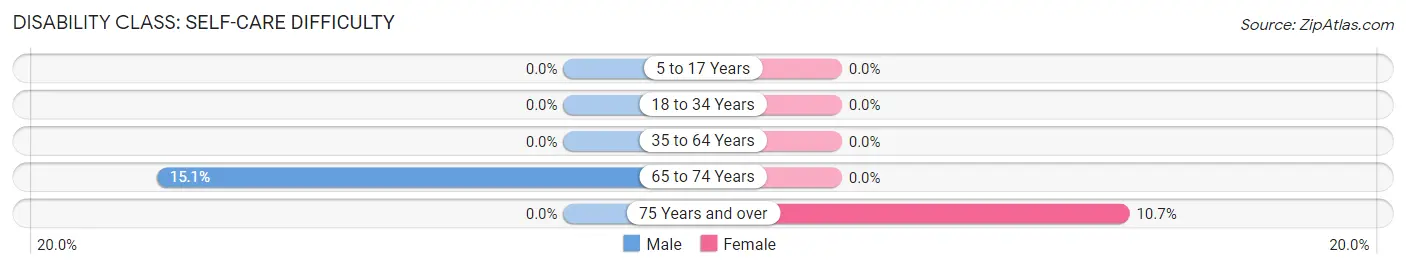
| Age Bracket | Male | Female |
| 5 to 17 Years | 0 (0.0%) | 0 (0.0%) |
| 18 to 34 Years | 0 (0.0%) | 0 (0.0%) |
| 35 to 64 Years | 0 (0.0%) | 0 (0.0%) |
| 65 to 74 Years | 40 (15.1%) | 0 (0.0%) |
| 75 Years and over | 0 (0.0%) | 11 (10.7%) |
Technology Access in Southside
Computing Device Access in Southside
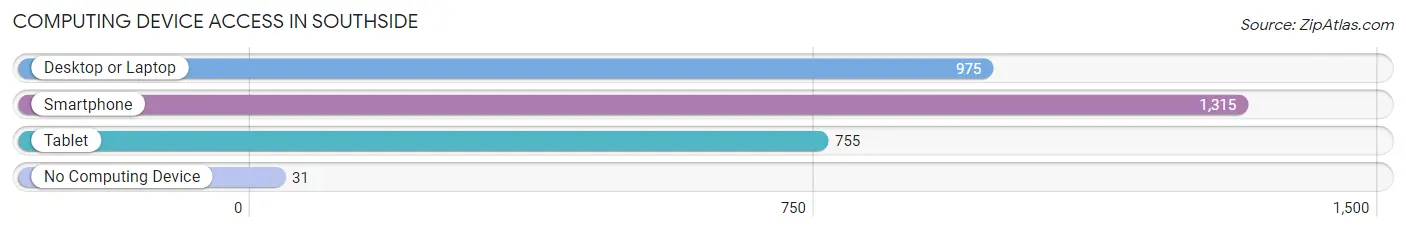
| Device Type | # Households | % Households |
| Desktop or Laptop | 975 | 70.7% |
| Smartphone | 1,315 | 95.4% |
| Tablet | 755 | 54.7% |
| No Computing Device | 31 | 2.2% |
| Total | 1,379 | 100.0% |
Internet Access in Southside
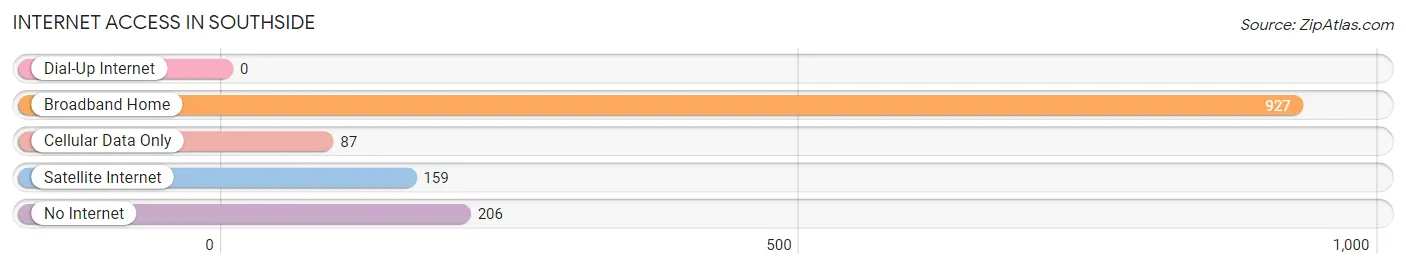
| Internet Type | # Households | % Households |
| Dial-Up Internet | 0 | 0.0% |
| Broadband Home | 927 | 67.2% |
| Cellular Data Only | 87 | 6.3% |
| Satellite Internet | 159 | 11.5% |
| No Internet | 206 | 14.9% |
| Total | 1,379 | 100.0% |
Southside Summary
Southside is a city located in the state of Arkansas, in the United States. It is located in the northwest corner of the state, in the foothills of the Ozark Mountains. The city is situated on the banks of the White River, and is part of the Fort Smith metropolitan area. As of the 2010 census, the population of Southside was 4,945.
History
Southside was founded in 1872, when the first settlers arrived in the area. The city was originally known as "Southside Station", due to its location on the south side of the White River. The city was incorporated in 1887, and was named after the nearby town of Southside, which had been established in 1871.
The city grew rapidly in the late 19th and early 20th centuries, due to its location on the White River and its proximity to the railroad. The city was a major hub for the timber industry, and was home to several sawmills and lumber companies. The city also had a thriving agricultural industry, and was home to several cotton gins and grist mills.
Geography
Southside is located in the northwest corner of Arkansas, in the foothills of the Ozark Mountains. The city is situated on the banks of the White River, and is part of the Fort Smith metropolitan area. The city has a total area of 4.2 square miles, all of which is land.
The city is located in a humid subtropical climate zone, with hot, humid summers and mild winters. The average annual temperature is 63°F, and the average annual precipitation is 48 inches.
Economy
Southside's economy is largely based on agriculture and manufacturing. The city is home to several large poultry processing plants, as well as several smaller food processing plants. The city is also home to several lumber mills and sawmills, as well as several cotton gins and grist mills.
The city is also home to several retail stores, restaurants, and other businesses. The city is served by several major highways, including Interstate 40, US Highway 71, and Arkansas Highway 22.
Demographics
As of the 2010 census, the population of Southside was 4,945. The racial makeup of the city was 79.3% White, 17.2% African American, 0.5% Native American, 0.3% Asian, 0.1% Pacific Islander, 1.2% from other races, and 1.5% from two or more races. Hispanic or Latino of any race were 3.2% of the population.
The median income for a household in the city was $35,938, and the median income for a family was $41,944. The per capita income for the city was $17,845. About 16.2% of the population was below the poverty line.
Common Questions
What is Per Capita Income in Southside?
Per Capita income in Southside is $19,274.
What is the Median Family Income in Southside?
Median Family Income in Southside is $55,106.
What is the Median Household income in Southside?
Median Household Income in Southside is $49,063.
What is Income or Wage Gap in Southside?
Income or Wage Gap in Southside is 17.1%.
Women in Southside earn 82.9 cents for every dollar earned by a man.
What is Inequality or Gini Index in Southside?
Inequality or Gini Index in Southside is 0.38.
What is the Total Population of Southside?
Total Population of Southside is 4,247.
What is the Total Male Population of Southside?
Total Male Population of Southside is 1,931.
What is the Total Female Population of Southside?
Total Female Population of Southside is 2,316.
What is the Ratio of Males per 100 Females in Southside?
There are 83.38 Males per 100 Females in Southside.
What is the Ratio of Females per 100 Males in Southside?
There are 119.94 Females per 100 Males in Southside.
What is the Median Population Age in Southside?
Median Population Age in Southside is 34.4 Years.
What is the Average Family Size in Southside
Average Family Size in Southside is 3.4 People.
What is the Average Household Size in Southside
Average Household Size in Southside is 3.0 People.
How Large is the Labor Force in Southside?
There are 1,931 People in the Labor Forcein in Southside.
What is the Percentage of People in the Labor Force in Southside?
62.5% of People are in the Labor Force in Southside.
What is the Unemployment Rate in Southside?
Unemployment Rate in Southside is 6.6%.