Elkins, AR Map & Demographics
Elkins Map
Elkins Overview
$29,438
PER CAPITA INCOME
$83,333
AVG FAMILY INCOME
$72,940
AVG HOUSEHOLD INCOME
18.1%
WAGE / INCOME GAP [ % ]
81.9¢/ $1
WAGE / INCOME GAP [ $ ]
0.31
INEQUALITY / GINI INDEX
3,635
TOTAL POPULATION
1,929
MALE POPULATION
1,706
FEMALE POPULATION
113.07
MALES / 100 FEMALES
88.44
FEMALES / 100 MALES
34.7
MEDIAN AGE
3.2
AVG FAMILY SIZE
2.8
AVG HOUSEHOLD SIZE
1,864
LABOR FORCE [ PEOPLE ]
64.9%
PERCENT IN LABOR FORCE
1.4%
UNEMPLOYMENT RATE
Elkins Zip Codes
Elkins Area Codes
Income in Elkins
Income Overview in Elkins
Per Capita Income in Elkins is $29,438, while median incomes of families and households are $83,333 and $72,940 respectively.
| Characteristic | Number | Measure |
| Per Capita Income | 3,635 | $29,438 |
| Median Family Income | 966 | $83,333 |
| Mean Family Income | 966 | $88,130 |
| Median Household Income | 1,309 | $72,940 |
| Mean Household Income | 1,309 | $80,788 |
| Income Deficit | 966 | $0 |
| Wage / Income Gap (%) | 3,635 | 18.12% |
| Wage / Income Gap ($) | 3,635 | 81.88¢ per $1 |
| Gini / Inequality Index | 3,635 | 0.31 |
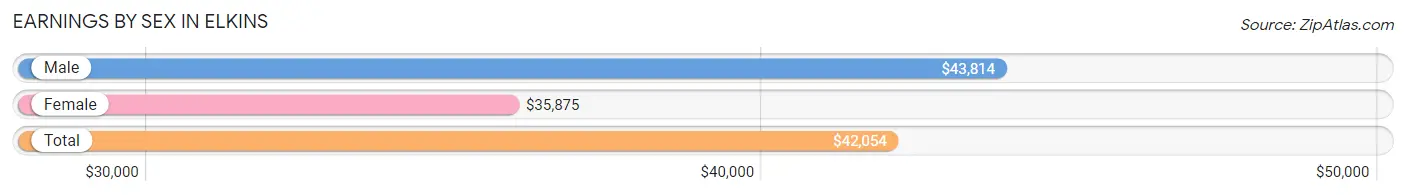
Earnings by Sex in Elkins
Average Earnings in Elkins are $42,054, $43,814 for men and $35,875 for women, a difference of 18.1%.
| Sex | Number | Average Earnings |
| Male | 1,094 (56.7%) | $43,814 |
| Female | 834 (43.3%) | $35,875 |
| Total | 1,928 (100.0%) | $42,054 |
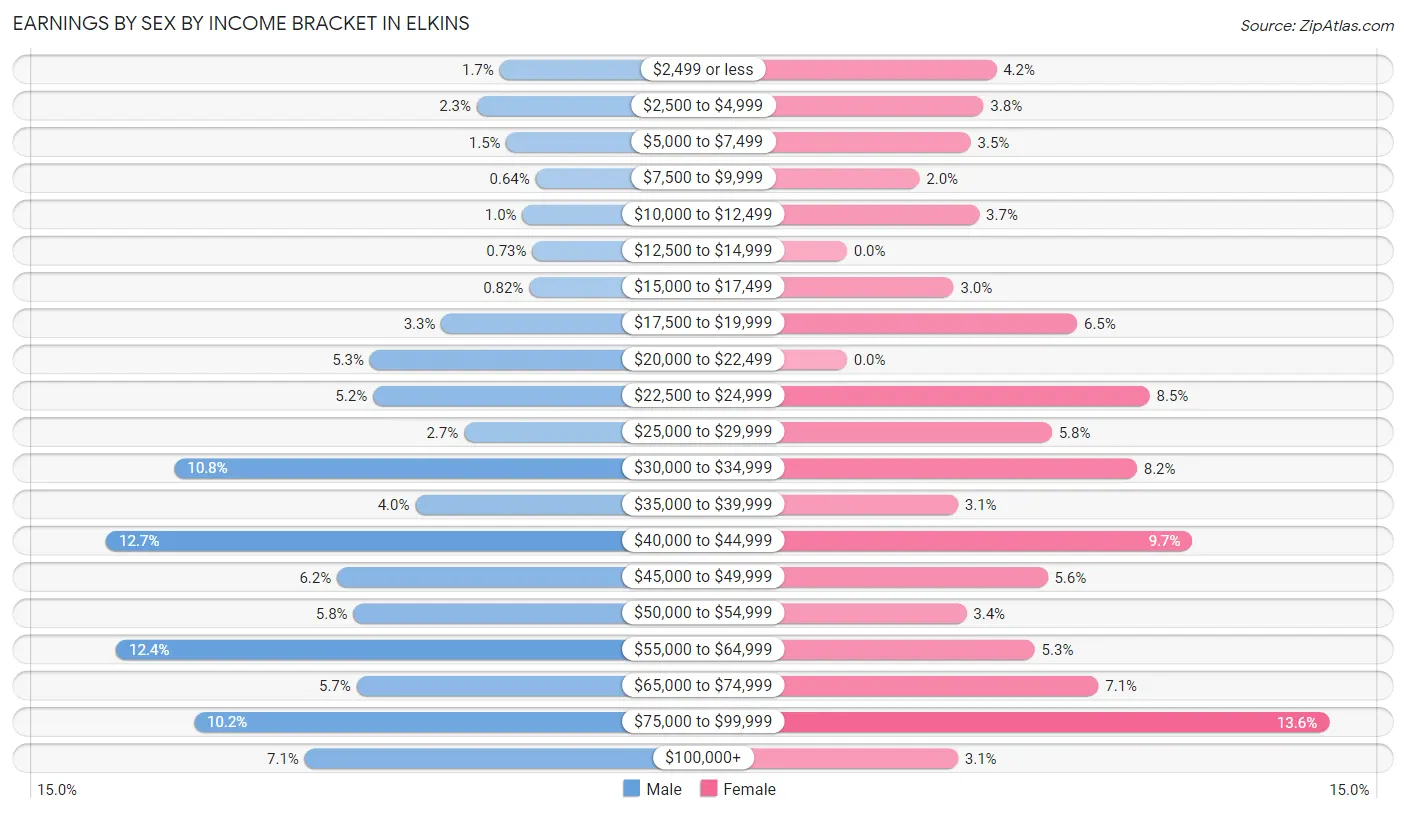
Earnings by Sex by Income Bracket in Elkins
The most common earnings brackets in Elkins are $40,000 to $44,999 for men (139 | 12.7%) and $75,000 to $99,999 for women (113 | 13.6%).
| Income | Male | Female |
| $2,499 or less | 18 (1.7%) | 35 (4.2%) |
| $2,500 to $4,999 | 25 (2.3%) | 32 (3.8%) |
| $5,000 to $7,499 | 16 (1.5%) | 29 (3.5%) |
| $7,500 to $9,999 | 7 (0.6%) | 17 (2.0%) |
| $10,000 to $12,499 | 11 (1.0%) | 31 (3.7%) |
| $12,500 to $14,999 | 8 (0.7%) | 0 (0.0%) |
| $15,000 to $17,499 | 9 (0.8%) | 25 (3.0%) |
| $17,500 to $19,999 | 36 (3.3%) | 54 (6.5%) |
| $20,000 to $22,499 | 58 (5.3%) | 0 (0.0%) |
| $22,500 to $24,999 | 57 (5.2%) | 71 (8.5%) |
| $25,000 to $29,999 | 29 (2.6%) | 48 (5.8%) |
| $30,000 to $34,999 | 118 (10.8%) | 68 (8.2%) |
| $35,000 to $39,999 | 44 (4.0%) | 26 (3.1%) |
| $40,000 to $44,999 | 139 (12.7%) | 81 (9.7%) |
| $45,000 to $49,999 | 68 (6.2%) | 47 (5.6%) |
| $50,000 to $54,999 | 63 (5.8%) | 28 (3.4%) |
| $55,000 to $64,999 | 136 (12.4%) | 44 (5.3%) |
| $65,000 to $74,999 | 62 (5.7%) | 59 (7.1%) |
| $75,000 to $99,999 | 112 (10.2%) | 113 (13.6%) |
| $100,000+ | 78 (7.1%) | 26 (3.1%) |
| Total | 1,094 (100.0%) | 834 (100.0%) |
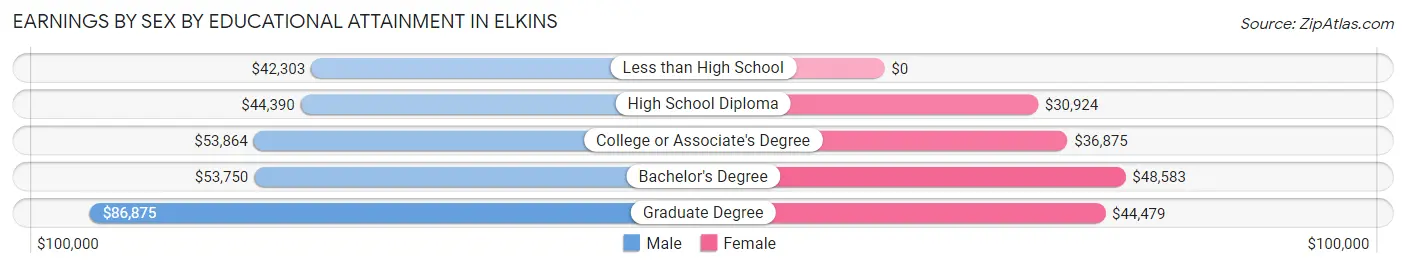
Earnings by Sex by Educational Attainment in Elkins
Average earnings in Elkins are $46,224 for men and $41,875 for women, a difference of 9.4%. Men with an educational attainment of graduate degree enjoy the highest average annual earnings of $86,875, while those with less than high school education earn the least with $42,303. Women with an educational attainment of bachelor's degree earn the most with the average annual earnings of $48,583, while those with high school diploma education have the smallest earnings of $30,924.
| Educational Attainment | Male Income | Female Income |
| Less than High School | $42,303 | $0 |
| High School Diploma | $44,390 | $30,924 |
| College or Associate's Degree | $53,864 | $36,875 |
| Bachelor's Degree | $53,750 | $48,583 |
| Graduate Degree | $86,875 | $44,479 |
| Total | $46,224 | $41,875 |
Family Income in Elkins
Family Income Brackets in Elkins
According to the Elkins family income data, there are 247 families falling into the $50,000 to $74,999 income range, which is the most common income bracket and makes up 25.6% of all families.
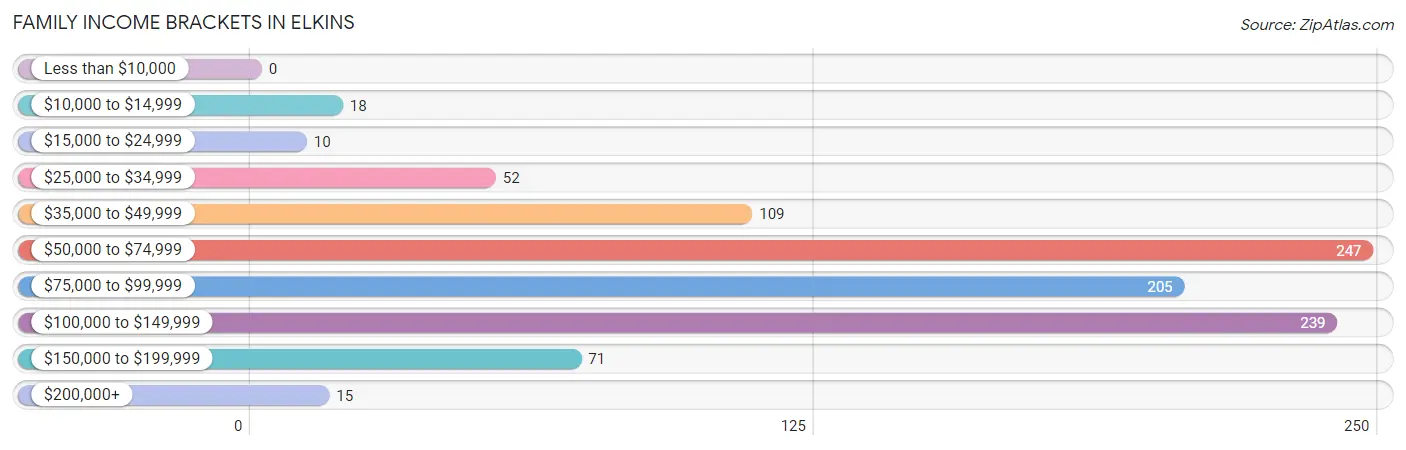
| Income Bracket | # Families | % Families |
| Less than $10,000 | 0 | 0.0% |
| $10,000 to $14,999 | 18 | 1.9% |
| $15,000 to $24,999 | 10 | 1.0% |
| $25,000 to $34,999 | 52 | 5.4% |
| $35,000 to $49,999 | 109 | 11.3% |
| $50,000 to $74,999 | 247 | 25.6% |
| $75,000 to $99,999 | 205 | 21.2% |
| $100,000 to $149,999 | 239 | 24.7% |
| $150,000 to $199,999 | 71 | 7.3% |
| $200,000+ | 15 | 1.6% |
Family Income by Famaliy Size in Elkins
4-person families (235 | 24.3%) account for the highest median family income in Elkins with $97,450 per family, while 2-person families (404 | 41.8%) have the highest median income of $32,143 per family member.
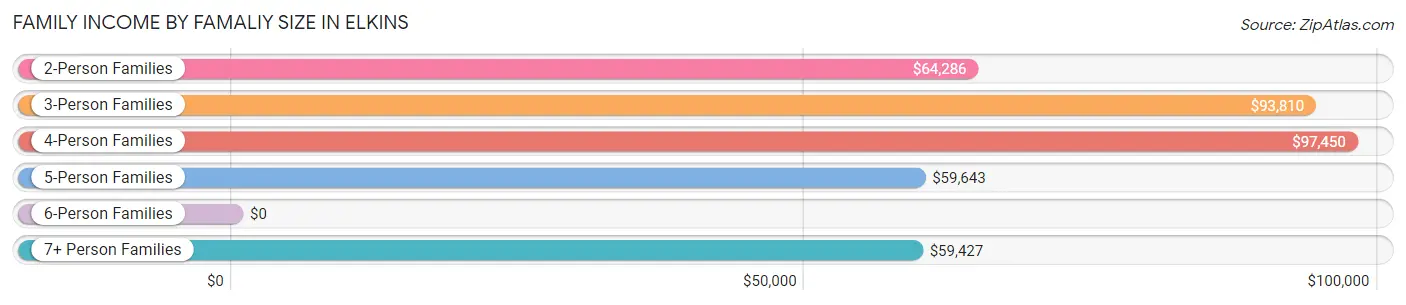
| Income Bracket | # Families | Median Income |
| 2-Person Families | 404 (41.8%) | $64,286 |
| 3-Person Families | 226 (23.4%) | $93,810 |
| 4-Person Families | 235 (24.3%) | $97,450 |
| 5-Person Families | 58 (6.0%) | $59,643 |
| 6-Person Families | 6 (0.6%) | $0 |
| 7+ Person Families | 37 (3.8%) | $59,427 |
| Total | 966 (100.0%) | $83,333 |
Family Income by Number of Earners in Elkins
The median family income in Elkins is $83,333, with families comprising 3+ earners (74) having the highest median family income of $135,000, while families with no earners (166) have the lowest median family income of $52,885, accounting for 7.7% and 17.2% of families, respectively.
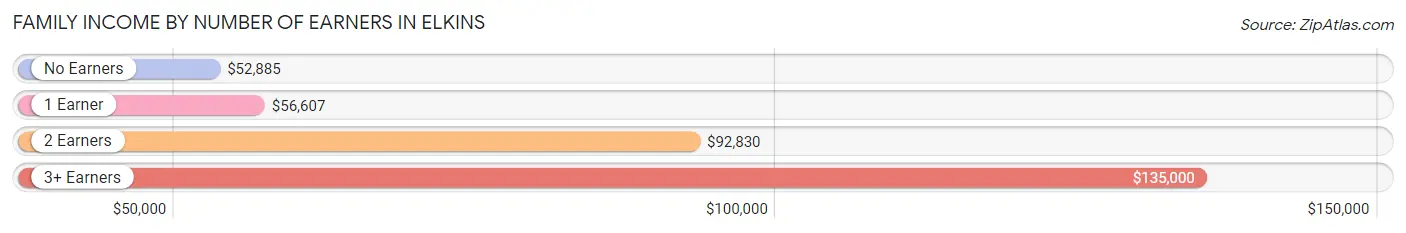
| Number of Earners | # Families | Median Income |
| No Earners | 166 (17.2%) | $52,885 |
| 1 Earner | 176 (18.2%) | $56,607 |
| 2 Earners | 550 (56.9%) | $92,830 |
| 3+ Earners | 74 (7.7%) | $135,000 |
| Total | 966 (100.0%) | $83,333 |
Household Income in Elkins
Household Income Brackets in Elkins
With 359 households falling in the category, the $50,000 to $74,999 income range is the most frequent in Elkins, accounting for 27.4% of all households. In contrast, only 21 households (1.6%) fall into the less than $10,000 income bracket, making it the least populous group.
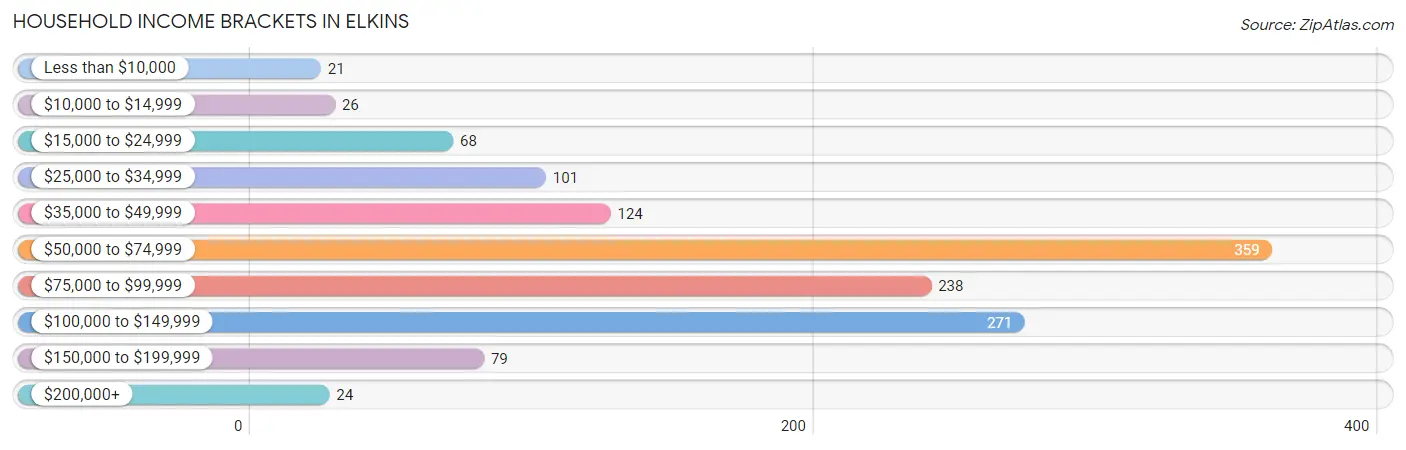
| Income Bracket | # Households | % Households |
| Less than $10,000 | 21 | 1.6% |
| $10,000 to $14,999 | 26 | 2.0% |
| $15,000 to $24,999 | 68 | 5.2% |
| $25,000 to $34,999 | 101 | 7.7% |
| $35,000 to $49,999 | 124 | 9.5% |
| $50,000 to $74,999 | 359 | 27.4% |
| $75,000 to $99,999 | 238 | 18.2% |
| $100,000 to $149,999 | 271 | 20.7% |
| $150,000 to $199,999 | 79 | 6.0% |
| $200,000+ | 24 | 1.8% |
Household Income by Householder Age in Elkins
The median household income in Elkins is $72,940, with the highest median household income of $137,632 found in the 15 to 24 years age bracket for the primary householder. A total of 36 households (2.8%) fall into this category. Meanwhile, the 65+ years age bracket for the primary householder has the lowest median household income of $40,000, with 326 households (24.9%) in this group.
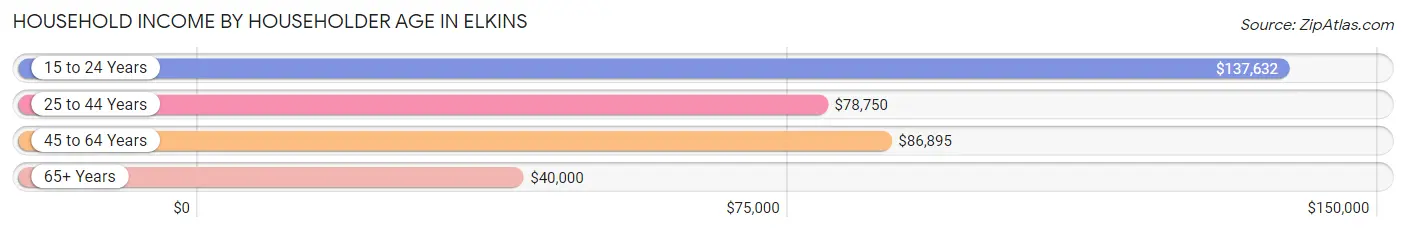
| Income Bracket | # Households | Median Income |
| 15 to 24 Years | 36 (2.8%) | $137,632 |
| 25 to 44 Years | 506 (38.7%) | $78,750 |
| 45 to 64 Years | 441 (33.7%) | $86,895 |
| 65+ Years | 326 (24.9%) | $40,000 |
| Total | 1,309 (100.0%) | $72,940 |
Poverty in Elkins
Income Below Poverty by Sex and Age in Elkins
With 6.3% poverty level for males and 4.6% for females among the residents of Elkins, 65 to 74 year old males and 16 and 17 year old females are the most vulnerable to poverty, with 21 males (22.8%) and 22 females (28.6%) in their respective age groups living below the poverty level.
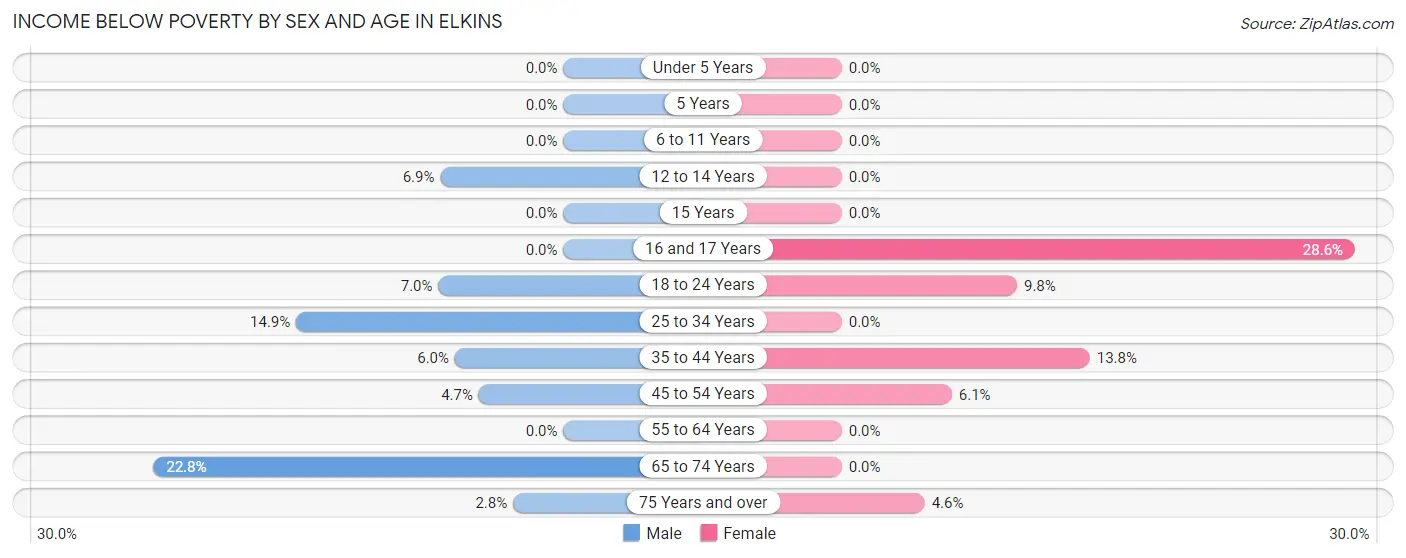
| Age Bracket | Male | Female |
| Under 5 Years | 0 (0.0%) | 0 (0.0%) |
| 5 Years | 0 (0.0%) | 0 (0.0%) |
| 6 to 11 Years | 0 (0.0%) | 0 (0.0%) |
| 12 to 14 Years | 5 (6.9%) | 0 (0.0%) |
| 15 Years | 0 (0.0%) | 0 (0.0%) |
| 16 and 17 Years | 0 (0.0%) | 22 (28.6%) |
| 18 to 24 Years | 16 (7.0%) | 8 (9.8%) |
| 25 to 34 Years | 50 (14.9%) | 0 (0.0%) |
| 35 to 44 Years | 16 (6.0%) | 29 (13.8%) |
| 45 to 54 Years | 8 (4.7%) | 13 (6.1%) |
| 55 to 64 Years | 0 (0.0%) | 0 (0.0%) |
| 65 to 74 Years | 21 (22.8%) | 0 (0.0%) |
| 75 Years and over | 4 (2.8%) | 6 (4.6%) |
| Total | 120 (6.3%) | 78 (4.6%) |
Income Above Poverty by Sex and Age in Elkins
According to the poverty statistics in Elkins, males aged under 5 years and females aged under 5 years are the age groups that are most secure financially, with 100.0% of males and 100.0% of females in these age groups living above the poverty line.
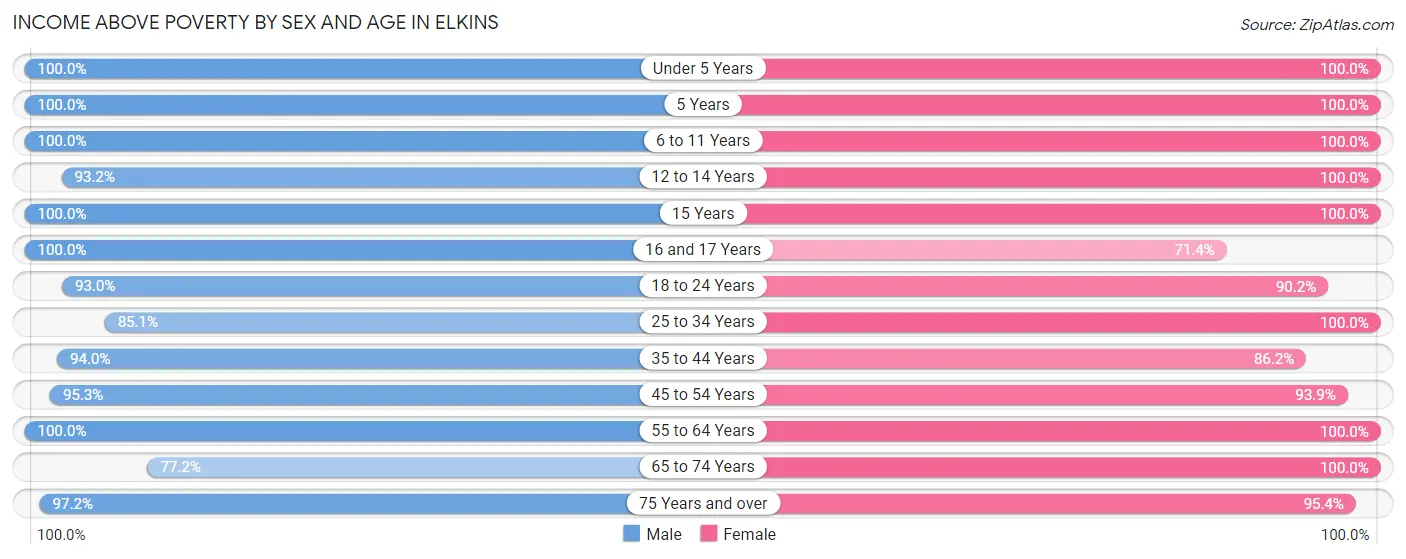
| Age Bracket | Male | Female |
| Under 5 Years | 119 (100.0%) | 87 (100.0%) |
| 5 Years | 39 (100.0%) | 26 (100.0%) |
| 6 to 11 Years | 154 (100.0%) | 144 (100.0%) |
| 12 to 14 Years | 68 (93.1%) | 85 (100.0%) |
| 15 Years | 8 (100.0%) | 16 (100.0%) |
| 16 and 17 Years | 57 (100.0%) | 55 (71.4%) |
| 18 to 24 Years | 214 (93.0%) | 74 (90.2%) |
| 25 to 34 Years | 286 (85.1%) | 290 (100.0%) |
| 35 to 44 Years | 249 (94.0%) | 181 (86.2%) |
| 45 to 54 Years | 162 (95.3%) | 199 (93.9%) |
| 55 to 64 Years | 231 (100.0%) | 196 (100.0%) |
| 65 to 74 Years | 71 (77.2%) | 151 (100.0%) |
| 75 Years and over | 139 (97.2%) | 124 (95.4%) |
| Total | 1,797 (93.7%) | 1,628 (95.4%) |
Income Below Poverty Among Married-Couple Families in Elkins
The poverty statistics for married-couple families in Elkins show that 1.0% or 8 of the total 824 families live below the poverty line. Families with no children have the highest poverty rate of 1.8%, comprising of 8 families. On the other hand, families with 1 or 2 children have the lowest poverty rate of 0.0%, which includes 0 families.
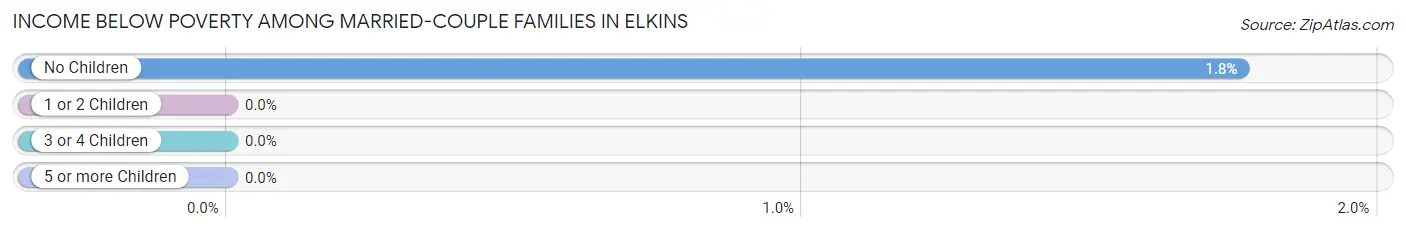
| Children | Above Poverty | Below Poverty |
| No Children | 446 (98.2%) | 8 (1.8%) |
| 1 or 2 Children | 294 (100.0%) | 0 (0.0%) |
| 3 or 4 Children | 70 (100.0%) | 0 (0.0%) |
| 5 or more Children | 6 (100.0%) | 0 (0.0%) |
| Total | 816 (99.0%) | 8 (1.0%) |
Income Below Poverty Among Single-Parent Households in Elkins
According to the poverty data in Elkins, 40.0% or 10 single-father households and 8.6% or 10 single-mother households are living below the poverty line. Among single-father households, those with no children have the highest poverty rate, with 10 households (100.0%) experiencing poverty. Likewise, among single-mother households, those with 1 or 2 children have the highest poverty rate, with 10 households (13.3%) falling below the poverty line.
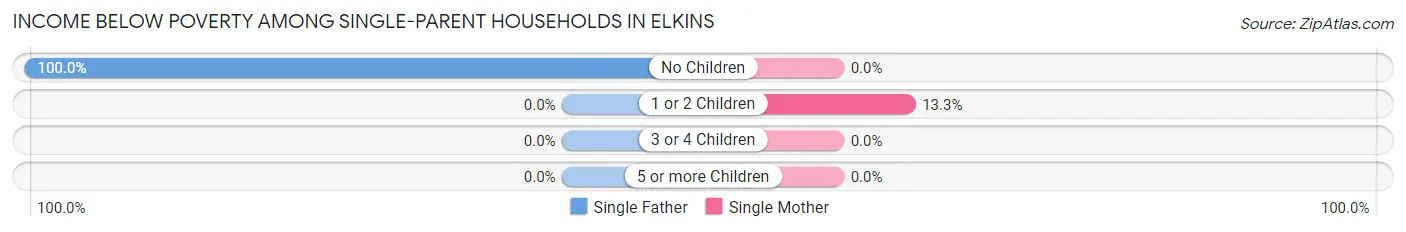
| Children | Single Father | Single Mother |
| No Children | 10 (100.0%) | 0 (0.0%) |
| 1 or 2 Children | 0 (0.0%) | 10 (13.3%) |
| 3 or 4 Children | 0 (0.0%) | 0 (0.0%) |
| 5 or more Children | 0 (0.0%) | 0 (0.0%) |
| Total | 10 (40.0%) | 10 (8.6%) |
Income Below Poverty Among Married-Couple vs Single-Parent Households in Elkins
The poverty data for Elkins shows that 8 of the married-couple family households (1.0%) and 20 of the single-parent households (14.1%) are living below the poverty level. Within the married-couple family households, those with no children have the highest poverty rate, with 8 households (1.8%) falling below the poverty line. Among the single-parent households, those with no children have the highest poverty rate, with 10 household (25.6%) living below poverty.
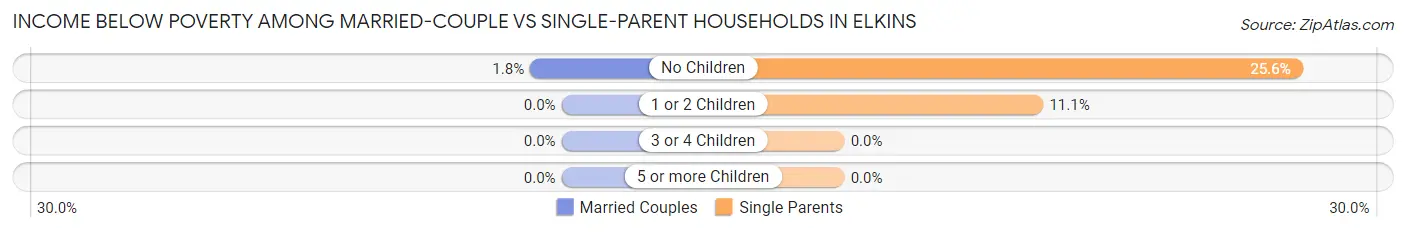
| Children | Married-Couple Families | Single-Parent Households |
| No Children | 8 (1.8%) | 10 (25.6%) |
| 1 or 2 Children | 0 (0.0%) | 10 (11.1%) |
| 3 or 4 Children | 0 (0.0%) | 0 (0.0%) |
| 5 or more Children | 0 (0.0%) | 0 (0.0%) |
| Total | 8 (1.0%) | 20 (14.1%) |
Race in Elkins
The most populous races in Elkins are White / Caucasian (3,045 | 83.8%), Hispanic or Latino (401 | 11.0%), and Some other Race (319 | 8.8%).
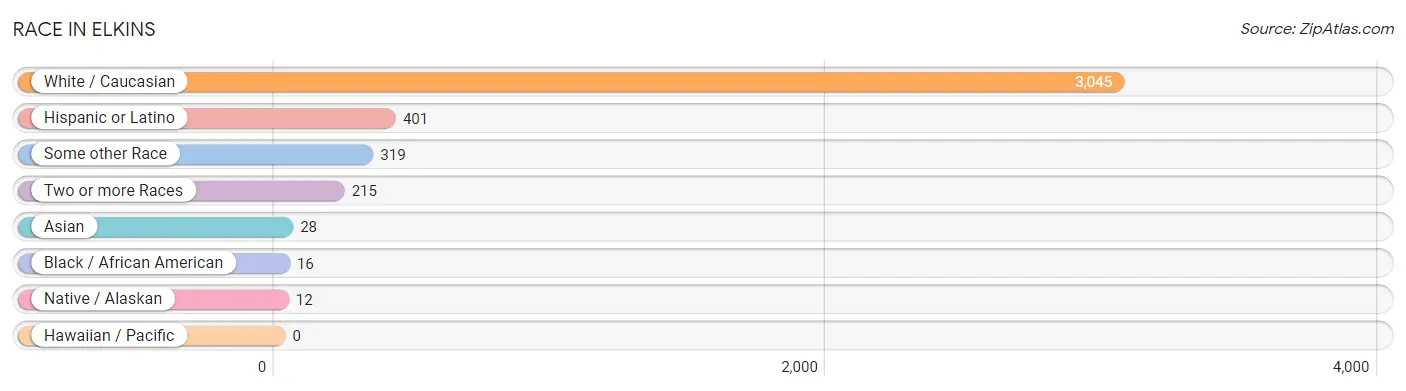
| Race | # Population | % Population |
| Asian | 28 | 0.8% |
| Black / African American | 16 | 0.4% |
| Hawaiian / Pacific | 0 | 0.0% |
| Hispanic or Latino | 401 | 11.0% |
| Native / Alaskan | 12 | 0.3% |
| White / Caucasian | 3,045 | 83.8% |
| Two or more Races | 215 | 5.9% |
| Some other Race | 319 | 8.8% |
| Total | 3,635 | 100.0% |
Ancestry in Elkins
The most populous ancestries reported in Elkins are English (535 | 14.7%), German (527 | 14.5%), Irish (365 | 10.0%), American (340 | 9.3%), and Mexican (322 | 8.9%), together accounting for 57.5% of all Elkins residents.
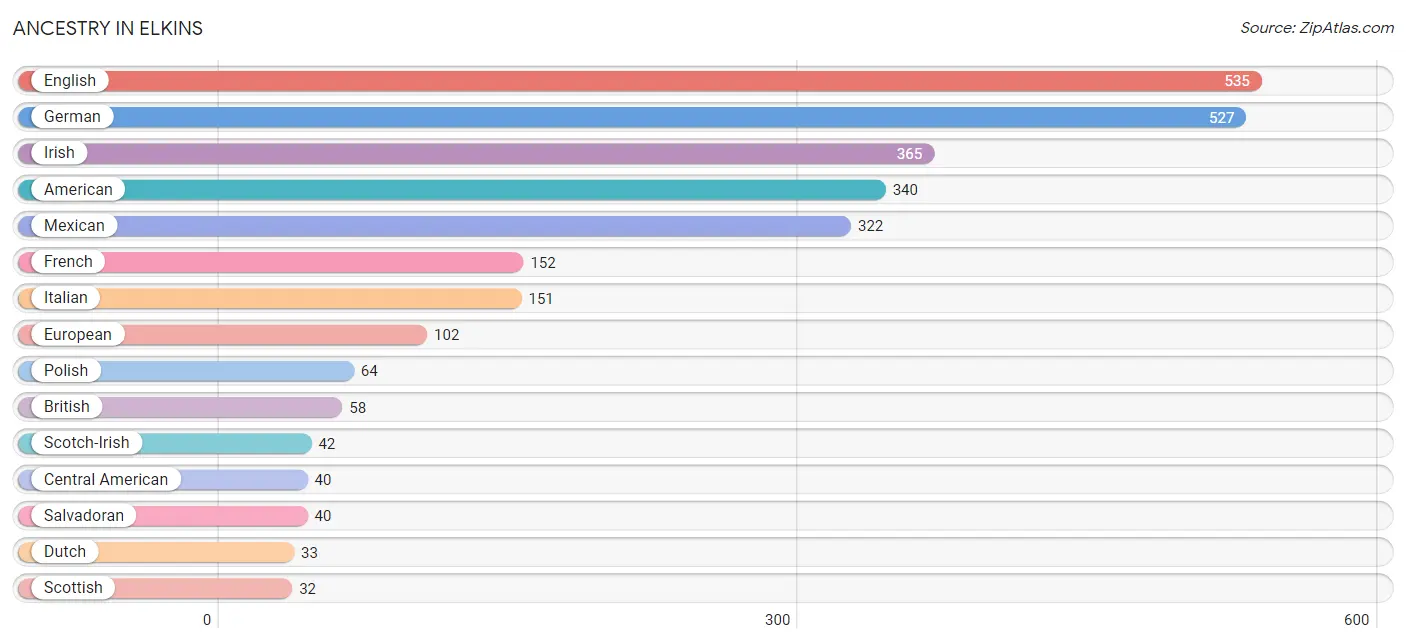
| Ancestry | # Population | % Population |
| American | 340 | 9.3% |
| British | 58 | 1.6% |
| Central American | 40 | 1.1% |
| Cherokee | 24 | 0.7% |
| Czech | 9 | 0.3% |
| Dutch | 33 | 0.9% |
| English | 535 | 14.7% |
| European | 102 | 2.8% |
| French | 152 | 4.2% |
| German | 527 | 14.5% |
| Irish | 365 | 10.0% |
| Italian | 151 | 4.2% |
| Mexican | 322 | 8.9% |
| Mongolian | 2 | 0.1% |
| Northern European | 16 | 0.4% |
| Norwegian | 7 | 0.2% |
| Polish | 64 | 1.8% |
| Puerto Rican | 11 | 0.3% |
| Salvadoran | 40 | 1.1% |
| Scandinavian | 19 | 0.5% |
| Scotch-Irish | 42 | 1.2% |
| Scottish | 32 | 0.9% |
| Spaniard | 10 | 0.3% |
| Spanish | 18 | 0.5% |
| Swedish | 3 | 0.1% |
| Ukrainian | 25 | 0.7% |
| Welsh | 9 | 0.3% | View All 27 Rows |
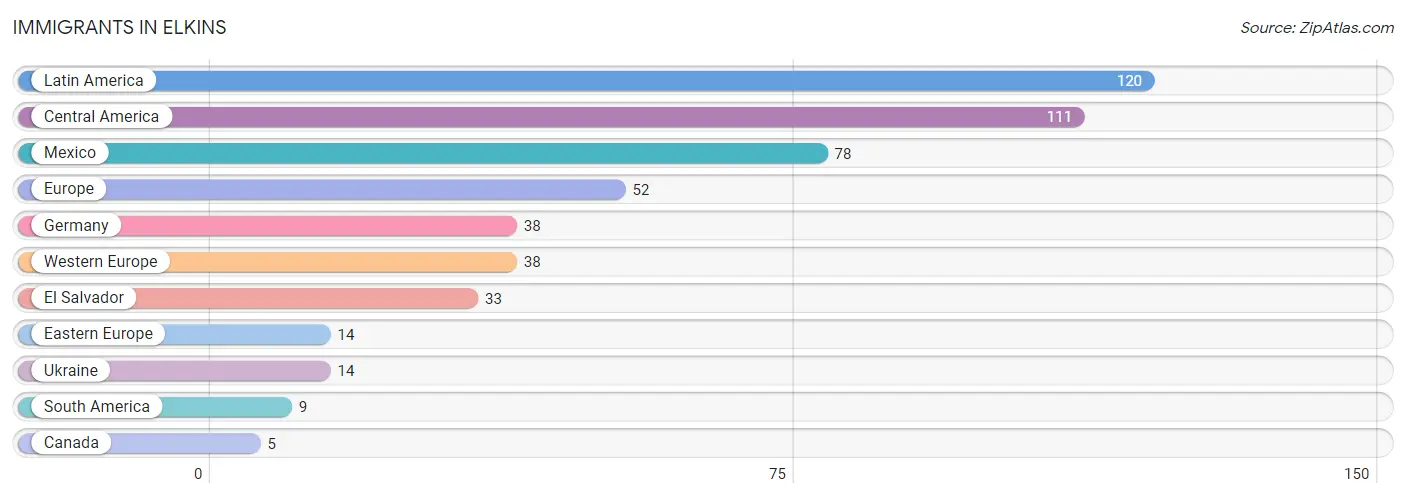
Immigrants in Elkins
The most numerous immigrant groups reported in Elkins came from Latin America (120 | 3.3%), Central America (111 | 3.0%), Mexico (78 | 2.1%), Europe (52 | 1.4%), and Germany (38 | 1.1%), together accounting for 11.0% of all Elkins residents.
| Immigration Origin | # Population | % Population |
| Canada | 5 | 0.1% |
| Central America | 111 | 3.0% |
| Eastern Europe | 14 | 0.4% |
| El Salvador | 33 | 0.9% |
| Europe | 52 | 1.4% |
| Germany | 38 | 1.1% |
| Latin America | 120 | 3.3% |
| Mexico | 78 | 2.1% |
| South America | 9 | 0.3% |
| Ukraine | 14 | 0.4% |
| Western Europe | 38 | 1.1% | View All 11 Rows |
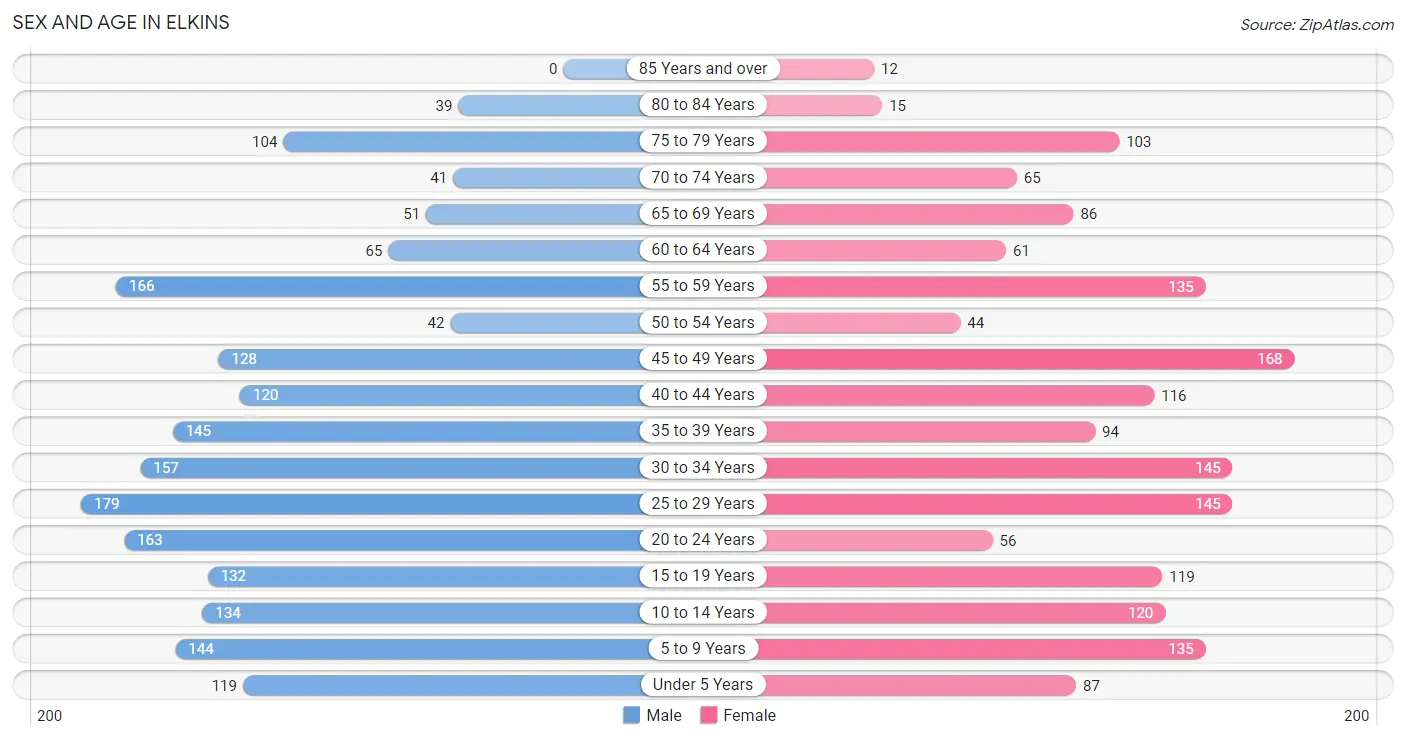
Sex and Age in Elkins
Sex and Age in Elkins
The most populous age groups in Elkins are 25 to 29 Years (179 | 9.3%) for men and 45 to 49 Years (168 | 9.9%) for women.
| Age Bracket | Male | Female |
| Under 5 Years | 119 (6.2%) | 87 (5.1%) |
| 5 to 9 Years | 144 (7.5%) | 135 (7.9%) |
| 10 to 14 Years | 134 (7.0%) | 120 (7.0%) |
| 15 to 19 Years | 132 (6.8%) | 119 (7.0%) |
| 20 to 24 Years | 163 (8.5%) | 56 (3.3%) |
| 25 to 29 Years | 179 (9.3%) | 145 (8.5%) |
| 30 to 34 Years | 157 (8.1%) | 145 (8.5%) |
| 35 to 39 Years | 145 (7.5%) | 94 (5.5%) |
| 40 to 44 Years | 120 (6.2%) | 116 (6.8%) |
| 45 to 49 Years | 128 (6.6%) | 168 (9.9%) |
| 50 to 54 Years | 42 (2.2%) | 44 (2.6%) |
| 55 to 59 Years | 166 (8.6%) | 135 (7.9%) |
| 60 to 64 Years | 65 (3.4%) | 61 (3.6%) |
| 65 to 69 Years | 51 (2.6%) | 86 (5.0%) |
| 70 to 74 Years | 41 (2.1%) | 65 (3.8%) |
| 75 to 79 Years | 104 (5.4%) | 103 (6.0%) |
| 80 to 84 Years | 39 (2.0%) | 15 (0.9%) |
| 85 Years and over | 0 (0.0%) | 12 (0.7%) |
| Total | 1,929 (100.0%) | 1,706 (100.0%) |
Families and Households in Elkins
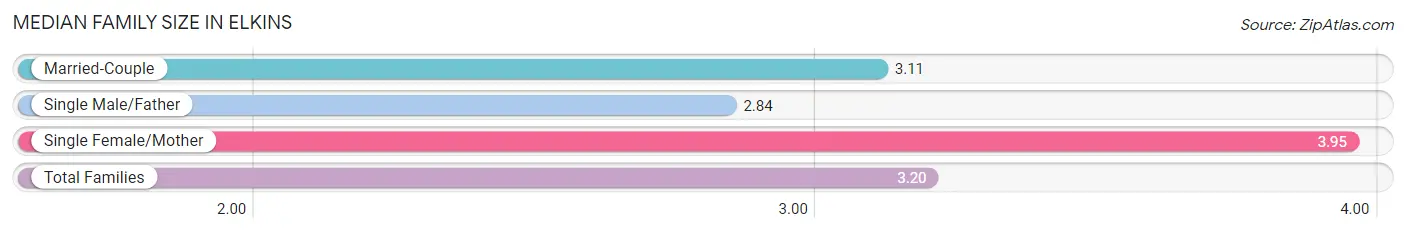
Median Family Size in Elkins
The median family size in Elkins is 3.20 persons per family, with single female/mother families (117 | 12.1%) accounting for the largest median family size of 3.95 persons per family. On the other hand, single male/father families (25 | 2.6%) represent the smallest median family size with 2.84 persons per family.
| Family Type | # Families | Family Size |
| Married-Couple | 824 (85.3%) | 3.11 |
| Single Male/Father | 25 (2.6%) | 2.84 |
| Single Female/Mother | 117 (12.1%) | 3.95 |
| Total Families | 966 (100.0%) | 3.20 |
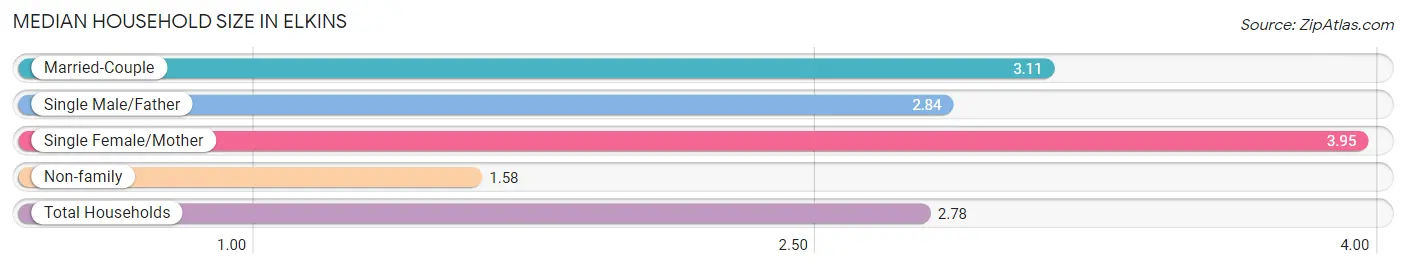
Median Household Size in Elkins
The median household size in Elkins is 2.78 persons per household, with single female/mother households (117 | 8.9%) accounting for the largest median household size of 3.95 persons per household. non-family households (343 | 26.2%) represent the smallest median household size with 1.58 persons per household.
| Household Type | # Households | Household Size |
| Married-Couple | 824 (62.9%) | 3.11 |
| Single Male/Father | 25 (1.9%) | 2.84 |
| Single Female/Mother | 117 (8.9%) | 3.95 |
| Non-family | 343 (26.2%) | 1.58 |
| Total Households | 1,309 (100.0%) | 2.78 |
Household Size by Marriage Status in Elkins
Out of a total of 1,309 households in Elkins, 966 (73.8%) are family households, while 343 (26.2%) are nonfamily households. The most numerous type of family households are 2-person households, comprising 404, and the most common type of nonfamily households are 1-person households, comprising 224.
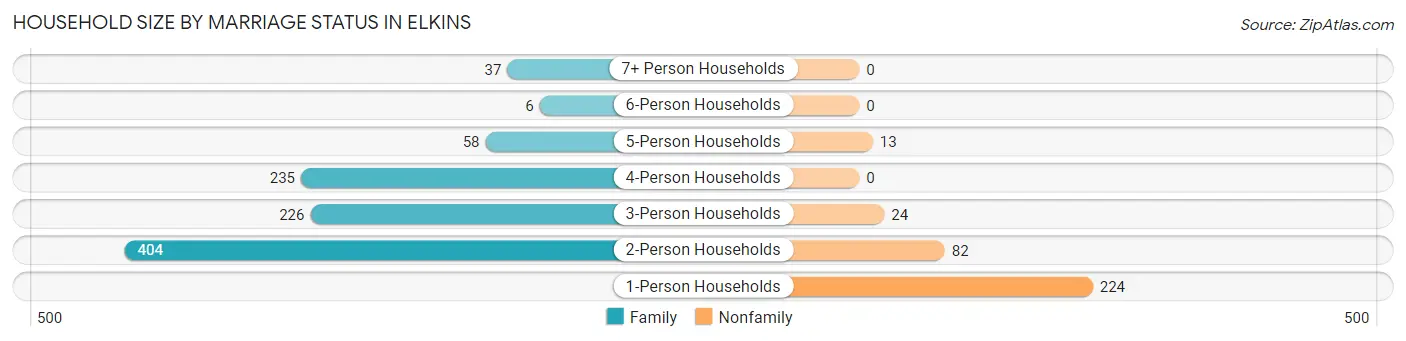
| Household Size | Family Households | Nonfamily Households |
| 1-Person Households | - | 224 (17.1%) |
| 2-Person Households | 404 (30.9%) | 82 (6.3%) |
| 3-Person Households | 226 (17.3%) | 24 (1.8%) |
| 4-Person Households | 235 (17.9%) | 0 (0.0%) |
| 5-Person Households | 58 (4.4%) | 13 (1.0%) |
| 6-Person Households | 6 (0.5%) | 0 (0.0%) |
| 7+ Person Households | 37 (2.8%) | 0 (0.0%) |
| Total | 966 (73.8%) | 343 (26.2%) |
Female Fertility in Elkins
Fertility by Age in Elkins
Average fertility rate in Elkins is 31.0 births per 1,000 women. Women in the age bracket of 20 to 34 years have the highest fertility rate with 75.0 births per 1,000 women. Women in the age bracket of 20 to 34 years acount for 100.0% of all women with births.
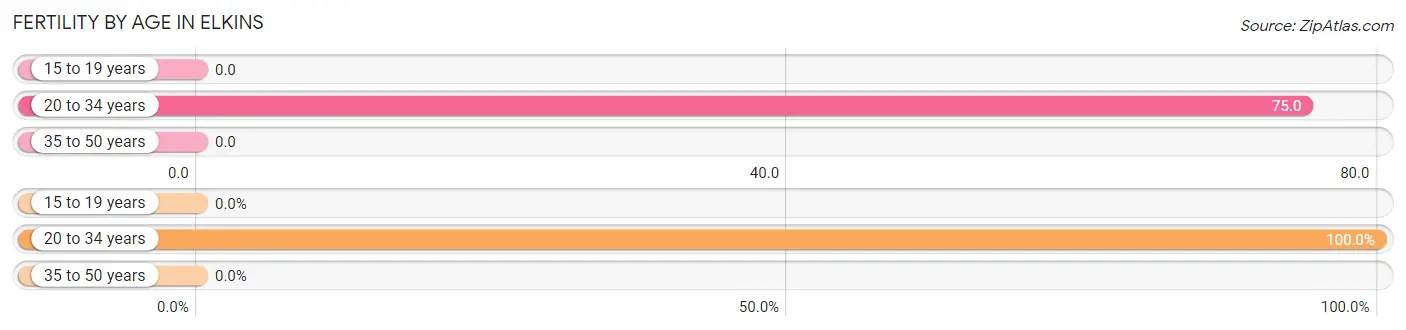
| Age Bracket | Women with Births | Births / 1,000 Women |
| 15 to 19 years | 0 (0.0%) | 0.0 |
| 20 to 34 years | 26 (100.0%) | 75.0 |
| 35 to 50 years | 0 (0.0%) | 0.0 |
| Total | 26 (100.0%) | 31.0 |
Fertility by Age by Marriage Status in Elkins

| Age Bracket | Married | Unmarried |
| 15 to 19 years | 0 (0.0%) | 0 (0.0%) |
| 20 to 34 years | 26 (100.0%) | 0 (0.0%) |
| 35 to 50 years | 0 (0.0%) | 0 (0.0%) |
| Total | 26 (100.0%) | 0 (0.0%) |
Fertility by Education in Elkins
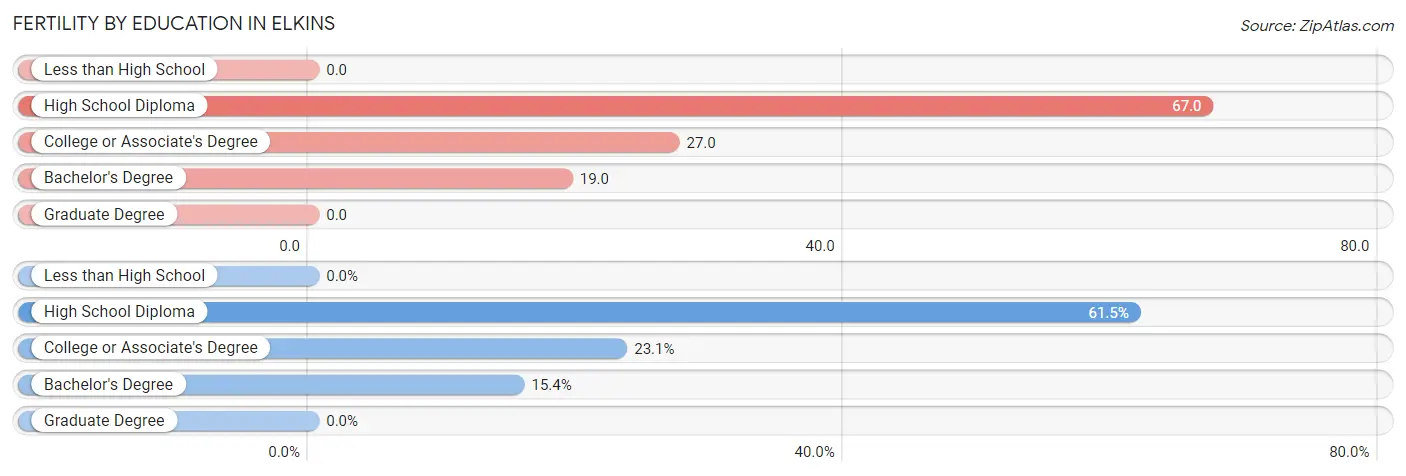
| Educational Attainment | Women with Births | Births / 1,000 Women |
| Less than High School | 0 (0.0%) | 0.0 |
| High School Diploma | 16 (61.5%) | 67.0 |
| College or Associate's Degree | 6 (23.1%) | 27.0 |
| Bachelor's Degree | 4 (15.4%) | 19.0 |
| Graduate Degree | 0 (0.0%) | 0.0 |
| Total | 26 (100.0%) | 31.0 |
Fertility by Education by Marriage Status in Elkins
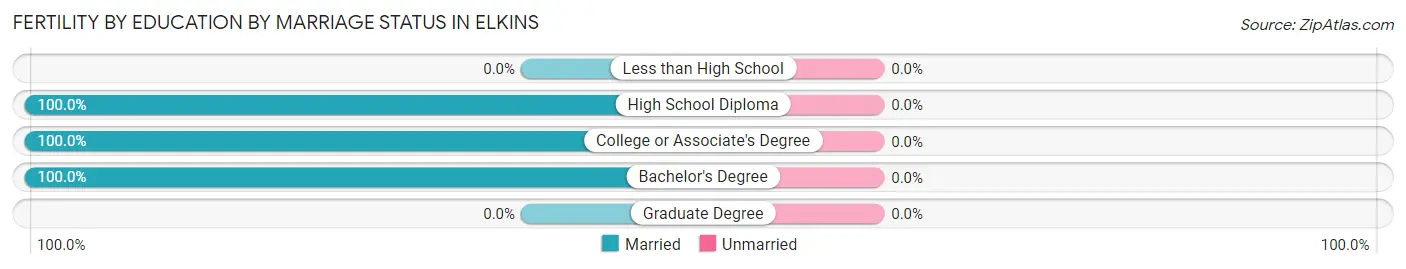
| Educational Attainment | Married | Unmarried |
| Less than High School | 0 (0.0%) | 0 (0.0%) |
| High School Diploma | 16 (100.0%) | 0 (0.0%) |
| College or Associate's Degree | 6 (100.0%) | 0 (0.0%) |
| Bachelor's Degree | 4 (100.0%) | 0 (0.0%) |
| Graduate Degree | 0 (0.0%) | 0 (0.0%) |
| Total | 26 (100.0%) | 0 (0.0%) |
Employment Characteristics in Elkins
Employment by Class of Employer in Elkins
Among the 1,838 employed individuals in Elkins, private company employees (1,331 | 72.4%), local government employees (278 | 15.1%), and self-employed (not incorporated) (79 | 4.3%) make up the most common classes of employment.
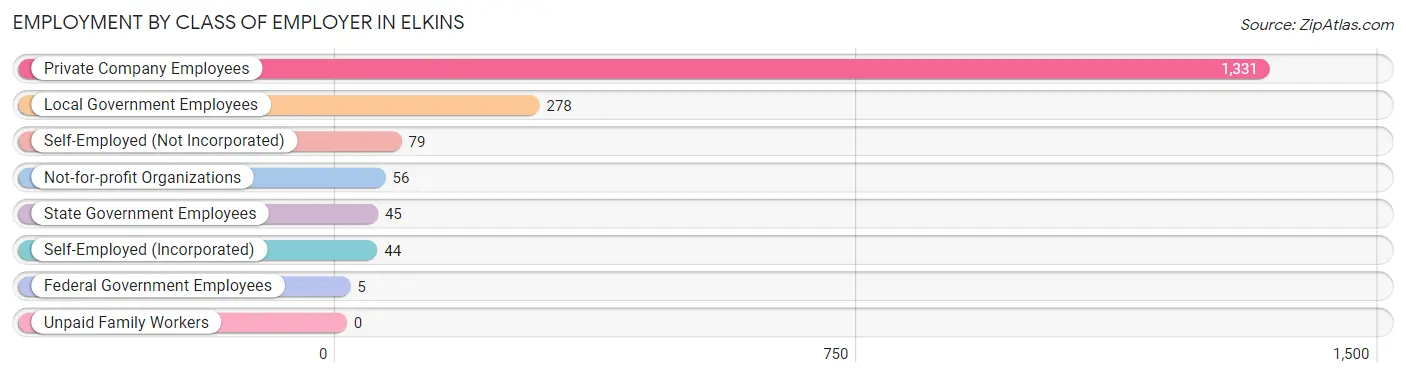
| Employer Class | # Employees | % Employees |
| Private Company Employees | 1,331 | 72.4% |
| Self-Employed (Incorporated) | 44 | 2.4% |
| Self-Employed (Not Incorporated) | 79 | 4.3% |
| Not-for-profit Organizations | 56 | 3.0% |
| Local Government Employees | 278 | 15.1% |
| State Government Employees | 45 | 2.5% |
| Federal Government Employees | 5 | 0.3% |
| Unpaid Family Workers | 0 | 0.0% |
| Total | 1,838 | 100.0% |
Employment Status by Age in Elkins
According to the labor force statistics for Elkins, out of the total population over 16 years of age (2,872), 64.9% or 1,864 individuals are in the labor force, with 1.4% or 26 of them unemployed. The age group with the highest labor force participation rate is 55 to 59 years, with 88.4% or 266 individuals in the labor force. Within the labor force, the 65 to 74 years age range has the highest percentage of unemployed individuals, with 8.1% or 5 of them being unemployed.
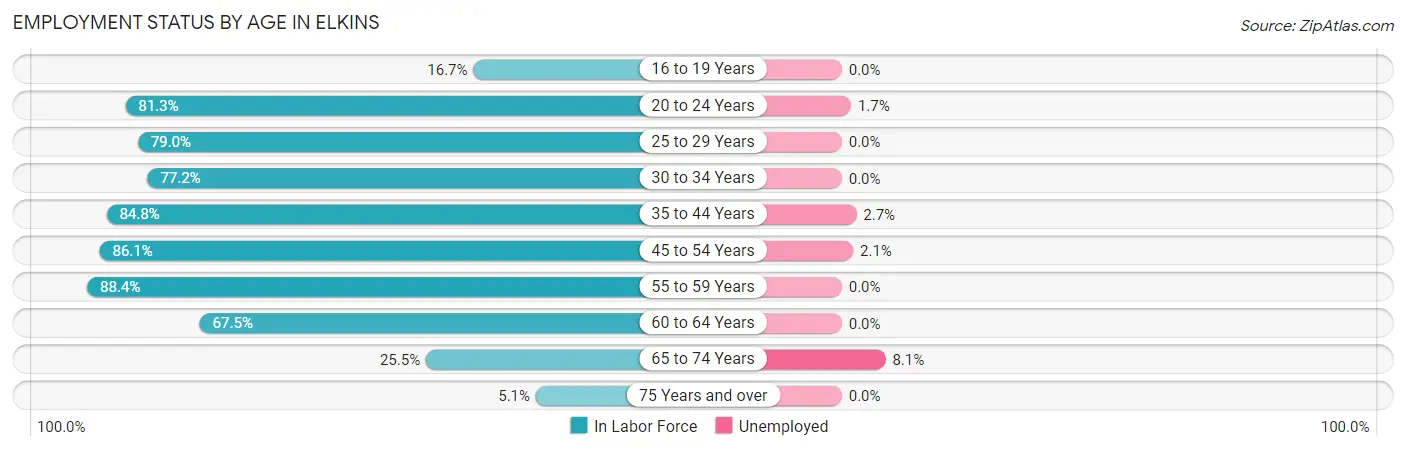
| Age Bracket | In Labor Force | Unemployed |
| 16 to 19 Years | 38 (16.7%) | 0 (0.0%) |
| 20 to 24 Years | 178 (81.3%) | 3 (1.7%) |
| 25 to 29 Years | 256 (79.0%) | 0 (0.0%) |
| 30 to 34 Years | 233 (77.2%) | 0 (0.0%) |
| 35 to 44 Years | 403 (84.8%) | 11 (2.7%) |
| 45 to 54 Years | 329 (86.1%) | 7 (2.1%) |
| 55 to 59 Years | 266 (88.4%) | 0 (0.0%) |
| 60 to 64 Years | 85 (67.5%) | 0 (0.0%) |
| 65 to 74 Years | 62 (25.5%) | 5 (8.1%) |
| 75 Years and over | 14 (5.1%) | 0 (0.0%) |
| Total | 1,864 (64.9%) | 26 (1.4%) |
Employment Status by Educational Attainment in Elkins
According to labor force statistics for Elkins, 82.3% of individuals (1,572) out of the total population between 25 and 64 years of age (1,910) are in the labor force, with 1.1% or 17 of them being unemployed. The group with the highest labor force participation rate are those with the educational attainment of college / associate degree, with 87.9% or 516 individuals in the labor force. Within the labor force, individuals with bachelor's degree or higher education have the highest percentage of unemployment, with 2.7% or 10 of them being unemployed.
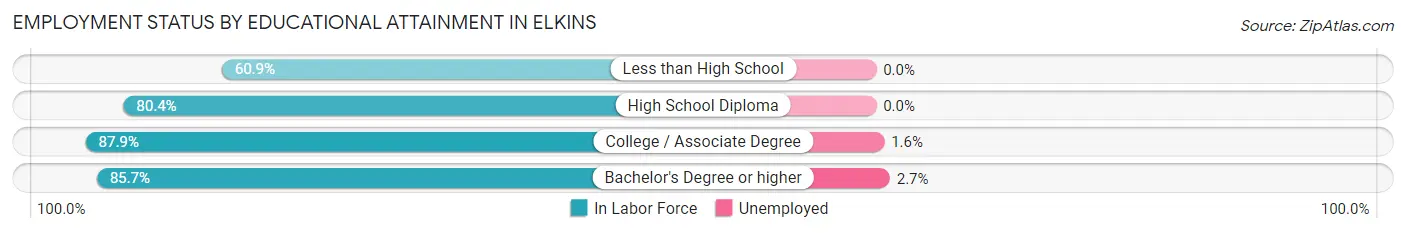
| Educational Attainment | In Labor Force | Unemployed |
| Less than High School | 95 (60.9%) | 0 (0.0%) |
| High School Diploma | 589 (80.4%) | 0 (0.0%) |
| College / Associate Degree | 516 (87.9%) | 9 (1.6%) |
| Bachelor's Degree or higher | 372 (85.7%) | 12 (2.7%) |
| Total | 1,572 (82.3%) | 21 (1.1%) |
Employment Occupations by Sex in Elkins
Management, Business, Science and Arts Occupations
The most common Management, Business, Science and Arts occupations in Elkins are Management (215 | 11.7%), Community & Social Service (178 | 9.7%), Education Instruction & Library (137 | 7.4%), Health Diagnosing & Treating (97 | 5.3%), and Health Technologists (67 | 3.6%).
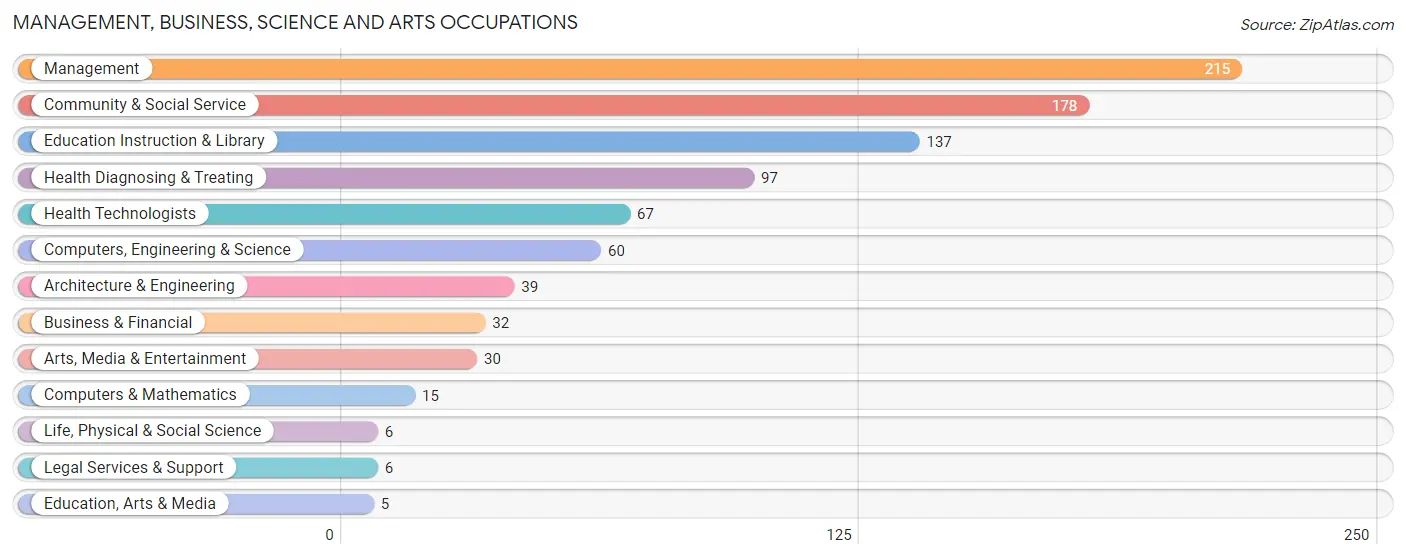
Management, Business, Science and Arts Occupations by Sex
Within the Management, Business, Science and Arts occupations in Elkins, the most male-oriented occupations are Computers & Mathematics (100.0%), Life, Physical & Social Science (100.0%), and Legal Services & Support (100.0%), while the most female-oriented occupations are Education, Arts & Media (100.0%), Education Instruction & Library (100.0%), and Community & Social Service (93.8%).
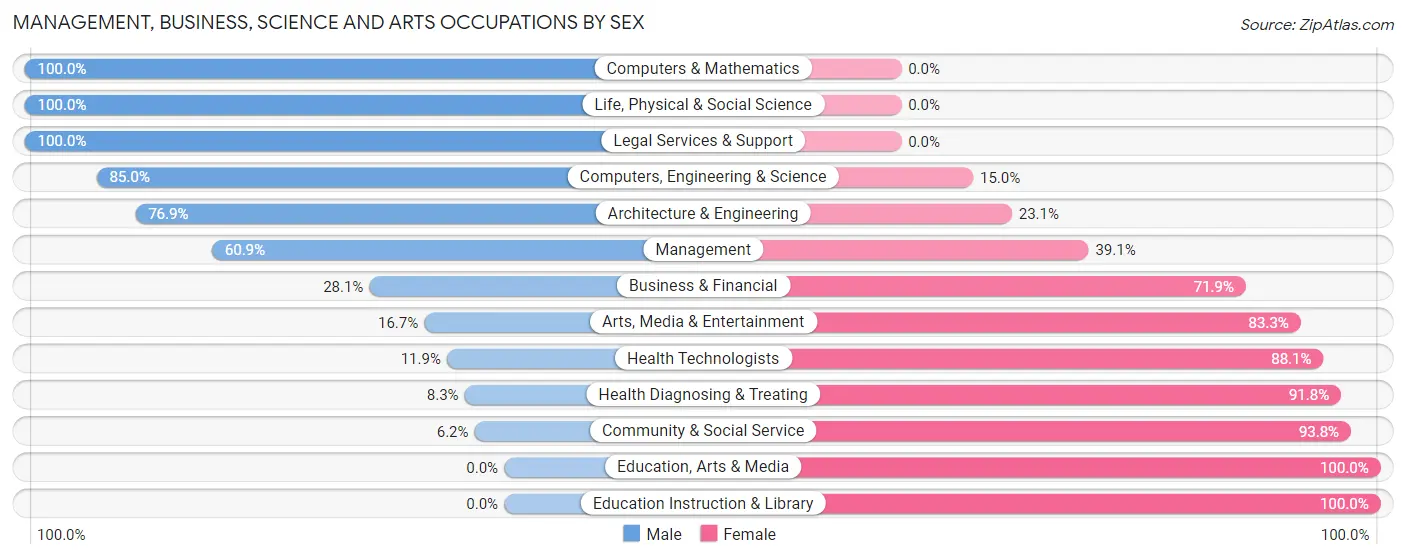
| Occupation | Male | Female |
| Management | 131 (60.9%) | 84 (39.1%) |
| Business & Financial | 9 (28.1%) | 23 (71.9%) |
| Computers, Engineering & Science | 51 (85.0%) | 9 (15.0%) |
| Computers & Mathematics | 15 (100.0%) | 0 (0.0%) |
| Architecture & Engineering | 30 (76.9%) | 9 (23.1%) |
| Life, Physical & Social Science | 6 (100.0%) | 0 (0.0%) |
| Community & Social Service | 11 (6.2%) | 167 (93.8%) |
| Education, Arts & Media | 0 (0.0%) | 5 (100.0%) |
| Legal Services & Support | 6 (100.0%) | 0 (0.0%) |
| Education Instruction & Library | 0 (0.0%) | 137 (100.0%) |
| Arts, Media & Entertainment | 5 (16.7%) | 25 (83.3%) |
| Health Diagnosing & Treating | 8 (8.3%) | 89 (91.7%) |
| Health Technologists | 8 (11.9%) | 59 (88.1%) |
| Total (Category) | 210 (36.1%) | 372 (63.9%) |
| Total (Overall) | 1,027 (55.9%) | 811 (44.1%) |
Services Occupations
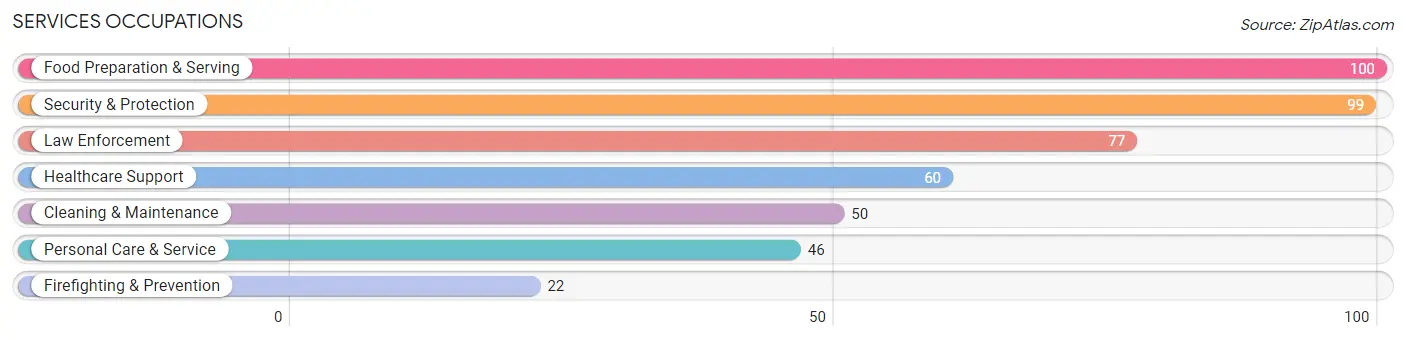
The most common Services occupations in Elkins are Food Preparation & Serving (100 | 5.4%), Security & Protection (99 | 5.4%), Law Enforcement (77 | 4.2%), Healthcare Support (60 | 3.3%), and Cleaning & Maintenance (50 | 2.7%).
Services Occupations by Sex
Within the Services occupations in Elkins, the most male-oriented occupations are Security & Protection (100.0%), Firefighting & Prevention (100.0%), and Law Enforcement (100.0%), while the most female-oriented occupations are Healthcare Support (100.0%), Personal Care & Service (100.0%), and Food Preparation & Serving (51.0%).
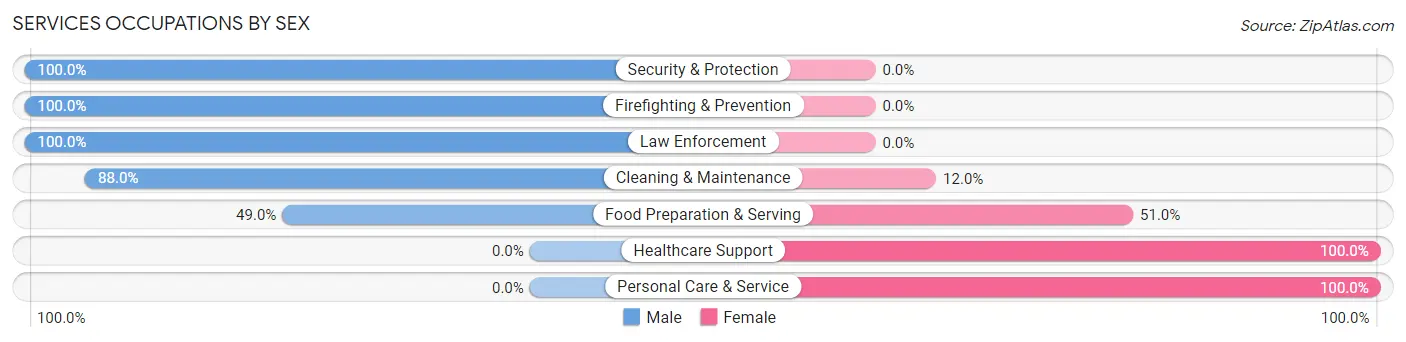
| Occupation | Male | Female |
| Healthcare Support | 0 (0.0%) | 60 (100.0%) |
| Security & Protection | 99 (100.0%) | 0 (0.0%) |
| Firefighting & Prevention | 22 (100.0%) | 0 (0.0%) |
| Law Enforcement | 77 (100.0%) | 0 (0.0%) |
| Food Preparation & Serving | 49 (49.0%) | 51 (51.0%) |
| Cleaning & Maintenance | 44 (88.0%) | 6 (12.0%) |
| Personal Care & Service | 0 (0.0%) | 46 (100.0%) |
| Total (Category) | 192 (54.1%) | 163 (45.9%) |
| Total (Overall) | 1,027 (55.9%) | 811 (44.1%) |
Sales and Office Occupations
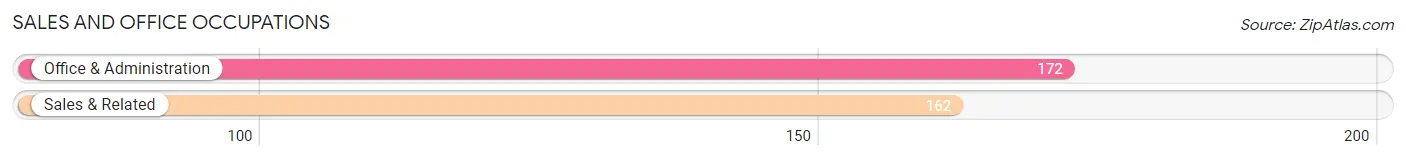
The most common Sales and Office occupations in Elkins are Office & Administration (172 | 9.4%), and Sales & Related (162 | 8.8%).
Sales and Office Occupations by Sex
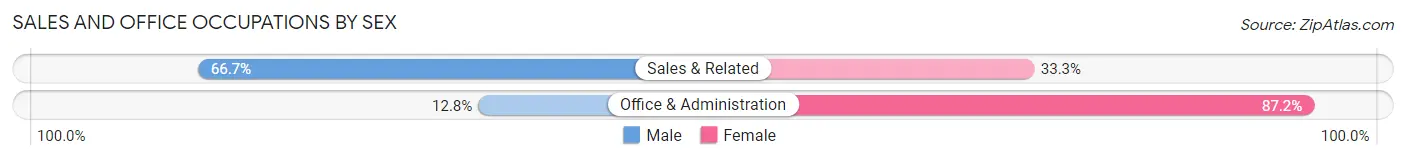
| Occupation | Male | Female |
| Sales & Related | 108 (66.7%) | 54 (33.3%) |
| Office & Administration | 22 (12.8%) | 150 (87.2%) |
| Total (Category) | 130 (38.9%) | 204 (61.1%) |
| Total (Overall) | 1,027 (55.9%) | 811 (44.1%) |
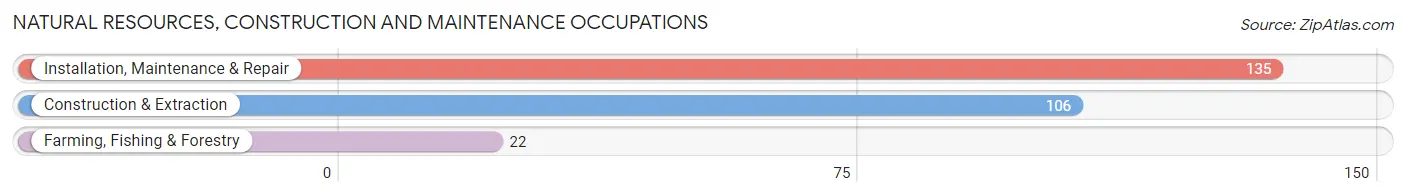
Natural Resources, Construction and Maintenance Occupations
The most common Natural Resources, Construction and Maintenance occupations in Elkins are Installation, Maintenance & Repair (135 | 7.3%), Construction & Extraction (106 | 5.8%), and Farming, Fishing & Forestry (22 | 1.2%).
Natural Resources, Construction and Maintenance Occupations by Sex
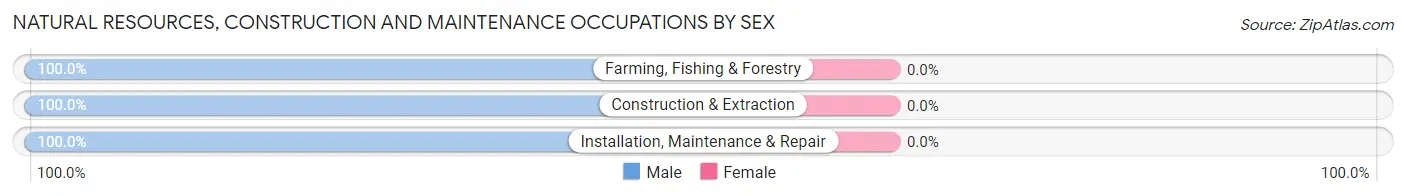
| Occupation | Male | Female |
| Farming, Fishing & Forestry | 22 (100.0%) | 0 (0.0%) |
| Construction & Extraction | 106 (100.0%) | 0 (0.0%) |
| Installation, Maintenance & Repair | 135 (100.0%) | 0 (0.0%) |
| Total (Category) | 263 (100.0%) | 0 (0.0%) |
| Total (Overall) | 1,027 (55.9%) | 811 (44.1%) |
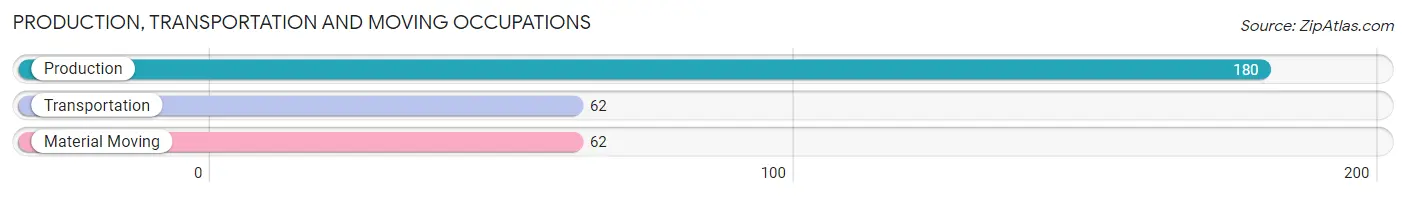
Production, Transportation and Moving Occupations
The most common Production, Transportation and Moving occupations in Elkins are Production (180 | 9.8%), Transportation (62 | 3.4%), and Material Moving (62 | 3.4%).
Production, Transportation and Moving Occupations by Sex
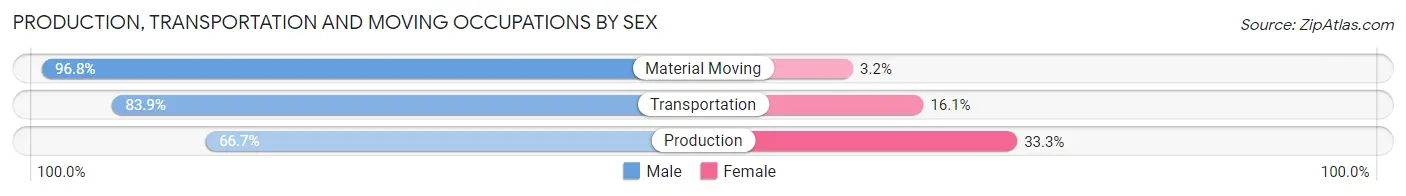
| Occupation | Male | Female |
| Production | 120 (66.7%) | 60 (33.3%) |
| Transportation | 52 (83.9%) | 10 (16.1%) |
| Material Moving | 60 (96.8%) | 2 (3.2%) |
| Total (Category) | 232 (76.3%) | 72 (23.7%) |
| Total (Overall) | 1,027 (55.9%) | 811 (44.1%) |
Employment Industries by Sex in Elkins
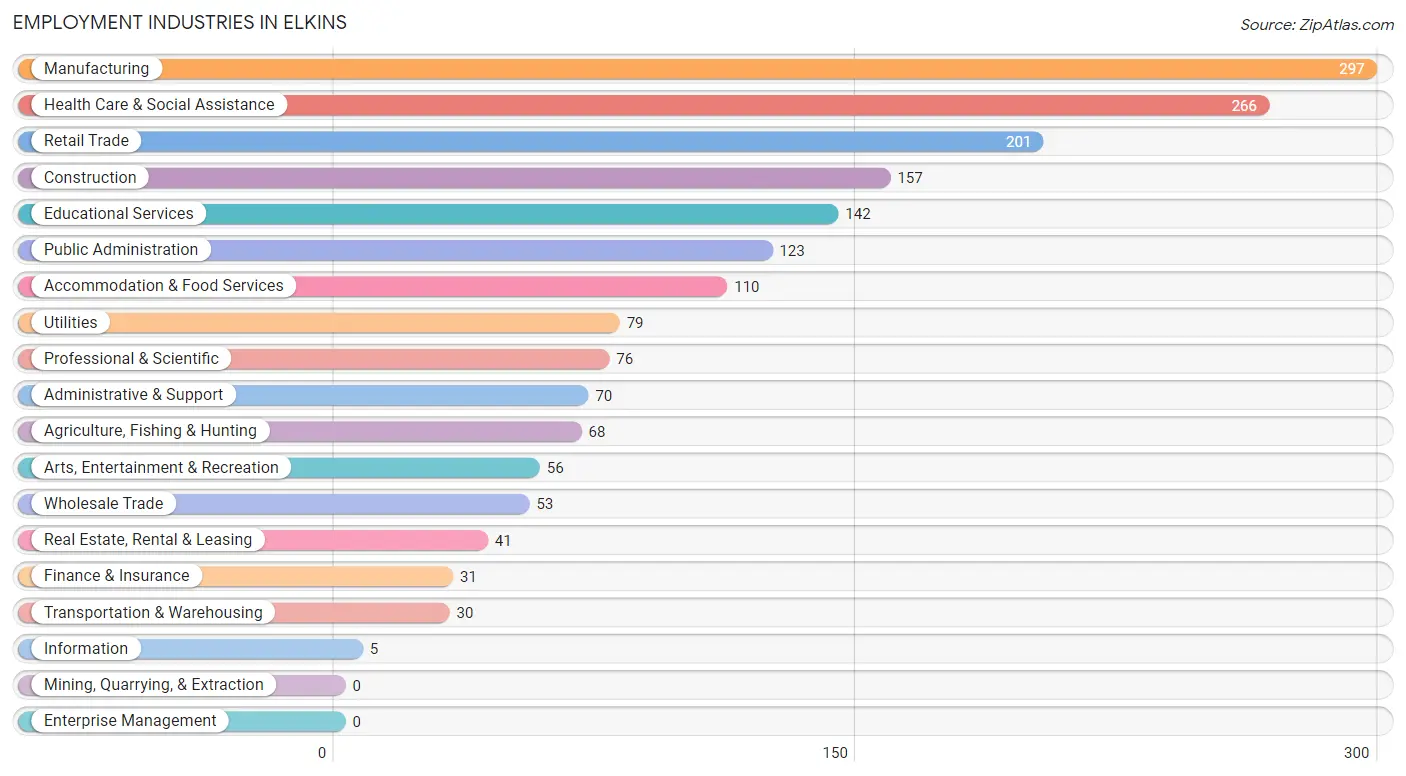
Employment Industries in Elkins
The major employment industries in Elkins include Manufacturing (297 | 16.2%), Health Care & Social Assistance (266 | 14.5%), Retail Trade (201 | 10.9%), Construction (157 | 8.5%), and Educational Services (142 | 7.7%).
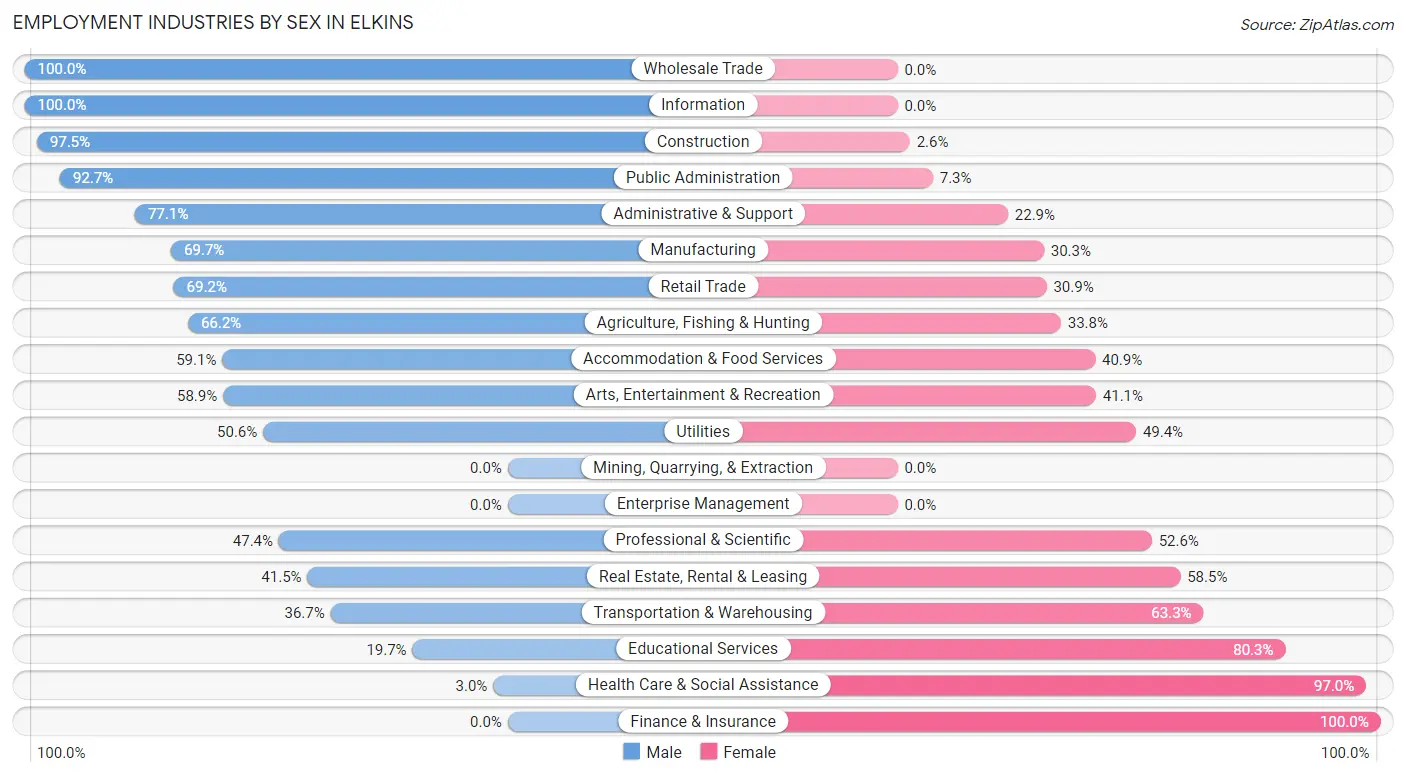
Employment Industries by Sex in Elkins
The Elkins industries that see more men than women are Wholesale Trade (100.0%), Information (100.0%), and Construction (97.5%), whereas the industries that tend to have a higher number of women are Finance & Insurance (100.0%), Health Care & Social Assistance (97.0%), and Educational Services (80.3%).
| Industry | Male | Female |
| Agriculture, Fishing & Hunting | 45 (66.2%) | 23 (33.8%) |
| Mining, Quarrying, & Extraction | 0 (0.0%) | 0 (0.0%) |
| Construction | 153 (97.5%) | 4 (2.5%) |
| Manufacturing | 207 (69.7%) | 90 (30.3%) |
| Wholesale Trade | 53 (100.0%) | 0 (0.0%) |
| Retail Trade | 139 (69.2%) | 62 (30.8%) |
| Transportation & Warehousing | 11 (36.7%) | 19 (63.3%) |
| Utilities | 40 (50.6%) | 39 (49.4%) |
| Information | 5 (100.0%) | 0 (0.0%) |
| Finance & Insurance | 0 (0.0%) | 31 (100.0%) |
| Real Estate, Rental & Leasing | 17 (41.5%) | 24 (58.5%) |
| Professional & Scientific | 36 (47.4%) | 40 (52.6%) |
| Enterprise Management | 0 (0.0%) | 0 (0.0%) |
| Administrative & Support | 54 (77.1%) | 16 (22.9%) |
| Educational Services | 28 (19.7%) | 114 (80.3%) |
| Health Care & Social Assistance | 8 (3.0%) | 258 (97.0%) |
| Arts, Entertainment & Recreation | 33 (58.9%) | 23 (41.1%) |
| Accommodation & Food Services | 65 (59.1%) | 45 (40.9%) |
| Public Administration | 114 (92.7%) | 9 (7.3%) |
| Total | 1,027 (55.9%) | 811 (44.1%) |
Education in Elkins
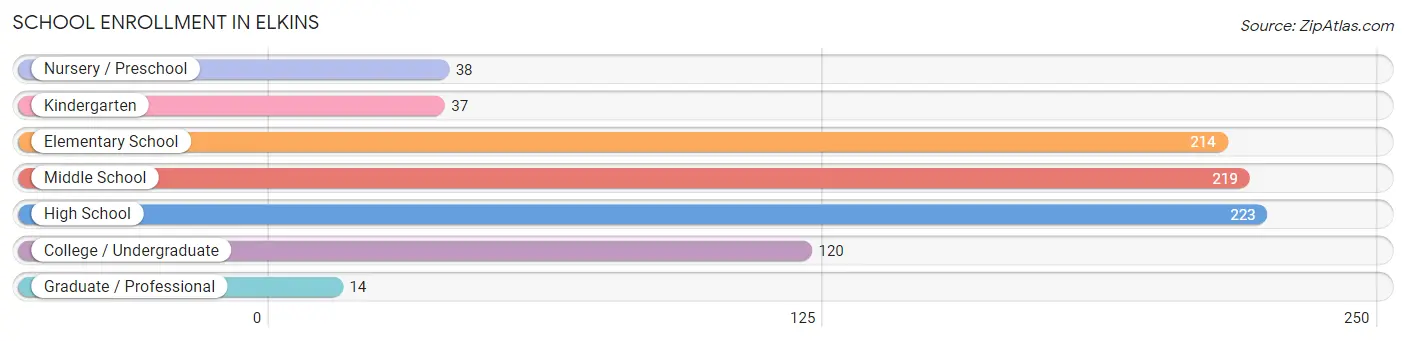
School Enrollment in Elkins
The most common levels of schooling among the 865 students in Elkins are high school (223 | 25.8%), middle school (219 | 25.3%), and elementary school (214 | 24.7%).
| School Level | # Students | % Students |
| Nursery / Preschool | 38 | 4.4% |
| Kindergarten | 37 | 4.3% |
| Elementary School | 214 | 24.7% |
| Middle School | 219 | 25.3% |
| High School | 223 | 25.8% |
| College / Undergraduate | 120 | 13.9% |
| Graduate / Professional | 14 | 1.6% |
| Total | 865 | 100.0% |
School Enrollment by Age by Funding Source in Elkins
Out of a total of 865 students who are enrolled in schools in Elkins, 118 (13.6%) attend a private institution, while the remaining 747 (86.4%) are enrolled in public schools. The age group of 3 to 4 year olds has the highest likelihood of being enrolled in private schools, with 7 (58.3% in the age bracket) enrolled. Conversely, the age group of 18 to 19 year olds has the lowest likelihood of being enrolled in a private school, with 65 (100.0% in the age bracket) attending a public institution.
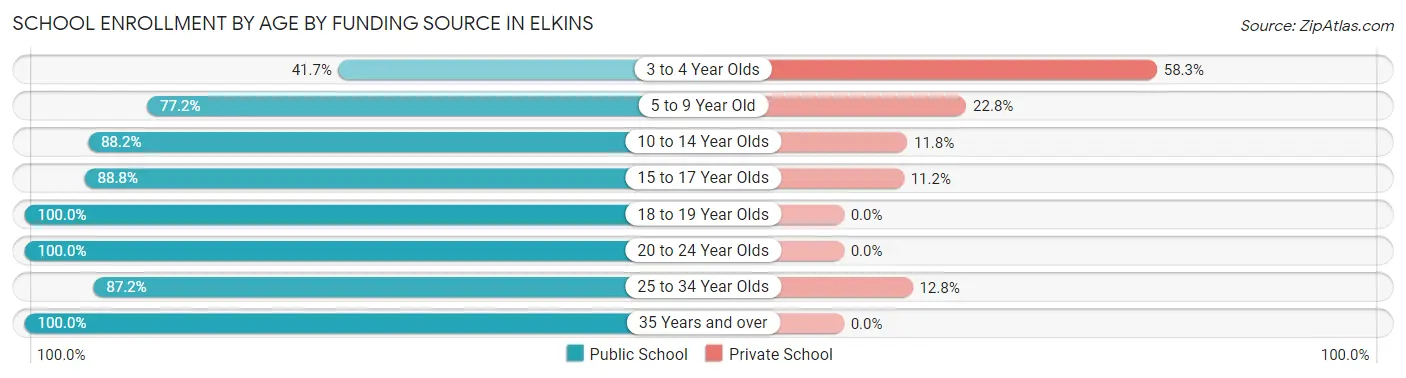
| Age Bracket | Public School | Private School |
| 3 to 4 Year Olds | 5 (41.7%) | 7 (58.3%) |
| 5 to 9 Year Old | 203 (77.2%) | 60 (22.8%) |
| 10 to 14 Year Olds | 224 (88.2%) | 30 (11.8%) |
| 15 to 17 Year Olds | 127 (88.8%) | 16 (11.2%) |
| 18 to 19 Year Olds | 65 (100.0%) | 0 (0.0%) |
| 20 to 24 Year Olds | 56 (100.0%) | 0 (0.0%) |
| 25 to 34 Year Olds | 34 (87.2%) | 5 (12.8%) |
| 35 Years and over | 33 (100.0%) | 0 (0.0%) |
| Total | 747 (86.4%) | 118 (13.6%) |
Educational Attainment by Field of Study in Elkins
Business (128 | 22.9%), science & technology (96 | 17.1%), education (63 | 11.3%), communications (48 | 8.6%), and social sciences (38 | 6.8%) are the most common fields of study among 560 individuals in Elkins who have obtained a bachelor's degree or higher.
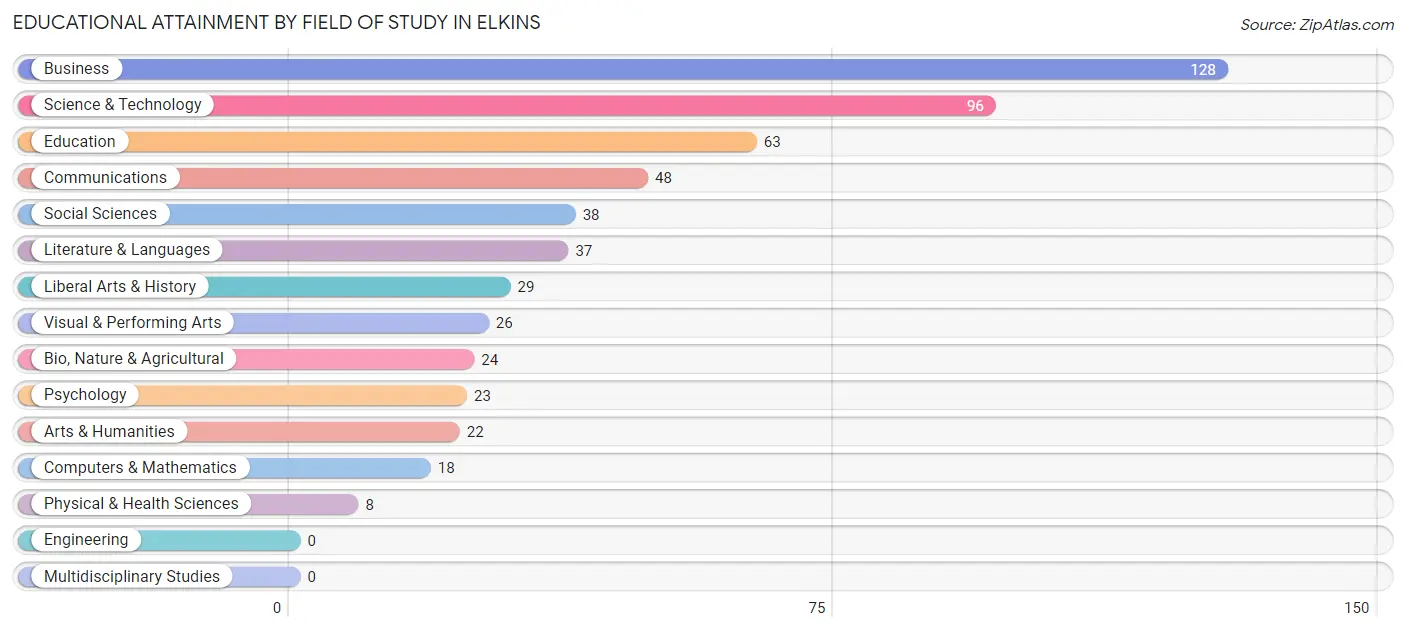
| Field of Study | # Graduates | % Graduates |
| Computers & Mathematics | 18 | 3.2% |
| Bio, Nature & Agricultural | 24 | 4.3% |
| Physical & Health Sciences | 8 | 1.4% |
| Psychology | 23 | 4.1% |
| Social Sciences | 38 | 6.8% |
| Engineering | 0 | 0.0% |
| Multidisciplinary Studies | 0 | 0.0% |
| Science & Technology | 96 | 17.1% |
| Business | 128 | 22.9% |
| Education | 63 | 11.3% |
| Literature & Languages | 37 | 6.6% |
| Liberal Arts & History | 29 | 5.2% |
| Visual & Performing Arts | 26 | 4.6% |
| Communications | 48 | 8.6% |
| Arts & Humanities | 22 | 3.9% |
| Total | 560 | 100.0% |
Transportation & Commute in Elkins
Vehicle Availability by Sex in Elkins
The most prevalent vehicle ownership categories in Elkins are males with 2 vehicles (526, accounting for 51.2%) and females with 2 vehicles (325, making up 64.9%).
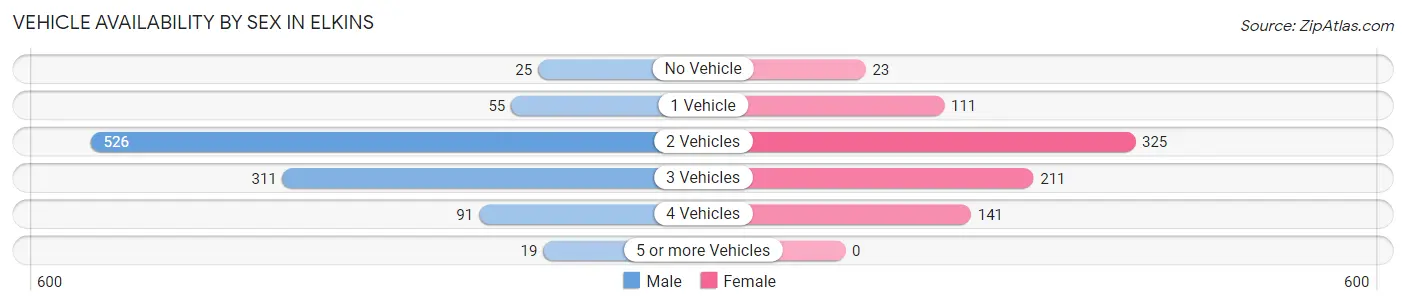
| Vehicles Available | Male | Female |
| No Vehicle | 25 (2.4%) | 23 (2.8%) |
| 1 Vehicle | 55 (5.4%) | 111 (13.7%) |
| 2 Vehicles | 526 (51.2%) | 325 (40.1%) |
| 3 Vehicles | 311 (30.3%) | 211 (26.0%) |
| 4 Vehicles | 91 (8.9%) | 141 (17.4%) |
| 5 or more Vehicles | 19 (1.8%) | 0 (0.0%) |
| Total | 1,027 (100.0%) | 811 (100.0%) |
Commute Time in Elkins
The most frequently occuring commute durations in Elkins are 30 to 34 minutes (283 commuters, 16.8%), 25 to 29 minutes (276 commuters, 16.4%), and 20 to 24 minutes (267 commuters, 15.9%).
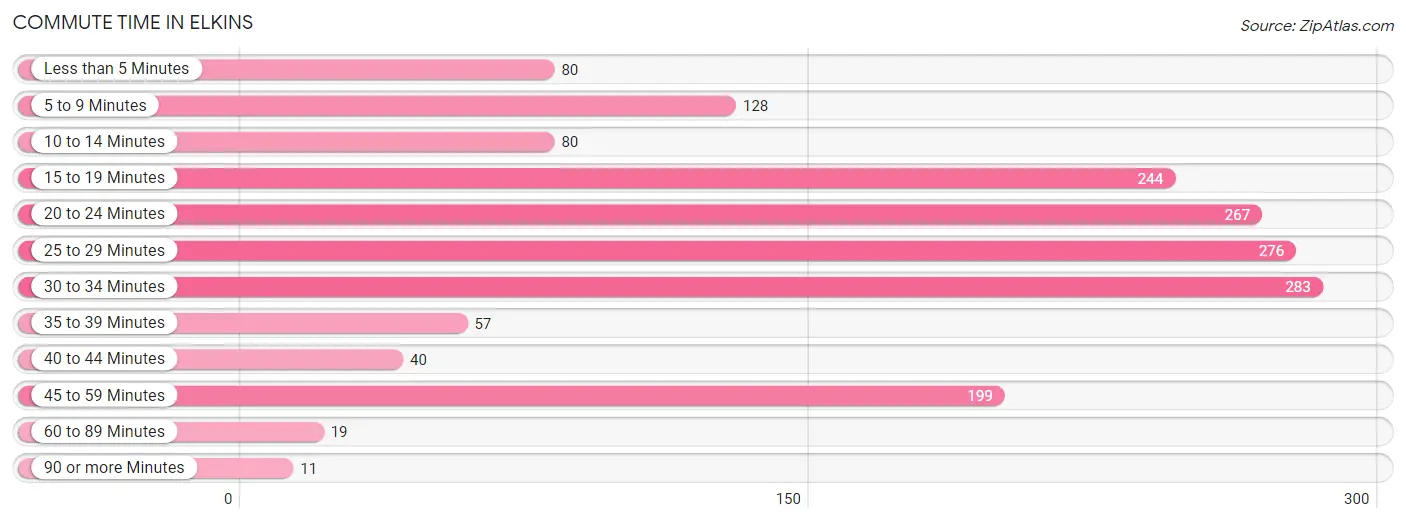
| Commute Time | # Commuters | % Commuters |
| Less than 5 Minutes | 80 | 4.8% |
| 5 to 9 Minutes | 128 | 7.6% |
| 10 to 14 Minutes | 80 | 4.8% |
| 15 to 19 Minutes | 244 | 14.5% |
| 20 to 24 Minutes | 267 | 15.9% |
| 25 to 29 Minutes | 276 | 16.4% |
| 30 to 34 Minutes | 283 | 16.8% |
| 35 to 39 Minutes | 57 | 3.4% |
| 40 to 44 Minutes | 40 | 2.4% |
| 45 to 59 Minutes | 199 | 11.8% |
| 60 to 89 Minutes | 19 | 1.1% |
| 90 or more Minutes | 11 | 0.6% |
Commute Time by Sex in Elkins
The most common commute times in Elkins are 25 to 29 minutes (221 commuters, 22.7%) for males and 30 to 34 minutes (178 commuters, 25.0%) for females.
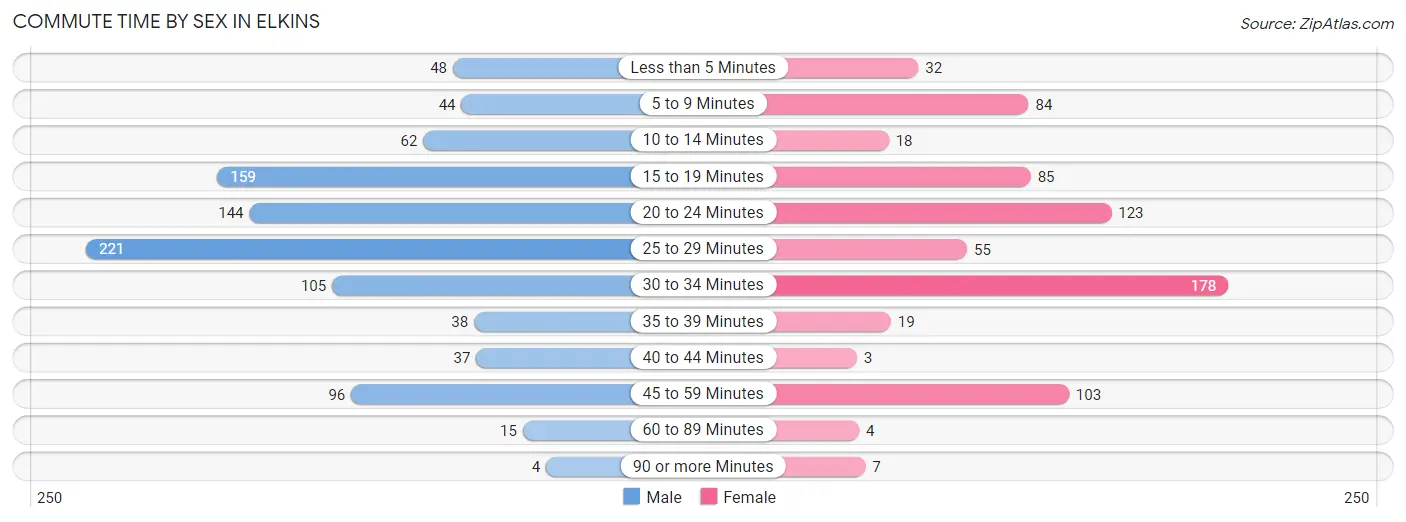
| Commute Time | Male | Female |
| Less than 5 Minutes | 48 (4.9%) | 32 (4.5%) |
| 5 to 9 Minutes | 44 (4.5%) | 84 (11.8%) |
| 10 to 14 Minutes | 62 (6.4%) | 18 (2.5%) |
| 15 to 19 Minutes | 159 (16.3%) | 85 (11.9%) |
| 20 to 24 Minutes | 144 (14.8%) | 123 (17.3%) |
| 25 to 29 Minutes | 221 (22.7%) | 55 (7.7%) |
| 30 to 34 Minutes | 105 (10.8%) | 178 (25.0%) |
| 35 to 39 Minutes | 38 (3.9%) | 19 (2.7%) |
| 40 to 44 Minutes | 37 (3.8%) | 3 (0.4%) |
| 45 to 59 Minutes | 96 (9.9%) | 103 (14.5%) |
| 60 to 89 Minutes | 15 (1.5%) | 4 (0.6%) |
| 90 or more Minutes | 4 (0.4%) | 7 (1.0%) |
Time of Departure to Work by Sex in Elkins
The most frequent times of departure to work in Elkins are 7:00 AM to 7:29 AM (195, 20.0%) for males and 7:00 AM to 7:29 AM (166, 23.4%) for females.
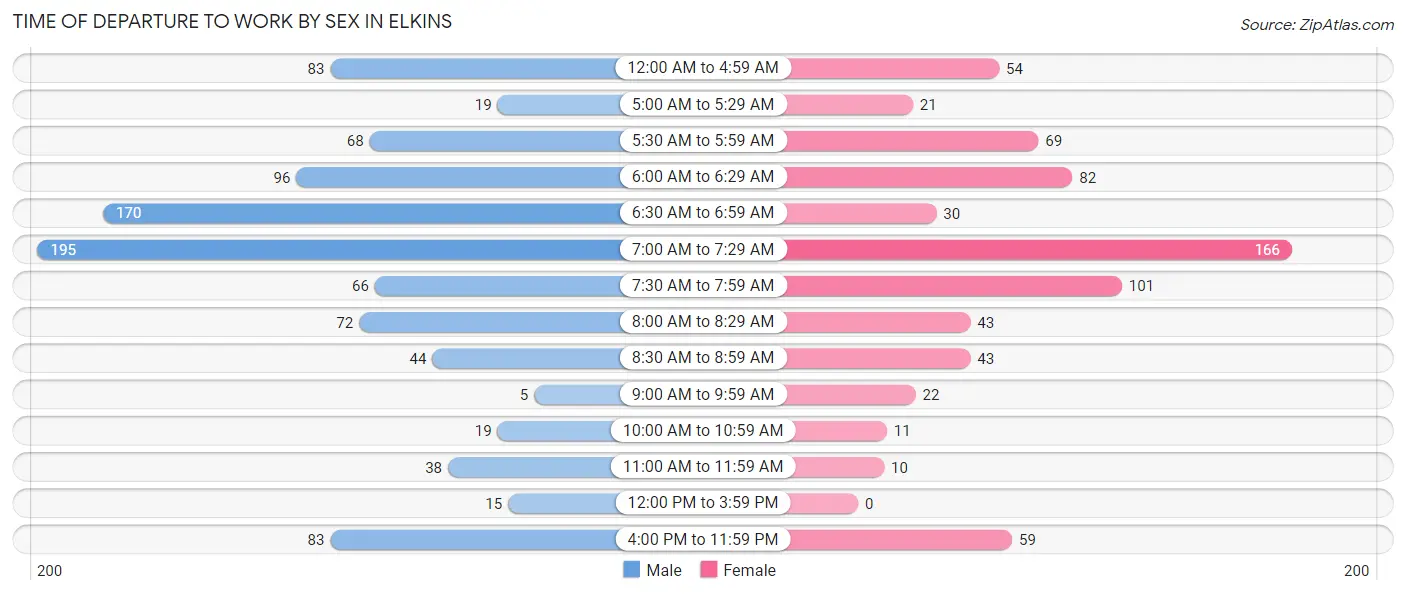
| Time of Departure | Male | Female |
| 12:00 AM to 4:59 AM | 83 (8.5%) | 54 (7.6%) |
| 5:00 AM to 5:29 AM | 19 (1.9%) | 21 (2.9%) |
| 5:30 AM to 5:59 AM | 68 (7.0%) | 69 (9.7%) |
| 6:00 AM to 6:29 AM | 96 (9.9%) | 82 (11.5%) |
| 6:30 AM to 6:59 AM | 170 (17.5%) | 30 (4.2%) |
| 7:00 AM to 7:29 AM | 195 (20.0%) | 166 (23.4%) |
| 7:30 AM to 7:59 AM | 66 (6.8%) | 101 (14.2%) |
| 8:00 AM to 8:29 AM | 72 (7.4%) | 43 (6.0%) |
| 8:30 AM to 8:59 AM | 44 (4.5%) | 43 (6.0%) |
| 9:00 AM to 9:59 AM | 5 (0.5%) | 22 (3.1%) |
| 10:00 AM to 10:59 AM | 19 (1.9%) | 11 (1.5%) |
| 11:00 AM to 11:59 AM | 38 (3.9%) | 10 (1.4%) |
| 12:00 PM to 3:59 PM | 15 (1.5%) | 0 (0.0%) |
| 4:00 PM to 11:59 PM | 83 (8.5%) | 59 (8.3%) |
| Total | 973 (100.0%) | 711 (100.0%) |
Housing Occupancy in Elkins
Occupancy by Ownership in Elkins
Of the total 1,309 dwellings in Elkins, owner-occupied units account for 1,055 (80.6%), while renter-occupied units make up 254 (19.4%).
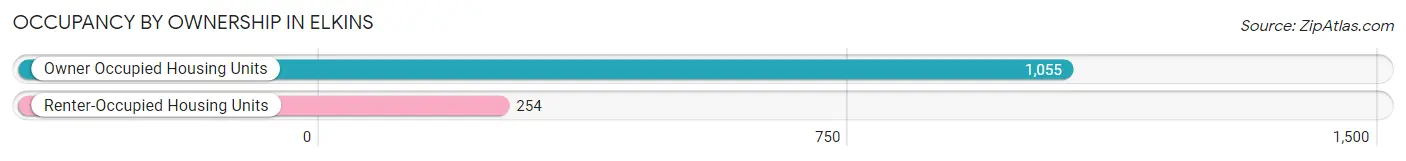
| Occupancy | # Housing Units | % Housing Units |
| Owner Occupied Housing Units | 1,055 | 80.6% |
| Renter-Occupied Housing Units | 254 | 19.4% |
| Total Occupied Housing Units | 1,309 | 100.0% |
Occupancy by Household Size in Elkins
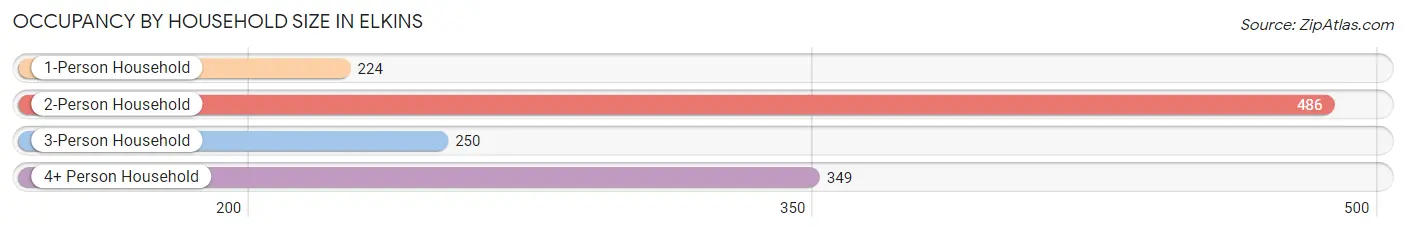
| Household Size | # Housing Units | % Housing Units |
| 1-Person Household | 224 | 17.1% |
| 2-Person Household | 486 | 37.1% |
| 3-Person Household | 250 | 19.1% |
| 4+ Person Household | 349 | 26.7% |
| Total Housing Units | 1,309 | 100.0% |
Occupancy by Ownership by Household Size in Elkins
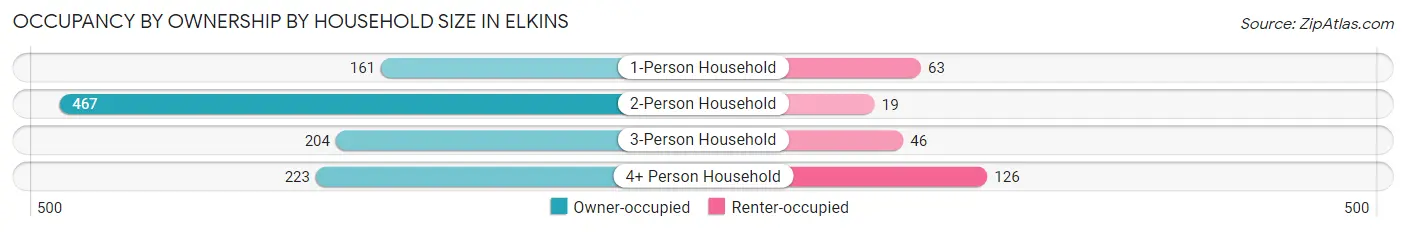
| Household Size | Owner-occupied | Renter-occupied |
| 1-Person Household | 161 (71.9%) | 63 (28.1%) |
| 2-Person Household | 467 (96.1%) | 19 (3.9%) |
| 3-Person Household | 204 (81.6%) | 46 (18.4%) |
| 4+ Person Household | 223 (63.9%) | 126 (36.1%) |
| Total Housing Units | 1,055 (80.6%) | 254 (19.4%) |
Occupancy by Educational Attainment in Elkins
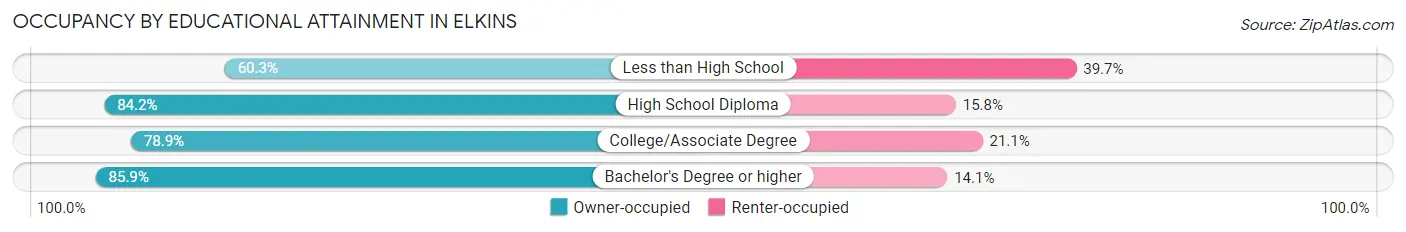
| Household Size | Owner-occupied | Renter-occupied |
| Less than High School | 76 (60.3%) | 50 (39.7%) |
| High School Diploma | 320 (84.2%) | 60 (15.8%) |
| College/Associate Degree | 348 (78.9%) | 93 (21.1%) |
| Bachelor's Degree or higher | 311 (85.9%) | 51 (14.1%) |
Occupancy by Age of Householder in Elkins
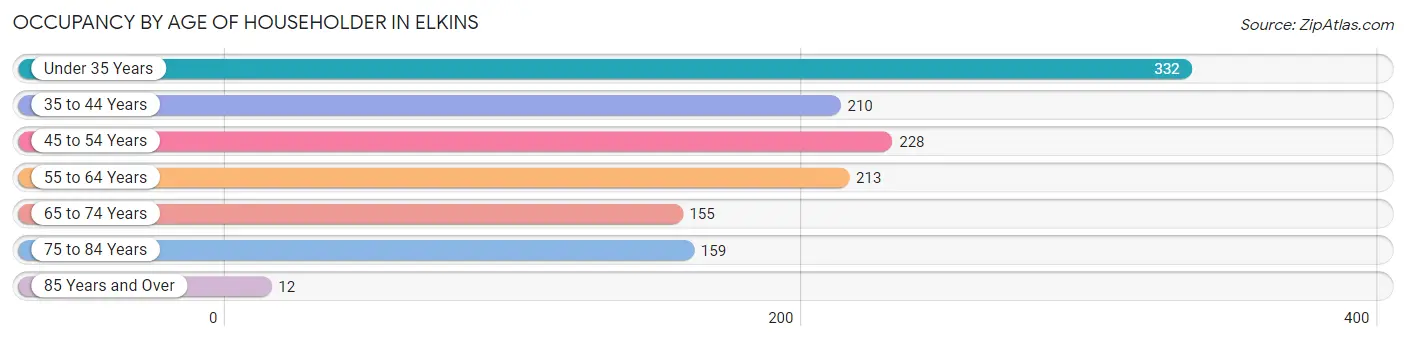
| Age Bracket | # Households | % Households |
| Under 35 Years | 332 | 25.4% |
| 35 to 44 Years | 210 | 16.0% |
| 45 to 54 Years | 228 | 17.4% |
| 55 to 64 Years | 213 | 16.3% |
| 65 to 74 Years | 155 | 11.8% |
| 75 to 84 Years | 159 | 12.1% |
| 85 Years and Over | 12 | 0.9% |
| Total | 1,309 | 100.0% |
Housing Finances in Elkins
Median Income by Occupancy in Elkins
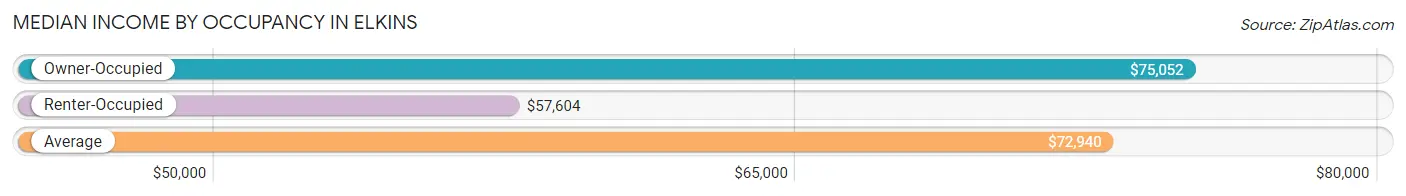
| Occupancy Type | # Households | Median Income |
| Owner-Occupied | 1,055 (80.6%) | $75,052 |
| Renter-Occupied | 254 (19.4%) | $57,604 |
| Average | 1,309 (100.0%) | $72,940 |
Occupancy by Householder Income Bracket in Elkins
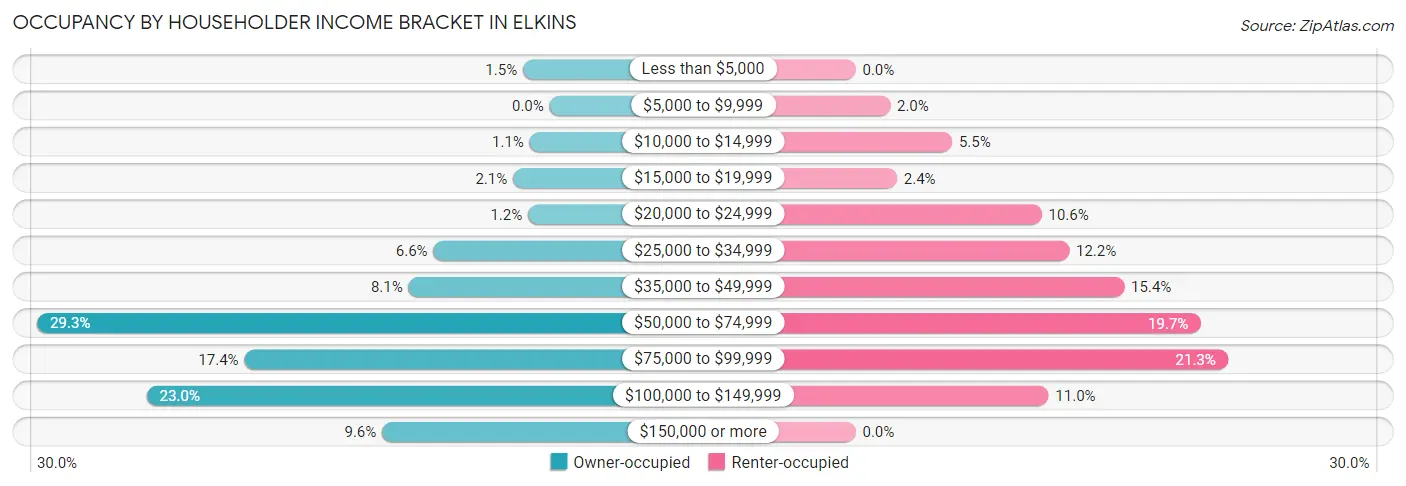
| Income Bracket | Owner-occupied | Renter-occupied |
| Less than $5,000 | 16 (1.5%) | 0 (0.0%) |
| $5,000 to $9,999 | 0 (0.0%) | 5 (2.0%) |
| $10,000 to $14,999 | 12 (1.1%) | 14 (5.5%) |
| $15,000 to $19,999 | 22 (2.1%) | 6 (2.4%) |
| $20,000 to $24,999 | 13 (1.2%) | 27 (10.6%) |
| $25,000 to $34,999 | 70 (6.6%) | 31 (12.2%) |
| $35,000 to $49,999 | 85 (8.1%) | 39 (15.3%) |
| $50,000 to $74,999 | 309 (29.3%) | 50 (19.7%) |
| $75,000 to $99,999 | 184 (17.4%) | 54 (21.3%) |
| $100,000 to $149,999 | 243 (23.0%) | 28 (11.0%) |
| $150,000 or more | 101 (9.6%) | 0 (0.0%) |
| Total | 1,055 (100.0%) | 254 (100.0%) |
Monthly Housing Cost Tiers in Elkins
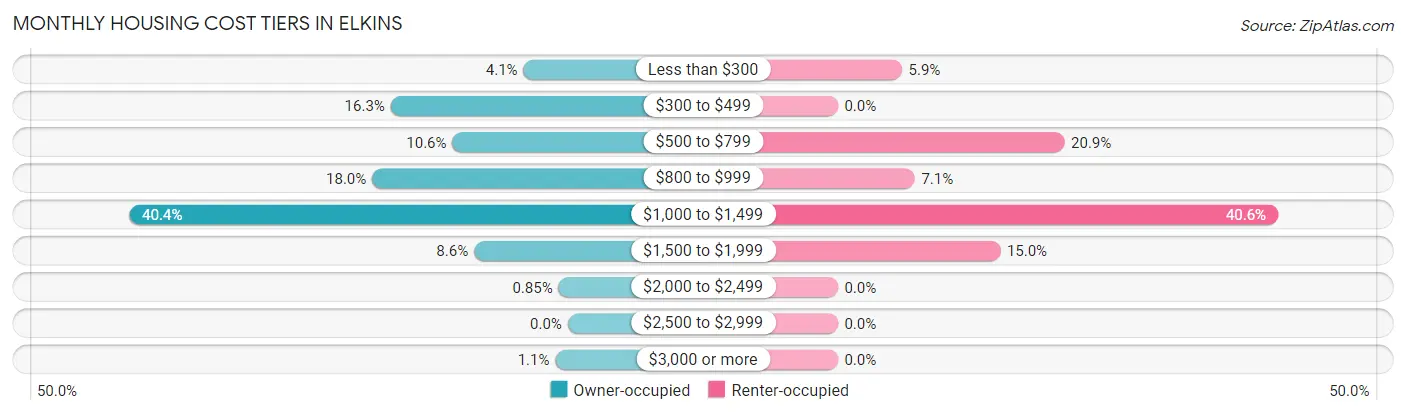
| Monthly Cost | Owner-occupied | Renter-occupied |
| Less than $300 | 43 (4.1%) | 15 (5.9%) |
| $300 to $499 | 172 (16.3%) | 0 (0.0%) |
| $500 to $799 | 112 (10.6%) | 53 (20.9%) |
| $800 to $999 | 190 (18.0%) | 18 (7.1%) |
| $1,000 to $1,499 | 426 (40.4%) | 103 (40.6%) |
| $1,500 to $1,999 | 91 (8.6%) | 38 (15.0%) |
| $2,000 to $2,499 | 9 (0.9%) | 0 (0.0%) |
| $2,500 to $2,999 | 0 (0.0%) | 0 (0.0%) |
| $3,000 or more | 12 (1.1%) | 0 (0.0%) |
| Total | 1,055 (100.0%) | 254 (100.0%) |
Physical Housing Characteristics in Elkins
Housing Structures in Elkins
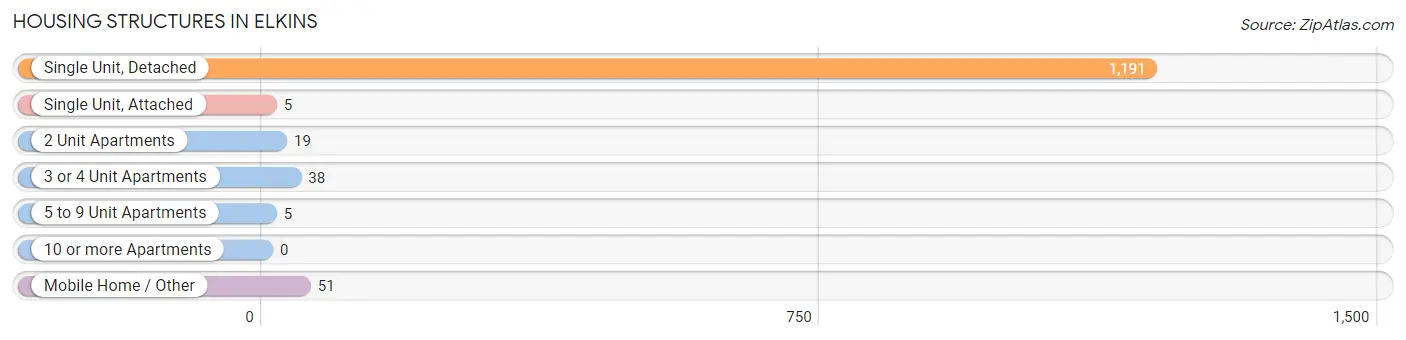
| Structure Type | # Housing Units | % Housing Units |
| Single Unit, Detached | 1,191 | 91.0% |
| Single Unit, Attached | 5 | 0.4% |
| 2 Unit Apartments | 19 | 1.5% |
| 3 or 4 Unit Apartments | 38 | 2.9% |
| 5 to 9 Unit Apartments | 5 | 0.4% |
| 10 or more Apartments | 0 | 0.0% |
| Mobile Home / Other | 51 | 3.9% |
| Total | 1,309 | 100.0% |
Housing Structures by Occupancy in Elkins
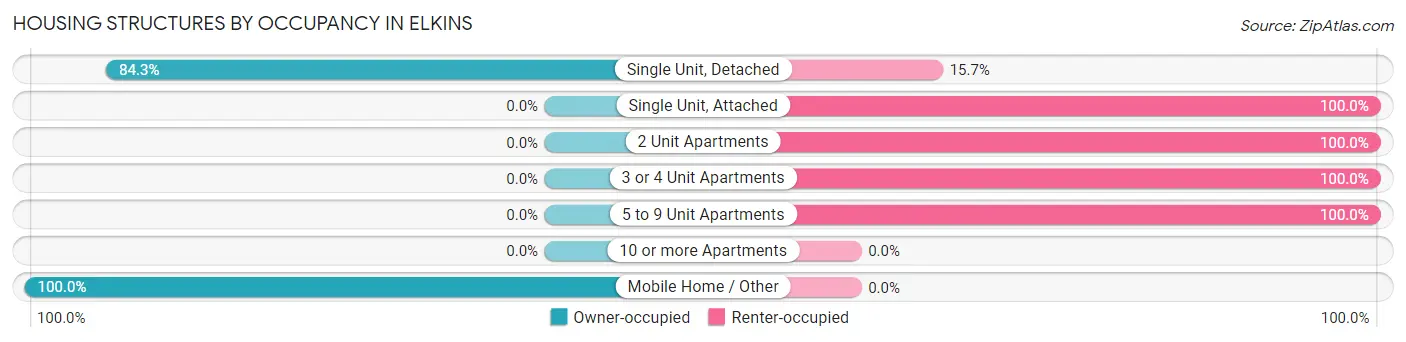
| Structure Type | Owner-occupied | Renter-occupied |
| Single Unit, Detached | 1,004 (84.3%) | 187 (15.7%) |
| Single Unit, Attached | 0 (0.0%) | 5 (100.0%) |
| 2 Unit Apartments | 0 (0.0%) | 19 (100.0%) |
| 3 or 4 Unit Apartments | 0 (0.0%) | 38 (100.0%) |
| 5 to 9 Unit Apartments | 0 (0.0%) | 5 (100.0%) |
| 10 or more Apartments | 0 (0.0%) | 0 (0.0%) |
| Mobile Home / Other | 51 (100.0%) | 0 (0.0%) |
| Total | 1,055 (80.6%) | 254 (19.4%) |
Housing Structures by Number of Rooms in Elkins
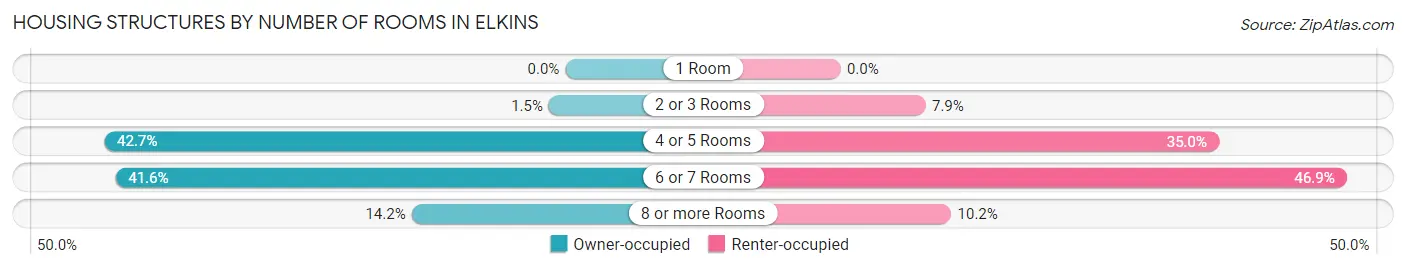
| Number of Rooms | Owner-occupied | Renter-occupied |
| 1 Room | 0 (0.0%) | 0 (0.0%) |
| 2 or 3 Rooms | 16 (1.5%) | 20 (7.9%) |
| 4 or 5 Rooms | 450 (42.6%) | 89 (35.0%) |
| 6 or 7 Rooms | 439 (41.6%) | 119 (46.9%) |
| 8 or more Rooms | 150 (14.2%) | 26 (10.2%) |
| Total | 1,055 (100.0%) | 254 (100.0%) |
Housing Structure by Heating Type in Elkins
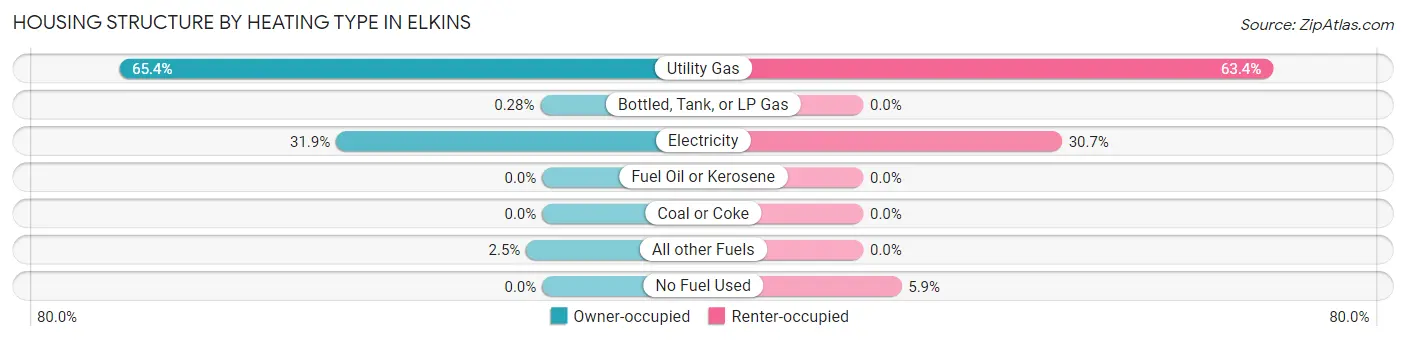
| Heating Type | Owner-occupied | Renter-occupied |
| Utility Gas | 690 (65.4%) | 161 (63.4%) |
| Bottled, Tank, or LP Gas | 3 (0.3%) | 0 (0.0%) |
| Electricity | 336 (31.9%) | 78 (30.7%) |
| Fuel Oil or Kerosene | 0 (0.0%) | 0 (0.0%) |
| Coal or Coke | 0 (0.0%) | 0 (0.0%) |
| All other Fuels | 26 (2.5%) | 0 (0.0%) |
| No Fuel Used | 0 (0.0%) | 15 (5.9%) |
| Total | 1,055 (100.0%) | 254 (100.0%) |
Household Vehicle Usage in Elkins
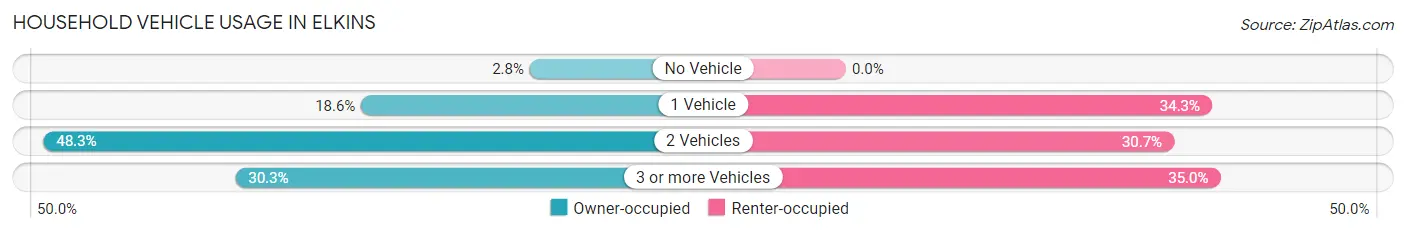
| Vehicles per Household | Owner-occupied | Renter-occupied |
| No Vehicle | 30 (2.8%) | 0 (0.0%) |
| 1 Vehicle | 196 (18.6%) | 87 (34.3%) |
| 2 Vehicles | 509 (48.2%) | 78 (30.7%) |
| 3 or more Vehicles | 320 (30.3%) | 89 (35.0%) |
| Total | 1,055 (100.0%) | 254 (100.0%) |
Real Estate & Mortgages in Elkins
Real Estate and Mortgage Overview in Elkins
| Characteristic | Without Mortgage | With Mortgage |
| Housing Units | 304 | 751 |
| Median Property Value | $186,700 | $168,200 |
| Median Household Income | $50,139 | $70 |
| Monthly Housing Costs | $428 | $12 |
| Real Estate Taxes | $780 | $9 |
Property Value by Mortgage Status in Elkins
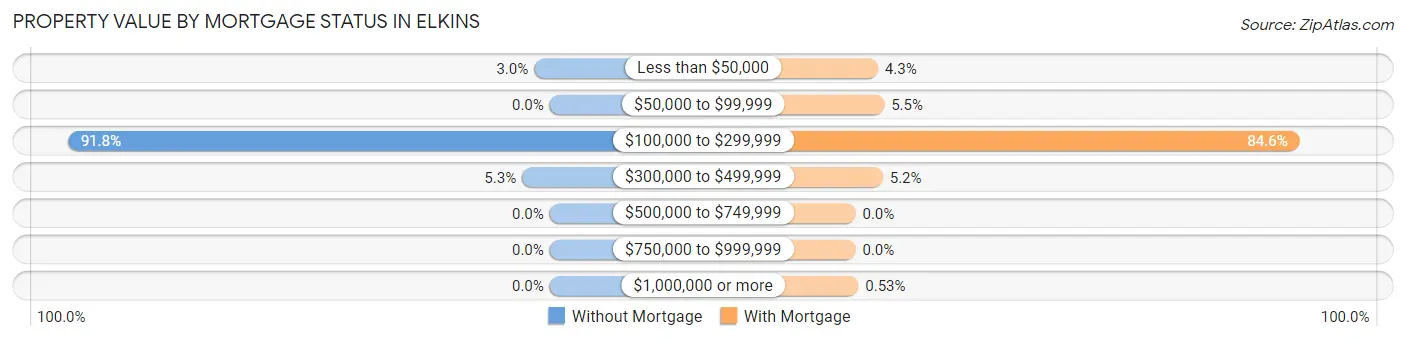
| Property Value | Without Mortgage | With Mortgage |
| Less than $50,000 | 9 (3.0%) | 32 (4.3%) |
| $50,000 to $99,999 | 0 (0.0%) | 41 (5.5%) |
| $100,000 to $299,999 | 279 (91.8%) | 635 (84.6%) |
| $300,000 to $499,999 | 16 (5.3%) | 39 (5.2%) |
| $500,000 to $749,999 | 0 (0.0%) | 0 (0.0%) |
| $750,000 to $999,999 | 0 (0.0%) | 0 (0.0%) |
| $1,000,000 or more | 0 (0.0%) | 4 (0.5%) |
| Total | 304 (100.0%) | 751 (100.0%) |
Household Income by Mortgage Status in Elkins
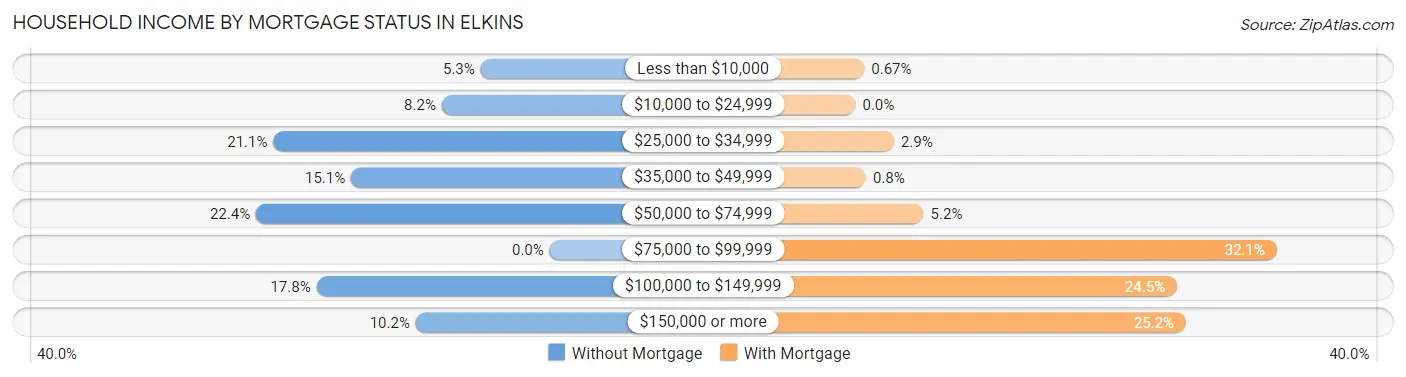
| Household Income | Without Mortgage | With Mortgage |
| Less than $10,000 | 16 (5.3%) | 5 (0.7%) |
| $10,000 to $24,999 | 25 (8.2%) | 0 (0.0%) |
| $25,000 to $34,999 | 64 (21.0%) | 22 (2.9%) |
| $35,000 to $49,999 | 46 (15.1%) | 6 (0.8%) |
| $50,000 to $74,999 | 68 (22.4%) | 39 (5.2%) |
| $75,000 to $99,999 | 0 (0.0%) | 241 (32.1%) |
| $100,000 to $149,999 | 54 (17.8%) | 184 (24.5%) |
| $150,000 or more | 31 (10.2%) | 189 (25.2%) |
| Total | 304 (100.0%) | 751 (100.0%) |
Property Value to Household Income Ratio in Elkins
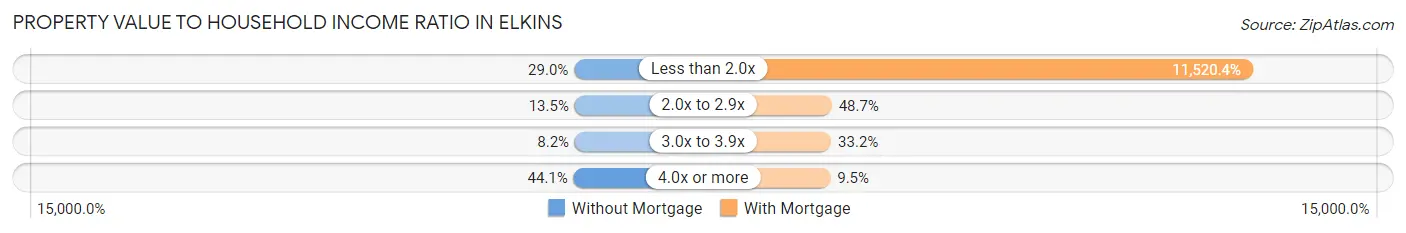
| Value-to-Income Ratio | Without Mortgage | With Mortgage |
| Less than 2.0x | 88 (28.9%) | 86,518 (11,520.4%) |
| 2.0x to 2.9x | 41 (13.5%) | 366 (48.7%) |
| 3.0x to 3.9x | 25 (8.2%) | 249 (33.2%) |
| 4.0x or more | 134 (44.1%) | 71 (9.5%) |
| Total | 304 (100.0%) | 751 (100.0%) |
Real Estate Taxes by Mortgage Status in Elkins
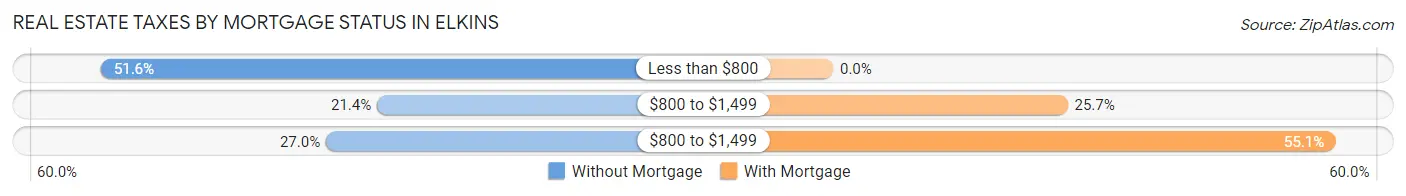
| Property Taxes | Without Mortgage | With Mortgage |
| Less than $800 | 157 (51.6%) | 0 (0.0%) |
| $800 to $1,499 | 65 (21.4%) | 193 (25.7%) |
| $800 to $1,499 | 82 (27.0%) | 414 (55.1%) |
| Total | 304 (100.0%) | 751 (100.0%) |
Health & Disability in Elkins
Health Insurance Coverage by Age in Elkins
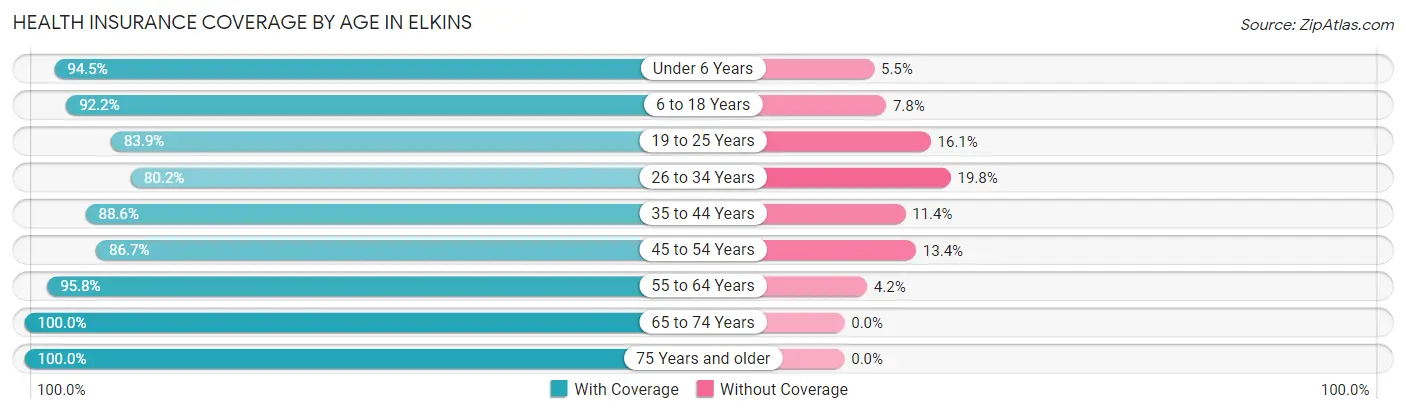
| Age Bracket | With Coverage | Without Coverage |
| Under 6 Years | 256 (94.5%) | 15 (5.5%) |
| 6 to 18 Years | 629 (92.2%) | 53 (7.8%) |
| 19 to 25 Years | 245 (83.9%) | 47 (16.1%) |
| 26 to 34 Years | 473 (80.2%) | 117 (19.8%) |
| 35 to 44 Years | 421 (88.6%) | 54 (11.4%) |
| 45 to 54 Years | 331 (86.7%) | 51 (13.4%) |
| 55 to 64 Years | 409 (95.8%) | 18 (4.2%) |
| 65 to 74 Years | 243 (100.0%) | 0 (0.0%) |
| 75 Years and older | 273 (100.0%) | 0 (0.0%) |
| Total | 3,280 (90.2%) | 355 (9.8%) |
Health Insurance Coverage by Citizenship Status in Elkins
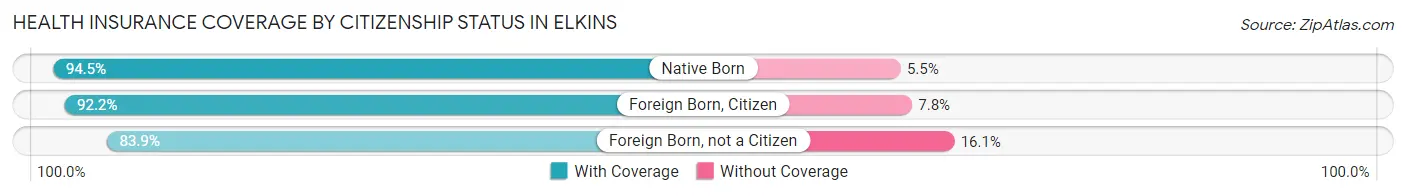
| Citizenship Status | With Coverage | Without Coverage |
| Native Born | 256 (94.5%) | 15 (5.5%) |
| Foreign Born, Citizen | 629 (92.2%) | 53 (7.8%) |
| Foreign Born, not a Citizen | 245 (83.9%) | 47 (16.1%) |
Health Insurance Coverage by Household Income in Elkins
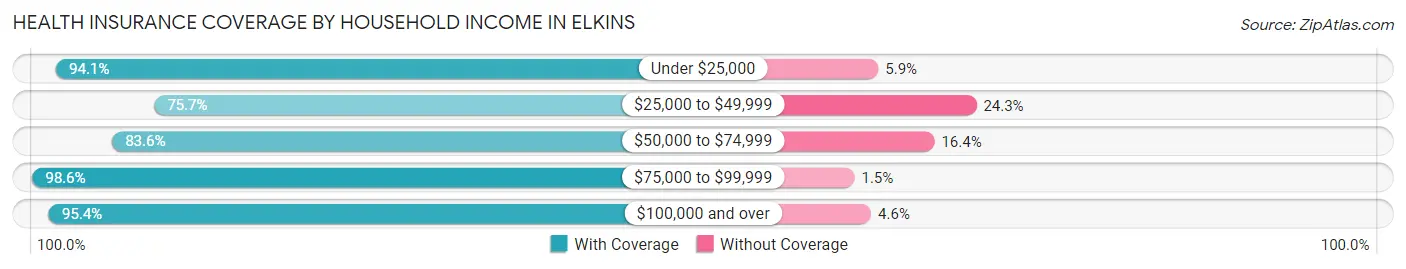
| Household Income | With Coverage | Without Coverage |
| Under $25,000 | 175 (94.1%) | 11 (5.9%) |
| $25,000 to $49,999 | 402 (75.7%) | 129 (24.3%) |
| $50,000 to $74,999 | 773 (83.6%) | 152 (16.4%) |
| $75,000 to $99,999 | 883 (98.6%) | 13 (1.5%) |
| $100,000 and over | 1,047 (95.4%) | 50 (4.6%) |
Public vs Private Health Insurance Coverage by Age in Elkins
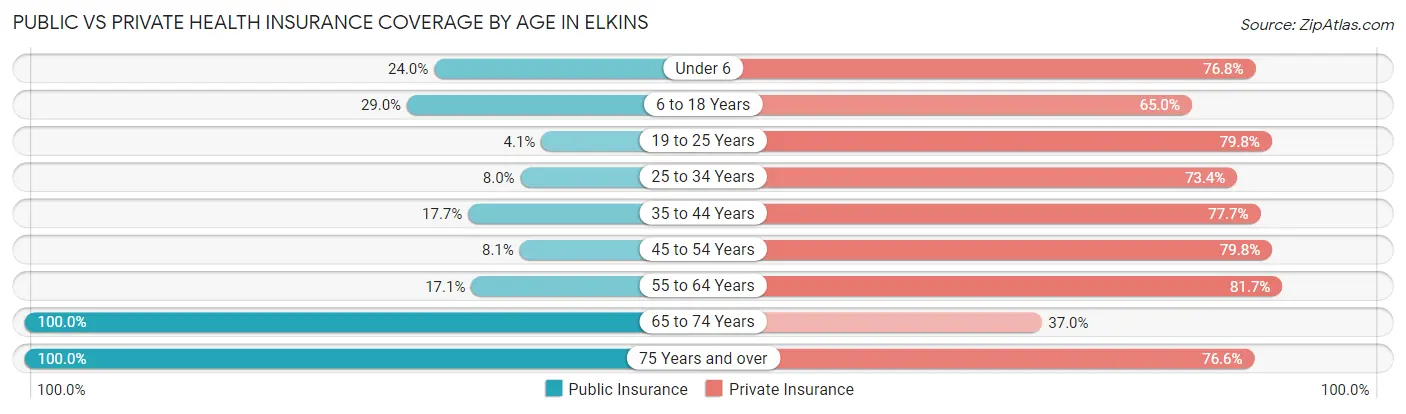
| Age Bracket | Public Insurance | Private Insurance |
| Under 6 | 65 (24.0%) | 208 (76.7%) |
| 6 to 18 Years | 198 (29.0%) | 443 (65.0%) |
| 19 to 25 Years | 12 (4.1%) | 233 (79.8%) |
| 25 to 34 Years | 47 (8.0%) | 433 (73.4%) |
| 35 to 44 Years | 84 (17.7%) | 369 (77.7%) |
| 45 to 54 Years | 31 (8.1%) | 305 (79.8%) |
| 55 to 64 Years | 73 (17.1%) | 349 (81.7%) |
| 65 to 74 Years | 243 (100.0%) | 90 (37.0%) |
| 75 Years and over | 273 (100.0%) | 209 (76.6%) |
| Total | 1,026 (28.2%) | 2,639 (72.6%) |
Disability Status by Sex by Age in Elkins
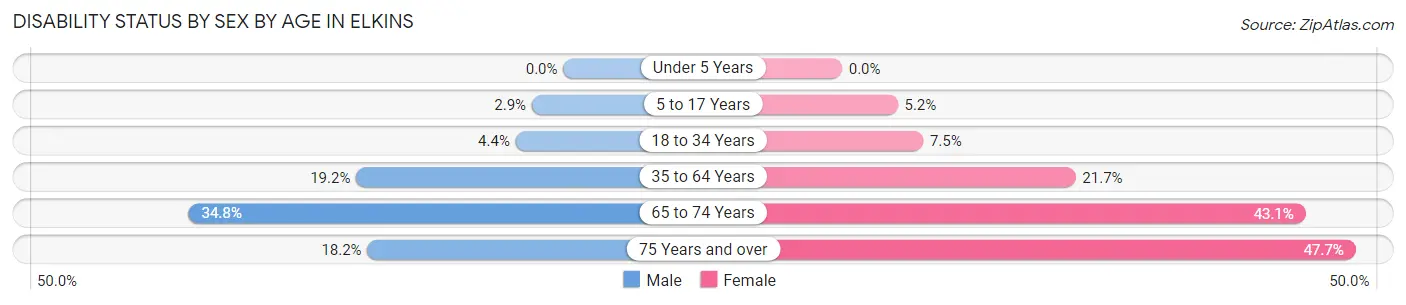
| Age Bracket | Male | Female |
| Under 5 Years | 0 (0.0%) | 0 (0.0%) |
| 5 to 17 Years | 10 (2.9%) | 18 (5.2%) |
| 18 to 34 Years | 25 (4.4%) | 28 (7.5%) |
| 35 to 64 Years | 128 (19.2%) | 134 (21.7%) |
| 65 to 74 Years | 32 (34.8%) | 65 (43.0%) |
| 75 Years and over | 26 (18.2%) | 62 (47.7%) |
Disability Class by Sex by Age in Elkins
Disability Class: Hearing Difficulty
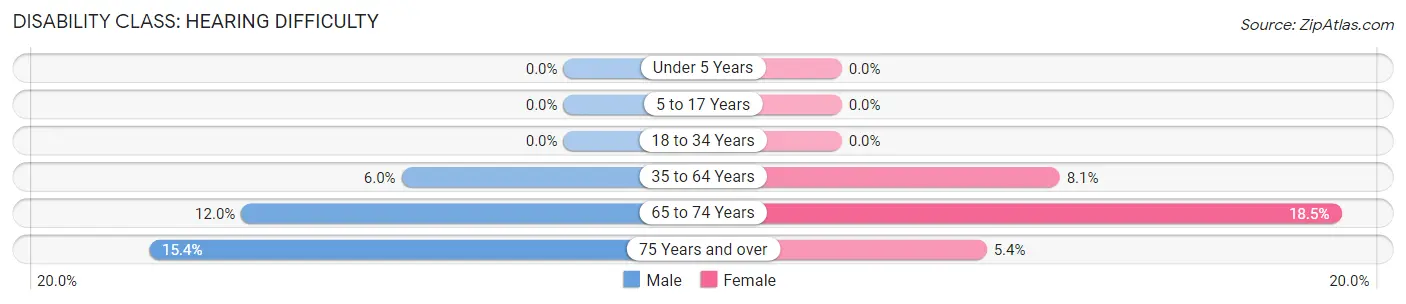
| Age Bracket | Male | Female |
| Under 5 Years | 0 (0.0%) | 0 (0.0%) |
| 5 to 17 Years | 0 (0.0%) | 0 (0.0%) |
| 18 to 34 Years | 0 (0.0%) | 0 (0.0%) |
| 35 to 64 Years | 40 (6.0%) | 50 (8.1%) |
| 65 to 74 Years | 11 (12.0%) | 28 (18.5%) |
| 75 Years and over | 22 (15.4%) | 7 (5.4%) |
Disability Class: Vision Difficulty
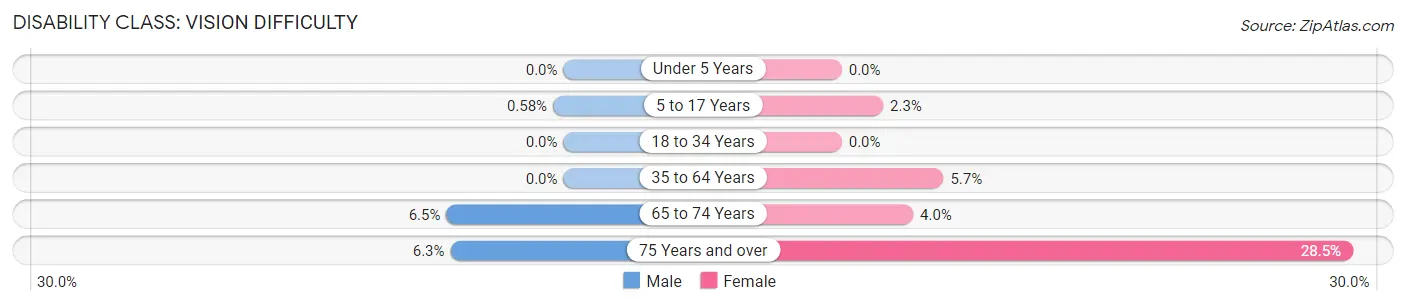
| Age Bracket | Male | Female |
| Under 5 Years | 0 (0.0%) | 0 (0.0%) |
| 5 to 17 Years | 2 (0.6%) | 8 (2.3%) |
| 18 to 34 Years | 0 (0.0%) | 0 (0.0%) |
| 35 to 64 Years | 0 (0.0%) | 35 (5.7%) |
| 65 to 74 Years | 6 (6.5%) | 6 (4.0%) |
| 75 Years and over | 9 (6.3%) | 37 (28.5%) |
Disability Class: Cognitive Difficulty
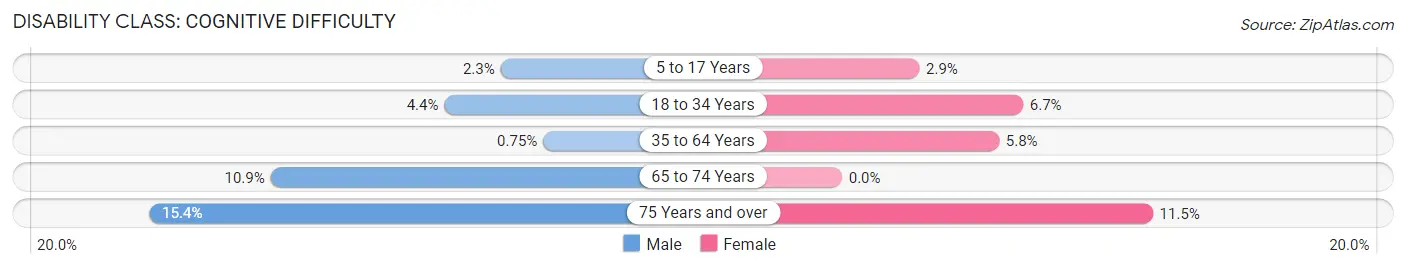
| Age Bracket | Male | Female |
| 5 to 17 Years | 8 (2.3%) | 10 (2.9%) |
| 18 to 34 Years | 25 (4.4%) | 25 (6.7%) |
| 35 to 64 Years | 5 (0.7%) | 36 (5.8%) |
| 65 to 74 Years | 10 (10.9%) | 0 (0.0%) |
| 75 Years and over | 22 (15.4%) | 15 (11.5%) |
Disability Class: Ambulatory Difficulty
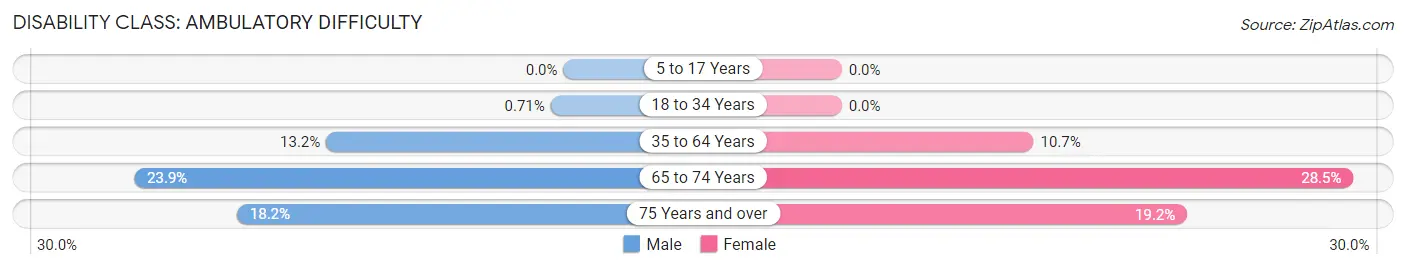
| Age Bracket | Male | Female |
| 5 to 17 Years | 0 (0.0%) | 0 (0.0%) |
| 18 to 34 Years | 4 (0.7%) | 0 (0.0%) |
| 35 to 64 Years | 88 (13.2%) | 66 (10.7%) |
| 65 to 74 Years | 22 (23.9%) | 43 (28.5%) |
| 75 Years and over | 26 (18.2%) | 25 (19.2%) |
Disability Class: Self-Care Difficulty
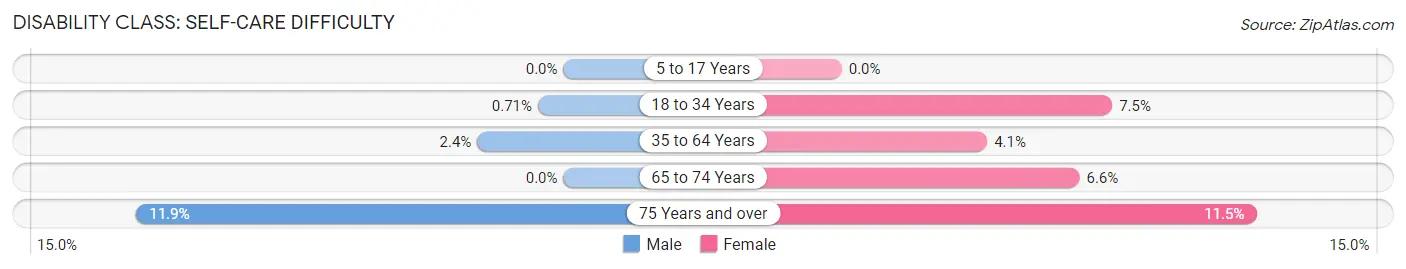
| Age Bracket | Male | Female |
| 5 to 17 Years | 0 (0.0%) | 0 (0.0%) |
| 18 to 34 Years | 4 (0.7%) | 28 (7.5%) |
| 35 to 64 Years | 16 (2.4%) | 25 (4.1%) |
| 65 to 74 Years | 0 (0.0%) | 10 (6.6%) |
| 75 Years and over | 17 (11.9%) | 15 (11.5%) |
Technology Access in Elkins
Computing Device Access in Elkins
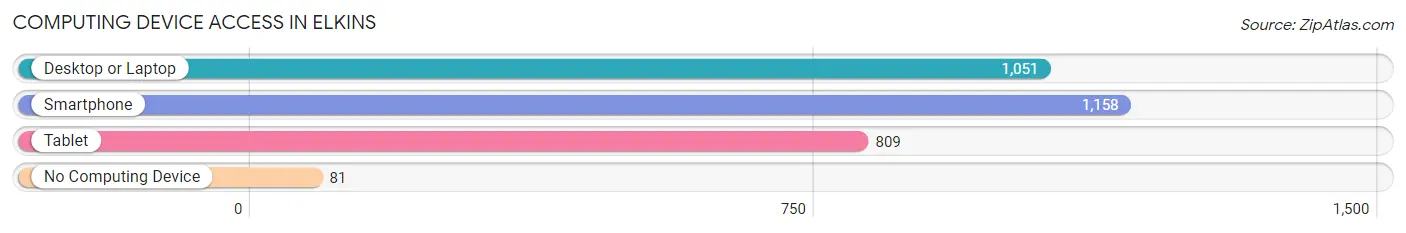
| Device Type | # Households | % Households |
| Desktop or Laptop | 1,051 | 80.3% |
| Smartphone | 1,158 | 88.5% |
| Tablet | 809 | 61.8% |
| No Computing Device | 81 | 6.2% |
| Total | 1,309 | 100.0% |
Internet Access in Elkins
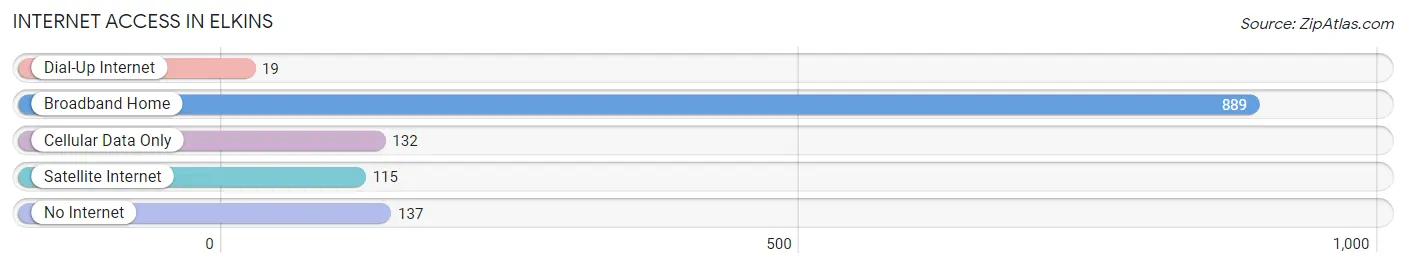
| Internet Type | # Households | % Households |
| Dial-Up Internet | 19 | 1.5% |
| Broadband Home | 889 | 67.9% |
| Cellular Data Only | 132 | 10.1% |
| Satellite Internet | 115 | 8.8% |
| No Internet | 137 | 10.5% |
| Total | 1,309 | 100.0% |
Elkins Summary
Elkins, Arkansas is a small town located in Washington County, Arkansas. It is situated in the Ozark Mountains and is part of the Fayetteville-Springdale-Rogers Metropolitan Statistical Area. The town was founded in 1871 and has a population of approximately 1,500 people.
History
Elkins was founded in 1871 by William Elkins, a former Confederate soldier. He purchased the land from the Cherokee Nation and named the town after himself. The town was originally a farming community, but it soon became a center for timber and coal mining. In the late 19th century, the town was home to several sawmills and coal mines.
In the early 20th century, Elkins experienced a period of growth and development. The town was incorporated in 1912 and the first mayor was elected in 1913. The town was home to several businesses, including a bank, a hotel, a general store, and a post office.
In the 1950s, Elkins experienced a period of decline as the coal and timber industries declined. The town was also affected by the Great Depression and World War II. However, in the late 20th century, the town experienced a period of revitalization. The town was home to several new businesses, including a grocery store, a hardware store, and a restaurant.
Geography
Elkins is located in the Ozark Mountains in northwestern Arkansas. The town is situated in the foothills of the Ozarks and is surrounded by rolling hills and forests. The town is located near the White River and is approximately 30 miles from Fayetteville, Arkansas.
The climate in Elkins is humid subtropical, with hot summers and mild winters. The average annual temperature is around 60 degrees Fahrenheit. The town receives an average of 45 inches of precipitation per year.
Economy
The economy of Elkins is largely based on agriculture and tourism. The town is home to several farms, which produce a variety of crops, including corn, soybeans, and wheat. The town is also home to several tourist attractions, including the Ozark National Forest and the White River.
The town is home to several businesses, including a grocery store, a hardware store, and a restaurant. The town is also home to several small manufacturing companies, which produce a variety of products, including furniture and clothing.
Demographics
As of the 2010 census, the population of Elkins was 1,500. The town is predominantly white, with approximately 95% of the population being white. The median household income is around $35,000 and the median home value is around $90,000. The town has a low unemployment rate of around 4%.
Elkins is a small town with a close-knit community. The town is home to several churches, including the First Baptist Church and the Church of Christ. The town is also home to several schools, including Elkins Elementary School and Elkins High School.
Conclusion
Elkins, Arkansas is a small town located in the Ozark Mountains. The town was founded in 1871 and has a population of approximately 1,500 people. The economy of Elkins is largely based on agriculture and tourism. The town is predominantly white, with a median household income of around $35,000 and a median home value of around $90,000. Elkins is a close-knit community with several churches and schools.
Common Questions
What is Per Capita Income in Elkins?
Per Capita income in Elkins is $29,438.
What is the Median Family Income in Elkins?
Median Family Income in Elkins is $83,333.
What is the Median Household income in Elkins?
Median Household Income in Elkins is $72,940.
What is Income or Wage Gap in Elkins?
Income or Wage Gap in Elkins is 18.1%.
Women in Elkins earn 81.9 cents for every dollar earned by a man.
What is Inequality or Gini Index in Elkins?
Inequality or Gini Index in Elkins is 0.31.
What is the Total Population of Elkins?
Total Population of Elkins is 3,635.
What is the Total Male Population of Elkins?
Total Male Population of Elkins is 1,929.
What is the Total Female Population of Elkins?
Total Female Population of Elkins is 1,706.
What is the Ratio of Males per 100 Females in Elkins?
There are 113.07 Males per 100 Females in Elkins.
What is the Ratio of Females per 100 Males in Elkins?
There are 88.44 Females per 100 Males in Elkins.
What is the Median Population Age in Elkins?
Median Population Age in Elkins is 34.7 Years.
What is the Average Family Size in Elkins
Average Family Size in Elkins is 3.2 People.
What is the Average Household Size in Elkins
Average Household Size in Elkins is 2.8 People.
How Large is the Labor Force in Elkins?
There are 1,864 People in the Labor Forcein in Elkins.
What is the Percentage of People in the Labor Force in Elkins?
64.9% of People are in the Labor Force in Elkins.
What is the Unemployment Rate in Elkins?
Unemployment Rate in Elkins is 1.4%.