Twin Groves, AR Map & Demographics
Twin Groves Map
Twin Groves Overview
$18,413
PER CAPITA INCOME
$37,107
AVG FAMILY INCOME
$36,429
AVG HOUSEHOLD INCOME
0.39
INEQUALITY / GINI INDEX
286
TOTAL POPULATION
124
MALE POPULATION
162
FEMALE POPULATION
76.54
MALES / 100 FEMALES
130.65
FEMALES / 100 MALES
58.0
MEDIAN AGE
2.5
AVG FAMILY SIZE
2.2
AVG HOUSEHOLD SIZE
96
LABOR FORCE [ PEOPLE ]
39.5%
PERCENT IN LABOR FORCE
4.2%
UNEMPLOYMENT RATE
Twin Groves Area Codes
Income in Twin Groves
Income Overview in Twin Groves
Per Capita Income in Twin Groves is $18,413, while median incomes of families and households are $37,107 and $36,429 respectively.
| Characteristic | Number | Measure |
| Per Capita Income | 286 | $18,413 |
| Median Family Income | 103 | $37,107 |
| Mean Family Income | 103 | $49,983 |
| Median Household Income | 130 | $36,429 |
| Mean Household Income | 130 | $43,030 |
| Income Deficit | 103 | $0 |
| Wage / Income Gap (%) | 286 | 0.00% |
| Wage / Income Gap ($) | 286 | 100.00¢ per $1 |
| Gini / Inequality Index | 286 | 0.39 |
Earnings by Sex in Twin Groves
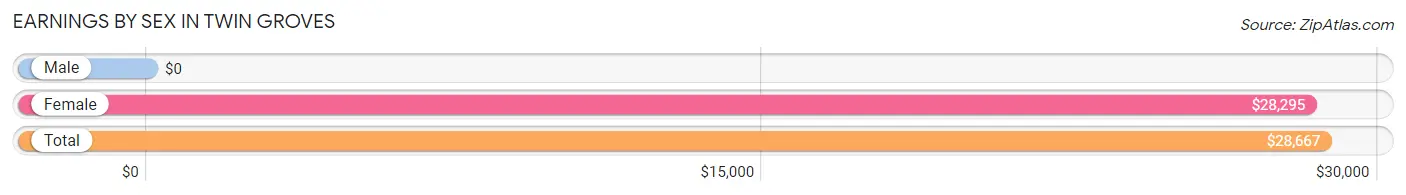
| Sex | Number | Average Earnings |
| Male | 37 (38.5%) | $0 |
| Female | 59 (61.5%) | $28,295 |
| Total | 96 (100.0%) | $28,667 |
Earnings by Sex by Income Bracket in Twin Groves
The most common earnings brackets in Twin Groves are $2,499 or less for men (7 | 18.9%) and $25,000 to $29,999 for women (13 | 22.0%).
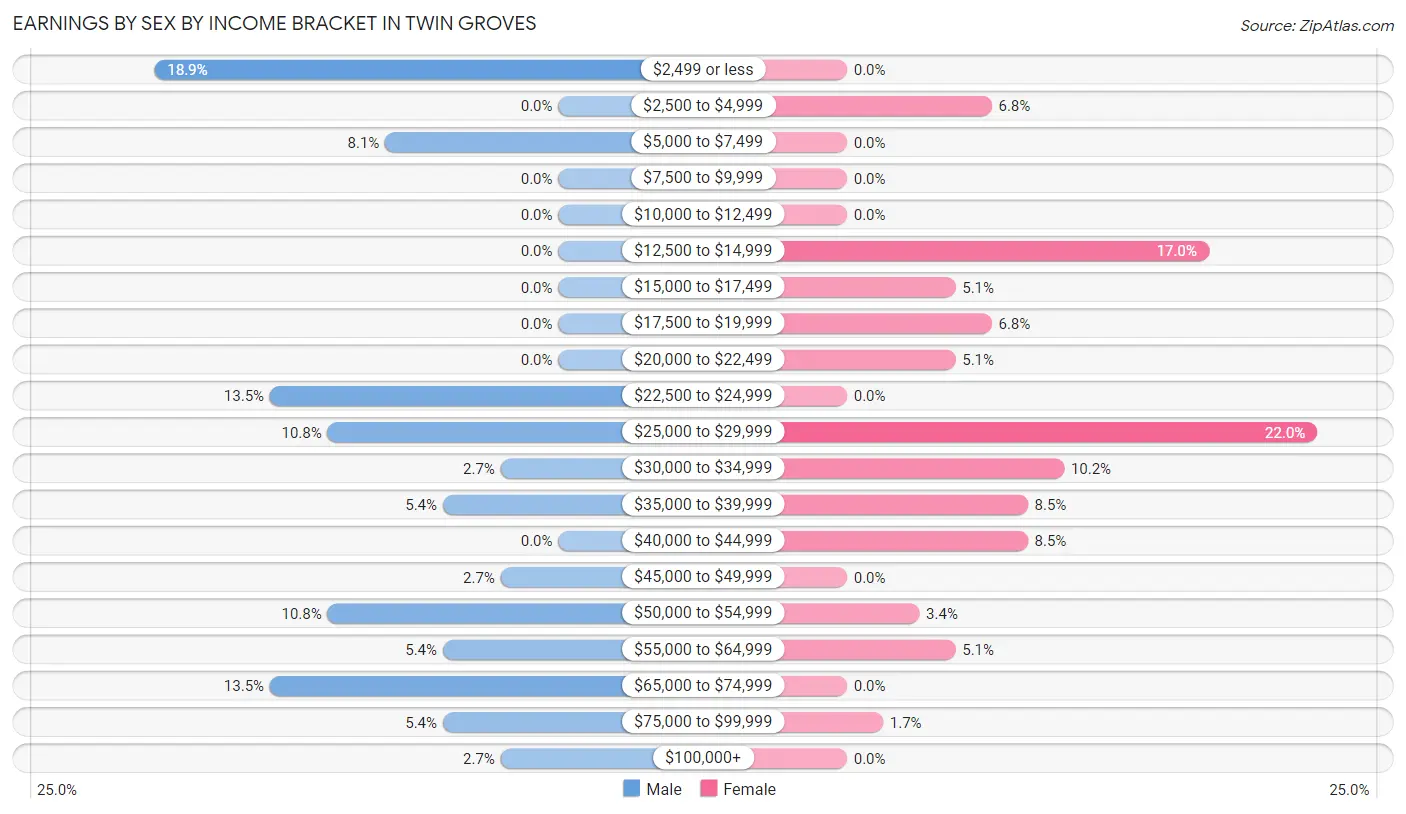
| Income | Male | Female |
| $2,499 or less | 7 (18.9%) | 0 (0.0%) |
| $2,500 to $4,999 | 0 (0.0%) | 4 (6.8%) |
| $5,000 to $7,499 | 3 (8.1%) | 0 (0.0%) |
| $7,500 to $9,999 | 0 (0.0%) | 0 (0.0%) |
| $10,000 to $12,499 | 0 (0.0%) | 0 (0.0%) |
| $12,500 to $14,999 | 0 (0.0%) | 10 (17.0%) |
| $15,000 to $17,499 | 0 (0.0%) | 3 (5.1%) |
| $17,500 to $19,999 | 0 (0.0%) | 4 (6.8%) |
| $20,000 to $22,499 | 0 (0.0%) | 3 (5.1%) |
| $22,500 to $24,999 | 5 (13.5%) | 0 (0.0%) |
| $25,000 to $29,999 | 4 (10.8%) | 13 (22.0%) |
| $30,000 to $34,999 | 1 (2.7%) | 6 (10.2%) |
| $35,000 to $39,999 | 2 (5.4%) | 5 (8.5%) |
| $40,000 to $44,999 | 0 (0.0%) | 5 (8.5%) |
| $45,000 to $49,999 | 1 (2.7%) | 0 (0.0%) |
| $50,000 to $54,999 | 4 (10.8%) | 2 (3.4%) |
| $55,000 to $64,999 | 2 (5.4%) | 3 (5.1%) |
| $65,000 to $74,999 | 5 (13.5%) | 0 (0.0%) |
| $75,000 to $99,999 | 2 (5.4%) | 1 (1.7%) |
| $100,000+ | 1 (2.7%) | 0 (0.0%) |
| Total | 37 (100.0%) | 59 (100.0%) |
Earnings by Sex by Educational Attainment in Twin Groves
Average earnings in Twin Groves are $52,500 for men and $28,523 for women, a difference of 45.7%. Men with an educational attainment of high school diploma enjoy the highest average annual earnings of $53,750, while those with high school diploma education earn the least with $53,750. Women with an educational attainment of graduate degree earn the most with the average annual earnings of $44,167, while those with high school diploma education have the smallest earnings of $16,875.
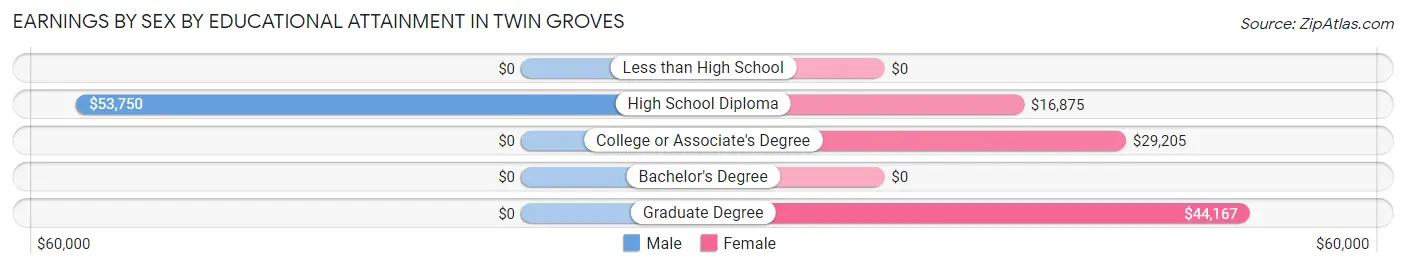
| Educational Attainment | Male Income | Female Income |
| Less than High School | - | - |
| High School Diploma | $53,750 | $16,875 |
| College or Associate's Degree | - | - |
| Bachelor's Degree | - | - |
| Graduate Degree | - | - |
| Total | $52,500 | $28,523 |
Family Income in Twin Groves
Family Income Brackets in Twin Groves
According to the Twin Groves family income data, there are 42 families falling into the $35,000 to $49,999 income range, which is the most common income bracket and makes up 40.8% of all families.
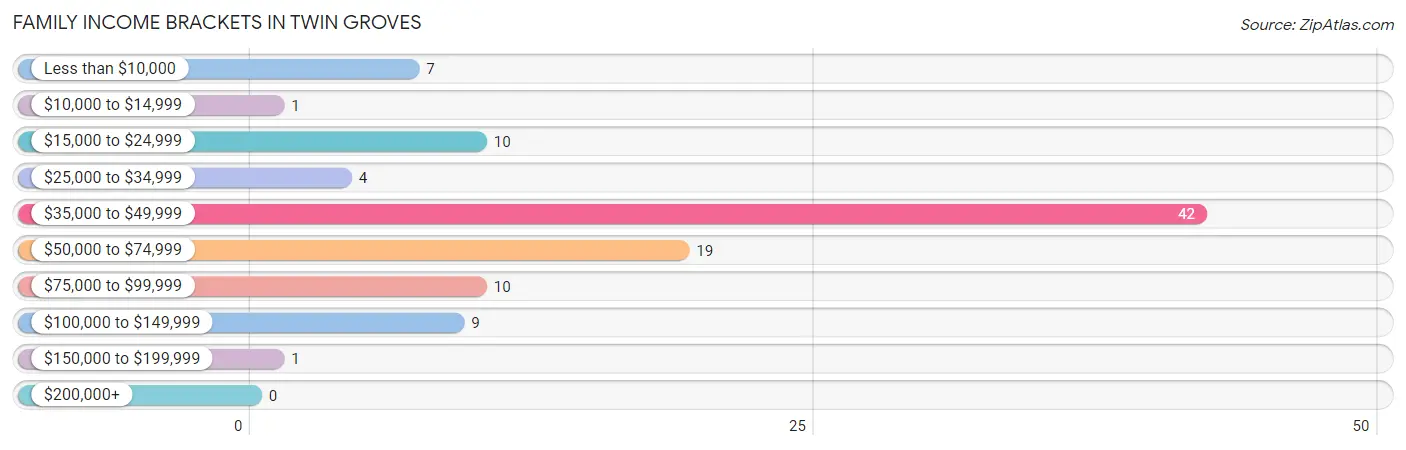
| Income Bracket | # Families | % Families |
| Less than $10,000 | 7 | 6.8% |
| $10,000 to $14,999 | 1 | 1.0% |
| $15,000 to $24,999 | 10 | 9.7% |
| $25,000 to $34,999 | 4 | 3.9% |
| $35,000 to $49,999 | 42 | 40.8% |
| $50,000 to $74,999 | 19 | 18.4% |
| $75,000 to $99,999 | 10 | 9.7% |
| $100,000 to $149,999 | 9 | 8.7% |
| $150,000 to $199,999 | 1 | 1.0% |
| $200,000+ | 0 | 0.0% |
Family Income by Famaliy Size in Twin Groves
3-person families (14 | 13.6%) account for the highest median family income in Twin Groves with $58,500 per family, while 3-person families (14 | 13.6%) have the highest median income of $19,500 per family member.
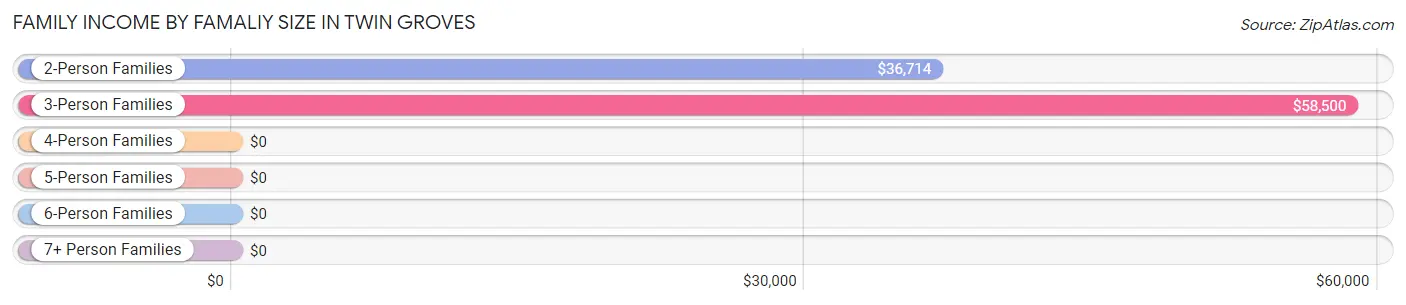
| Income Bracket | # Families | Median Income |
| 2-Person Families | 76 (73.8%) | $36,714 |
| 3-Person Families | 14 (13.6%) | $58,500 |
| 4-Person Families | 7 (6.8%) | $0 |
| 5-Person Families | 0 (0.0%) | $0 |
| 6-Person Families | 6 (5.8%) | $0 |
| 7+ Person Families | 0 (0.0%) | $0 |
| Total | 103 (100.0%) | $37,107 |
Family Income by Number of Earners in Twin Groves

| Number of Earners | # Families | Median Income |
| No Earners | 54 (52.4%) | $36,061 |
| 1 Earner | 24 (23.3%) | $45,833 |
| 2 Earners | 18 (17.5%) | $0 |
| 3+ Earners | 7 (6.8%) | $0 |
| Total | 103 (100.0%) | $37,107 |
Household Income in Twin Groves
Household Income Brackets in Twin Groves
With 46 households falling in the category, the $35,000 to $49,999 income range is the most frequent in Twin Groves, accounting for 35.4% of all households.
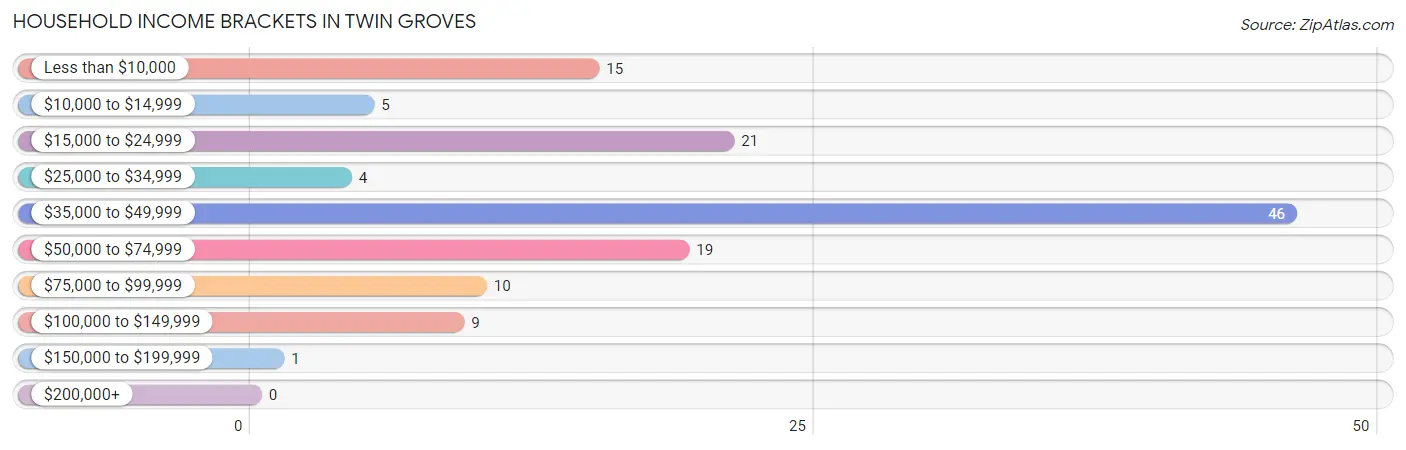
| Income Bracket | # Households | % Households |
| Less than $10,000 | 15 | 11.5% |
| $10,000 to $14,999 | 5 | 3.8% |
| $15,000 to $24,999 | 21 | 16.2% |
| $25,000 to $34,999 | 4 | 3.1% |
| $35,000 to $49,999 | 46 | 35.4% |
| $50,000 to $74,999 | 19 | 14.6% |
| $75,000 to $99,999 | 10 | 7.7% |
| $100,000 to $149,999 | 9 | 6.9% |
| $150,000 to $199,999 | 1 | 0.8% |
| $200,000+ | 0 | 0.0% |
Household Income by Householder Age in Twin Groves
The median household income in Twin Groves is $36,429, with the highest median household income of $36,174 found in the 65+ years age bracket for the primary householder. A total of 73 households (56.1%) fall into this category. Meanwhile, the 15 to 24 years age bracket for the primary householder has the lowest median household income of $0, with 7 households (5.4%) in this group.
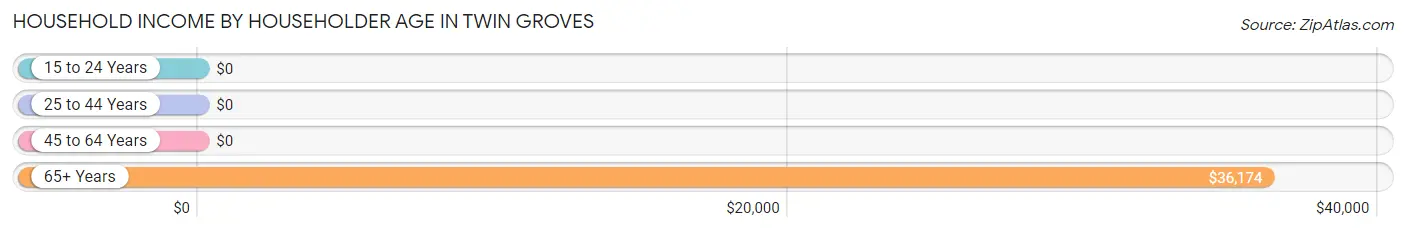
| Income Bracket | # Households | Median Income |
| 15 to 24 Years | 7 (5.4%) | $0 |
| 25 to 44 Years | 15 (11.5%) | $0 |
| 45 to 64 Years | 35 (26.9%) | $0 |
| 65+ Years | 73 (56.1%) | $36,174 |
| Total | 130 (100.0%) | $36,429 |
Poverty in Twin Groves
Income Below Poverty by Sex and Age in Twin Groves
With 39.5% poverty level for males and 21.7% for females among the residents of Twin Groves, under 5 year old males and 35 to 44 year old females are the most vulnerable to poverty, with 17 males (100.0%) and 9 females (64.3%) in their respective age groups living below the poverty level.
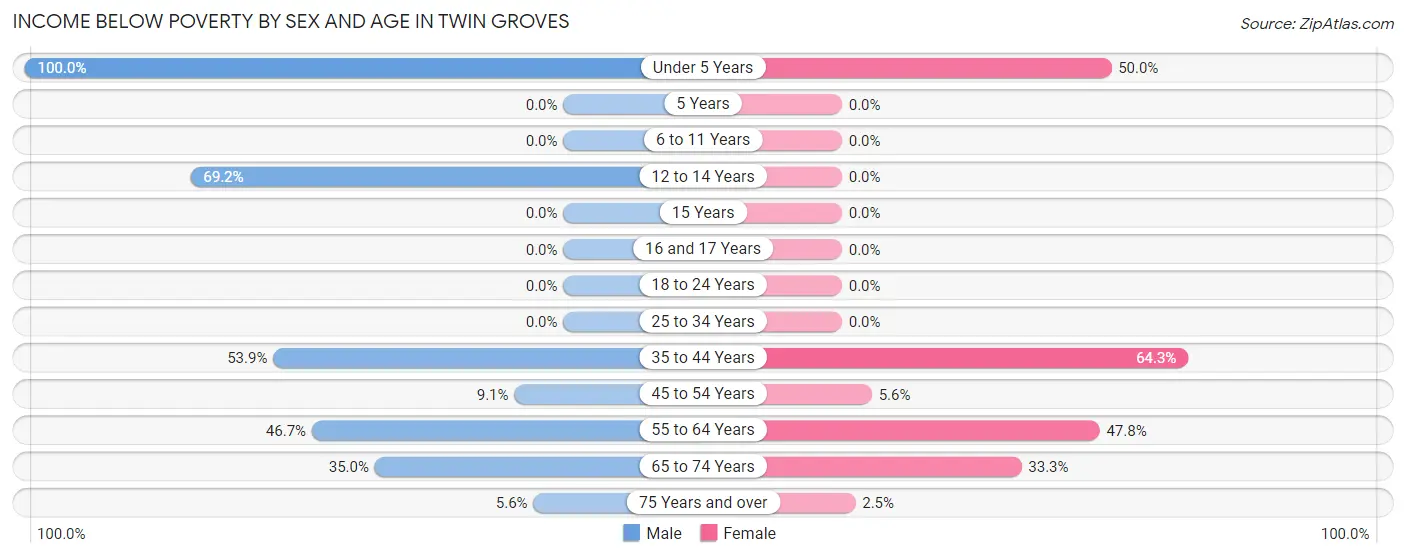
| Age Bracket | Male | Female |
| Under 5 Years | 17 (100.0%) | 3 (50.0%) |
| 5 Years | 0 (0.0%) | 0 (0.0%) |
| 6 to 11 Years | 0 (0.0%) | 0 (0.0%) |
| 12 to 14 Years | 9 (69.2%) | 0 (0.0%) |
| 15 Years | 0 (0.0%) | 0 (0.0%) |
| 16 and 17 Years | 0 (0.0%) | 0 (0.0%) |
| 18 to 24 Years | 0 (0.0%) | 0 (0.0%) |
| 25 to 34 Years | 0 (0.0%) | 0 (0.0%) |
| 35 to 44 Years | 7 (53.8%) | 9 (64.3%) |
| 45 to 54 Years | 1 (9.1%) | 1 (5.6%) |
| 55 to 64 Years | 7 (46.7%) | 11 (47.8%) |
| 65 to 74 Years | 7 (35.0%) | 10 (33.3%) |
| 75 Years and over | 1 (5.6%) | 1 (2.5%) |
| Total | 49 (39.5%) | 35 (21.7%) |
Income Above Poverty by Sex and Age in Twin Groves
According to the poverty statistics in Twin Groves, males aged 6 to 11 years and females aged 6 to 11 years are the age groups that are most secure financially, with 100.0% of males and 100.0% of females in these age groups living above the poverty line.
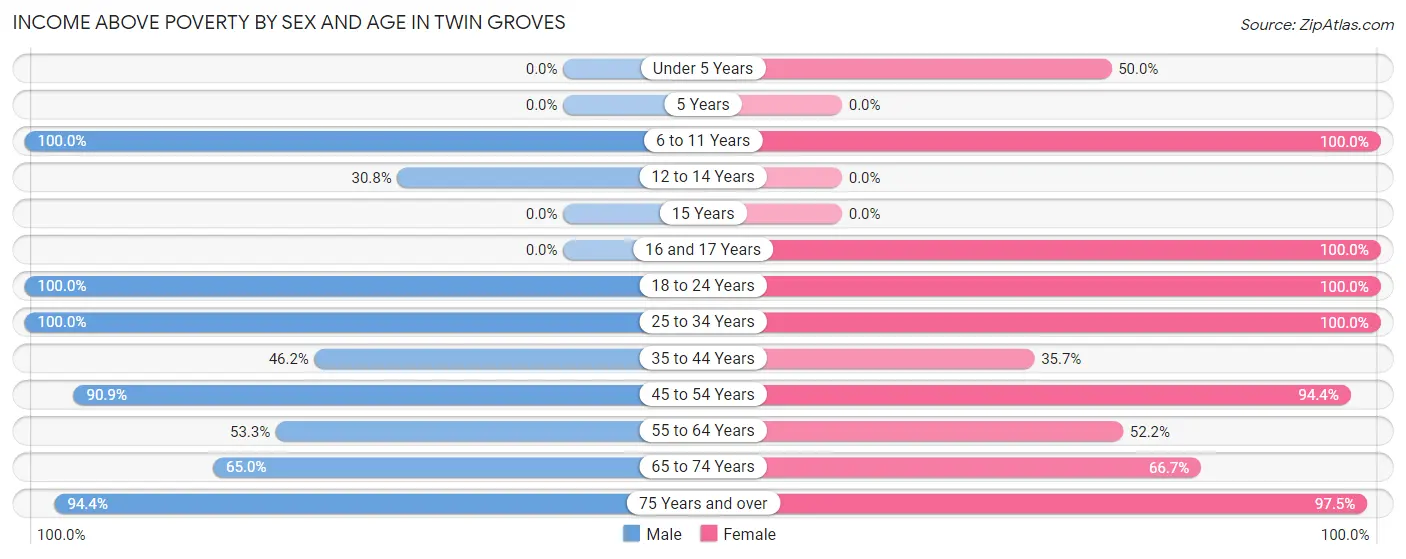
| Age Bracket | Male | Female |
| Under 5 Years | 0 (0.0%) | 3 (50.0%) |
| 5 Years | 0 (0.0%) | 0 (0.0%) |
| 6 to 11 Years | 1 (100.0%) | 5 (100.0%) |
| 12 to 14 Years | 4 (30.8%) | 0 (0.0%) |
| 15 Years | 0 (0.0%) | 0 (0.0%) |
| 16 and 17 Years | 0 (0.0%) | 6 (100.0%) |
| 18 to 24 Years | 11 (100.0%) | 11 (100.0%) |
| 25 to 34 Years | 5 (100.0%) | 8 (100.0%) |
| 35 to 44 Years | 6 (46.2%) | 5 (35.7%) |
| 45 to 54 Years | 10 (90.9%) | 17 (94.4%) |
| 55 to 64 Years | 8 (53.3%) | 12 (52.2%) |
| 65 to 74 Years | 13 (65.0%) | 20 (66.7%) |
| 75 Years and over | 17 (94.4%) | 39 (97.5%) |
| Total | 75 (60.5%) | 126 (78.3%) |
Income Below Poverty Among Married-Couple Families in Twin Groves
The poverty statistics for married-couple families in Twin Groves show that 14.6% or 13 of the total 89 families live below the poverty line. Families with 1 or 2 children have the highest poverty rate of 35.3%, comprising of 6 families. On the other hand, families with no children have the lowest poverty rate of 9.7%, which includes 7 families.
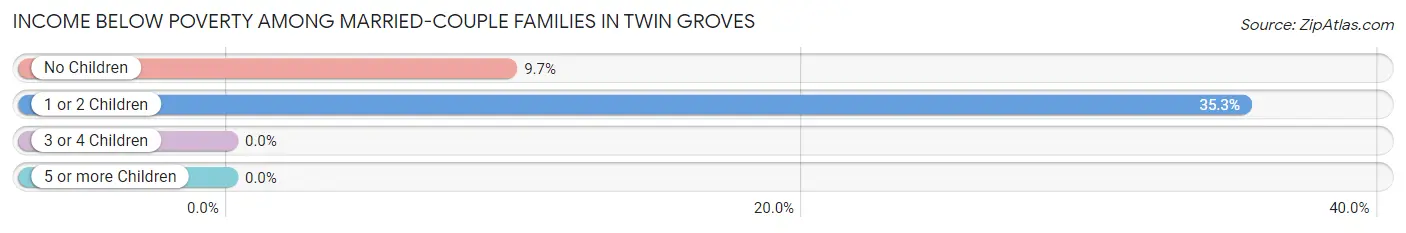
| Children | Above Poverty | Below Poverty |
| No Children | 65 (90.3%) | 7 (9.7%) |
| 1 or 2 Children | 11 (64.7%) | 6 (35.3%) |
| 3 or 4 Children | 0 (0.0%) | 0 (0.0%) |
| 5 or more Children | 0 (0.0%) | 0 (0.0%) |
| Total | 76 (85.4%) | 13 (14.6%) |
Income Below Poverty Among Single-Parent Households in Twin Groves
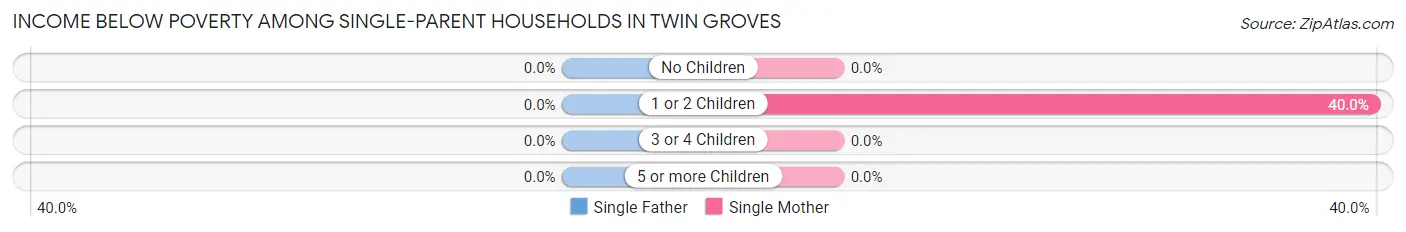
| Children | Single Father | Single Mother |
| No Children | 0 (0.0%) | 0 (0.0%) |
| 1 or 2 Children | 0 (0.0%) | 2 (40.0%) |
| 3 or 4 Children | 0 (0.0%) | 0 (0.0%) |
| 5 or more Children | 0 (0.0%) | 0 (0.0%) |
| Total | 0 (0.0%) | 2 (20.0%) |
Income Below Poverty Among Married-Couple vs Single-Parent Households in Twin Groves
The poverty data for Twin Groves shows that 13 of the married-couple family households (14.6%) and 2 of the single-parent households (14.3%) are living below the poverty level. Within the married-couple family households, those with 1 or 2 children have the highest poverty rate, with 6 households (35.3%) falling below the poverty line. Among the single-parent households, those with 1 or 2 children have the highest poverty rate, with 2 household (28.6%) living below poverty.
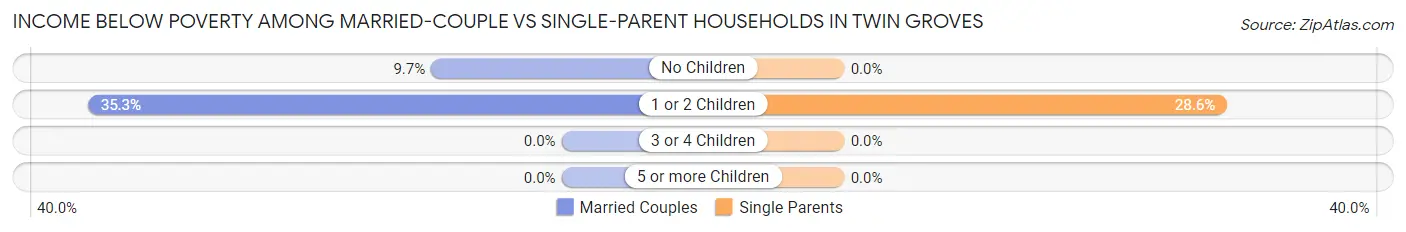
| Children | Married-Couple Families | Single-Parent Households |
| No Children | 7 (9.7%) | 0 (0.0%) |
| 1 or 2 Children | 6 (35.3%) | 2 (28.6%) |
| 3 or 4 Children | 0 (0.0%) | 0 (0.0%) |
| 5 or more Children | 0 (0.0%) | 0 (0.0%) |
| Total | 13 (14.6%) | 2 (14.3%) |
Race in Twin Groves
The most populous races in Twin Groves are Black / African American (189 | 66.1%), White / Caucasian (86 | 30.1%), and Two or more Races (11 | 3.8%).
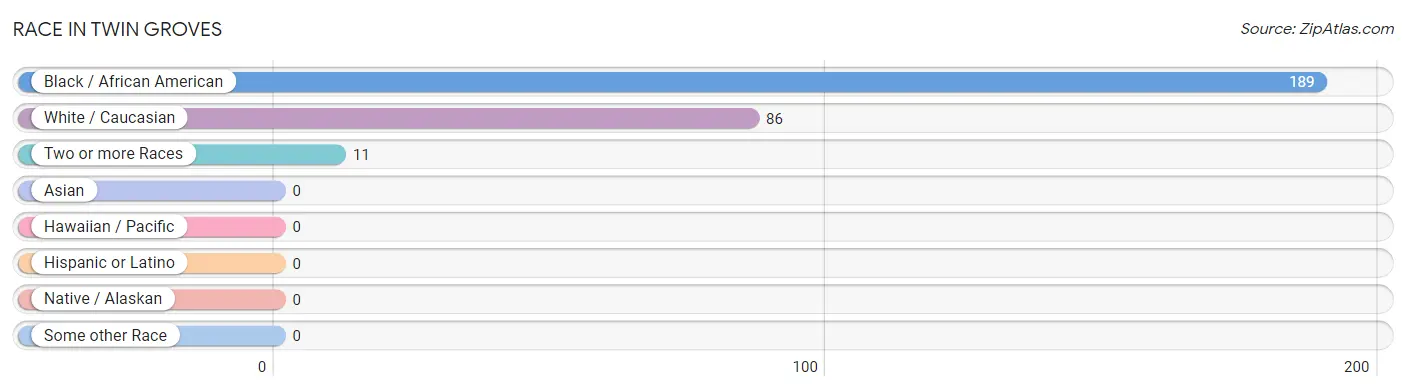
| Race | # Population | % Population |
| Asian | 0 | 0.0% |
| Black / African American | 189 | 66.1% |
| Hawaiian / Pacific | 0 | 0.0% |
| Hispanic or Latino | 0 | 0.0% |
| Native / Alaskan | 0 | 0.0% |
| White / Caucasian | 86 | 30.1% |
| Two or more Races | 11 | 3.8% |
| Some other Race | 0 | 0.0% |
| Total | 286 | 100.0% |
Ancestry in Twin Groves
The most populous ancestries reported in Twin Groves are English (12 | 4.2%), German (6 | 2.1%), American (3 | 1.1%), British (2 | 0.7%), and French (2 | 0.7%), together accounting for 8.8% of all Twin Groves residents.
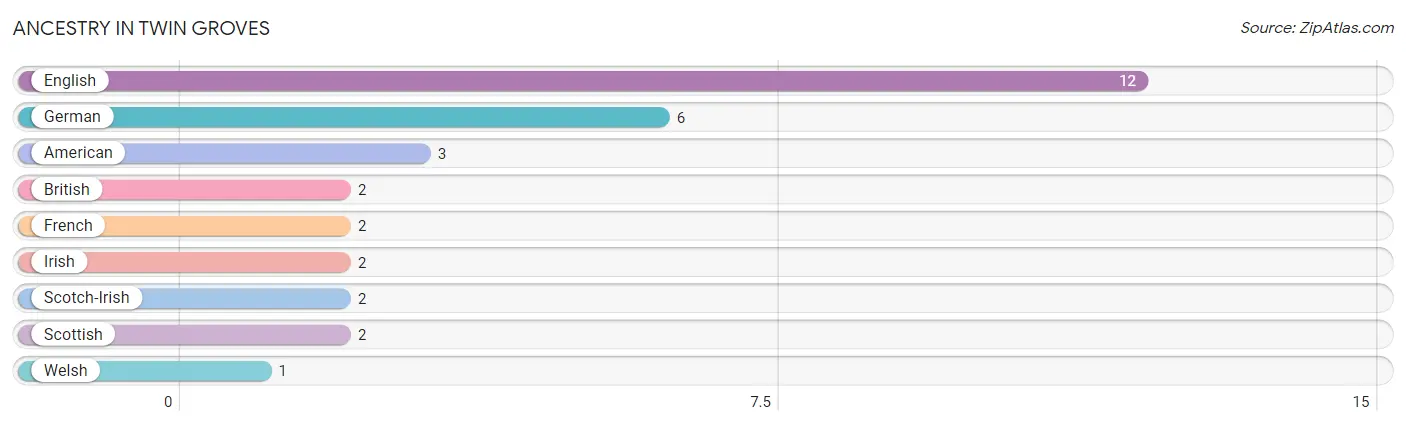
| Ancestry | # Population | % Population |
| American | 3 | 1.1% |
| British | 2 | 0.7% |
| English | 12 | 4.2% |
| French | 2 | 0.7% |
| German | 6 | 2.1% |
| Irish | 2 | 0.7% |
| Scotch-Irish | 2 | 0.7% |
| Scottish | 2 | 0.7% |
| Welsh | 1 | 0.4% | View All 9 Rows |
Immigrants in Twin Groves

| Immigration Origin | # Population | % Population | View All 0 Rows |
Sex and Age in Twin Groves
Sex and Age in Twin Groves
The most populous age groups in Twin Groves are Under 5 Years (17 | 13.7%) for men and 75 to 79 Years (34 | 21.0%) for women.
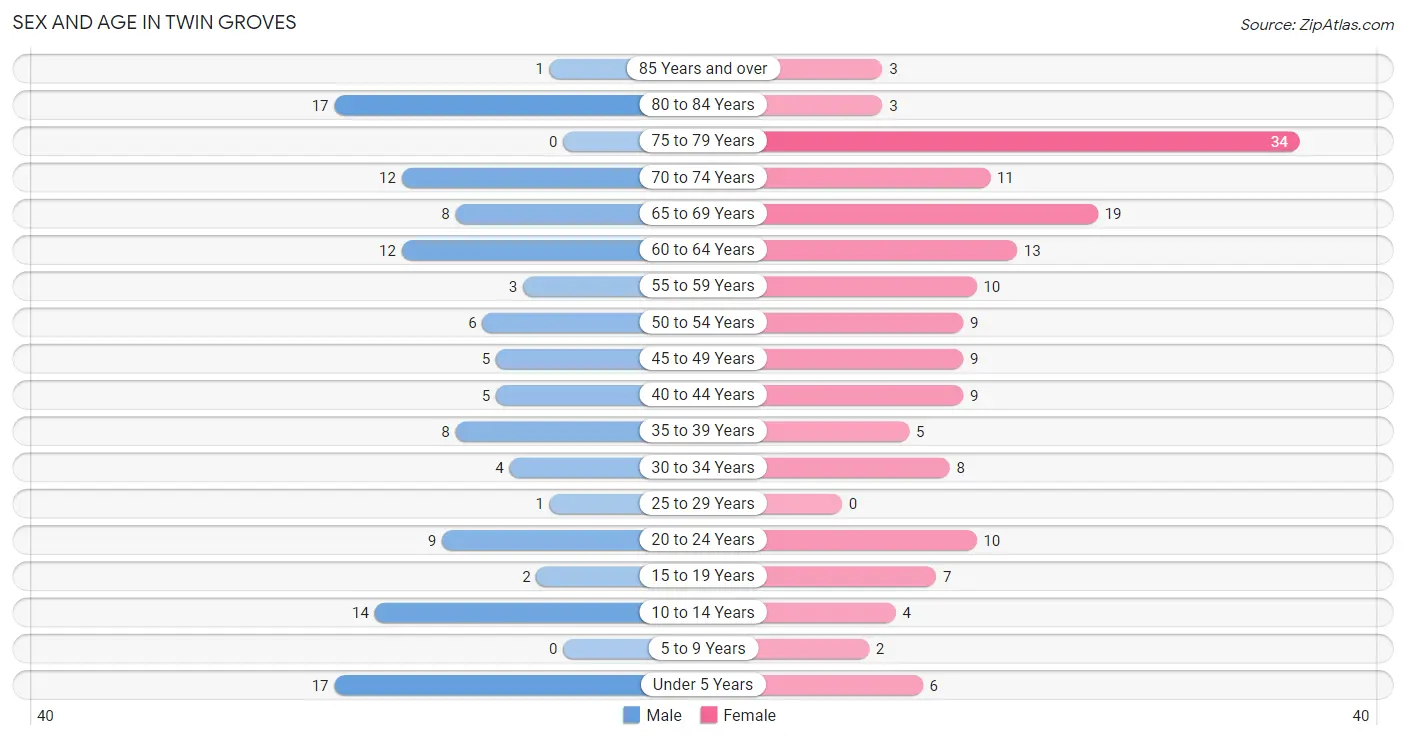
| Age Bracket | Male | Female |
| Under 5 Years | 17 (13.7%) | 6 (3.7%) |
| 5 to 9 Years | 0 (0.0%) | 2 (1.2%) |
| 10 to 14 Years | 14 (11.3%) | 4 (2.5%) |
| 15 to 19 Years | 2 (1.6%) | 7 (4.3%) |
| 20 to 24 Years | 9 (7.3%) | 10 (6.2%) |
| 25 to 29 Years | 1 (0.8%) | 0 (0.0%) |
| 30 to 34 Years | 4 (3.2%) | 8 (4.9%) |
| 35 to 39 Years | 8 (6.5%) | 5 (3.1%) |
| 40 to 44 Years | 5 (4.0%) | 9 (5.6%) |
| 45 to 49 Years | 5 (4.0%) | 9 (5.6%) |
| 50 to 54 Years | 6 (4.8%) | 9 (5.6%) |
| 55 to 59 Years | 3 (2.4%) | 10 (6.2%) |
| 60 to 64 Years | 12 (9.7%) | 13 (8.0%) |
| 65 to 69 Years | 8 (6.5%) | 19 (11.7%) |
| 70 to 74 Years | 12 (9.7%) | 11 (6.8%) |
| 75 to 79 Years | 0 (0.0%) | 34 (21.0%) |
| 80 to 84 Years | 17 (13.7%) | 3 (1.8%) |
| 85 Years and over | 1 (0.8%) | 3 (1.8%) |
| Total | 124 (100.0%) | 162 (100.0%) |
Families and Households in Twin Groves
Median Family Size in Twin Groves
The median family size in Twin Groves is 2.49 persons per family, with single female/mother families (10 | 9.7%) accounting for the largest median family size of 3 persons per family. On the other hand, married-couple families (89 | 86.4%) represent the smallest median family size with 2.42 persons per family.
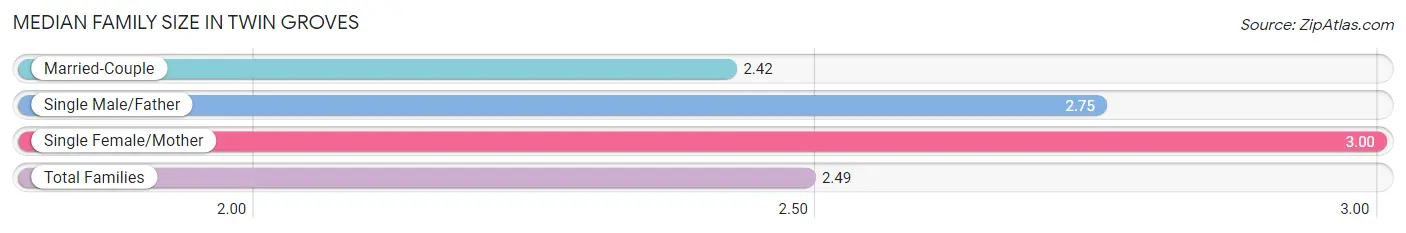
| Family Type | # Families | Family Size |
| Married-Couple | 89 (86.4%) | 2.42 |
| Single Male/Father | 4 (3.9%) | 2.75 |
| Single Female/Mother | 10 (9.7%) | 3.00 |
| Total Families | 103 (100.0%) | 2.49 |
Median Household Size in Twin Groves
The median household size in Twin Groves is 2.20 persons per household, with single female/mother households (10 | 7.7%) accounting for the largest median household size of 3 persons per household. non-family households (27 | 20.8%) represent the smallest median household size with 1.11 persons per household.
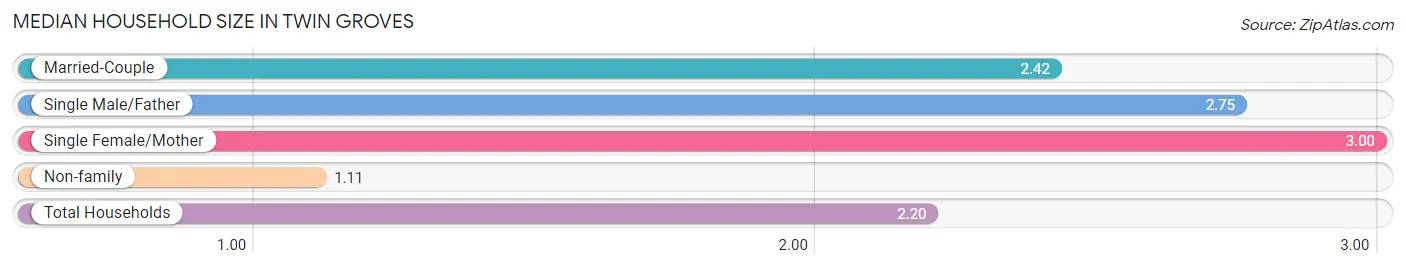
| Household Type | # Households | Household Size |
| Married-Couple | 89 (68.5%) | 2.42 |
| Single Male/Father | 4 (3.1%) | 2.75 |
| Single Female/Mother | 10 (7.7%) | 3.00 |
| Non-family | 27 (20.8%) | 1.11 |
| Total Households | 130 (100.0%) | 2.20 |
Household Size by Marriage Status in Twin Groves
Out of a total of 130 households in Twin Groves, 103 (79.2%) are family households, while 27 (20.8%) are nonfamily households. The most numerous type of family households are 2-person households, comprising 76, and the most common type of nonfamily households are 1-person households, comprising 24.
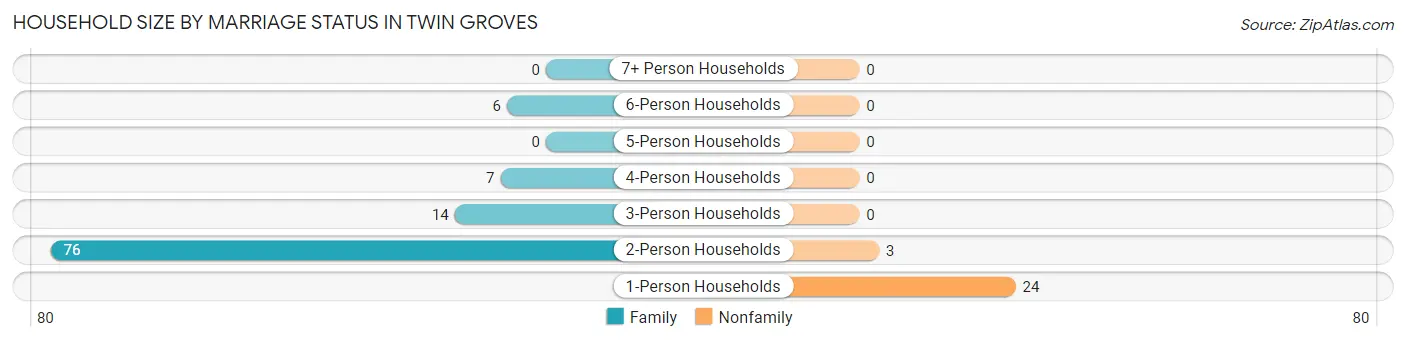
| Household Size | Family Households | Nonfamily Households |
| 1-Person Households | - | 24 (18.5%) |
| 2-Person Households | 76 (58.5%) | 3 (2.3%) |
| 3-Person Households | 14 (10.8%) | 0 (0.0%) |
| 4-Person Households | 7 (5.4%) | 0 (0.0%) |
| 5-Person Households | 0 (0.0%) | 0 (0.0%) |
| 6-Person Households | 6 (4.6%) | 0 (0.0%) |
| 7+ Person Households | 0 (0.0%) | 0 (0.0%) |
| Total | 103 (79.2%) | 27 (20.8%) |
Female Fertility in Twin Groves
Fertility by Age in Twin Groves
Average fertility rate in Twin Groves is 21.0 births per 1,000 women. Women in the age bracket of 35 to 50 years have the highest fertility rate with 43.0 births per 1,000 women. Women in the age bracket of 35 to 50 years acount for 100.0% of all women with births.
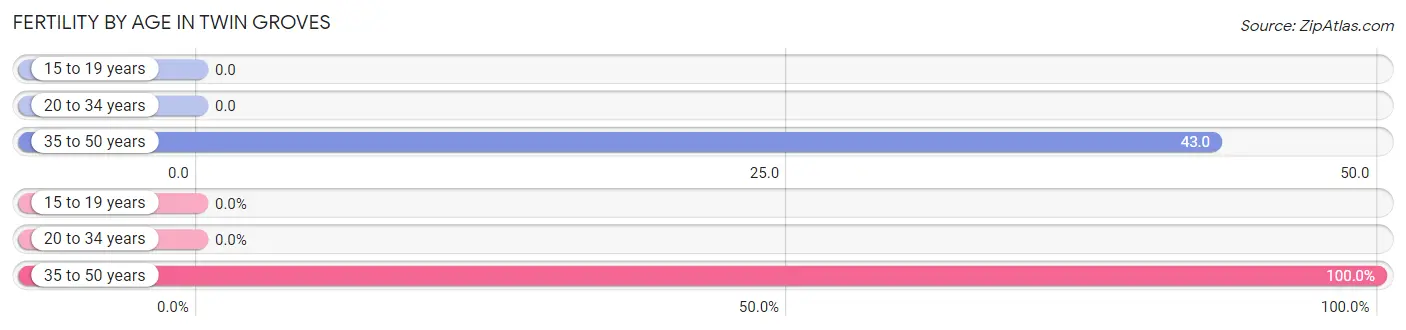
| Age Bracket | Women with Births | Births / 1,000 Women |
| 15 to 19 years | 0 (0.0%) | 0.0 |
| 20 to 34 years | 0 (0.0%) | 0.0 |
| 35 to 50 years | 1 (100.0%) | 43.0 |
| Total | 1 (100.0%) | 21.0 |
Fertility by Age by Marriage Status in Twin Groves
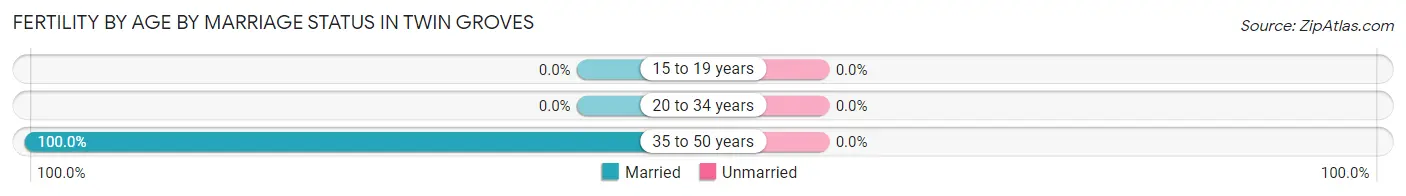
| Age Bracket | Married | Unmarried |
| 15 to 19 years | 0 (0.0%) | 0 (0.0%) |
| 20 to 34 years | 0 (0.0%) | 0 (0.0%) |
| 35 to 50 years | 1 (100.0%) | 0 (0.0%) |
| Total | 1 (100.0%) | 0 (0.0%) |
Fertility by Education in Twin Groves
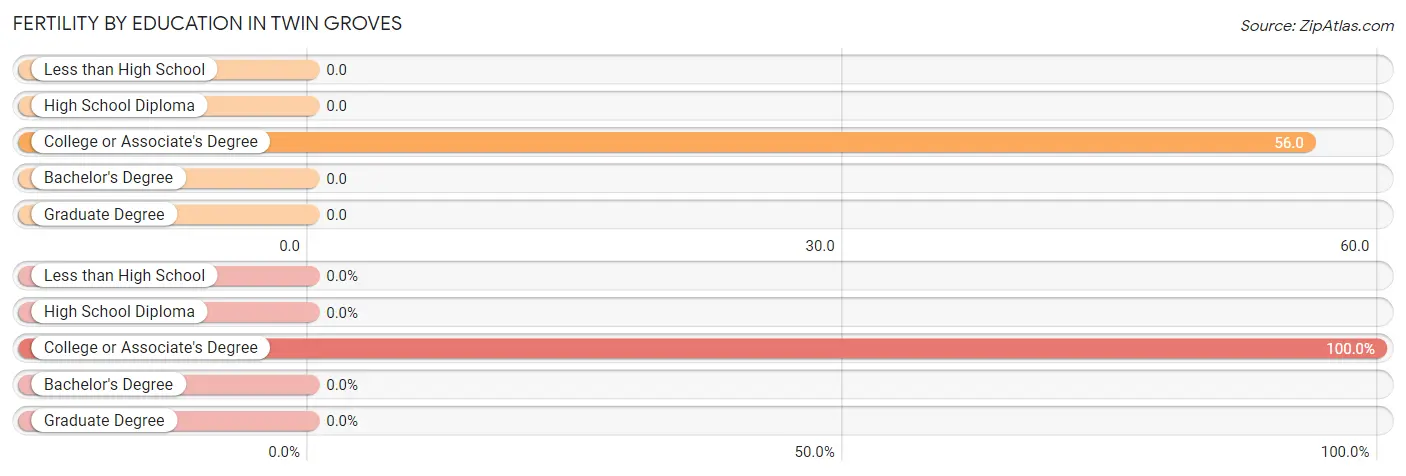
| Educational Attainment | Women with Births | Births / 1,000 Women |
| Less than High School | 0 (0.0%) | 0.0 |
| High School Diploma | 0 (0.0%) | 0.0 |
| College or Associate's Degree | 1 (100.0%) | 56.0 |
| Bachelor's Degree | 0 (0.0%) | 0.0 |
| Graduate Degree | 0 (0.0%) | 0.0 |
| Total | 1 (100.0%) | 21.0 |
Fertility by Education by Marriage Status in Twin Groves
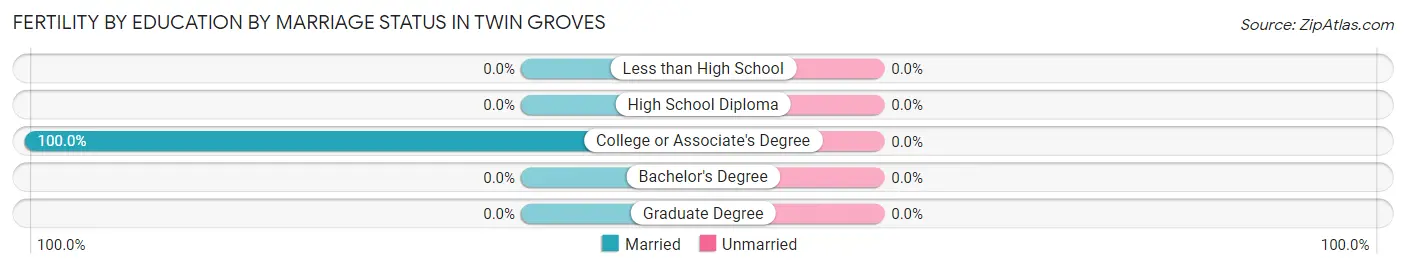
| Educational Attainment | Married | Unmarried |
| Less than High School | 0 (0.0%) | 0 (0.0%) |
| High School Diploma | 0 (0.0%) | 0 (0.0%) |
| College or Associate's Degree | 1 (100.0%) | 0 (0.0%) |
| Bachelor's Degree | 0 (0.0%) | 0 (0.0%) |
| Graduate Degree | 0 (0.0%) | 0 (0.0%) |
| Total | 1 (100.0%) | 0 (0.0%) |
Employment Characteristics in Twin Groves
Employment by Class of Employer in Twin Groves
Among the 89 employed individuals in Twin Groves, private company employees (39 | 43.8%), self-employed (not incorporated) (16 | 18.0%), and state government employees (10 | 11.2%) make up the most common classes of employment.
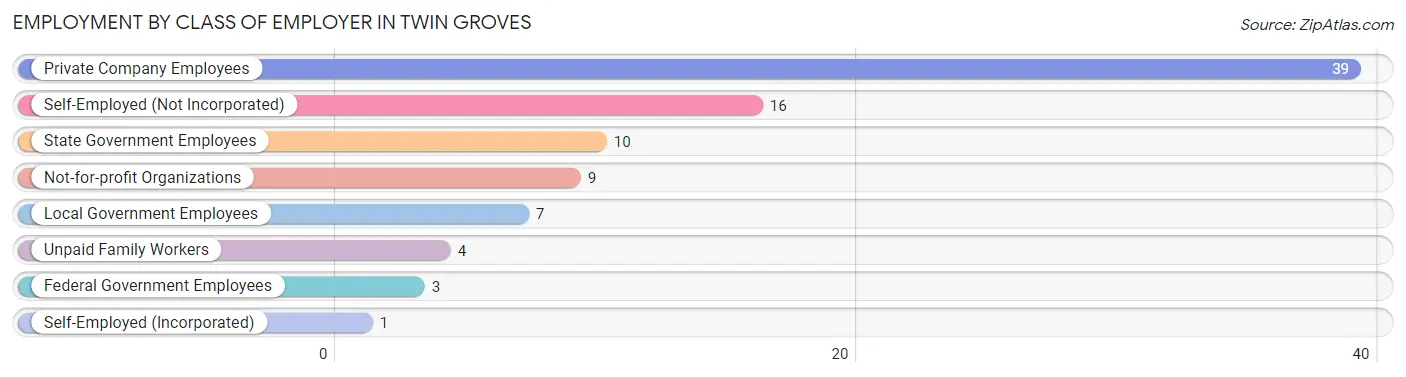
| Employer Class | # Employees | % Employees |
| Private Company Employees | 39 | 43.8% |
| Self-Employed (Incorporated) | 1 | 1.1% |
| Self-Employed (Not Incorporated) | 16 | 18.0% |
| Not-for-profit Organizations | 9 | 10.1% |
| Local Government Employees | 7 | 7.9% |
| State Government Employees | 10 | 11.2% |
| Federal Government Employees | 3 | 3.4% |
| Unpaid Family Workers | 4 | 4.5% |
| Total | 89 | 100.0% |
Employment Status by Age in Twin Groves
According to the labor force statistics for Twin Groves, out of the total population over 16 years of age (243), 39.5% or 96 individuals are in the labor force, with 4.2% or 4 of them unemployed. The age group with the highest labor force participation rate is 20 to 24 years, with 100.0% or 19 individuals in the labor force. Within the labor force, the 16 to 19 years age range has the highest percentage of unemployed individuals, with 25.0% or 1 of them being unemployed.
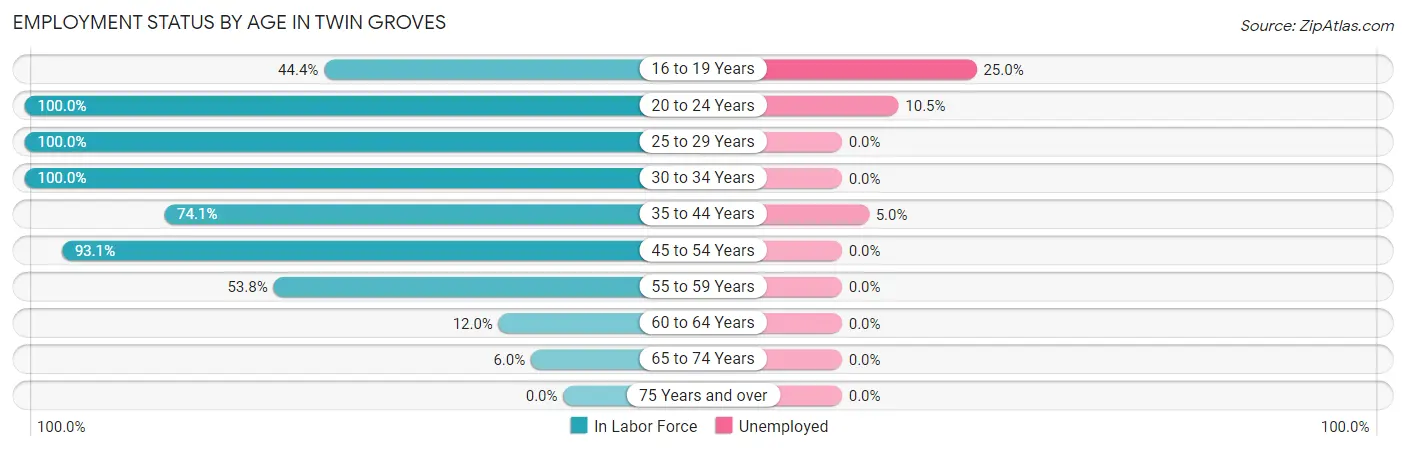
| Age Bracket | In Labor Force | Unemployed |
| 16 to 19 Years | 4 (44.4%) | 1 (25.0%) |
| 20 to 24 Years | 19 (100.0%) | 2 (10.5%) |
| 25 to 29 Years | 1 (100.0%) | 0 (0.0%) |
| 30 to 34 Years | 12 (100.0%) | 0 (0.0%) |
| 35 to 44 Years | 20 (74.1%) | 1 (5.0%) |
| 45 to 54 Years | 27 (93.1%) | 0 (0.0%) |
| 55 to 59 Years | 7 (53.8%) | 0 (0.0%) |
| 60 to 64 Years | 3 (12.0%) | 0 (0.0%) |
| 65 to 74 Years | 3 (6.0%) | 0 (0.0%) |
| 75 Years and over | 0 (0.0%) | 0 (0.0%) |
| Total | 96 (39.5%) | 4 (4.2%) |
Employment Status by Educational Attainment in Twin Groves
According to labor force statistics for Twin Groves, 65.4% of individuals (70) out of the total population between 25 and 64 years of age (107) are in the labor force, with 1.4% or 1 of them being unemployed. The group with the highest labor force participation rate are those with the educational attainment of bachelor's degree or higher, with 100.0% or 8 individuals in the labor force. Within the labor force, individuals with less than high school education have the highest percentage of unemployment, with 25.0% or 1 of them being unemployed.
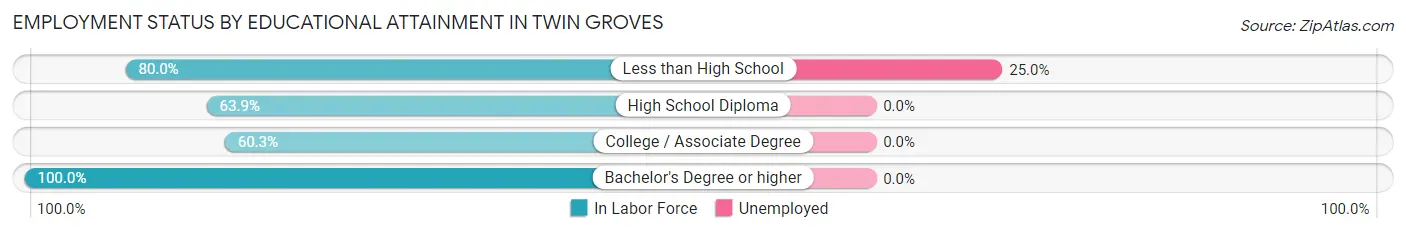
| Educational Attainment | In Labor Force | Unemployed |
| Less than High School | 4 (80.0%) | 1 (25.0%) |
| High School Diploma | 23 (63.9%) | 0 (0.0%) |
| College / Associate Degree | 35 (60.3%) | 0 (0.0%) |
| Bachelor's Degree or higher | 8 (100.0%) | 0 (0.0%) |
| Total | 70 (65.4%) | 1 (1.4%) |
Employment Occupations by Sex in Twin Groves
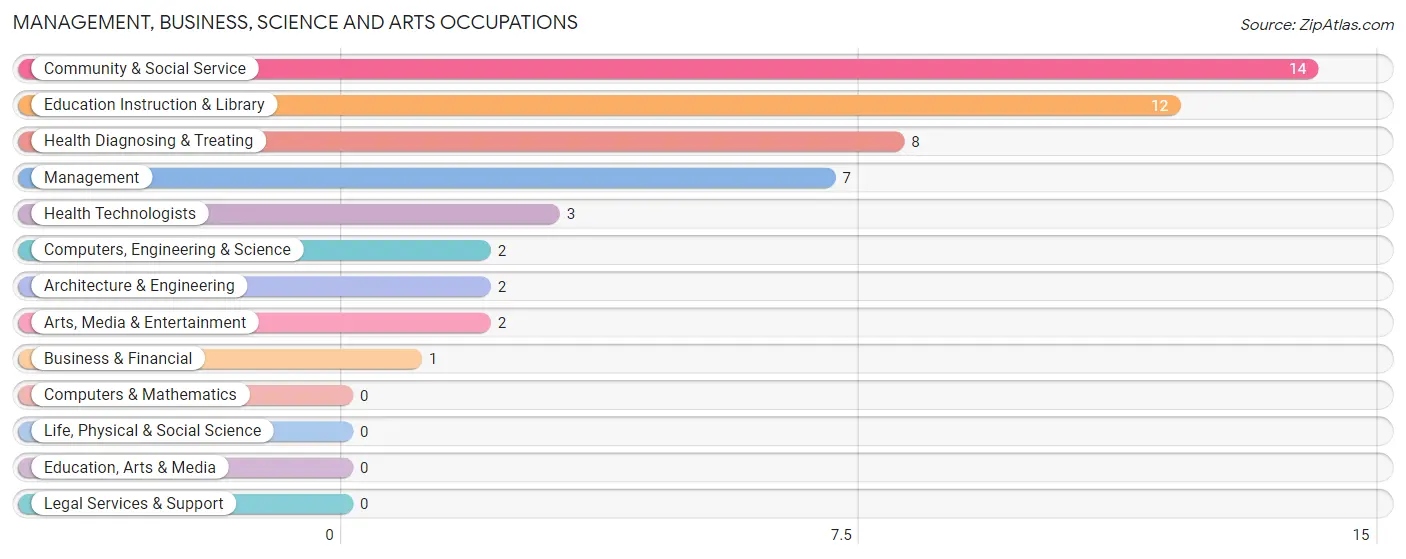
Management, Business, Science and Arts Occupations
The most common Management, Business, Science and Arts occupations in Twin Groves are Community & Social Service (14 | 15.2%), Education Instruction & Library (12 | 13.0%), Health Diagnosing & Treating (8 | 8.7%), Management (7 | 7.6%), and Health Technologists (3 | 3.3%).
Management, Business, Science and Arts Occupations by Sex
Within the Management, Business, Science and Arts occupations in Twin Groves, the most male-oriented occupations are Management (71.4%), Computers, Engineering & Science (50.0%), and Architecture & Engineering (50.0%), while the most female-oriented occupations are Business & Financial (100.0%), Arts, Media & Entertainment (100.0%), and Health Diagnosing & Treating (100.0%).
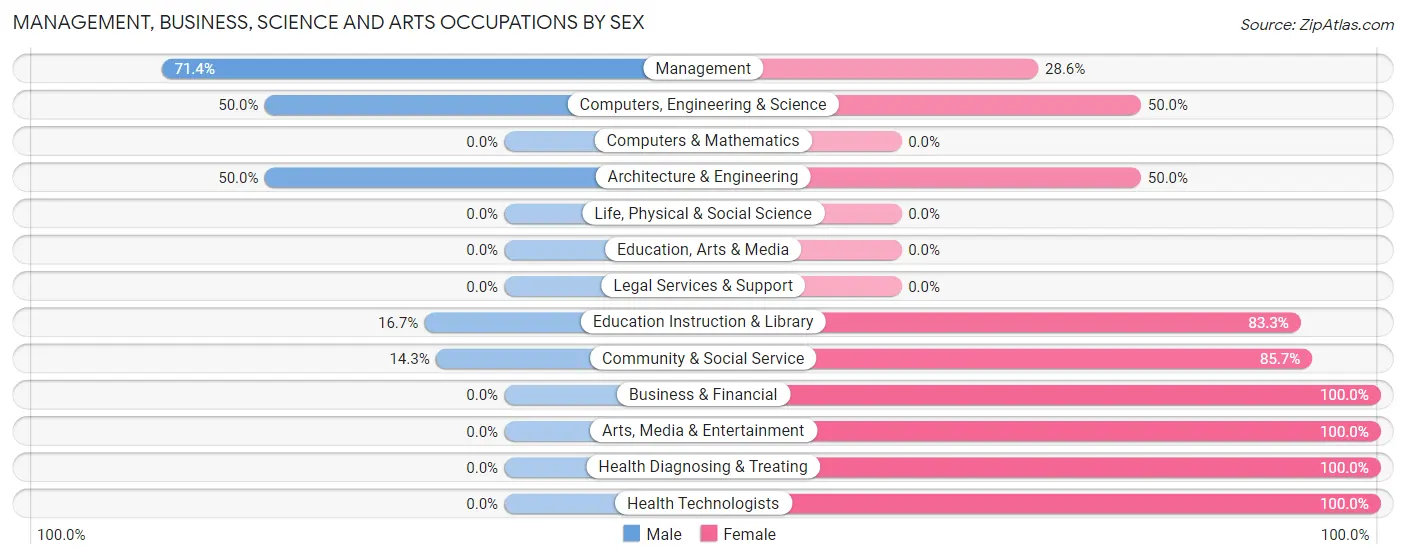
| Occupation | Male | Female |
| Management | 5 (71.4%) | 2 (28.6%) |
| Business & Financial | 0 (0.0%) | 1 (100.0%) |
| Computers, Engineering & Science | 1 (50.0%) | 1 (50.0%) |
| Computers & Mathematics | 0 (0.0%) | 0 (0.0%) |
| Architecture & Engineering | 1 (50.0%) | 1 (50.0%) |
| Life, Physical & Social Science | 0 (0.0%) | 0 (0.0%) |
| Community & Social Service | 2 (14.3%) | 12 (85.7%) |
| Education, Arts & Media | 0 (0.0%) | 0 (0.0%) |
| Legal Services & Support | 0 (0.0%) | 0 (0.0%) |
| Education Instruction & Library | 2 (16.7%) | 10 (83.3%) |
| Arts, Media & Entertainment | 0 (0.0%) | 2 (100.0%) |
| Health Diagnosing & Treating | 0 (0.0%) | 8 (100.0%) |
| Health Technologists | 0 (0.0%) | 3 (100.0%) |
| Total (Category) | 8 (25.0%) | 24 (75.0%) |
| Total (Overall) | 36 (39.1%) | 56 (60.9%) |
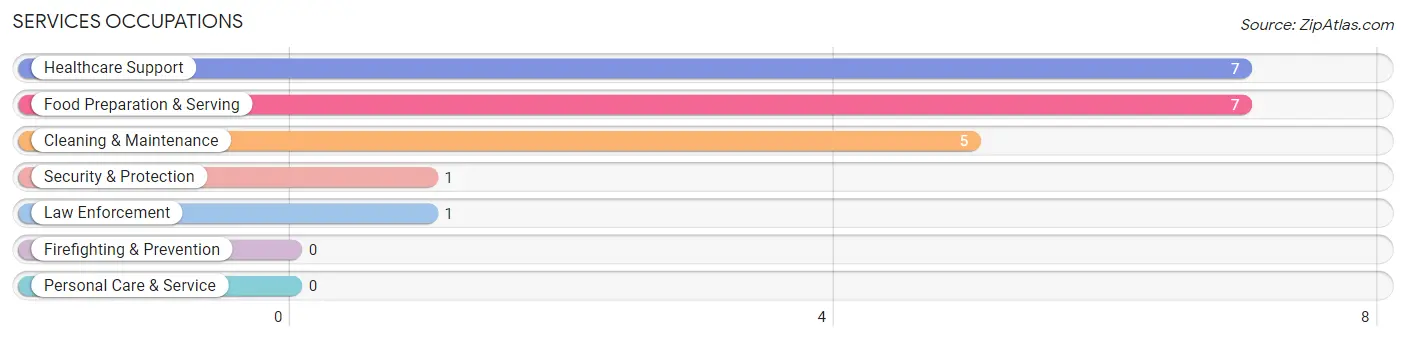
Services Occupations
The most common Services occupations in Twin Groves are Healthcare Support (7 | 7.6%), Food Preparation & Serving (7 | 7.6%), Cleaning & Maintenance (5 | 5.4%), Security & Protection (1 | 1.1%), and Law Enforcement (1 | 1.1%).
Services Occupations by Sex
Within the Services occupations in Twin Groves, the most male-oriented occupations are Security & Protection (100.0%), Law Enforcement (100.0%), and Food Preparation & Serving (28.6%), while the most female-oriented occupations are Healthcare Support (100.0%), Cleaning & Maintenance (100.0%), and Food Preparation & Serving (71.4%).
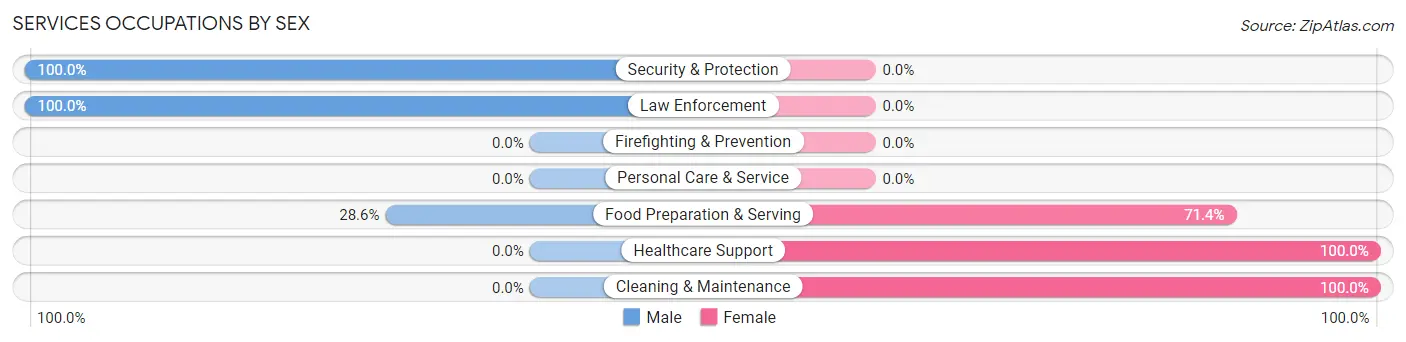
| Occupation | Male | Female |
| Healthcare Support | 0 (0.0%) | 7 (100.0%) |
| Security & Protection | 1 (100.0%) | 0 (0.0%) |
| Firefighting & Prevention | 0 (0.0%) | 0 (0.0%) |
| Law Enforcement | 1 (100.0%) | 0 (0.0%) |
| Food Preparation & Serving | 2 (28.6%) | 5 (71.4%) |
| Cleaning & Maintenance | 0 (0.0%) | 5 (100.0%) |
| Personal Care & Service | 0 (0.0%) | 0 (0.0%) |
| Total (Category) | 3 (15.0%) | 17 (85.0%) |
| Total (Overall) | 36 (39.1%) | 56 (60.9%) |
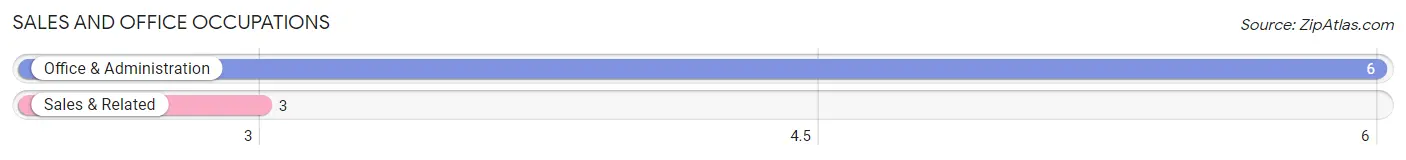
Sales and Office Occupations
The most common Sales and Office occupations in Twin Groves are Office & Administration (6 | 6.5%), and Sales & Related (3 | 3.3%).
Sales and Office Occupations by Sex
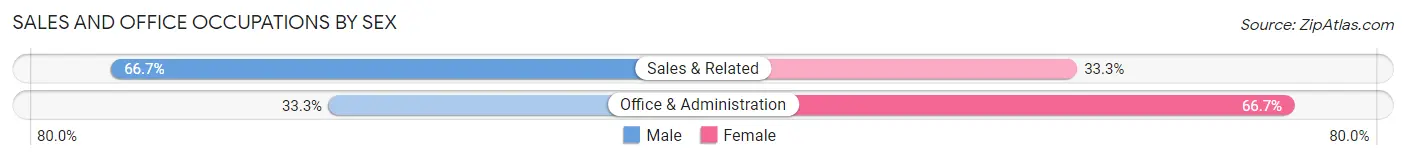
| Occupation | Male | Female |
| Sales & Related | 2 (66.7%) | 1 (33.3%) |
| Office & Administration | 2 (33.3%) | 4 (66.7%) |
| Total (Category) | 4 (44.4%) | 5 (55.6%) |
| Total (Overall) | 36 (39.1%) | 56 (60.9%) |
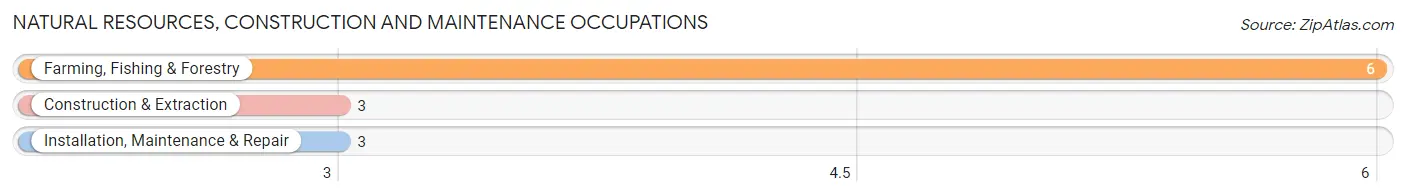
Natural Resources, Construction and Maintenance Occupations
The most common Natural Resources, Construction and Maintenance occupations in Twin Groves are Farming, Fishing & Forestry (6 | 6.5%), Construction & Extraction (3 | 3.3%), and Installation, Maintenance & Repair (3 | 3.3%).
Natural Resources, Construction and Maintenance Occupations by Sex
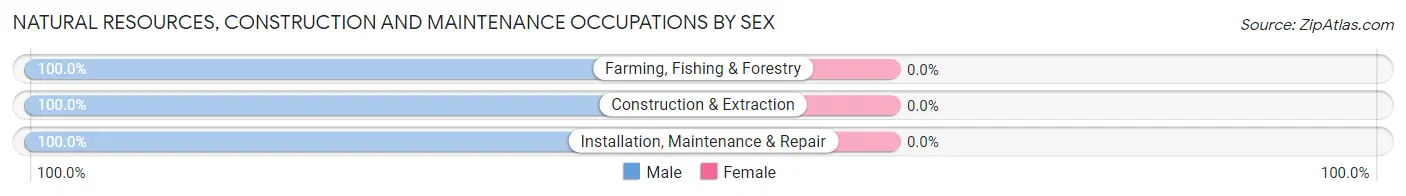
| Occupation | Male | Female |
| Farming, Fishing & Forestry | 6 (100.0%) | 0 (0.0%) |
| Construction & Extraction | 3 (100.0%) | 0 (0.0%) |
| Installation, Maintenance & Repair | 3 (100.0%) | 0 (0.0%) |
| Total (Category) | 12 (100.0%) | 0 (0.0%) |
| Total (Overall) | 36 (39.1%) | 56 (60.9%) |
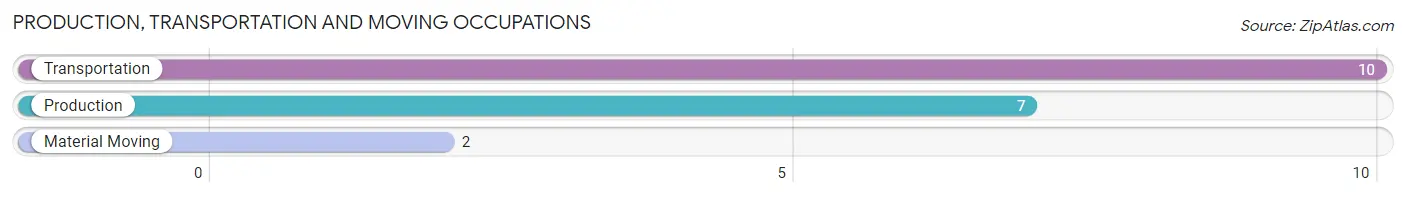
Production, Transportation and Moving Occupations
The most common Production, Transportation and Moving occupations in Twin Groves are Transportation (10 | 10.9%), Production (7 | 7.6%), and Material Moving (2 | 2.2%).
Production, Transportation and Moving Occupations by Sex
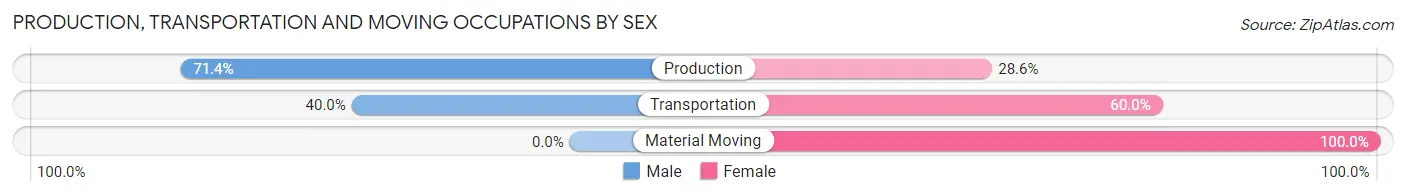
| Occupation | Male | Female |
| Production | 5 (71.4%) | 2 (28.6%) |
| Transportation | 4 (40.0%) | 6 (60.0%) |
| Material Moving | 0 (0.0%) | 2 (100.0%) |
| Total (Category) | 9 (47.4%) | 10 (52.6%) |
| Total (Overall) | 36 (39.1%) | 56 (60.9%) |
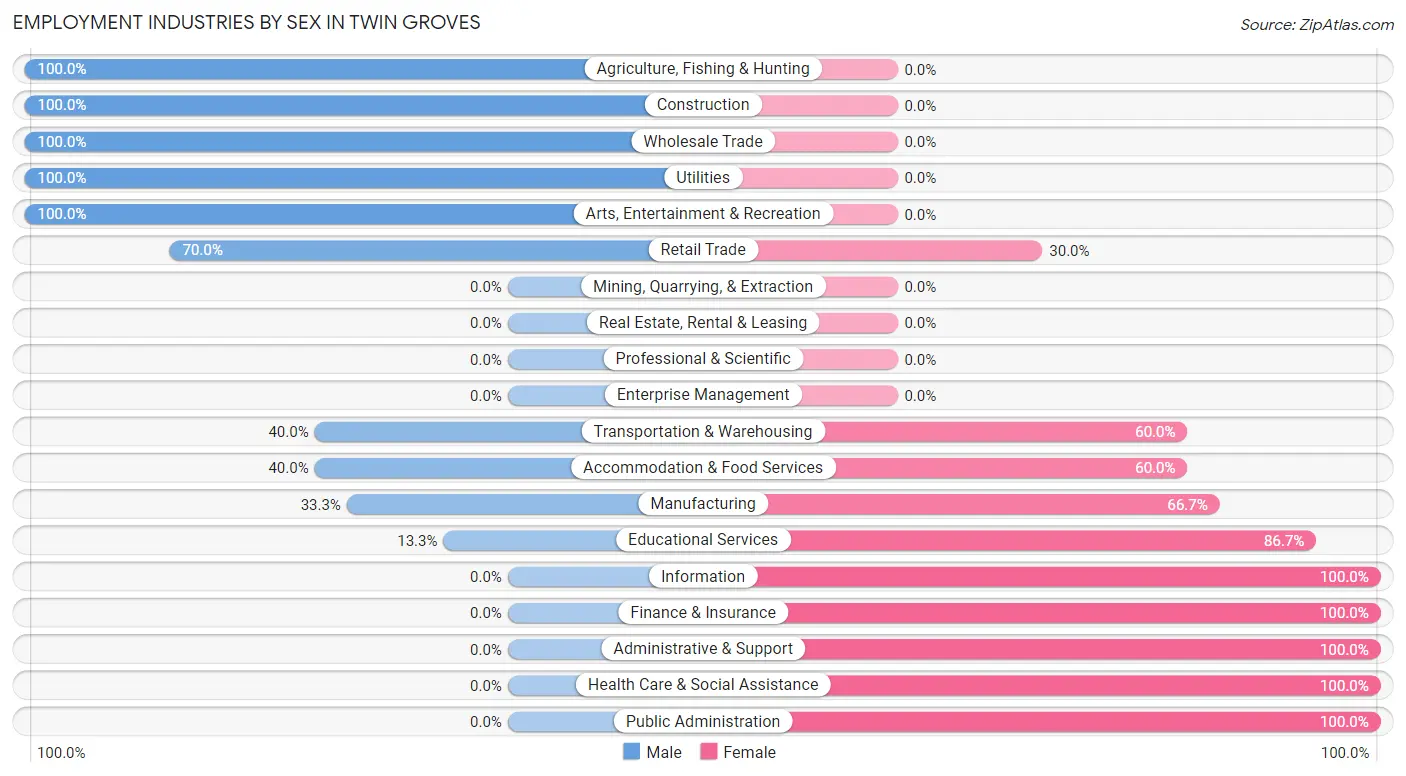
Employment Industries by Sex in Twin Groves
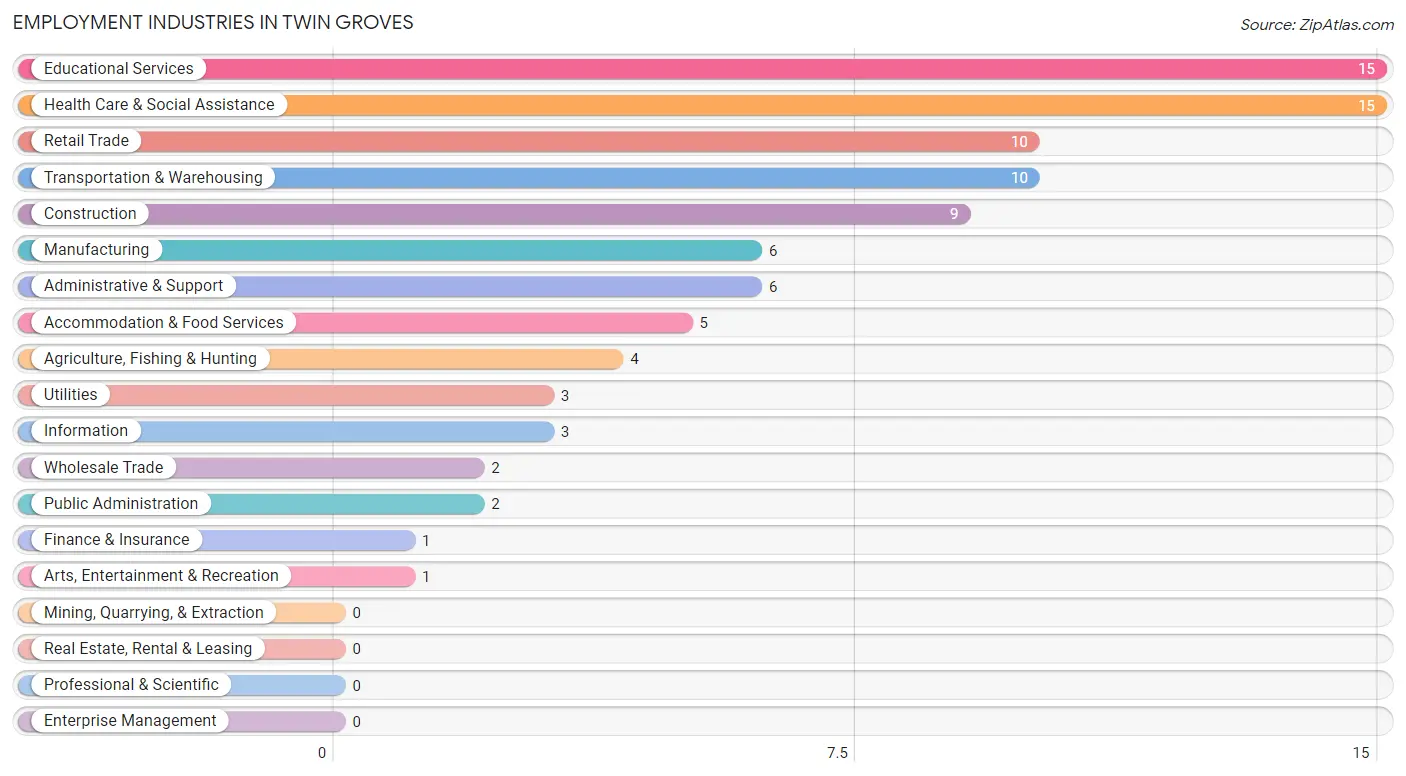
Employment Industries in Twin Groves
The major employment industries in Twin Groves include Educational Services (15 | 16.3%), Health Care & Social Assistance (15 | 16.3%), Retail Trade (10 | 10.9%), Transportation & Warehousing (10 | 10.9%), and Construction (9 | 9.8%).
Employment Industries by Sex in Twin Groves
The Twin Groves industries that see more men than women are Agriculture, Fishing & Hunting (100.0%), Construction (100.0%), and Wholesale Trade (100.0%), whereas the industries that tend to have a higher number of women are Information (100.0%), Finance & Insurance (100.0%), and Administrative & Support (100.0%).
| Industry | Male | Female |
| Agriculture, Fishing & Hunting | 4 (100.0%) | 0 (0.0%) |
| Mining, Quarrying, & Extraction | 0 (0.0%) | 0 (0.0%) |
| Construction | 9 (100.0%) | 0 (0.0%) |
| Manufacturing | 2 (33.3%) | 4 (66.7%) |
| Wholesale Trade | 2 (100.0%) | 0 (0.0%) |
| Retail Trade | 7 (70.0%) | 3 (30.0%) |
| Transportation & Warehousing | 4 (40.0%) | 6 (60.0%) |
| Utilities | 3 (100.0%) | 0 (0.0%) |
| Information | 0 (0.0%) | 3 (100.0%) |
| Finance & Insurance | 0 (0.0%) | 1 (100.0%) |
| Real Estate, Rental & Leasing | 0 (0.0%) | 0 (0.0%) |
| Professional & Scientific | 0 (0.0%) | 0 (0.0%) |
| Enterprise Management | 0 (0.0%) | 0 (0.0%) |
| Administrative & Support | 0 (0.0%) | 6 (100.0%) |
| Educational Services | 2 (13.3%) | 13 (86.7%) |
| Health Care & Social Assistance | 0 (0.0%) | 15 (100.0%) |
| Arts, Entertainment & Recreation | 1 (100.0%) | 0 (0.0%) |
| Accommodation & Food Services | 2 (40.0%) | 3 (60.0%) |
| Public Administration | 0 (0.0%) | 2 (100.0%) |
| Total | 36 (39.1%) | 56 (60.9%) |
Education in Twin Groves
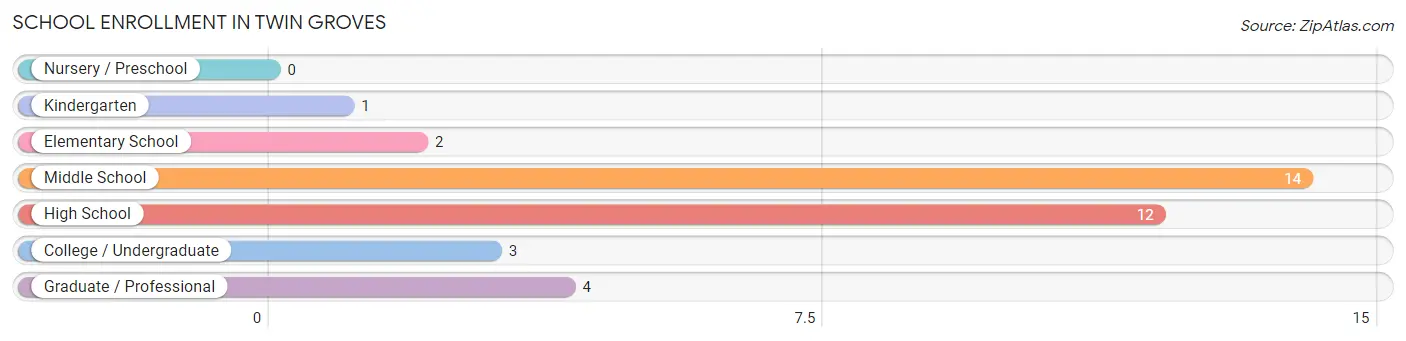
School Enrollment in Twin Groves
The most common levels of schooling among the 36 students in Twin Groves are middle school (14 | 38.9%), high school (12 | 33.3%), and graduate / professional (4 | 11.1%).
| School Level | # Students | % Students |
| Nursery / Preschool | 0 | 0.0% |
| Kindergarten | 1 | 2.8% |
| Elementary School | 2 | 5.6% |
| Middle School | 14 | 38.9% |
| High School | 12 | 33.3% |
| College / Undergraduate | 3 | 8.3% |
| Graduate / Professional | 4 | 11.1% |
| Total | 36 | 100.0% |
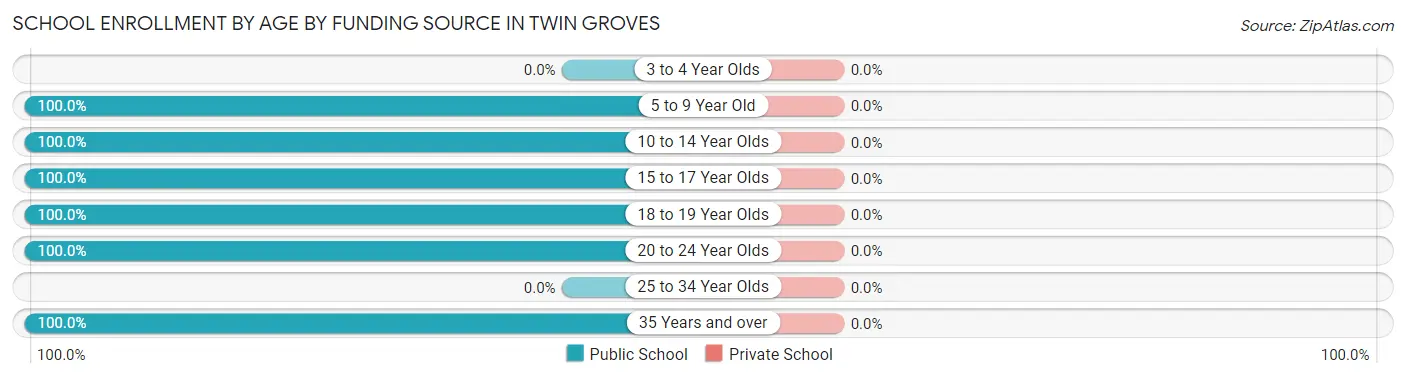
School Enrollment by Age by Funding Source in Twin Groves
| Age Bracket | Public School | Private School |
| 3 to 4 Year Olds | 0 (0.0%) | 0 (0.0%) |
| 5 to 9 Year Old | 2 (100.0%) | 0 (0.0%) |
| 10 to 14 Year Olds | 18 (100.0%) | 0 (0.0%) |
| 15 to 17 Year Olds | 6 (100.0%) | 0 (0.0%) |
| 18 to 19 Year Olds | 3 (100.0%) | 0 (0.0%) |
| 20 to 24 Year Olds | 3 (100.0%) | 0 (0.0%) |
| 25 to 34 Year Olds | 0 (0.0%) | 0 (0.0%) |
| 35 Years and over | 4 (100.0%) | 0 (0.0%) |
| Total | 36 (100.0%) | 0 (0.0%) |
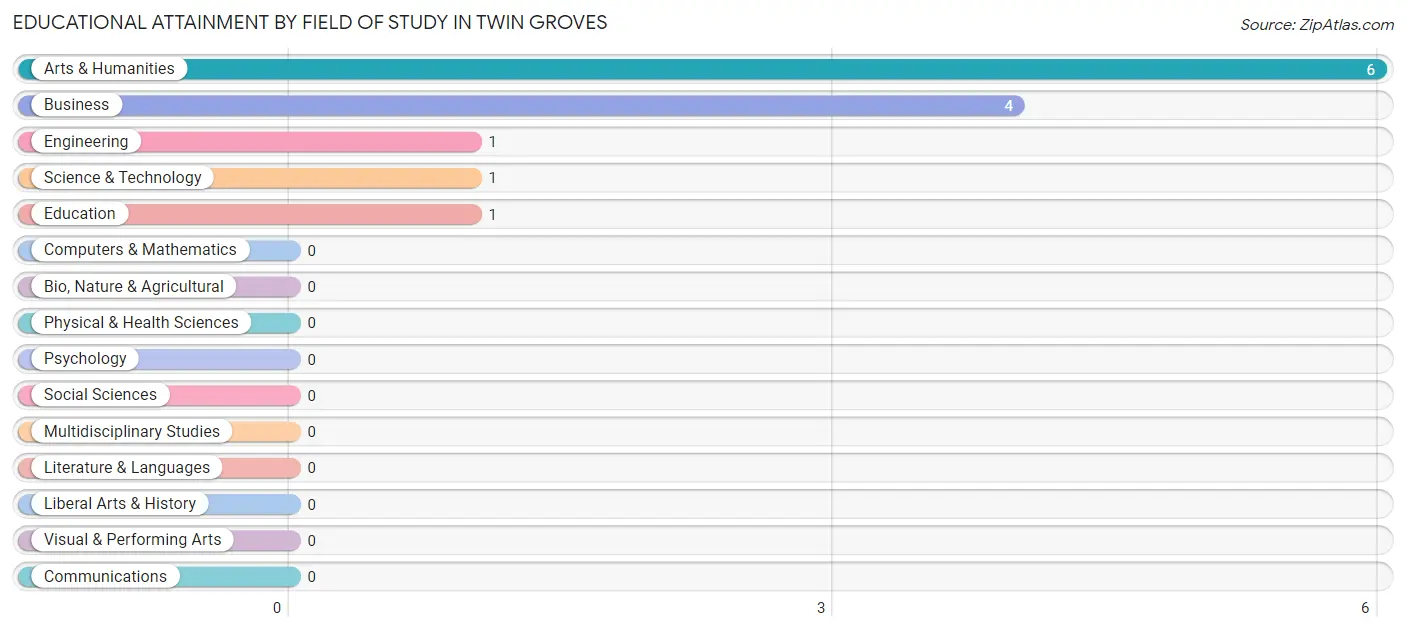
Educational Attainment by Field of Study in Twin Groves
Arts & humanities (6 | 46.2%), business (4 | 30.8%), engineering (1 | 7.7%), science & technology (1 | 7.7%), and education (1 | 7.7%) are the most common fields of study among 13 individuals in Twin Groves who have obtained a bachelor's degree or higher.
| Field of Study | # Graduates | % Graduates |
| Computers & Mathematics | 0 | 0.0% |
| Bio, Nature & Agricultural | 0 | 0.0% |
| Physical & Health Sciences | 0 | 0.0% |
| Psychology | 0 | 0.0% |
| Social Sciences | 0 | 0.0% |
| Engineering | 1 | 7.7% |
| Multidisciplinary Studies | 0 | 0.0% |
| Science & Technology | 1 | 7.7% |
| Business | 4 | 30.8% |
| Education | 1 | 7.7% |
| Literature & Languages | 0 | 0.0% |
| Liberal Arts & History | 0 | 0.0% |
| Visual & Performing Arts | 0 | 0.0% |
| Communications | 0 | 0.0% |
| Arts & Humanities | 6 | 46.2% |
| Total | 13 | 100.0% |
Transportation & Commute in Twin Groves
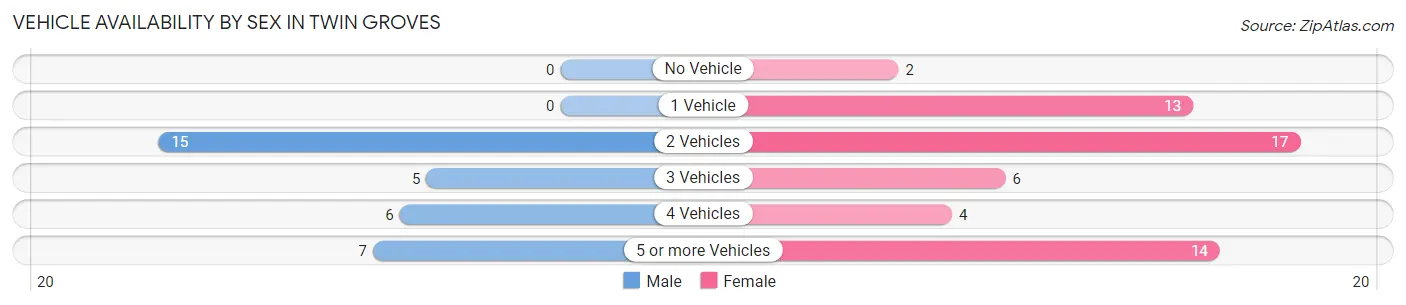
Vehicle Availability by Sex in Twin Groves
The most prevalent vehicle ownership categories in Twin Groves are males with 2 vehicles (15, accounting for 45.5%) and females with 2 vehicles (17, making up 26.8%).
| Vehicles Available | Male | Female |
| No Vehicle | 0 (0.0%) | 2 (3.6%) |
| 1 Vehicle | 0 (0.0%) | 13 (23.2%) |
| 2 Vehicles | 15 (45.5%) | 17 (30.4%) |
| 3 Vehicles | 5 (15.1%) | 6 (10.7%) |
| 4 Vehicles | 6 (18.2%) | 4 (7.1%) |
| 5 or more Vehicles | 7 (21.2%) | 14 (25.0%) |
| Total | 33 (100.0%) | 56 (100.0%) |
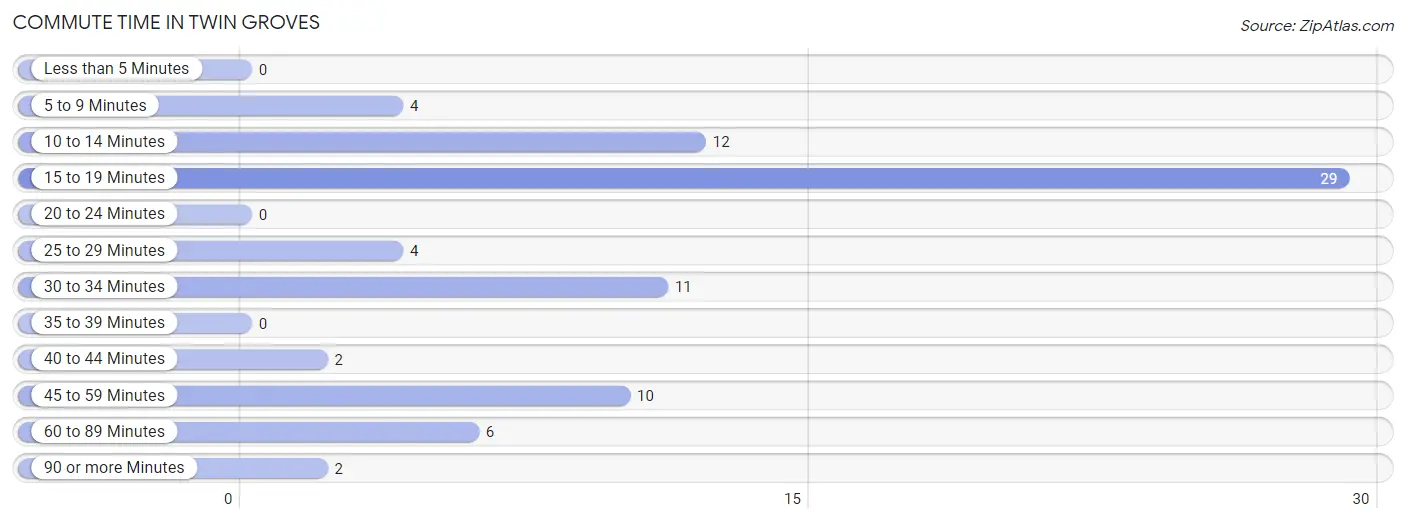
Commute Time in Twin Groves
The most frequently occuring commute durations in Twin Groves are 15 to 19 minutes (29 commuters, 36.2%), 10 to 14 minutes (12 commuters, 15.0%), and 30 to 34 minutes (11 commuters, 13.8%).
| Commute Time | # Commuters | % Commuters |
| Less than 5 Minutes | 0 | 0.0% |
| 5 to 9 Minutes | 4 | 5.0% |
| 10 to 14 Minutes | 12 | 15.0% |
| 15 to 19 Minutes | 29 | 36.2% |
| 20 to 24 Minutes | 0 | 0.0% |
| 25 to 29 Minutes | 4 | 5.0% |
| 30 to 34 Minutes | 11 | 13.8% |
| 35 to 39 Minutes | 0 | 0.0% |
| 40 to 44 Minutes | 2 | 2.5% |
| 45 to 59 Minutes | 10 | 12.5% |
| 60 to 89 Minutes | 6 | 7.5% |
| 90 or more Minutes | 2 | 2.5% |
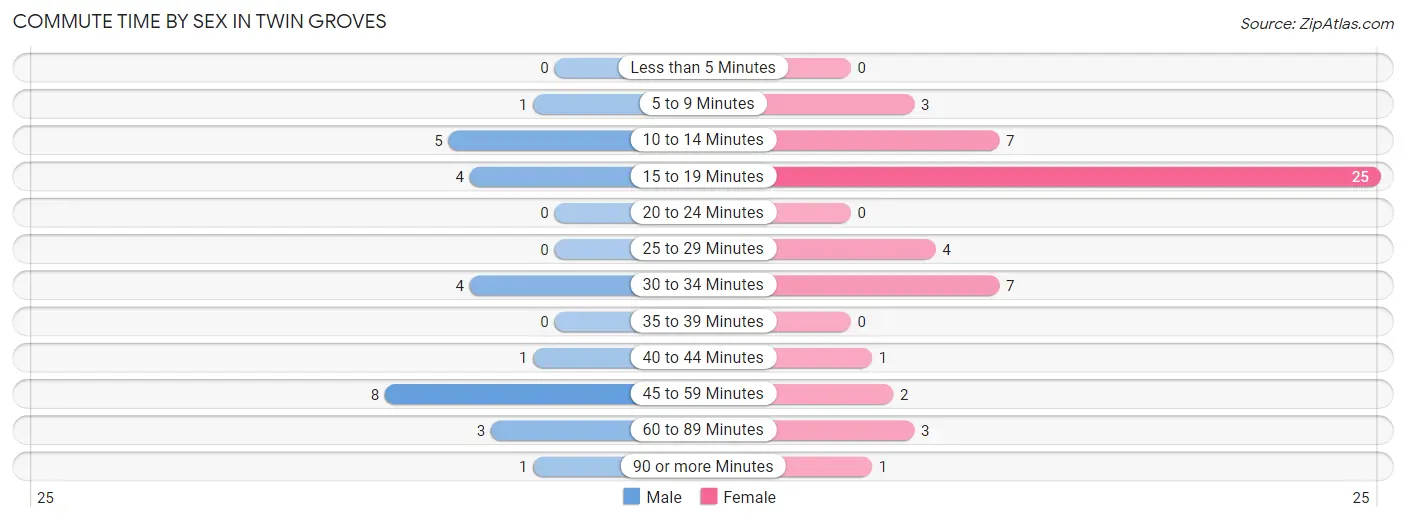
Commute Time by Sex in Twin Groves
The most common commute times in Twin Groves are 45 to 59 minutes (8 commuters, 29.6%) for males and 15 to 19 minutes (25 commuters, 47.2%) for females.
| Commute Time | Male | Female |
| Less than 5 Minutes | 0 (0.0%) | 0 (0.0%) |
| 5 to 9 Minutes | 1 (3.7%) | 3 (5.7%) |
| 10 to 14 Minutes | 5 (18.5%) | 7 (13.2%) |
| 15 to 19 Minutes | 4 (14.8%) | 25 (47.2%) |
| 20 to 24 Minutes | 0 (0.0%) | 0 (0.0%) |
| 25 to 29 Minutes | 0 (0.0%) | 4 (7.5%) |
| 30 to 34 Minutes | 4 (14.8%) | 7 (13.2%) |
| 35 to 39 Minutes | 0 (0.0%) | 0 (0.0%) |
| 40 to 44 Minutes | 1 (3.7%) | 1 (1.9%) |
| 45 to 59 Minutes | 8 (29.6%) | 2 (3.8%) |
| 60 to 89 Minutes | 3 (11.1%) | 3 (5.7%) |
| 90 or more Minutes | 1 (3.7%) | 1 (1.9%) |
Time of Departure to Work by Sex in Twin Groves
The most frequent times of departure to work in Twin Groves are 6:00 AM to 6:29 AM (6, 22.2%) for males and 7:00 AM to 7:29 AM (23, 43.4%) for females.
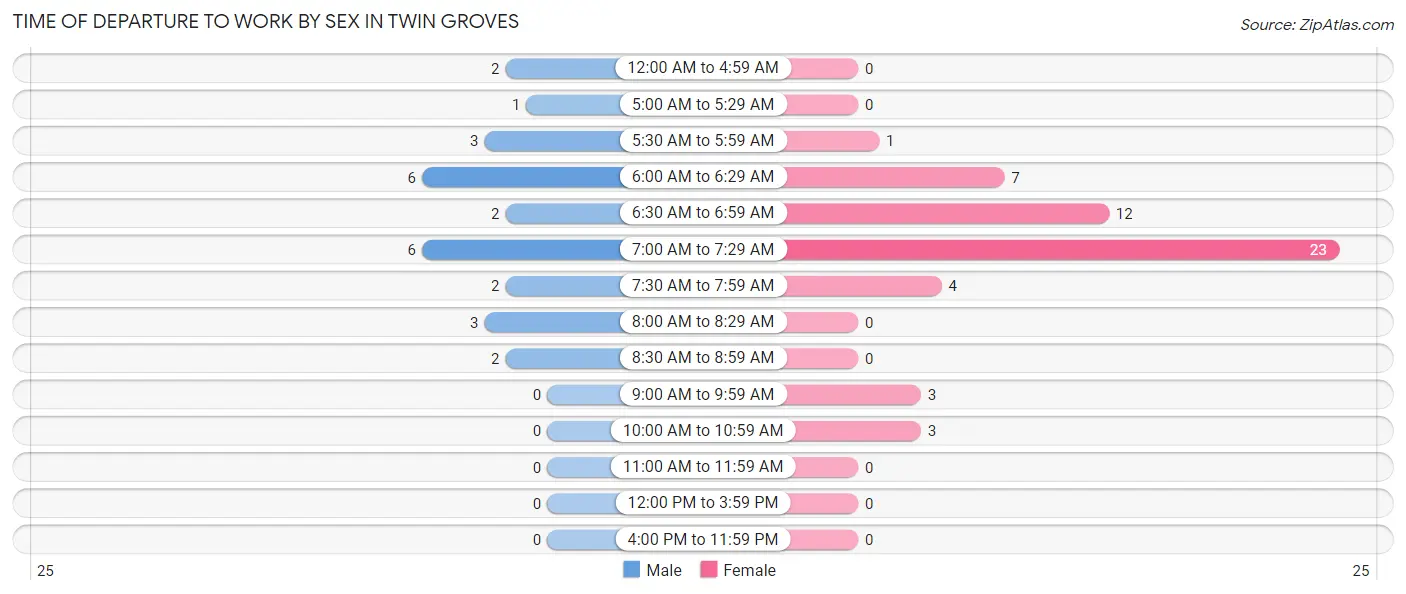
| Time of Departure | Male | Female |
| 12:00 AM to 4:59 AM | 2 (7.4%) | 0 (0.0%) |
| 5:00 AM to 5:29 AM | 1 (3.7%) | 0 (0.0%) |
| 5:30 AM to 5:59 AM | 3 (11.1%) | 1 (1.9%) |
| 6:00 AM to 6:29 AM | 6 (22.2%) | 7 (13.2%) |
| 6:30 AM to 6:59 AM | 2 (7.4%) | 12 (22.6%) |
| 7:00 AM to 7:29 AM | 6 (22.2%) | 23 (43.4%) |
| 7:30 AM to 7:59 AM | 2 (7.4%) | 4 (7.5%) |
| 8:00 AM to 8:29 AM | 3 (11.1%) | 0 (0.0%) |
| 8:30 AM to 8:59 AM | 2 (7.4%) | 0 (0.0%) |
| 9:00 AM to 9:59 AM | 0 (0.0%) | 3 (5.7%) |
| 10:00 AM to 10:59 AM | 0 (0.0%) | 3 (5.7%) |
| 11:00 AM to 11:59 AM | 0 (0.0%) | 0 (0.0%) |
| 12:00 PM to 3:59 PM | 0 (0.0%) | 0 (0.0%) |
| 4:00 PM to 11:59 PM | 0 (0.0%) | 0 (0.0%) |
| Total | 27 (100.0%) | 53 (100.0%) |
Housing Occupancy in Twin Groves
Occupancy by Ownership in Twin Groves
Of the total 130 dwellings in Twin Groves, owner-occupied units account for 106 (81.5%), while renter-occupied units make up 24 (18.5%).
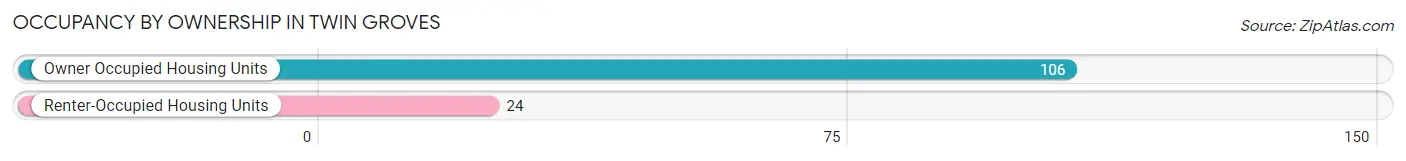
| Occupancy | # Housing Units | % Housing Units |
| Owner Occupied Housing Units | 106 | 81.5% |
| Renter-Occupied Housing Units | 24 | 18.5% |
| Total Occupied Housing Units | 130 | 100.0% |
Occupancy by Household Size in Twin Groves
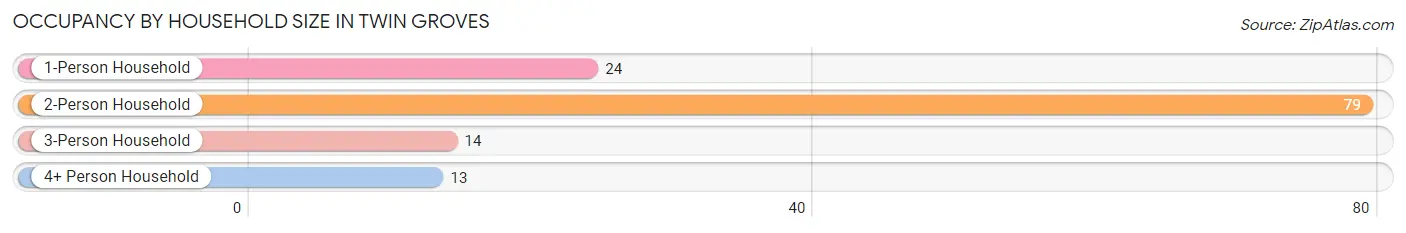
| Household Size | # Housing Units | % Housing Units |
| 1-Person Household | 24 | 18.5% |
| 2-Person Household | 79 | 60.8% |
| 3-Person Household | 14 | 10.8% |
| 4+ Person Household | 13 | 10.0% |
| Total Housing Units | 130 | 100.0% |
Occupancy by Ownership by Household Size in Twin Groves
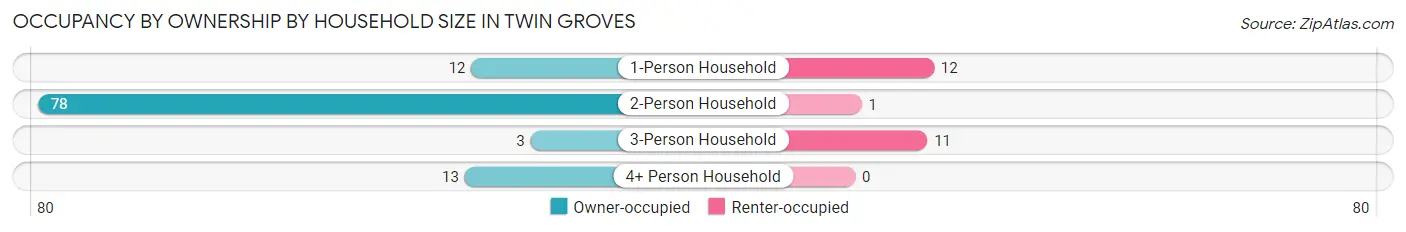
| Household Size | Owner-occupied | Renter-occupied |
| 1-Person Household | 12 (50.0%) | 12 (50.0%) |
| 2-Person Household | 78 (98.7%) | 1 (1.3%) |
| 3-Person Household | 3 (21.4%) | 11 (78.6%) |
| 4+ Person Household | 13 (100.0%) | 0 (0.0%) |
| Total Housing Units | 106 (81.5%) | 24 (18.5%) |
Occupancy by Educational Attainment in Twin Groves
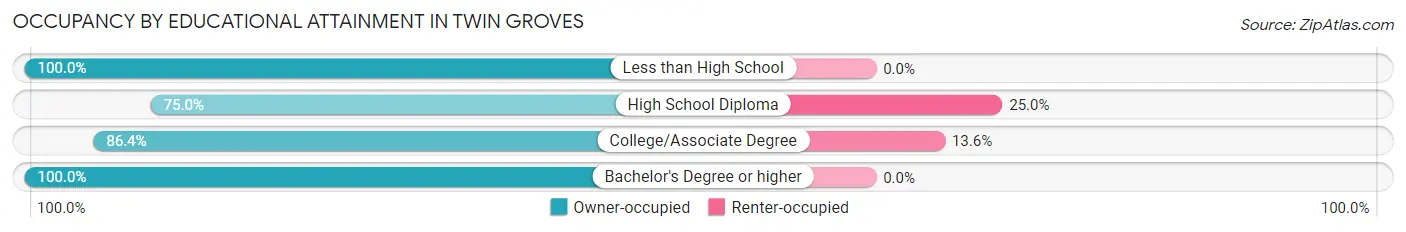
| Household Size | Owner-occupied | Renter-occupied |
| Less than High School | 12 (100.0%) | 0 (0.0%) |
| High School Diploma | 54 (75.0%) | 18 (25.0%) |
| College/Associate Degree | 38 (86.4%) | 6 (13.6%) |
| Bachelor's Degree or higher | 2 (100.0%) | 0 (0.0%) |
Occupancy by Age of Householder in Twin Groves
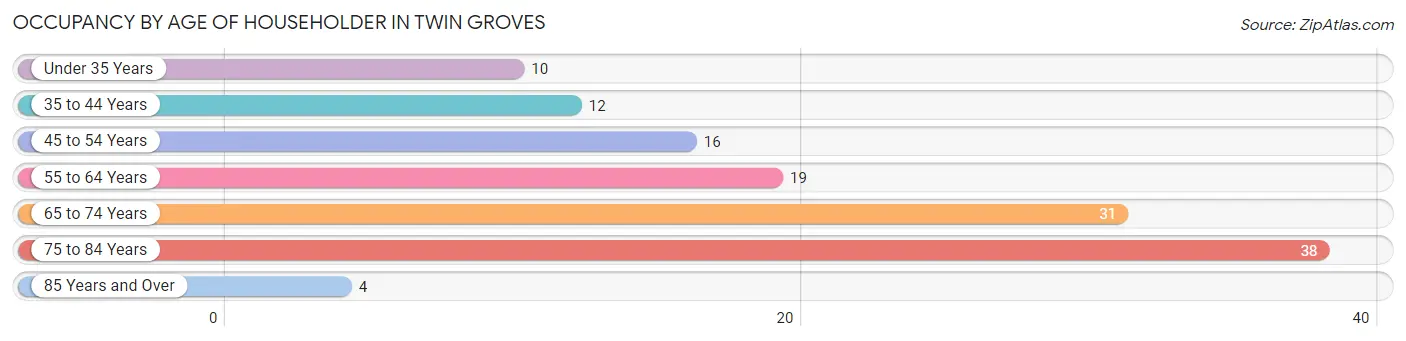
| Age Bracket | # Households | % Households |
| Under 35 Years | 10 | 7.7% |
| 35 to 44 Years | 12 | 9.2% |
| 45 to 54 Years | 16 | 12.3% |
| 55 to 64 Years | 19 | 14.6% |
| 65 to 74 Years | 31 | 23.8% |
| 75 to 84 Years | 38 | 29.2% |
| 85 Years and Over | 4 | 3.1% |
| Total | 130 | 100.0% |
Housing Finances in Twin Groves
Median Income by Occupancy in Twin Groves
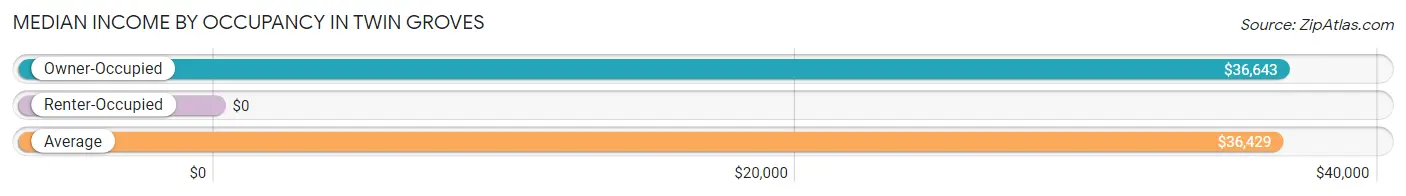
| Occupancy Type | # Households | Median Income |
| Owner-Occupied | 106 (81.5%) | $36,643 |
| Renter-Occupied | 24 (18.5%) | $0 |
| Average | 130 (100.0%) | $36,429 |
Occupancy by Householder Income Bracket in Twin Groves
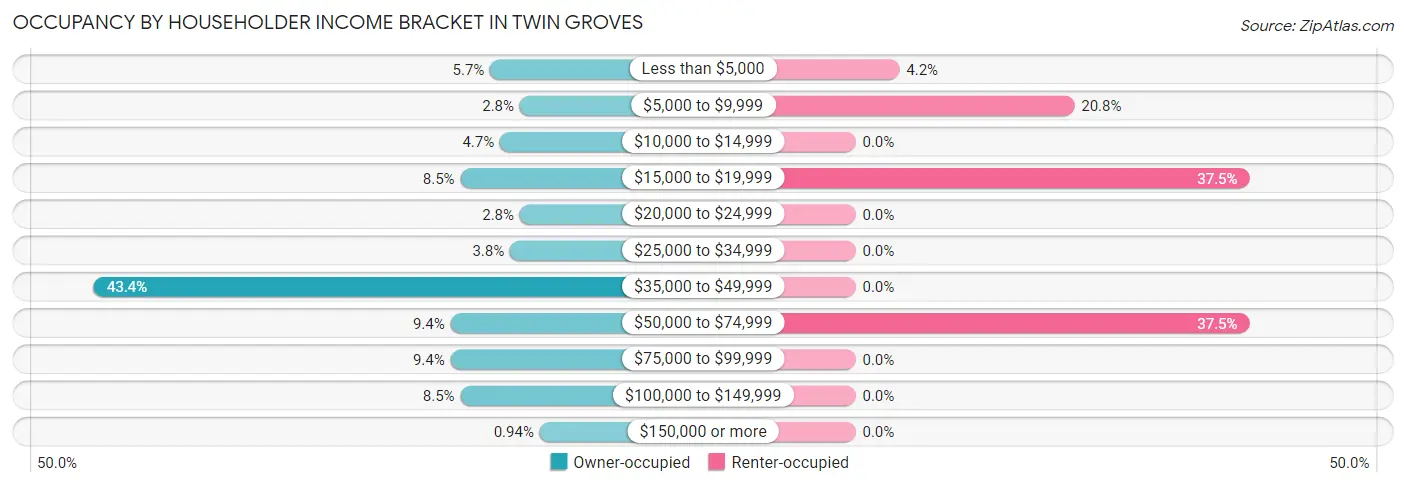
| Income Bracket | Owner-occupied | Renter-occupied |
| Less than $5,000 | 6 (5.7%) | 1 (4.2%) |
| $5,000 to $9,999 | 3 (2.8%) | 5 (20.8%) |
| $10,000 to $14,999 | 5 (4.7%) | 0 (0.0%) |
| $15,000 to $19,999 | 9 (8.5%) | 9 (37.5%) |
| $20,000 to $24,999 | 3 (2.8%) | 0 (0.0%) |
| $25,000 to $34,999 | 4 (3.8%) | 0 (0.0%) |
| $35,000 to $49,999 | 46 (43.4%) | 0 (0.0%) |
| $50,000 to $74,999 | 10 (9.4%) | 9 (37.5%) |
| $75,000 to $99,999 | 10 (9.4%) | 0 (0.0%) |
| $100,000 to $149,999 | 9 (8.5%) | 0 (0.0%) |
| $150,000 or more | 1 (0.9%) | 0 (0.0%) |
| Total | 106 (100.0%) | 24 (100.0%) |
Monthly Housing Cost Tiers in Twin Groves
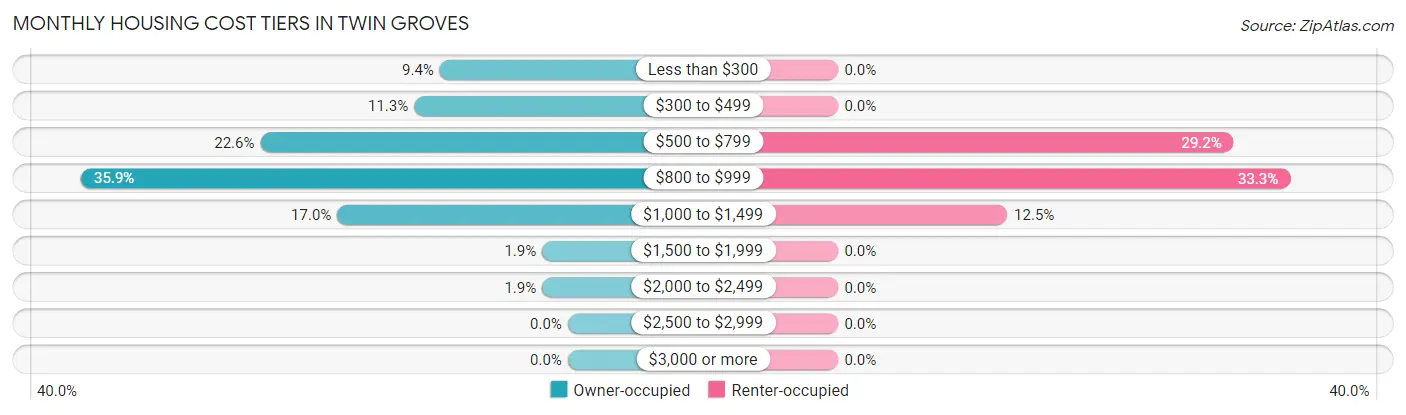
| Monthly Cost | Owner-occupied | Renter-occupied |
| Less than $300 | 10 (9.4%) | 0 (0.0%) |
| $300 to $499 | 12 (11.3%) | 0 (0.0%) |
| $500 to $799 | 24 (22.6%) | 7 (29.2%) |
| $800 to $999 | 38 (35.8%) | 8 (33.3%) |
| $1,000 to $1,499 | 18 (17.0%) | 3 (12.5%) |
| $1,500 to $1,999 | 2 (1.9%) | 0 (0.0%) |
| $2,000 to $2,499 | 2 (1.9%) | 0 (0.0%) |
| $2,500 to $2,999 | 0 (0.0%) | 0 (0.0%) |
| $3,000 or more | 0 (0.0%) | 0 (0.0%) |
| Total | 106 (100.0%) | 24 (100.0%) |
Physical Housing Characteristics in Twin Groves
Housing Structures in Twin Groves
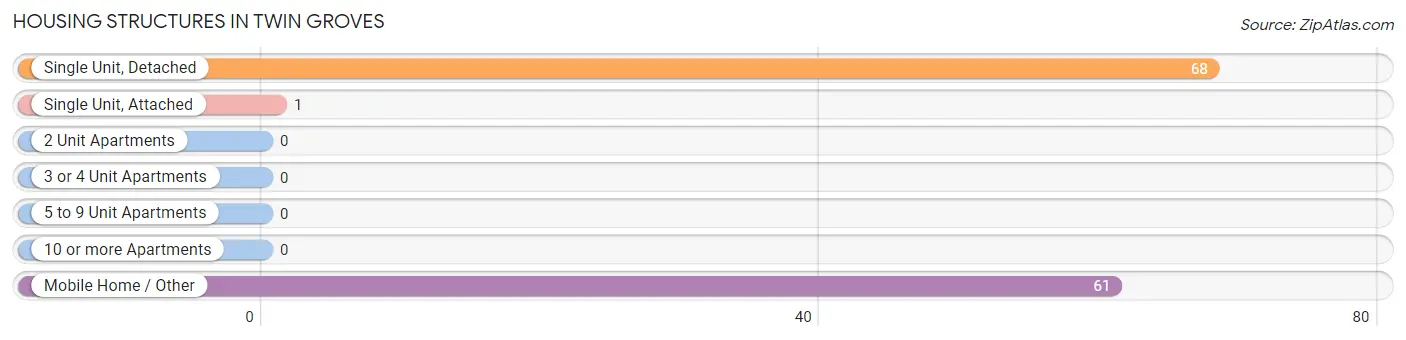
| Structure Type | # Housing Units | % Housing Units |
| Single Unit, Detached | 68 | 52.3% |
| Single Unit, Attached | 1 | 0.8% |
| 2 Unit Apartments | 0 | 0.0% |
| 3 or 4 Unit Apartments | 0 | 0.0% |
| 5 to 9 Unit Apartments | 0 | 0.0% |
| 10 or more Apartments | 0 | 0.0% |
| Mobile Home / Other | 61 | 46.9% |
| Total | 130 | 100.0% |
Housing Structures by Occupancy in Twin Groves
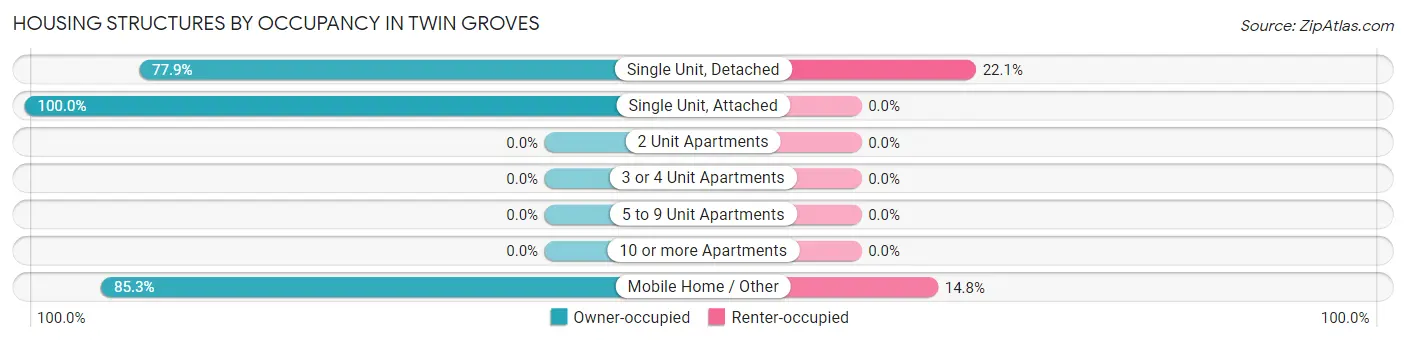
| Structure Type | Owner-occupied | Renter-occupied |
| Single Unit, Detached | 53 (77.9%) | 15 (22.1%) |
| Single Unit, Attached | 1 (100.0%) | 0 (0.0%) |
| 2 Unit Apartments | 0 (0.0%) | 0 (0.0%) |
| 3 or 4 Unit Apartments | 0 (0.0%) | 0 (0.0%) |
| 5 to 9 Unit Apartments | 0 (0.0%) | 0 (0.0%) |
| 10 or more Apartments | 0 (0.0%) | 0 (0.0%) |
| Mobile Home / Other | 52 (85.3%) | 9 (14.7%) |
| Total | 106 (81.5%) | 24 (18.5%) |
Housing Structures by Number of Rooms in Twin Groves
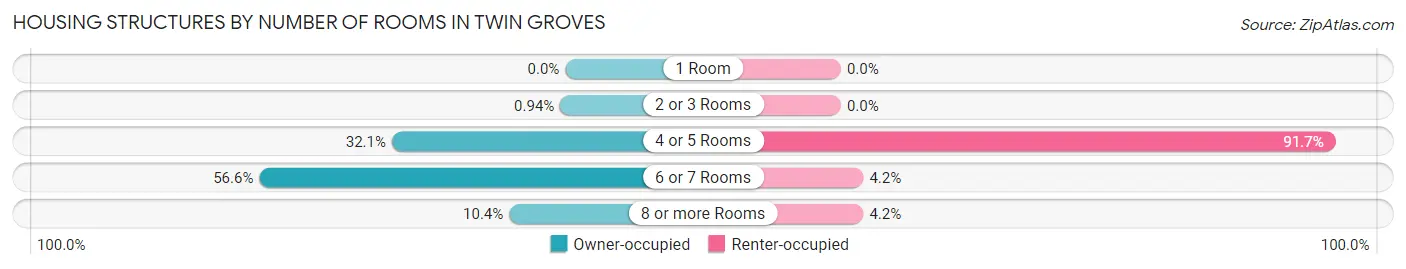
| Number of Rooms | Owner-occupied | Renter-occupied |
| 1 Room | 0 (0.0%) | 0 (0.0%) |
| 2 or 3 Rooms | 1 (0.9%) | 0 (0.0%) |
| 4 or 5 Rooms | 34 (32.1%) | 22 (91.7%) |
| 6 or 7 Rooms | 60 (56.6%) | 1 (4.2%) |
| 8 or more Rooms | 11 (10.4%) | 1 (4.2%) |
| Total | 106 (100.0%) | 24 (100.0%) |
Housing Structure by Heating Type in Twin Groves
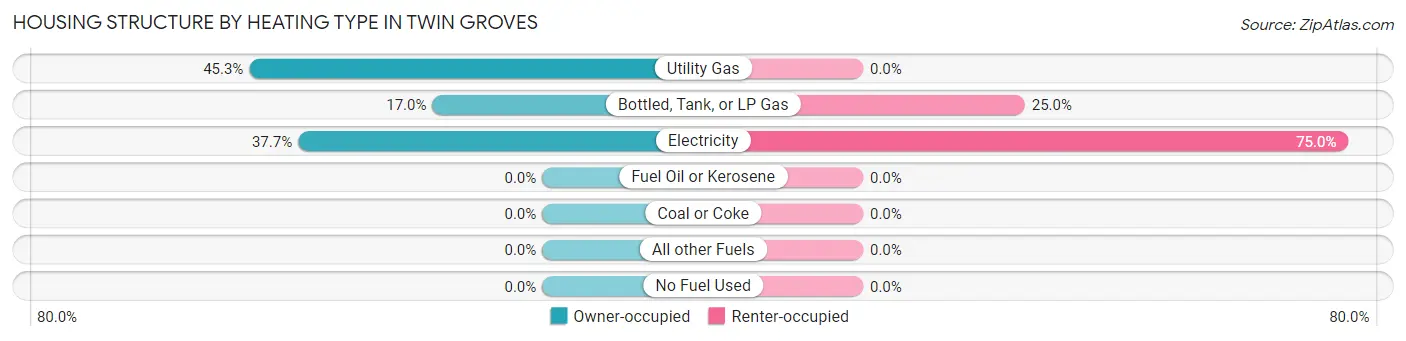
| Heating Type | Owner-occupied | Renter-occupied |
| Utility Gas | 48 (45.3%) | 0 (0.0%) |
| Bottled, Tank, or LP Gas | 18 (17.0%) | 6 (25.0%) |
| Electricity | 40 (37.7%) | 18 (75.0%) |
| Fuel Oil or Kerosene | 0 (0.0%) | 0 (0.0%) |
| Coal or Coke | 0 (0.0%) | 0 (0.0%) |
| All other Fuels | 0 (0.0%) | 0 (0.0%) |
| No Fuel Used | 0 (0.0%) | 0 (0.0%) |
| Total | 106 (100.0%) | 24 (100.0%) |
Household Vehicle Usage in Twin Groves
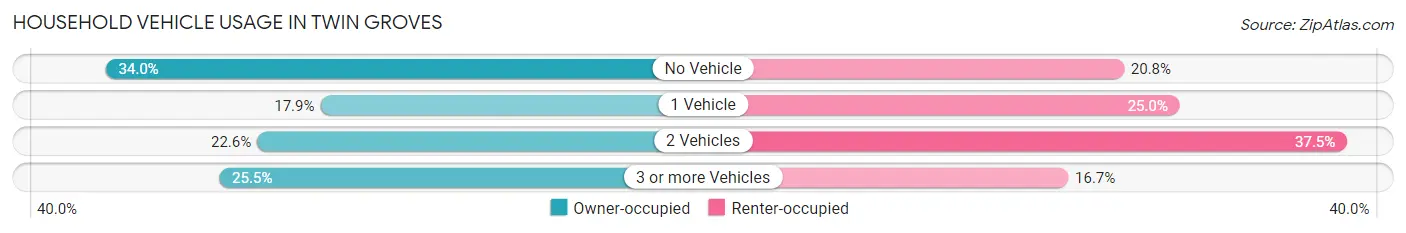
| Vehicles per Household | Owner-occupied | Renter-occupied |
| No Vehicle | 36 (34.0%) | 5 (20.8%) |
| 1 Vehicle | 19 (17.9%) | 6 (25.0%) |
| 2 Vehicles | 24 (22.6%) | 9 (37.5%) |
| 3 or more Vehicles | 27 (25.5%) | 4 (16.7%) |
| Total | 106 (100.0%) | 24 (100.0%) |
Real Estate & Mortgages in Twin Groves
Real Estate and Mortgage Overview in Twin Groves
| Characteristic | Without Mortgage | With Mortgage |
| Housing Units | 44 | 62 |
| Median Property Value | $81,700 | $76,400 |
| Median Household Income | $46,667 | $1 |
| Monthly Housing Costs | $550 | $0 |
| Real Estate Taxes | $500 | $3 |
Property Value by Mortgage Status in Twin Groves
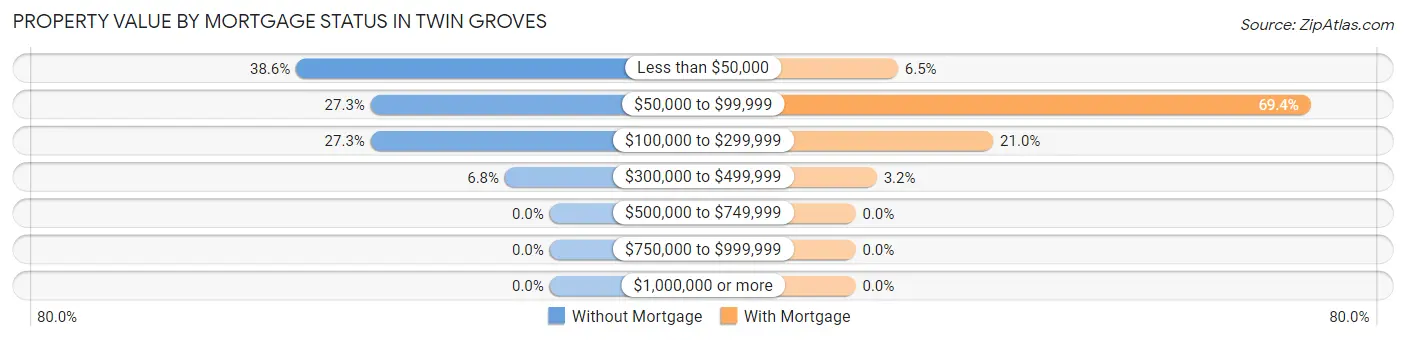
| Property Value | Without Mortgage | With Mortgage |
| Less than $50,000 | 17 (38.6%) | 4 (6.5%) |
| $50,000 to $99,999 | 12 (27.3%) | 43 (69.4%) |
| $100,000 to $299,999 | 12 (27.3%) | 13 (21.0%) |
| $300,000 to $499,999 | 3 (6.8%) | 2 (3.2%) |
| $500,000 to $749,999 | 0 (0.0%) | 0 (0.0%) |
| $750,000 to $999,999 | 0 (0.0%) | 0 (0.0%) |
| $1,000,000 or more | 0 (0.0%) | 0 (0.0%) |
| Total | 44 (100.0%) | 62 (100.0%) |
Household Income by Mortgage Status in Twin Groves
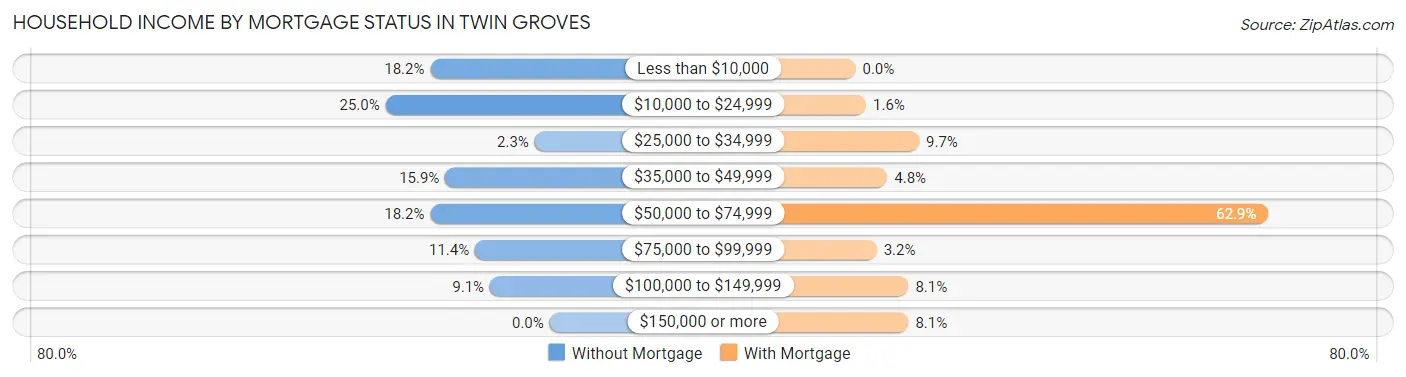
| Household Income | Without Mortgage | With Mortgage |
| Less than $10,000 | 8 (18.2%) | 0 (0.0%) |
| $10,000 to $24,999 | 11 (25.0%) | 1 (1.6%) |
| $25,000 to $34,999 | 1 (2.3%) | 6 (9.7%) |
| $35,000 to $49,999 | 7 (15.9%) | 3 (4.8%) |
| $50,000 to $74,999 | 8 (18.2%) | 39 (62.9%) |
| $75,000 to $99,999 | 5 (11.4%) | 2 (3.2%) |
| $100,000 to $149,999 | 4 (9.1%) | 5 (8.1%) |
| $150,000 or more | 0 (0.0%) | 5 (8.1%) |
| Total | 44 (100.0%) | 62 (100.0%) |
Property Value to Household Income Ratio in Twin Groves
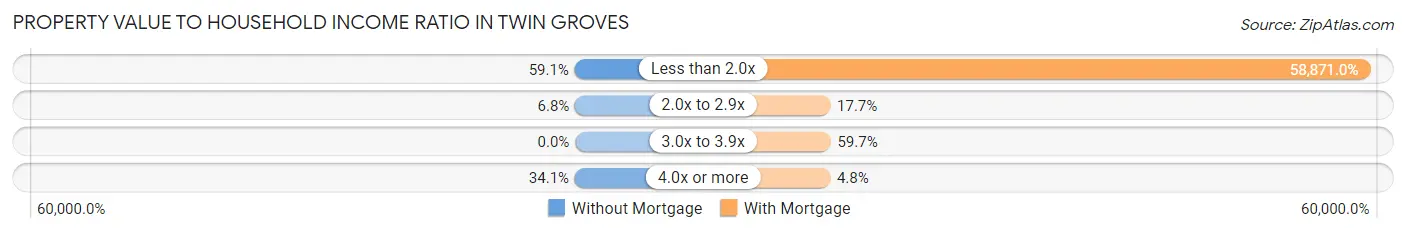
| Value-to-Income Ratio | Without Mortgage | With Mortgage |
| Less than 2.0x | 26 (59.1%) | 36,500 (58,871.0%) |
| 2.0x to 2.9x | 3 (6.8%) | 11 (17.7%) |
| 3.0x to 3.9x | 0 (0.0%) | 37 (59.7%) |
| 4.0x or more | 15 (34.1%) | 3 (4.8%) |
| Total | 44 (100.0%) | 62 (100.0%) |
Real Estate Taxes by Mortgage Status in Twin Groves
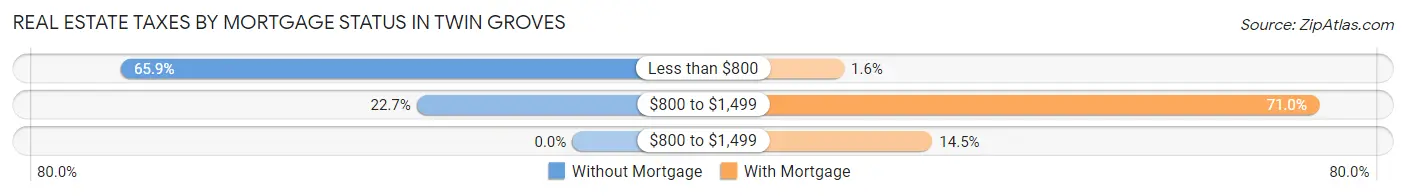
| Property Taxes | Without Mortgage | With Mortgage |
| Less than $800 | 29 (65.9%) | 1 (1.6%) |
| $800 to $1,499 | 10 (22.7%) | 44 (71.0%) |
| $800 to $1,499 | 0 (0.0%) | 9 (14.5%) |
| Total | 44 (100.0%) | 62 (100.0%) |
Health & Disability in Twin Groves
Health Insurance Coverage by Age in Twin Groves
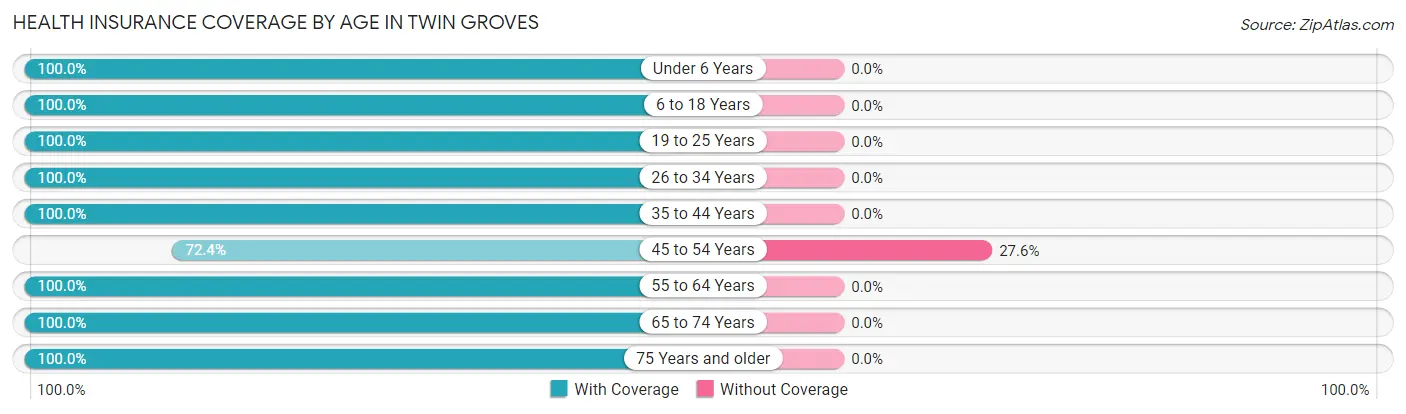
| Age Bracket | With Coverage | Without Coverage |
| Under 6 Years | 23 (100.0%) | 0 (0.0%) |
| 6 to 18 Years | 29 (100.0%) | 0 (0.0%) |
| 19 to 25 Years | 19 (100.0%) | 0 (0.0%) |
| 26 to 34 Years | 13 (100.0%) | 0 (0.0%) |
| 35 to 44 Years | 27 (100.0%) | 0 (0.0%) |
| 45 to 54 Years | 21 (72.4%) | 8 (27.6%) |
| 55 to 64 Years | 38 (100.0%) | 0 (0.0%) |
| 65 to 74 Years | 50 (100.0%) | 0 (0.0%) |
| 75 Years and older | 58 (100.0%) | 0 (0.0%) |
| Total | 278 (97.2%) | 8 (2.8%) |
Health Insurance Coverage by Citizenship Status in Twin Groves

| Citizenship Status | With Coverage | Without Coverage |
| Native Born | 23 (100.0%) | 0 (0.0%) |
| Foreign Born, Citizen | 29 (100.0%) | 0 (0.0%) |
| Foreign Born, not a Citizen | 19 (100.0%) | 0 (0.0%) |
Health Insurance Coverage by Household Income in Twin Groves
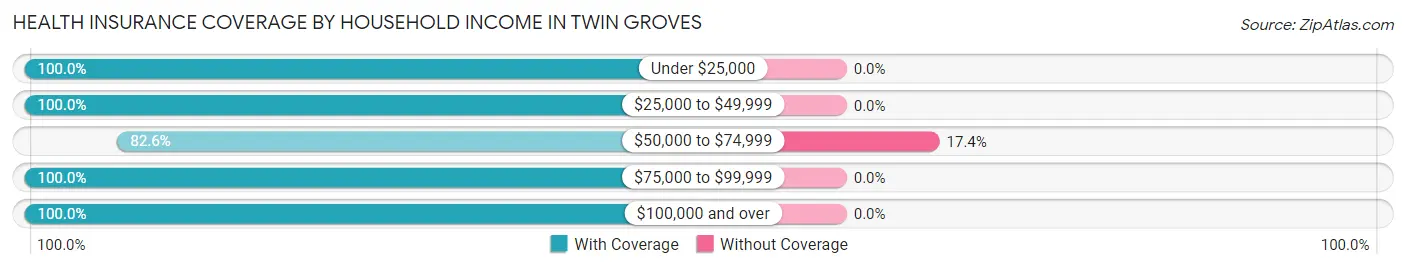
| Household Income | With Coverage | Without Coverage |
| Under $25,000 | 100 (100.0%) | 0 (0.0%) |
| $25,000 to $49,999 | 90 (100.0%) | 0 (0.0%) |
| $50,000 to $74,999 | 38 (82.6%) | 8 (17.4%) |
| $75,000 to $99,999 | 20 (100.0%) | 0 (0.0%) |
| $100,000 and over | 30 (100.0%) | 0 (0.0%) |
Public vs Private Health Insurance Coverage by Age in Twin Groves
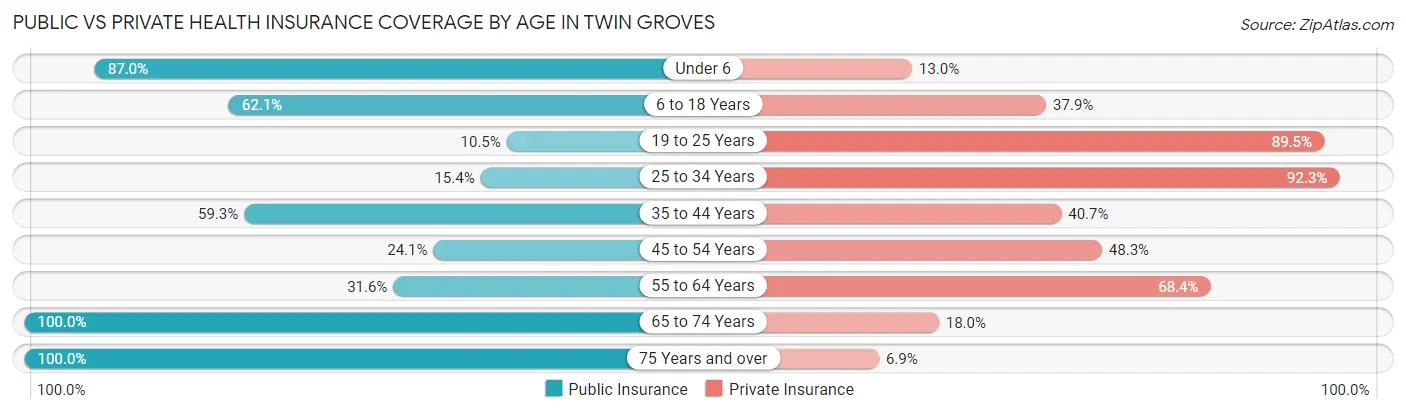
| Age Bracket | Public Insurance | Private Insurance |
| Under 6 | 20 (87.0%) | 3 (13.0%) |
| 6 to 18 Years | 18 (62.1%) | 11 (37.9%) |
| 19 to 25 Years | 2 (10.5%) | 17 (89.5%) |
| 25 to 34 Years | 2 (15.4%) | 12 (92.3%) |
| 35 to 44 Years | 16 (59.3%) | 11 (40.7%) |
| 45 to 54 Years | 7 (24.1%) | 14 (48.3%) |
| 55 to 64 Years | 12 (31.6%) | 26 (68.4%) |
| 65 to 74 Years | 50 (100.0%) | 9 (18.0%) |
| 75 Years and over | 58 (100.0%) | 4 (6.9%) |
| Total | 185 (64.7%) | 107 (37.4%) |
Disability Status by Sex by Age in Twin Groves
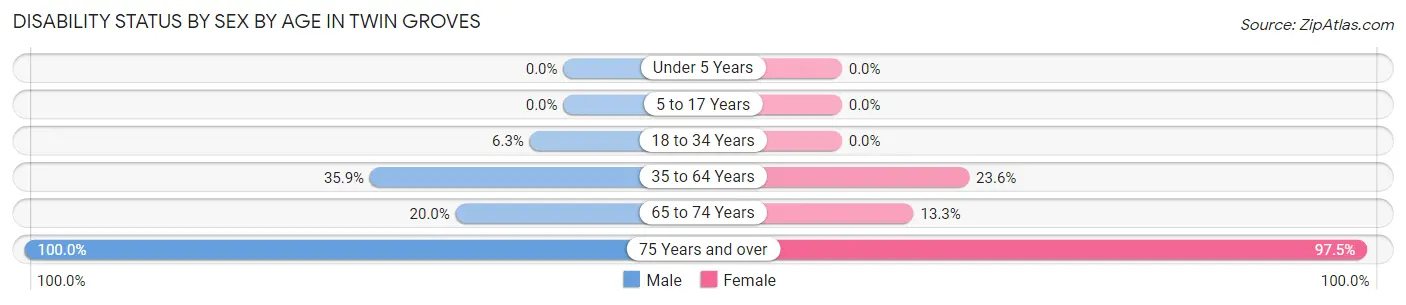
| Age Bracket | Male | Female |
| Under 5 Years | 0 (0.0%) | 0 (0.0%) |
| 5 to 17 Years | 0 (0.0%) | 0 (0.0%) |
| 18 to 34 Years | 1 (6.2%) | 0 (0.0%) |
| 35 to 64 Years | 14 (35.9%) | 13 (23.6%) |
| 65 to 74 Years | 4 (20.0%) | 4 (13.3%) |
| 75 Years and over | 18 (100.0%) | 39 (97.5%) |
Disability Class by Sex by Age in Twin Groves
Disability Class: Hearing Difficulty
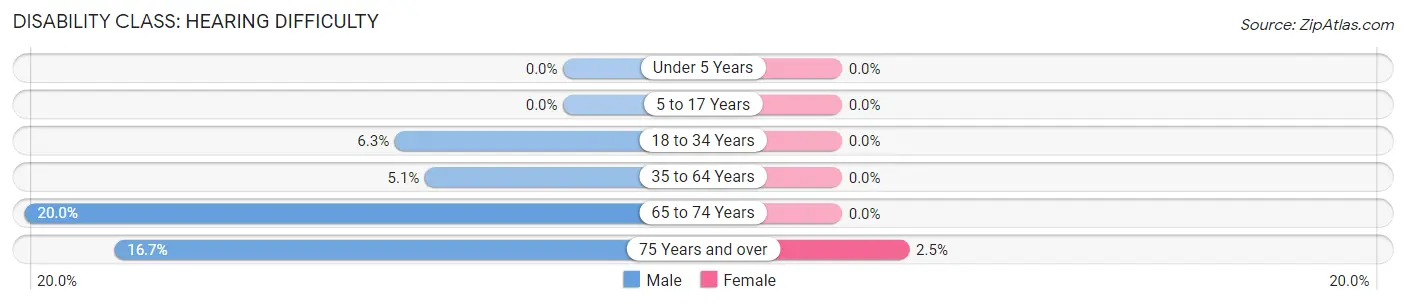
| Age Bracket | Male | Female |
| Under 5 Years | 0 (0.0%) | 0 (0.0%) |
| 5 to 17 Years | 0 (0.0%) | 0 (0.0%) |
| 18 to 34 Years | 1 (6.2%) | 0 (0.0%) |
| 35 to 64 Years | 2 (5.1%) | 0 (0.0%) |
| 65 to 74 Years | 4 (20.0%) | 0 (0.0%) |
| 75 Years and over | 3 (16.7%) | 1 (2.5%) |
Disability Class: Vision Difficulty
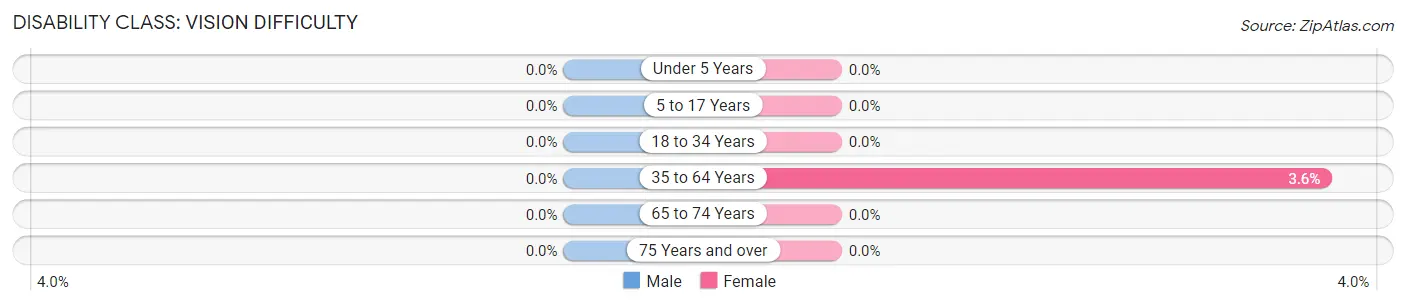
| Age Bracket | Male | Female |
| Under 5 Years | 0 (0.0%) | 0 (0.0%) |
| 5 to 17 Years | 0 (0.0%) | 0 (0.0%) |
| 18 to 34 Years | 0 (0.0%) | 0 (0.0%) |
| 35 to 64 Years | 0 (0.0%) | 2 (3.6%) |
| 65 to 74 Years | 0 (0.0%) | 0 (0.0%) |
| 75 Years and over | 0 (0.0%) | 0 (0.0%) |
Disability Class: Cognitive Difficulty
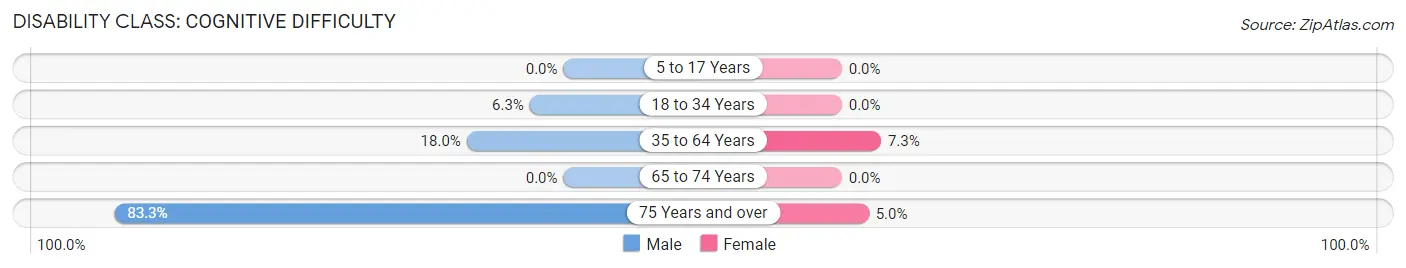
| Age Bracket | Male | Female |
| 5 to 17 Years | 0 (0.0%) | 0 (0.0%) |
| 18 to 34 Years | 1 (6.2%) | 0 (0.0%) |
| 35 to 64 Years | 7 (17.9%) | 4 (7.3%) |
| 65 to 74 Years | 0 (0.0%) | 0 (0.0%) |
| 75 Years and over | 15 (83.3%) | 2 (5.0%) |
Disability Class: Ambulatory Difficulty
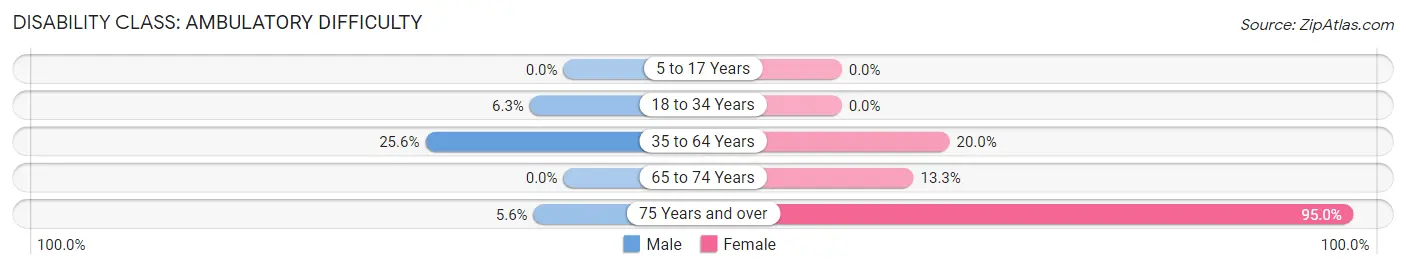
| Age Bracket | Male | Female |
| 5 to 17 Years | 0 (0.0%) | 0 (0.0%) |
| 18 to 34 Years | 1 (6.2%) | 0 (0.0%) |
| 35 to 64 Years | 10 (25.6%) | 11 (20.0%) |
| 65 to 74 Years | 0 (0.0%) | 4 (13.3%) |
| 75 Years and over | 1 (5.6%) | 38 (95.0%) |
Disability Class: Self-Care Difficulty
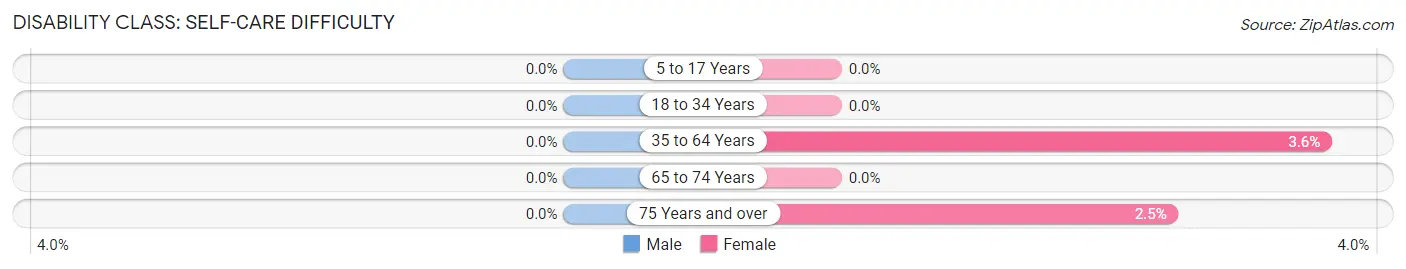
| Age Bracket | Male | Female |
| 5 to 17 Years | 0 (0.0%) | 0 (0.0%) |
| 18 to 34 Years | 0 (0.0%) | 0 (0.0%) |
| 35 to 64 Years | 0 (0.0%) | 2 (3.6%) |
| 65 to 74 Years | 0 (0.0%) | 0 (0.0%) |
| 75 Years and over | 0 (0.0%) | 1 (2.5%) |
Technology Access in Twin Groves
Computing Device Access in Twin Groves
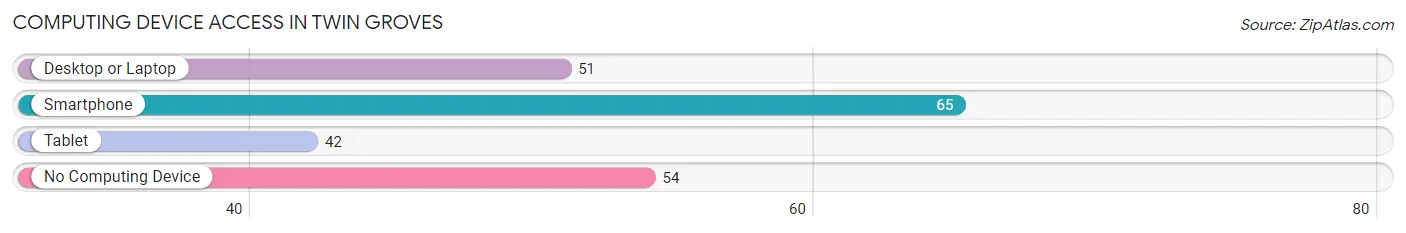
| Device Type | # Households | % Households |
| Desktop or Laptop | 51 | 39.2% |
| Smartphone | 65 | 50.0% |
| Tablet | 42 | 32.3% |
| No Computing Device | 54 | 41.5% |
| Total | 130 | 100.0% |
Internet Access in Twin Groves
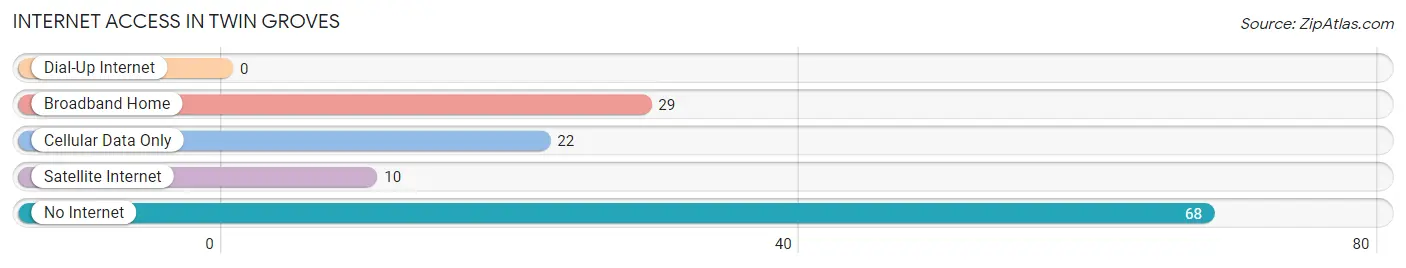
| Internet Type | # Households | % Households |
| Dial-Up Internet | 0 | 0.0% |
| Broadband Home | 29 | 22.3% |
| Cellular Data Only | 22 | 16.9% |
| Satellite Internet | 10 | 7.7% |
| No Internet | 68 | 52.3% |
| Total | 130 | 100.0% |
Twin Groves Summary
Twin Groves is a small unincorporated community located in the Ozark Mountains of Arkansas. It is situated in the northern part of the state, in Franklin County, and is approximately 20 miles south of the Arkansas-Missouri border. The community is located along the banks of the White River, and is home to a population of just over 200 people.
History
Twin Groves was first settled in the early 1800s by a group of settlers from Tennessee. The settlers were attracted to the area due to its abundance of natural resources, including timber and minerals. The community was originally known as “Twin Groves” due to the two large groves of trees that were located near the settlement. The name was later changed to “Twin Groves” in honor of the two groves.
The community was initially a small farming community, with the majority of the population engaged in subsistence farming. The community was also home to a number of small businesses, including a general store, a blacksmith, and a sawmill.
In the late 1800s, the community began to experience a period of growth and development. The construction of a railroad line through the area in the late 1800s allowed for the transportation of goods and services to and from the community. This led to an increase in the population of the community, as well as an increase in the number of businesses located in the area.
Geography
Twin Groves is located in the Ozark Mountains of Arkansas. The community is situated in the northern part of the state, in Franklin County. The community is located along the banks of the White River, and is approximately 20 miles south of the Arkansas-Missouri border.
The terrain of the area is mostly hilly and forested, with the majority of the land being used for agricultural purposes. The climate of the area is generally mild, with temperatures ranging from the mid-30s in the winter to the mid-80s in the summer.
Economy
The economy of Twin Groves is largely based on agriculture. The majority of the population is engaged in subsistence farming, with the majority of the crops grown being corn, soybeans, and wheat. The community is also home to a number of small businesses, including a general store, a blacksmith, and a sawmill.
The community is also home to a number of tourist attractions, including the Ozark National Forest and the White River. These attractions draw visitors from all over the country, and provide a boost to the local economy.
Demographics
As of the 2010 census, the population of Twin Groves was 203. The racial makeup of the community was 97.5% White, 0.5% African American, 0.5% Native American, and 1.5% from other races. The median household income in the community was $30,000, and the median age was 44.
Twin Groves is a small, rural community with a population of just over 200 people. The community is largely agricultural, with the majority of the population engaged in subsistence farming. The community is also home to a number of small businesses, and is a popular tourist destination due to its proximity to the Ozark National Forest and the White River.
Common Questions
What is Per Capita Income in Twin Groves?
Per Capita income in Twin Groves is $18,413.
What is the Median Family Income in Twin Groves?
Median Family Income in Twin Groves is $37,107.
What is the Median Household income in Twin Groves?
Median Household Income in Twin Groves is $36,429.
What is Inequality or Gini Index in Twin Groves?
Inequality or Gini Index in Twin Groves is 0.39.
What is the Total Population of Twin Groves?
Total Population of Twin Groves is 286.
What is the Total Male Population of Twin Groves?
Total Male Population of Twin Groves is 124.
What is the Total Female Population of Twin Groves?
Total Female Population of Twin Groves is 162.
What is the Ratio of Males per 100 Females in Twin Groves?
There are 76.54 Males per 100 Females in Twin Groves.
What is the Ratio of Females per 100 Males in Twin Groves?
There are 130.65 Females per 100 Males in Twin Groves.
What is the Median Population Age in Twin Groves?
Median Population Age in Twin Groves is 58.0 Years.
What is the Average Family Size in Twin Groves
Average Family Size in Twin Groves is 2.5 People.
What is the Average Household Size in Twin Groves
Average Household Size in Twin Groves is 2.2 People.
How Large is the Labor Force in Twin Groves?
There are 96 People in the Labor Forcein in Twin Groves.
What is the Percentage of People in the Labor Force in Twin Groves?
39.5% of People are in the Labor Force in Twin Groves.
What is the Unemployment Rate in Twin Groves?
Unemployment Rate in Twin Groves is 4.2%.