Lost Bridge Village, AR Map & Demographics
Lost Bridge Village Map
Lost Bridge Village Overview
$63,715
PER CAPITA INCOME
$89,000
AVG FAMILY INCOME
$66,563
AVG HOUSEHOLD INCOME
0.46
INEQUALITY / GINI INDEX
289
TOTAL POPULATION
156
MALE POPULATION
133
FEMALE POPULATION
117.29
MALES / 100 FEMALES
85.26
FEMALES / 100 MALES
63.9
MEDIAN AGE
2.2
AVG FAMILY SIZE
1.5
AVG HOUSEHOLD SIZE
129
LABOR FORCE [ PEOPLE ]
44.9%
PERCENT IN LABOR FORCE
4.8%
UNEMPLOYMENT RATE
Income in Lost Bridge Village
Income Overview in Lost Bridge Village
Per Capita Income in Lost Bridge Village is $63,715, while median incomes of families and households are $89,000 and $66,563 respectively.
| Characteristic | Number | Measure |
| Per Capita Income | 289 | $63,715 |
| Median Family Income | 84 | $89,000 |
| Mean Family Income | 84 | $102,286 |
| Median Household Income | 189 | $66,563 |
| Mean Household Income | 189 | $97,155 |
| Income Deficit | 84 | $0 |
| Wage / Income Gap (%) | 289 | 0.00% |
| Wage / Income Gap ($) | 289 | 100.00¢ per $1 |
| Gini / Inequality Index | 289 | 0.46 |
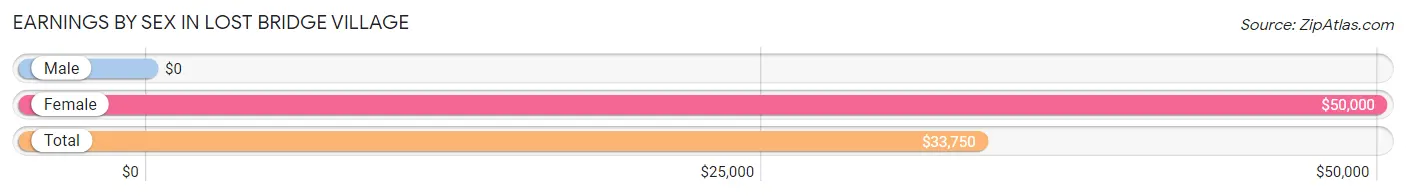
Earnings by Sex in Lost Bridge Village
| Sex | Number | Average Earnings |
| Male | 82 (62.1%) | $0 |
| Female | 50 (37.9%) | $50,000 |
| Total | 132 (100.0%) | $33,750 |
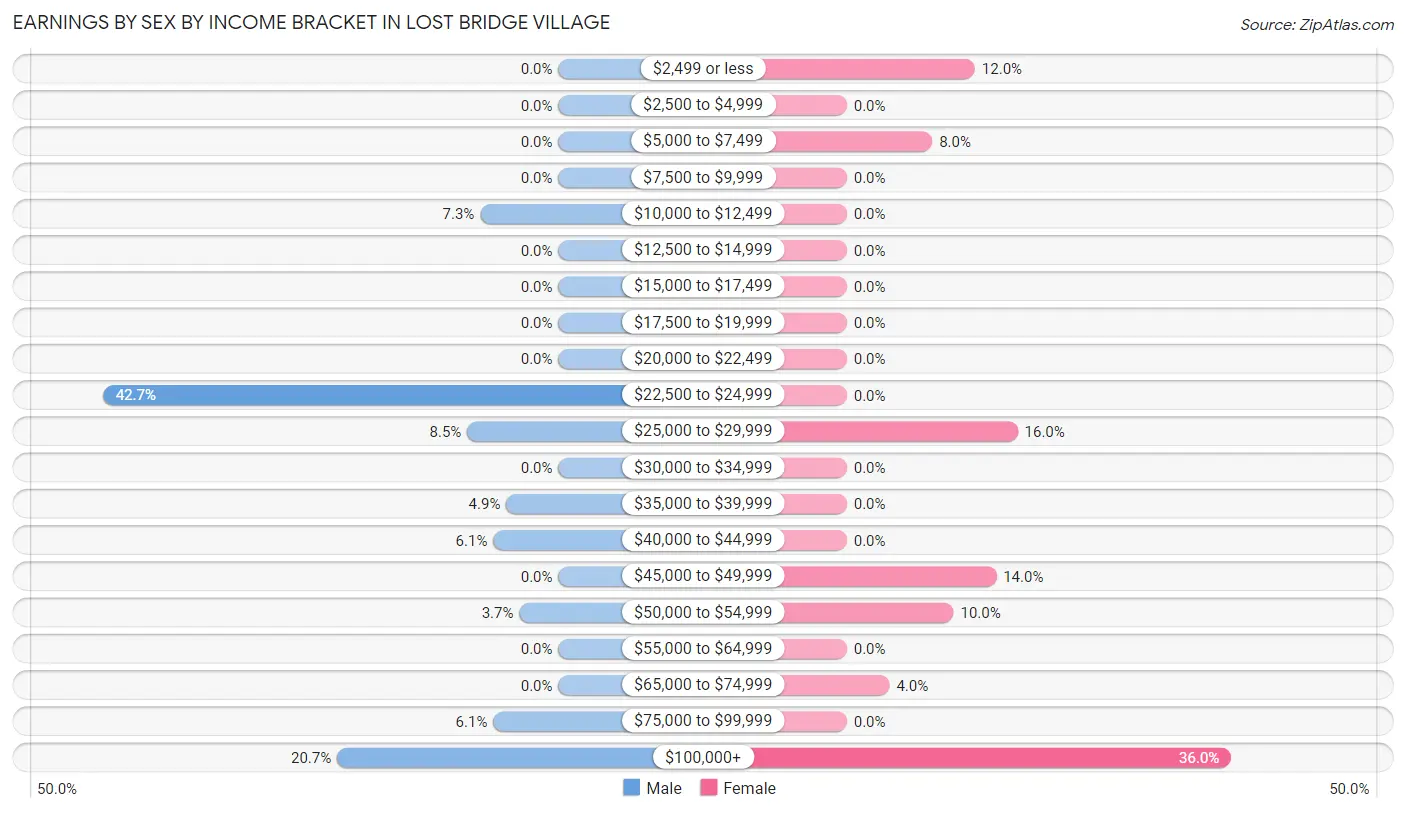
Earnings by Sex by Income Bracket in Lost Bridge Village
The most common earnings brackets in Lost Bridge Village are $22,500 to $24,999 for men (35 | 42.7%) and $100,000+ for women (18 | 36.0%).
| Income | Male | Female |
| $2,499 or less | 0 (0.0%) | 6 (12.0%) |
| $2,500 to $4,999 | 0 (0.0%) | 0 (0.0%) |
| $5,000 to $7,499 | 0 (0.0%) | 4 (8.0%) |
| $7,500 to $9,999 | 0 (0.0%) | 0 (0.0%) |
| $10,000 to $12,499 | 6 (7.3%) | 0 (0.0%) |
| $12,500 to $14,999 | 0 (0.0%) | 0 (0.0%) |
| $15,000 to $17,499 | 0 (0.0%) | 0 (0.0%) |
| $17,500 to $19,999 | 0 (0.0%) | 0 (0.0%) |
| $20,000 to $22,499 | 0 (0.0%) | 0 (0.0%) |
| $22,500 to $24,999 | 35 (42.7%) | 0 (0.0%) |
| $25,000 to $29,999 | 7 (8.5%) | 8 (16.0%) |
| $30,000 to $34,999 | 0 (0.0%) | 0 (0.0%) |
| $35,000 to $39,999 | 4 (4.9%) | 0 (0.0%) |
| $40,000 to $44,999 | 5 (6.1%) | 0 (0.0%) |
| $45,000 to $49,999 | 0 (0.0%) | 7 (14.0%) |
| $50,000 to $54,999 | 3 (3.7%) | 5 (10.0%) |
| $55,000 to $64,999 | 0 (0.0%) | 0 (0.0%) |
| $65,000 to $74,999 | 0 (0.0%) | 2 (4.0%) |
| $75,000 to $99,999 | 5 (6.1%) | 0 (0.0%) |
| $100,000+ | 17 (20.7%) | 18 (36.0%) |
| Total | 82 (100.0%) | 50 (100.0%) |
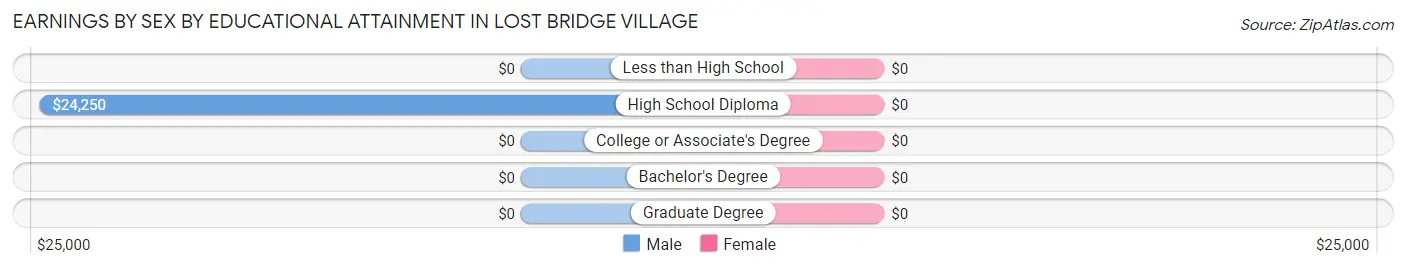
Earnings by Sex by Educational Attainment in Lost Bridge Village
| Educational Attainment | Male Income | Female Income |
| Less than High School | - | - |
| High School Diploma | $24,250 | $0 |
| College or Associate's Degree | - | - |
| Bachelor's Degree | - | - |
| Graduate Degree | - | - |
| Total | - | - |
Family Income in Lost Bridge Village
Family Income Brackets in Lost Bridge Village
According to the Lost Bridge Village family income data, there are 26 families falling into the $100,000 to $149,999 income range, which is the most common income bracket and makes up 30.9% of all families.
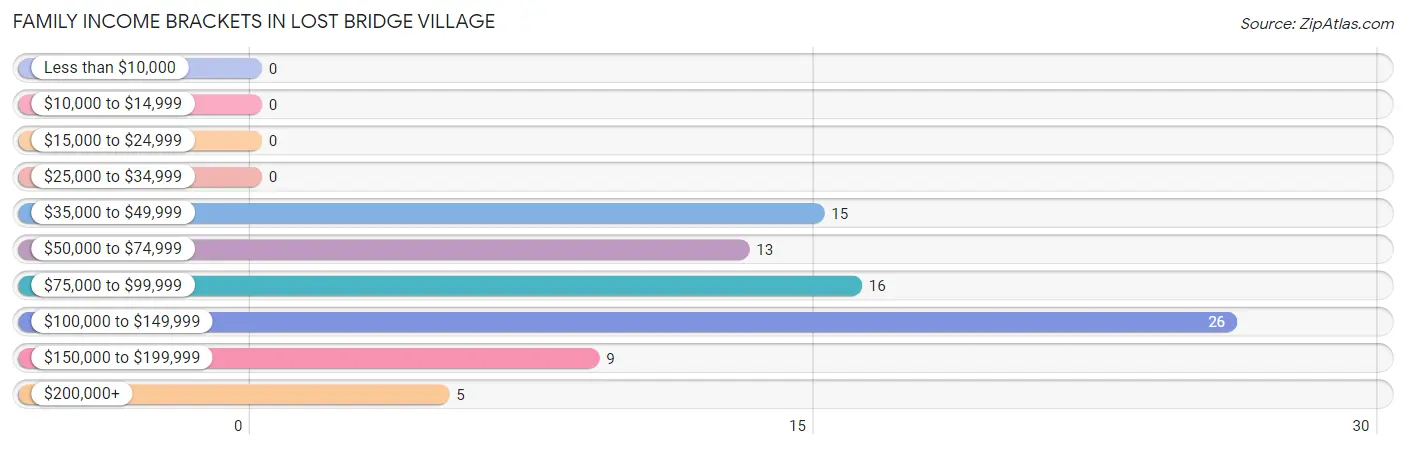
| Income Bracket | # Families | % Families |
| Less than $10,000 | 0 | 0.0% |
| $10,000 to $14,999 | 0 | 0.0% |
| $15,000 to $24,999 | 0 | 0.0% |
| $25,000 to $34,999 | 0 | 0.0% |
| $35,000 to $49,999 | 15 | 17.9% |
| $50,000 to $74,999 | 13 | 15.5% |
| $75,000 to $99,999 | 16 | 19.0% |
| $100,000 to $149,999 | 26 | 31.0% |
| $150,000 to $199,999 | 9 | 10.7% |
| $200,000+ | 5 | 6.0% |
Family Income by Famaliy Size in Lost Bridge Village
2-person families (79 | 94.1%) account for the highest median family income in Lost Bridge Village with $87,750 per family, while 2-person families (79 | 94.1%) have the highest median income of $43,875 per family member.
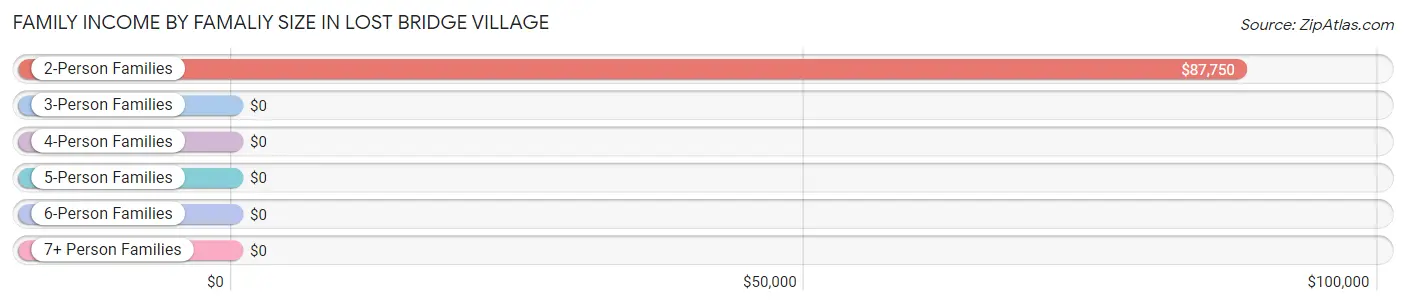
| Income Bracket | # Families | Median Income |
| 2-Person Families | 79 (94.1%) | $87,750 |
| 3-Person Families | 0 (0.0%) | $0 |
| 4-Person Families | 5 (5.9%) | $0 |
| 5-Person Families | 0 (0.0%) | $0 |
| 6-Person Families | 0 (0.0%) | $0 |
| 7+ Person Families | 0 (0.0%) | $0 |
| Total | 84 (100.0%) | $89,000 |
Family Income by Number of Earners in Lost Bridge Village
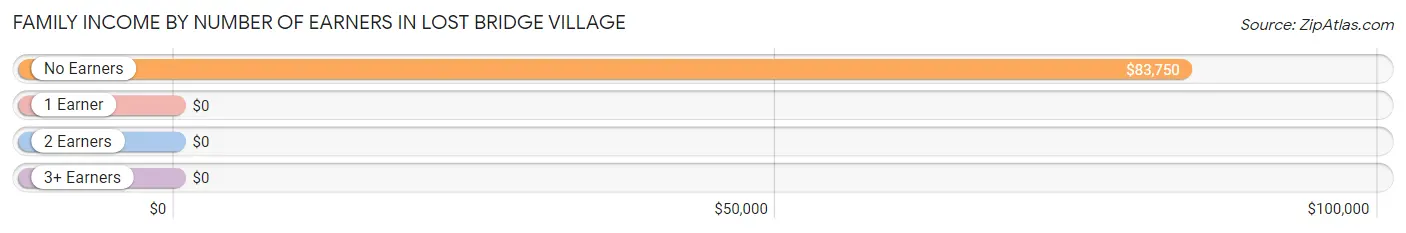
| Number of Earners | # Families | Median Income |
| No Earners | 60 (71.4%) | $83,750 |
| 1 Earner | 10 (11.9%) | $0 |
| 2 Earners | 9 (10.7%) | $0 |
| 3+ Earners | 5 (5.9%) | $0 |
| Total | 84 (100.0%) | $89,000 |
Household Income in Lost Bridge Village
Household Income Brackets in Lost Bridge Village
With 38 households falling in the category, the $100,000 to $149,999 income range is the most frequent in Lost Bridge Village, accounting for 20.1% of all households.
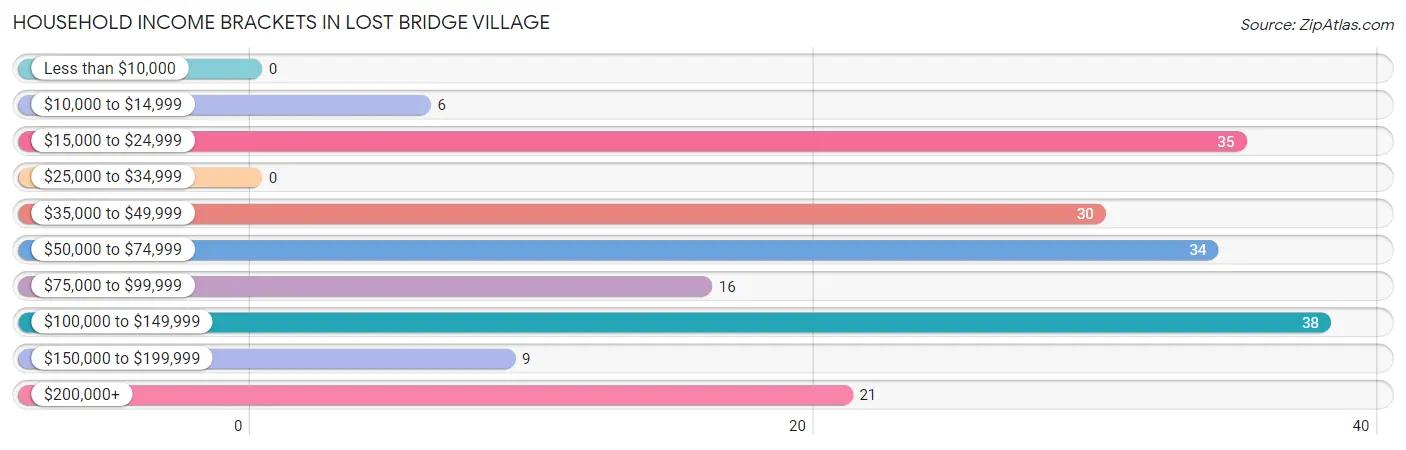
| Income Bracket | # Households | % Households |
| Less than $10,000 | 0 | 0.0% |
| $10,000 to $14,999 | 6 | 3.2% |
| $15,000 to $24,999 | 35 | 18.5% |
| $25,000 to $34,999 | 0 | 0.0% |
| $35,000 to $49,999 | 30 | 15.9% |
| $50,000 to $74,999 | 34 | 18.0% |
| $75,000 to $99,999 | 16 | 8.5% |
| $100,000 to $149,999 | 38 | 20.1% |
| $150,000 to $199,999 | 9 | 4.8% |
| $200,000+ | 21 | 11.1% |
Household Income by Householder Age in Lost Bridge Village
The median household income in Lost Bridge Village is $66,563, with the highest median household income of $76,250 found in the 65+ years age bracket for the primary householder. A total of 87 households (46.0%) fall into this category. Meanwhile, the 15 to 24 years age bracket for the primary householder has the lowest median household income of $0, with 4 households (2.1%) in this group.
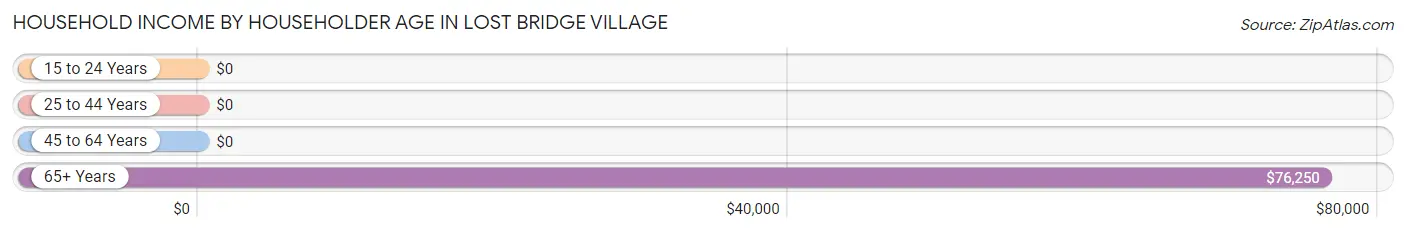
| Income Bracket | # Households | Median Income |
| 15 to 24 Years | 4 (2.1%) | $0 |
| 25 to 44 Years | 16 (8.5%) | $0 |
| 45 to 64 Years | 82 (43.4%) | $0 |
| 65+ Years | 87 (46.0%) | $76,250 |
| Total | 189 (100.0%) | $66,563 |
Poverty in Lost Bridge Village
Income Below Poverty by Sex and Age in Lost Bridge Village
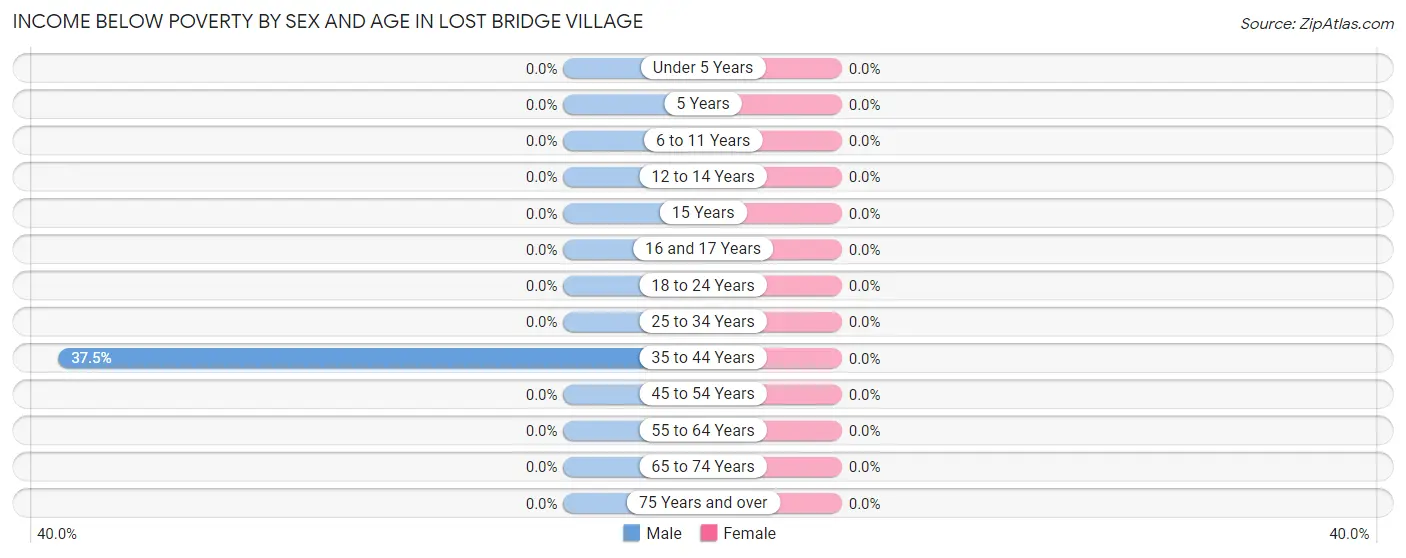
| Age Bracket | Male | Female |
| Under 5 Years | 0 (0.0%) | 0 (0.0%) |
| 5 Years | 0 (0.0%) | 0 (0.0%) |
| 6 to 11 Years | 0 (0.0%) | 0 (0.0%) |
| 12 to 14 Years | 0 (0.0%) | 0 (0.0%) |
| 15 Years | 0 (0.0%) | 0 (0.0%) |
| 16 and 17 Years | 0 (0.0%) | 0 (0.0%) |
| 18 to 24 Years | 0 (0.0%) | 0 (0.0%) |
| 25 to 34 Years | 0 (0.0%) | 0 (0.0%) |
| 35 to 44 Years | 6 (37.5%) | 0 (0.0%) |
| 45 to 54 Years | 0 (0.0%) | 0 (0.0%) |
| 55 to 64 Years | 0 (0.0%) | 0 (0.0%) |
| 65 to 74 Years | 0 (0.0%) | 0 (0.0%) |
| 75 Years and over | 0 (0.0%) | 0 (0.0%) |
| Total | 6 (3.8%) | 0 (0.0%) |
Income Above Poverty by Sex and Age in Lost Bridge Village
According to the poverty statistics in Lost Bridge Village, males aged 18 to 24 years and females aged 6 to 11 years are the age groups that are most secure financially, with 100.0% of males and 100.0% of females in these age groups living above the poverty line.
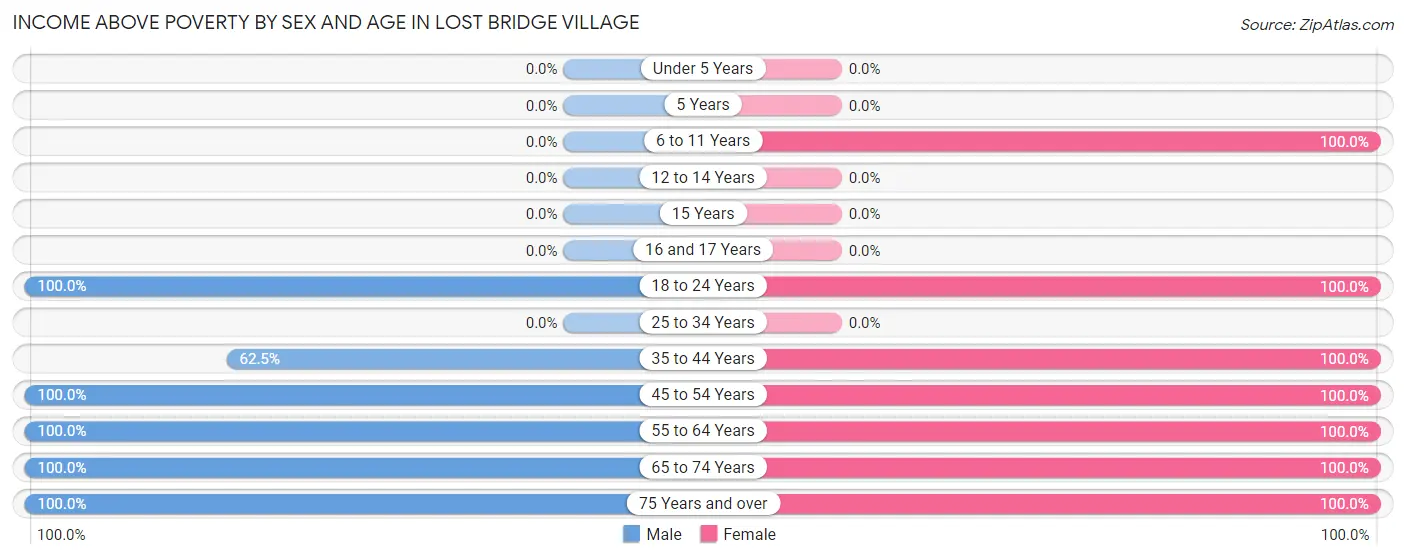
| Age Bracket | Male | Female |
| Under 5 Years | 0 (0.0%) | 0 (0.0%) |
| 5 Years | 0 (0.0%) | 0 (0.0%) |
| 6 to 11 Years | 0 (0.0%) | 2 (100.0%) |
| 12 to 14 Years | 0 (0.0%) | 0 (0.0%) |
| 15 Years | 0 (0.0%) | 0 (0.0%) |
| 16 and 17 Years | 0 (0.0%) | 0 (0.0%) |
| 18 to 24 Years | 4 (100.0%) | 10 (100.0%) |
| 25 to 34 Years | 0 (0.0%) | 0 (0.0%) |
| 35 to 44 Years | 10 (62.5%) | 2 (100.0%) |
| 45 to 54 Years | 17 (100.0%) | 11 (100.0%) |
| 55 to 64 Years | 50 (100.0%) | 39 (100.0%) |
| 65 to 74 Years | 31 (100.0%) | 34 (100.0%) |
| 75 Years and over | 38 (100.0%) | 35 (100.0%) |
| Total | 150 (96.2%) | 133 (100.0%) |
Income Below Poverty Among Married-Couple Families in Lost Bridge Village
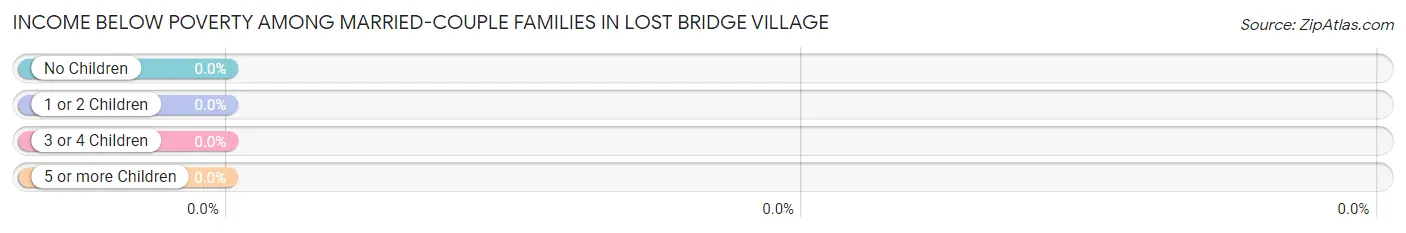
| Children | Above Poverty | Below Poverty |
| No Children | 81 (100.0%) | 0 (0.0%) |
| 1 or 2 Children | 3 (100.0%) | 0 (0.0%) |
| 3 or 4 Children | 0 (0.0%) | 0 (0.0%) |
| 5 or more Children | 0 (0.0%) | 0 (0.0%) |
| Total | 84 (100.0%) | 0 (0.0%) |
Income Below Poverty Among Single-Parent Households in Lost Bridge Village
| Children | Single Father | Single Mother |
| No Children | 0 (0.0%) | 0 (0.0%) |
| 1 or 2 Children | 0 (0.0%) | 0 (0.0%) |
| 3 or 4 Children | 0 (0.0%) | 0 (0.0%) |
| 5 or more Children | 0 (0.0%) | 0 (0.0%) |
| Total | 0 (0.0%) | 0 (0.0%) |
Income Below Poverty Among Married-Couple vs Single-Parent Households in Lost Bridge Village
| Children | Married-Couple Families | Single-Parent Households |
| No Children | 0 (0.0%) | 0 (0.0%) |
| 1 or 2 Children | 0 (0.0%) | 0 (0.0%) |
| 3 or 4 Children | 0 (0.0%) | 0 (0.0%) |
| 5 or more Children | 0 (0.0%) | 0 (0.0%) |
| Total | 0 (0.0%) | 0 (0.0%) |
Race in Lost Bridge Village
The most populous races in Lost Bridge Village are White / Caucasian (272 | 94.1%), Two or more Races (7 | 2.4%), and Hawaiian / Pacific (4 | 1.4%).
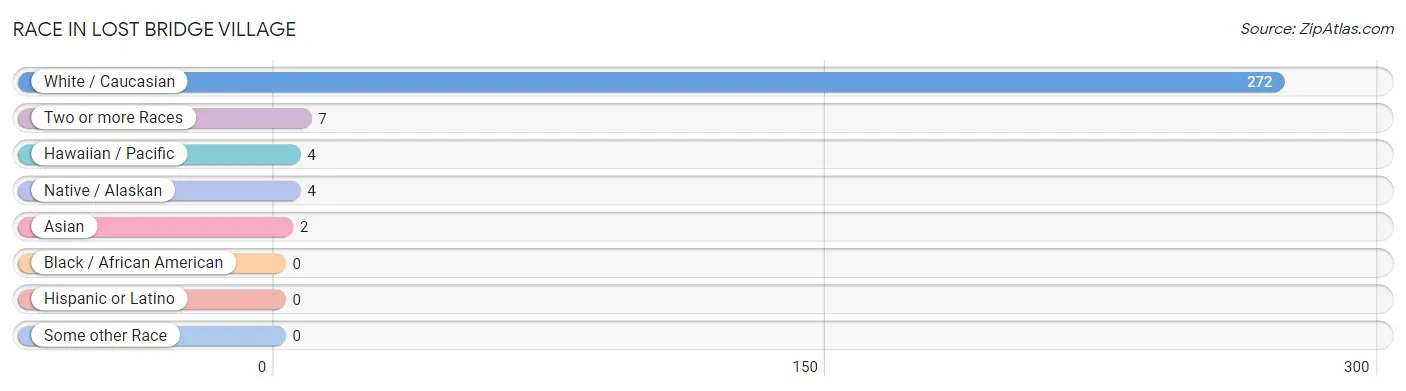
| Race | # Population | % Population |
| Asian | 2 | 0.7% |
| Black / African American | 0 | 0.0% |
| Hawaiian / Pacific | 4 | 1.4% |
| Hispanic or Latino | 0 | 0.0% |
| Native / Alaskan | 4 | 1.4% |
| White / Caucasian | 272 | 94.1% |
| Two or more Races | 7 | 2.4% |
| Some other Race | 0 | 0.0% |
| Total | 289 | 100.0% |
Ancestry in Lost Bridge Village
The most populous ancestries reported in Lost Bridge Village are German (89 | 30.8%), Irish (67 | 23.2%), English (36 | 12.5%), American (12 | 4.2%), and Scotch-Irish (11 | 3.8%), together accounting for 74.4% of all Lost Bridge Village residents.
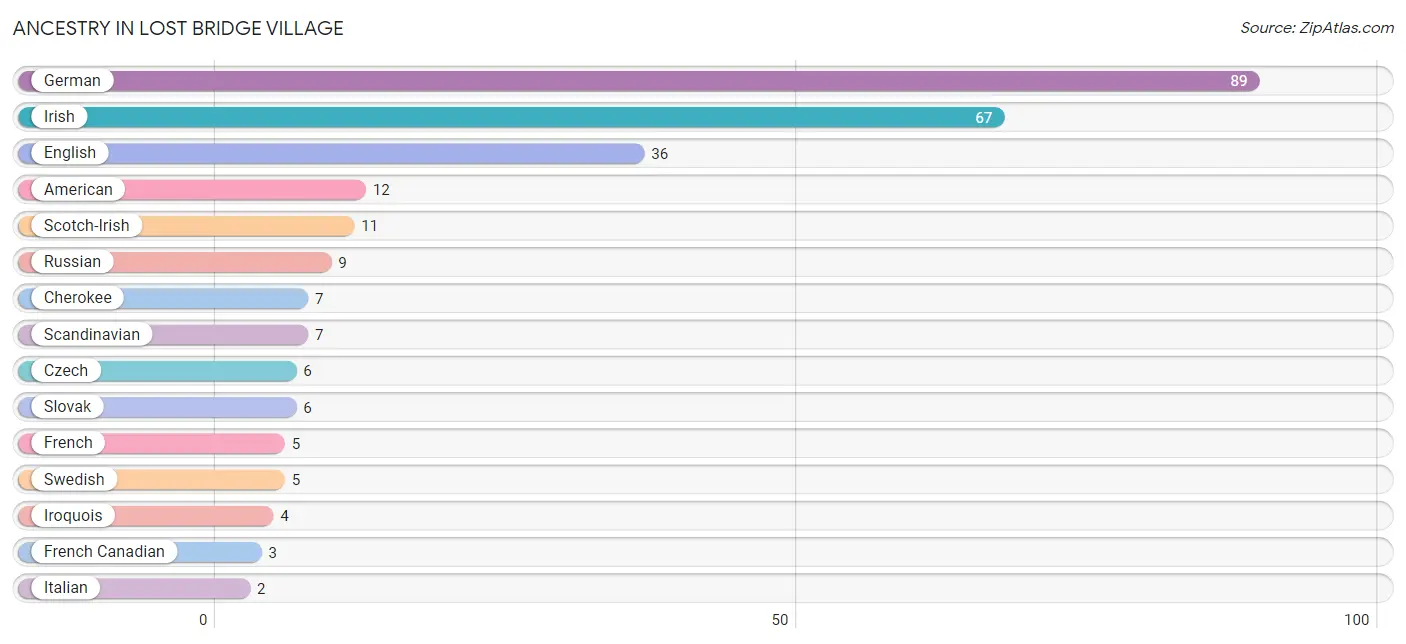
| Ancestry | # Population | % Population |
| American | 12 | 4.2% |
| Cherokee | 7 | 2.4% |
| Czech | 6 | 2.1% |
| English | 36 | 12.5% |
| French | 5 | 1.7% |
| French Canadian | 3 | 1.0% |
| German | 89 | 30.8% |
| Irish | 67 | 23.2% |
| Iroquois | 4 | 1.4% |
| Italian | 2 | 0.7% |
| Korean | 2 | 0.7% |
| Russian | 9 | 3.1% |
| Scandinavian | 7 | 2.4% |
| Scotch-Irish | 11 | 3.8% |
| Slovak | 6 | 2.1% |
| Swedish | 5 | 1.7% | View All 16 Rows |
Immigrants in Lost Bridge Village
The most numerous immigrant groups reported in Lost Bridge Village came from Oceania (4 | 1.4%), Asia (2 | 0.7%), Philippines (2 | 0.7%), and South Eastern Asia (2 | 0.7%), together accounting for 3.5% of all Lost Bridge Village residents.
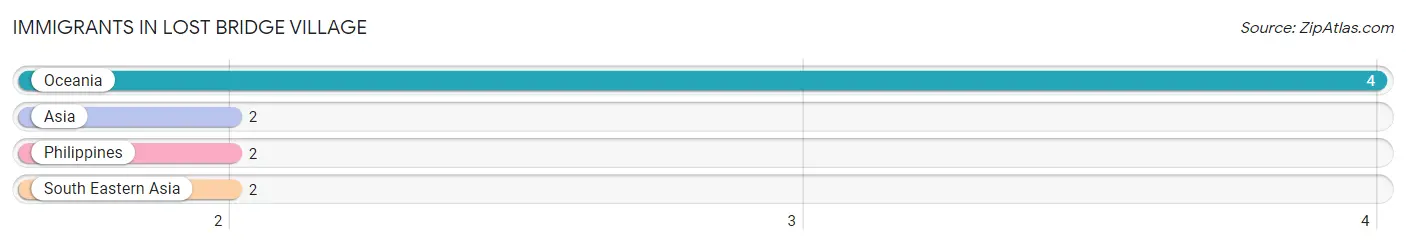
| Immigration Origin | # Population | % Population |
| Asia | 2 | 0.7% |
| Oceania | 4 | 1.4% |
| Philippines | 2 | 0.7% |
| South Eastern Asia | 2 | 0.7% | View All 4 Rows |
Sex and Age in Lost Bridge Village
Sex and Age in Lost Bridge Village
The most populous age groups in Lost Bridge Village are 55 to 59 Years (35 | 22.4%) for men and 60 to 64 Years (27 | 20.3%) for women.
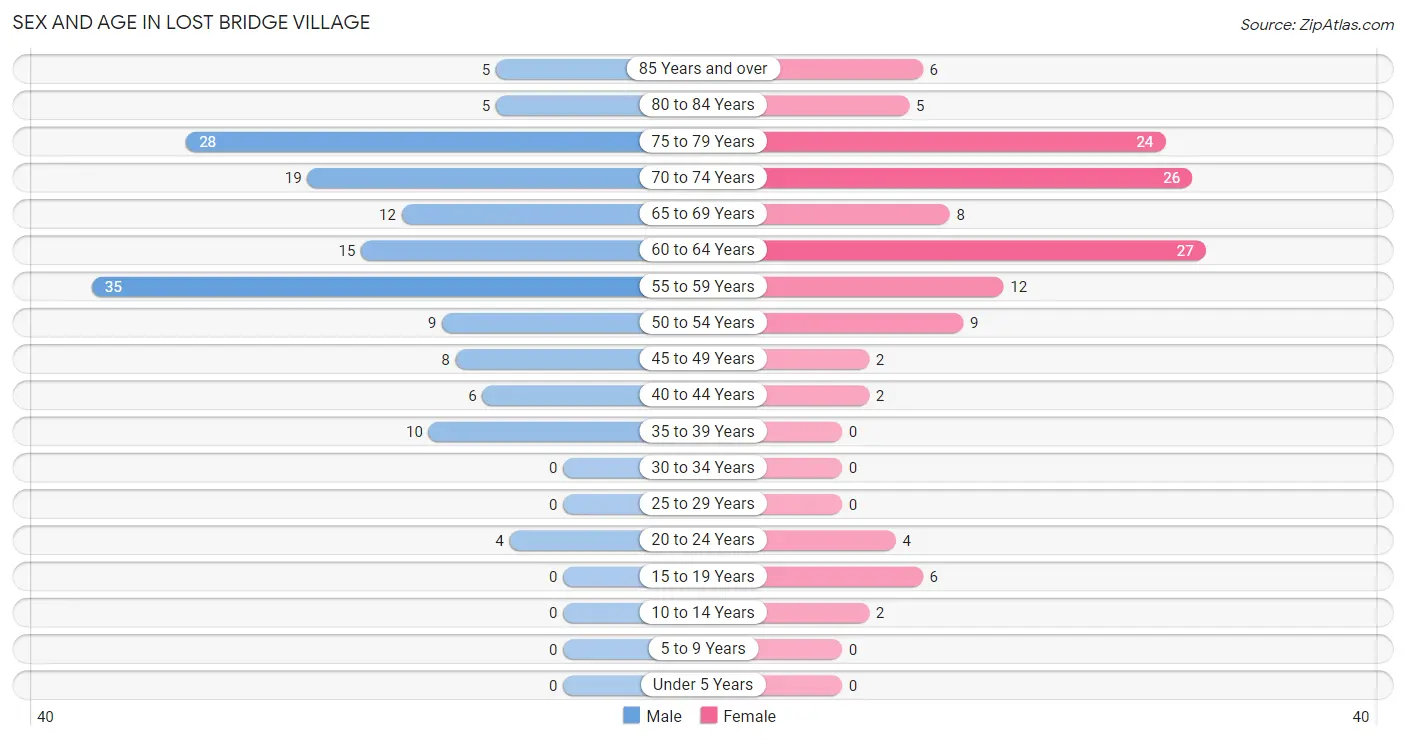
| Age Bracket | Male | Female |
| Under 5 Years | 0 (0.0%) | 0 (0.0%) |
| 5 to 9 Years | 0 (0.0%) | 0 (0.0%) |
| 10 to 14 Years | 0 (0.0%) | 2 (1.5%) |
| 15 to 19 Years | 0 (0.0%) | 6 (4.5%) |
| 20 to 24 Years | 4 (2.6%) | 4 (3.0%) |
| 25 to 29 Years | 0 (0.0%) | 0 (0.0%) |
| 30 to 34 Years | 0 (0.0%) | 0 (0.0%) |
| 35 to 39 Years | 10 (6.4%) | 0 (0.0%) |
| 40 to 44 Years | 6 (3.8%) | 2 (1.5%) |
| 45 to 49 Years | 8 (5.1%) | 2 (1.5%) |
| 50 to 54 Years | 9 (5.8%) | 9 (6.8%) |
| 55 to 59 Years | 35 (22.4%) | 12 (9.0%) |
| 60 to 64 Years | 15 (9.6%) | 27 (20.3%) |
| 65 to 69 Years | 12 (7.7%) | 8 (6.0%) |
| 70 to 74 Years | 19 (12.2%) | 26 (19.6%) |
| 75 to 79 Years | 28 (17.9%) | 24 (18.0%) |
| 80 to 84 Years | 5 (3.2%) | 5 (3.8%) |
| 85 Years and over | 5 (3.2%) | 6 (4.5%) |
| Total | 156 (100.0%) | 133 (100.0%) |
Families and Households in Lost Bridge Village
Median Family Size in Lost Bridge Village
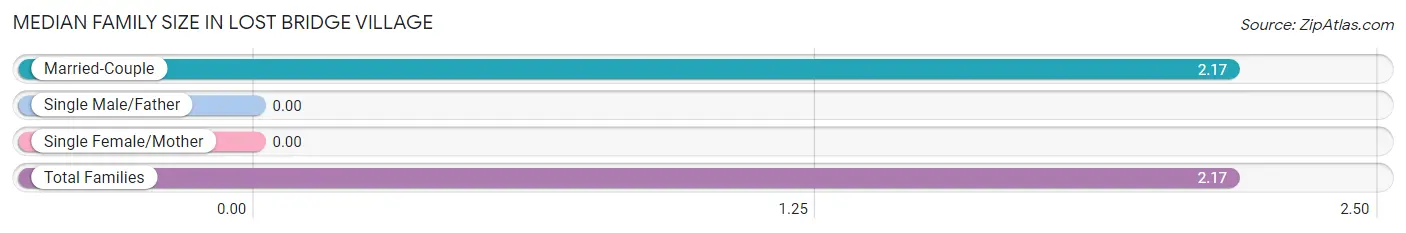
| Family Type | # Families | Family Size |
| Married-Couple | 84 (100.0%) | 2.17 |
| Single Male/Father | 0 (0.0%) | - |
| Single Female/Mother | 0 (0.0%) | - |
| Total Families | 84 (100.0%) | 2.17 |
Median Household Size in Lost Bridge Village
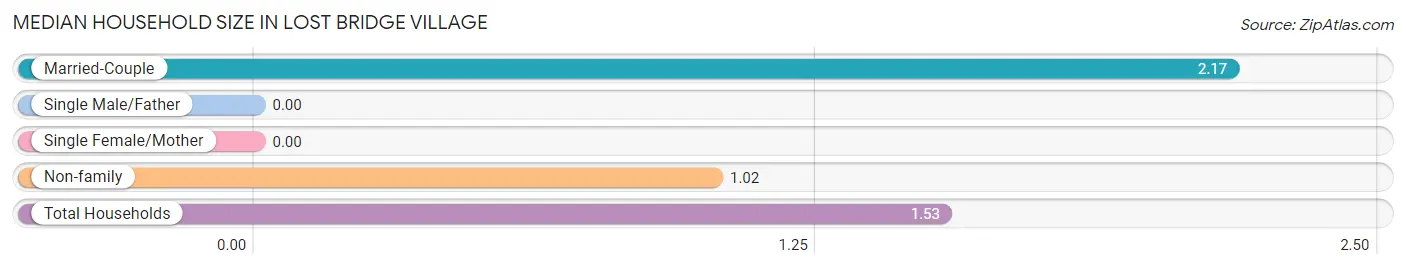
| Household Type | # Households | Household Size |
| Married-Couple | 84 (44.4%) | 2.17 |
| Single Male/Father | 0 (0.0%) | - |
| Single Female/Mother | 0 (0.0%) | - |
| Non-family | 105 (55.6%) | 1.02 |
| Total Households | 189 (100.0%) | 1.53 |
Household Size by Marriage Status in Lost Bridge Village
Out of a total of 189 households in Lost Bridge Village, 84 (44.4%) are family households, while 105 (55.6%) are nonfamily households. The most numerous type of family households are 2-person households, comprising 79, and the most common type of nonfamily households are 1-person households, comprising 100.
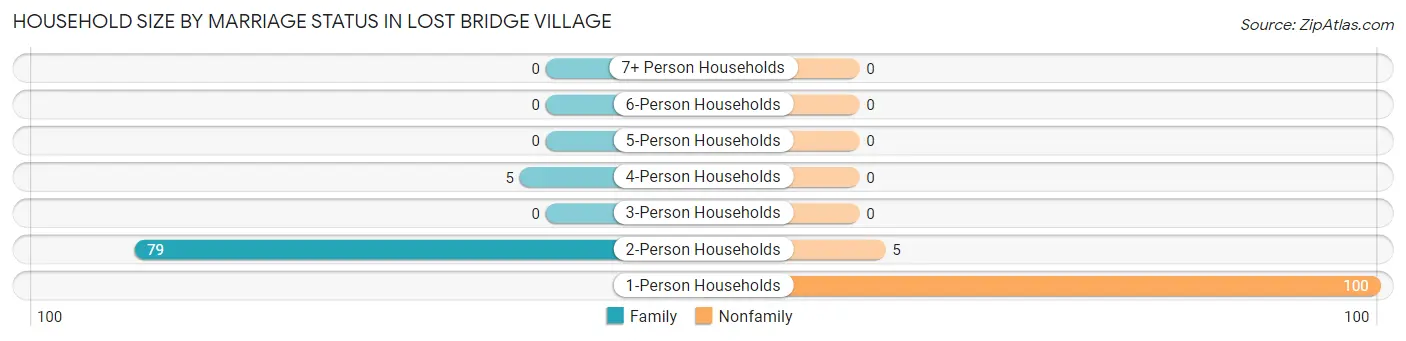
| Household Size | Family Households | Nonfamily Households |
| 1-Person Households | - | 100 (52.9%) |
| 2-Person Households | 79 (41.8%) | 5 (2.6%) |
| 3-Person Households | 0 (0.0%) | 0 (0.0%) |
| 4-Person Households | 5 (2.6%) | 0 (0.0%) |
| 5-Person Households | 0 (0.0%) | 0 (0.0%) |
| 6-Person Households | 0 (0.0%) | 0 (0.0%) |
| 7+ Person Households | 0 (0.0%) | 0 (0.0%) |
| Total | 84 (44.4%) | 105 (55.6%) |
Female Fertility in Lost Bridge Village
Fertility by Age in Lost Bridge Village
| Age Bracket | Women with Births | Births / 1,000 Women |
| 15 to 19 years | 0 (0.0%) | 0.0 |
| 20 to 34 years | 0 (0.0%) | 0.0 |
| 35 to 50 years | 0 (0.0%) | 0.0 |
| Total | 0 (0.0%) | 0.0 |
Fertility by Age by Marriage Status in Lost Bridge Village
| Age Bracket | Married | Unmarried |
| 15 to 19 years | 0 (0.0%) | 0 (0.0%) |
| 20 to 34 years | 0 (0.0%) | 0 (0.0%) |
| 35 to 50 years | 0 (0.0%) | 0 (0.0%) |
| Total | 0 (0.0%) | 0 (0.0%) |
Fertility by Education in Lost Bridge Village
| Educational Attainment | Women with Births | Births / 1,000 Women |
| Less than High School | 0 (0.0%) | 0.0 |
| High School Diploma | 0 (0.0%) | 0.0 |
| College or Associate's Degree | 0 (0.0%) | 0.0 |
| Bachelor's Degree | 0 (0.0%) | 0.0 |
| Graduate Degree | 0 (0.0%) | 0.0 |
| Total | 0 (0.0%) | 0.0 |
Fertility by Education by Marriage Status in Lost Bridge Village
| Educational Attainment | Married | Unmarried |
| Less than High School | 0 (0.0%) | 0 (0.0%) |
| High School Diploma | 0 (0.0%) | 0 (0.0%) |
| College or Associate's Degree | 0 (0.0%) | 0 (0.0%) |
| Bachelor's Degree | 0 (0.0%) | 0 (0.0%) |
| Graduate Degree | 0 (0.0%) | 0 (0.0%) |
| Total | 0 (0.0%) | 0 (0.0%) |
Employment Characteristics in Lost Bridge Village
Employment by Class of Employer in Lost Bridge Village
Among the 123 employed individuals in Lost Bridge Village, private company employees (75 | 61.0%), self-employed (incorporated) (17 | 13.8%), and self-employed (not incorporated) (10 | 8.1%) make up the most common classes of employment.
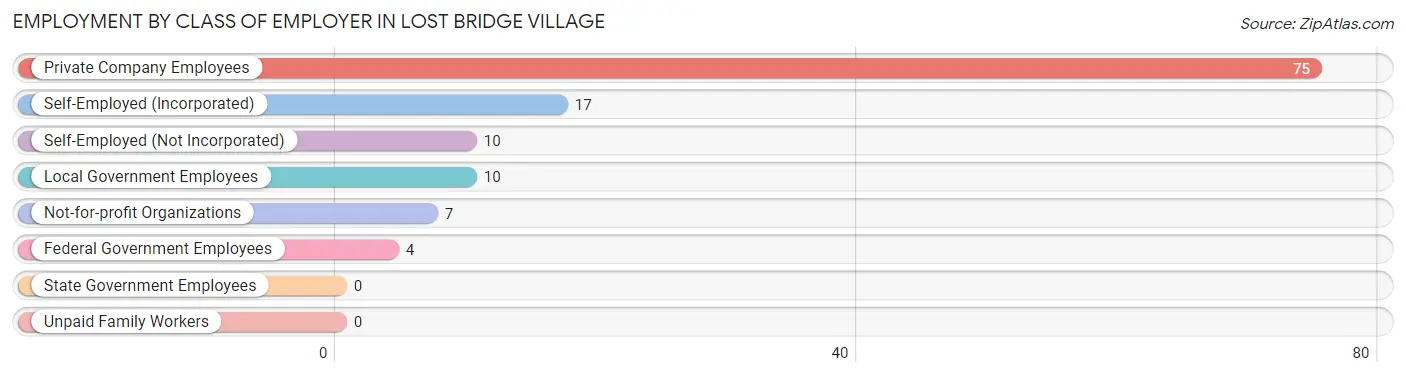
| Employer Class | # Employees | % Employees |
| Private Company Employees | 75 | 61.0% |
| Self-Employed (Incorporated) | 17 | 13.8% |
| Self-Employed (Not Incorporated) | 10 | 8.1% |
| Not-for-profit Organizations | 7 | 5.7% |
| Local Government Employees | 10 | 8.1% |
| State Government Employees | 0 | 0.0% |
| Federal Government Employees | 4 | 3.3% |
| Unpaid Family Workers | 0 | 0.0% |
| Total | 123 | 100.0% |
Employment Status by Age in Lost Bridge Village
According to the labor force statistics for Lost Bridge Village, out of the total population over 16 years of age (287), 44.9% or 129 individuals are in the labor force, with 4.8% or 6 of them unemployed. The age group with the highest labor force participation rate is 20 to 24 years, with 100.0% or 8 individuals in the labor force. Within the labor force, the 35 to 44 years age range has the highest percentage of unemployed individuals, with 33.3% or 6 of them being unemployed.
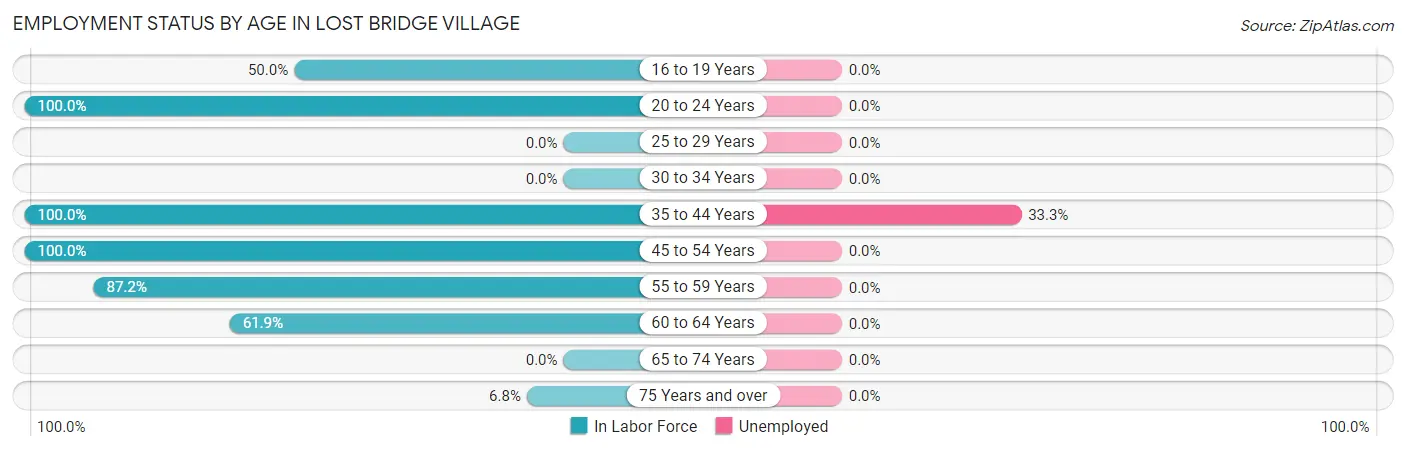
| Age Bracket | In Labor Force | Unemployed |
| 16 to 19 Years | 3 (50.0%) | 0 (0.0%) |
| 20 to 24 Years | 8 (100.0%) | 0 (0.0%) |
| 25 to 29 Years | 0 (0.0%) | 0 (0.0%) |
| 30 to 34 Years | 0 (0.0%) | 0 (0.0%) |
| 35 to 44 Years | 18 (100.0%) | 6 (33.3%) |
| 45 to 54 Years | 28 (100.0%) | 0 (0.0%) |
| 55 to 59 Years | 41 (87.2%) | 0 (0.0%) |
| 60 to 64 Years | 26 (61.9%) | 0 (0.0%) |
| 65 to 74 Years | 0 (0.0%) | 0 (0.0%) |
| 75 Years and over | 5 (6.8%) | 0 (0.0%) |
| Total | 129 (44.9%) | 6 (4.8%) |
Employment Status by Educational Attainment in Lost Bridge Village
According to labor force statistics for Lost Bridge Village, 83.7% of individuals (113) out of the total population between 25 and 64 years of age (135) are in the labor force, with 5.3% or 6 of them being unemployed. The group with the highest labor force participation rate are those with the educational attainment of high school diploma, with 100.0% or 49 individuals in the labor force. Within the labor force, individuals with bachelor's degree or higher education have the highest percentage of unemployment, with 13.6% or 6 of them being unemployed.
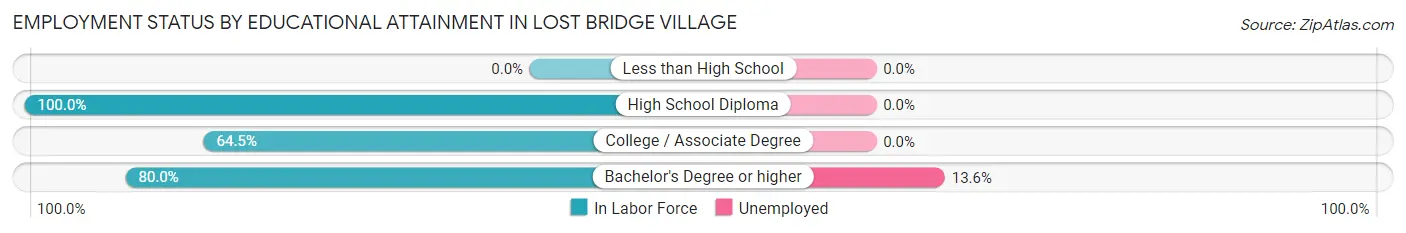
| Educational Attainment | In Labor Force | Unemployed |
| Less than High School | 0 (0.0%) | 0 (0.0%) |
| High School Diploma | 49 (100.0%) | 0 (0.0%) |
| College / Associate Degree | 20 (64.5%) | 0 (0.0%) |
| Bachelor's Degree or higher | 44 (80.0%) | 7 (13.6%) |
| Total | 113 (83.7%) | 7 (5.3%) |
Employment Occupations by Sex in Lost Bridge Village
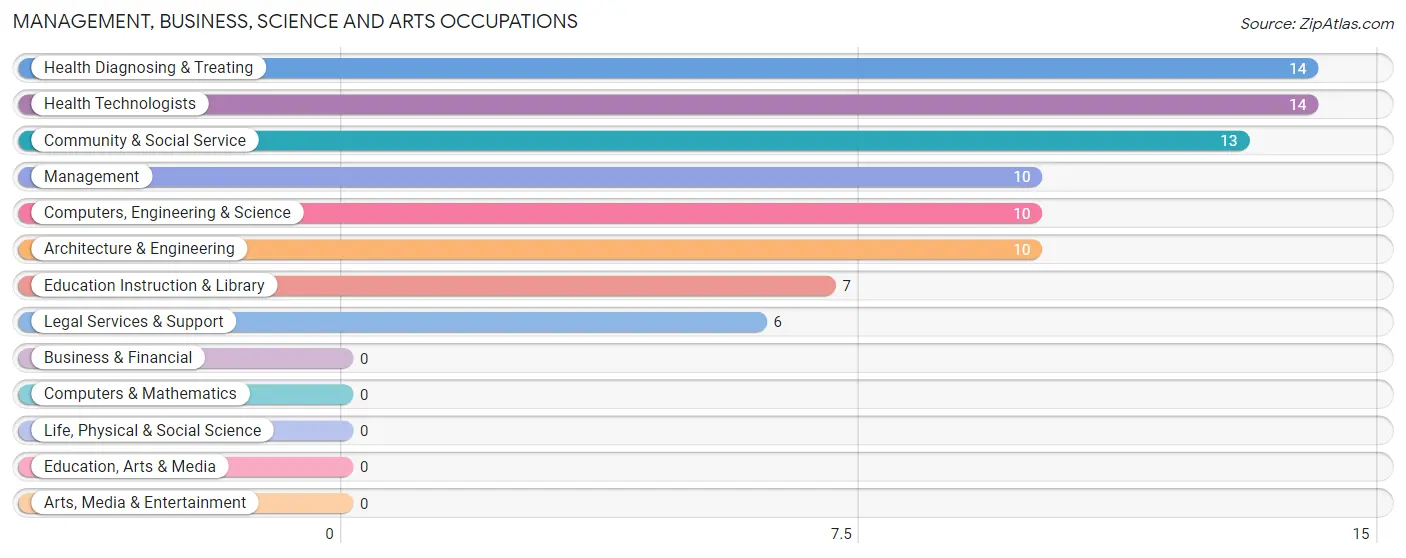
Management, Business, Science and Arts Occupations
The most common Management, Business, Science and Arts occupations in Lost Bridge Village are Health Diagnosing & Treating (14 | 11.8%), Health Technologists (14 | 11.8%), Community & Social Service (13 | 10.9%), Management (10 | 8.4%), and Computers, Engineering & Science (10 | 8.4%).
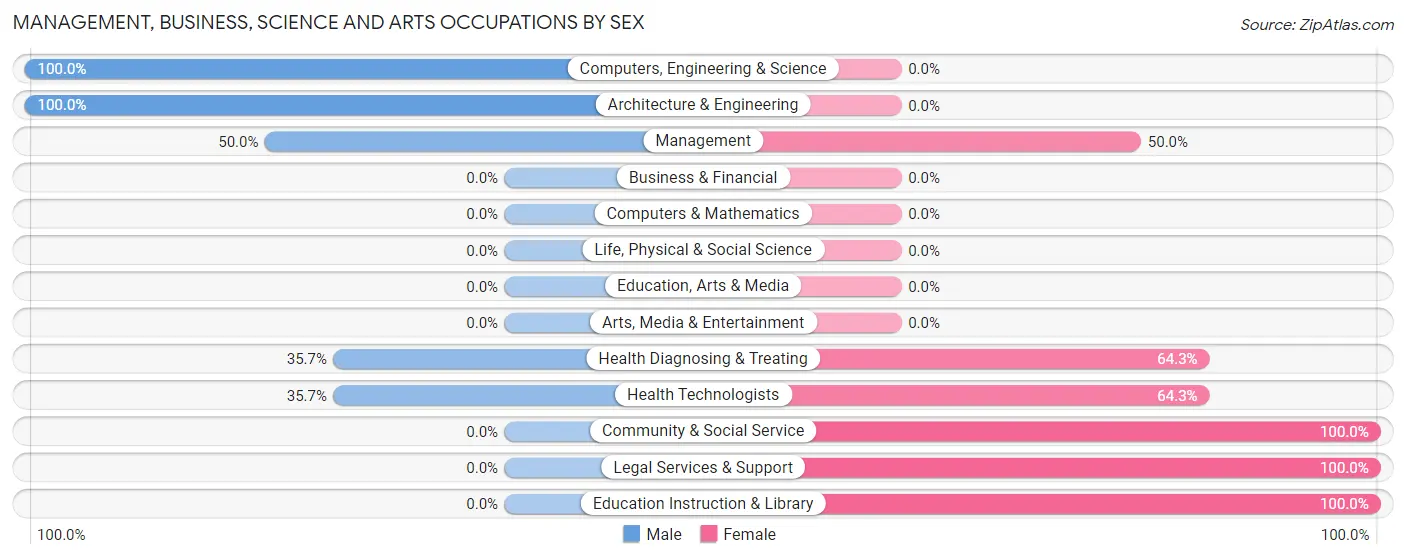
Management, Business, Science and Arts Occupations by Sex
Within the Management, Business, Science and Arts occupations in Lost Bridge Village, the most male-oriented occupations are Computers, Engineering & Science (100.0%), Architecture & Engineering (100.0%), and Management (50.0%), while the most female-oriented occupations are Community & Social Service (100.0%), Legal Services & Support (100.0%), and Education Instruction & Library (100.0%).
| Occupation | Male | Female |
| Management | 5 (50.0%) | 5 (50.0%) |
| Business & Financial | 0 (0.0%) | 0 (0.0%) |
| Computers, Engineering & Science | 10 (100.0%) | 0 (0.0%) |
| Computers & Mathematics | 0 (0.0%) | 0 (0.0%) |
| Architecture & Engineering | 10 (100.0%) | 0 (0.0%) |
| Life, Physical & Social Science | 0 (0.0%) | 0 (0.0%) |
| Community & Social Service | 0 (0.0%) | 13 (100.0%) |
| Education, Arts & Media | 0 (0.0%) | 0 (0.0%) |
| Legal Services & Support | 0 (0.0%) | 6 (100.0%) |
| Education Instruction & Library | 0 (0.0%) | 7 (100.0%) |
| Arts, Media & Entertainment | 0 (0.0%) | 0 (0.0%) |
| Health Diagnosing & Treating | 5 (35.7%) | 9 (64.3%) |
| Health Technologists | 5 (35.7%) | 9 (64.3%) |
| Total (Category) | 20 (42.5%) | 27 (57.5%) |
| Total (Overall) | 72 (60.5%) | 47 (39.5%) |
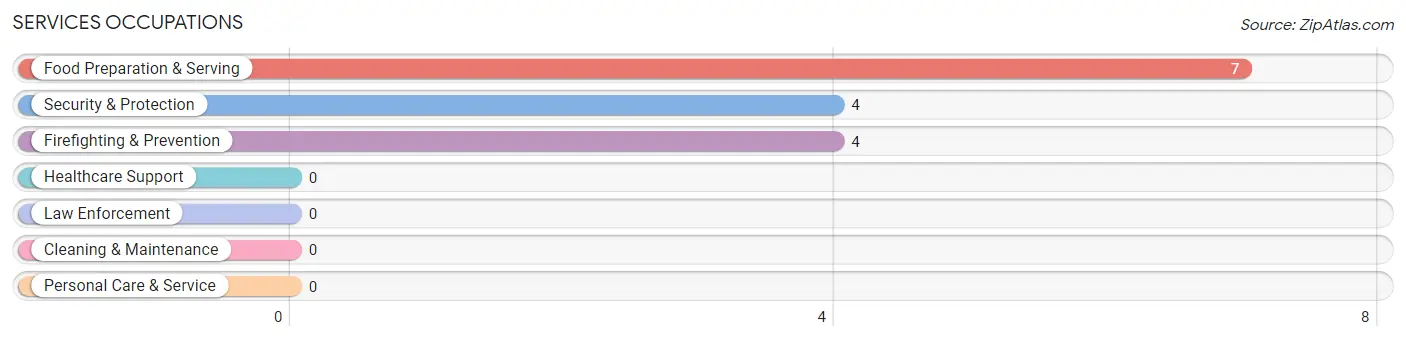
Services Occupations
The most common Services occupations in Lost Bridge Village are Food Preparation & Serving (7 | 5.9%), Security & Protection (4 | 3.4%), and Firefighting & Prevention (4 | 3.4%).
Services Occupations by Sex
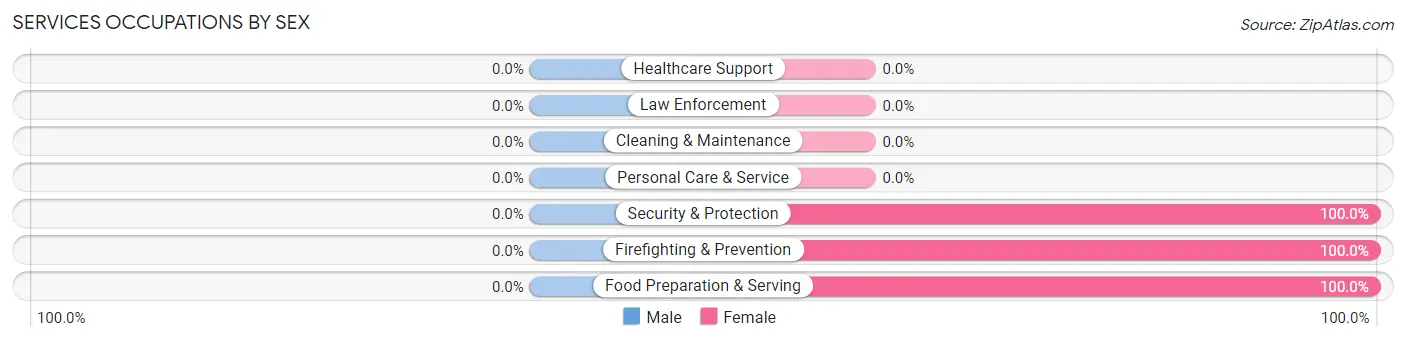
| Occupation | Male | Female |
| Healthcare Support | 0 (0.0%) | 0 (0.0%) |
| Security & Protection | 0 (0.0%) | 4 (100.0%) |
| Firefighting & Prevention | 0 (0.0%) | 4 (100.0%) |
| Law Enforcement | 0 (0.0%) | 0 (0.0%) |
| Food Preparation & Serving | 0 (0.0%) | 7 (100.0%) |
| Cleaning & Maintenance | 0 (0.0%) | 0 (0.0%) |
| Personal Care & Service | 0 (0.0%) | 0 (0.0%) |
| Total (Category) | 0 (0.0%) | 11 (100.0%) |
| Total (Overall) | 72 (60.5%) | 47 (39.5%) |
Sales and Office Occupations
The most common Sales and Office occupations in Lost Bridge Village are Sales & Related (10 | 8.4%), and Office & Administration (4 | 3.4%).

Sales and Office Occupations by Sex

| Occupation | Male | Female |
| Sales & Related | 5 (50.0%) | 5 (50.0%) |
| Office & Administration | 0 (0.0%) | 4 (100.0%) |
| Total (Category) | 5 (35.7%) | 9 (64.3%) |
| Total (Overall) | 72 (60.5%) | 47 (39.5%) |
Natural Resources, Construction and Maintenance Occupations
The most common Natural Resources, Construction and Maintenance occupations in Lost Bridge Village are , and Farming, Fishing & Forestry (5 | 4.2%).

Natural Resources, Construction and Maintenance Occupations by Sex

| Occupation | Male | Female |
| Farming, Fishing & Forestry | 5 (100.0%) | 0 (0.0%) |
| Construction & Extraction | 0 (0.0%) | 0 (0.0%) |
| Installation, Maintenance & Repair | 0 (0.0%) | 0 (0.0%) |
| Total (Category) | 5 (100.0%) | 0 (0.0%) |
| Total (Overall) | 72 (60.5%) | 47 (39.5%) |
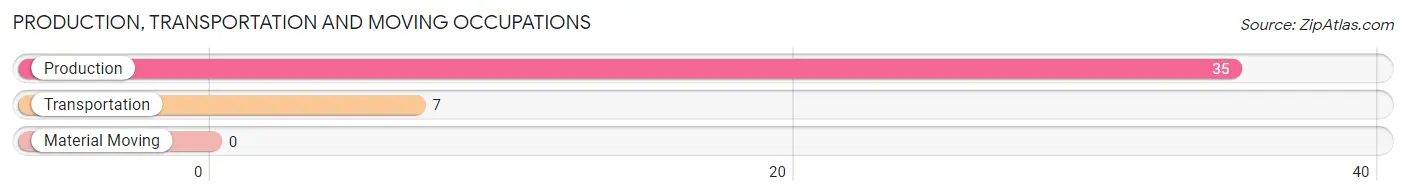
Production, Transportation and Moving Occupations
The most common Production, Transportation and Moving occupations in Lost Bridge Village are Production (35 | 29.4%), and Transportation (7 | 5.9%).
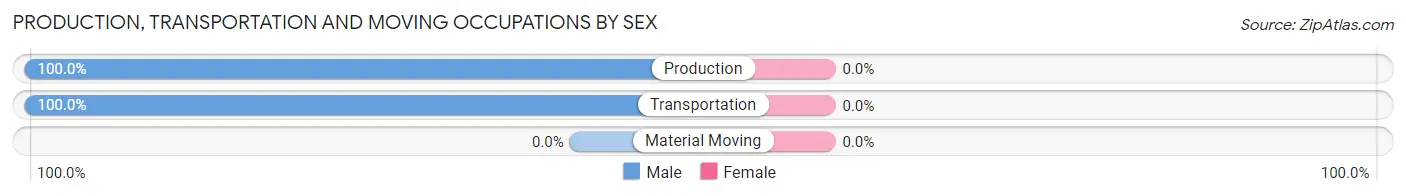
Production, Transportation and Moving Occupations by Sex
| Occupation | Male | Female |
| Production | 35 (100.0%) | 0 (0.0%) |
| Transportation | 7 (100.0%) | 0 (0.0%) |
| Material Moving | 0 (0.0%) | 0 (0.0%) |
| Total (Category) | 42 (100.0%) | 0 (0.0%) |
| Total (Overall) | 72 (60.5%) | 47 (39.5%) |
Employment Industries by Sex in Lost Bridge Village
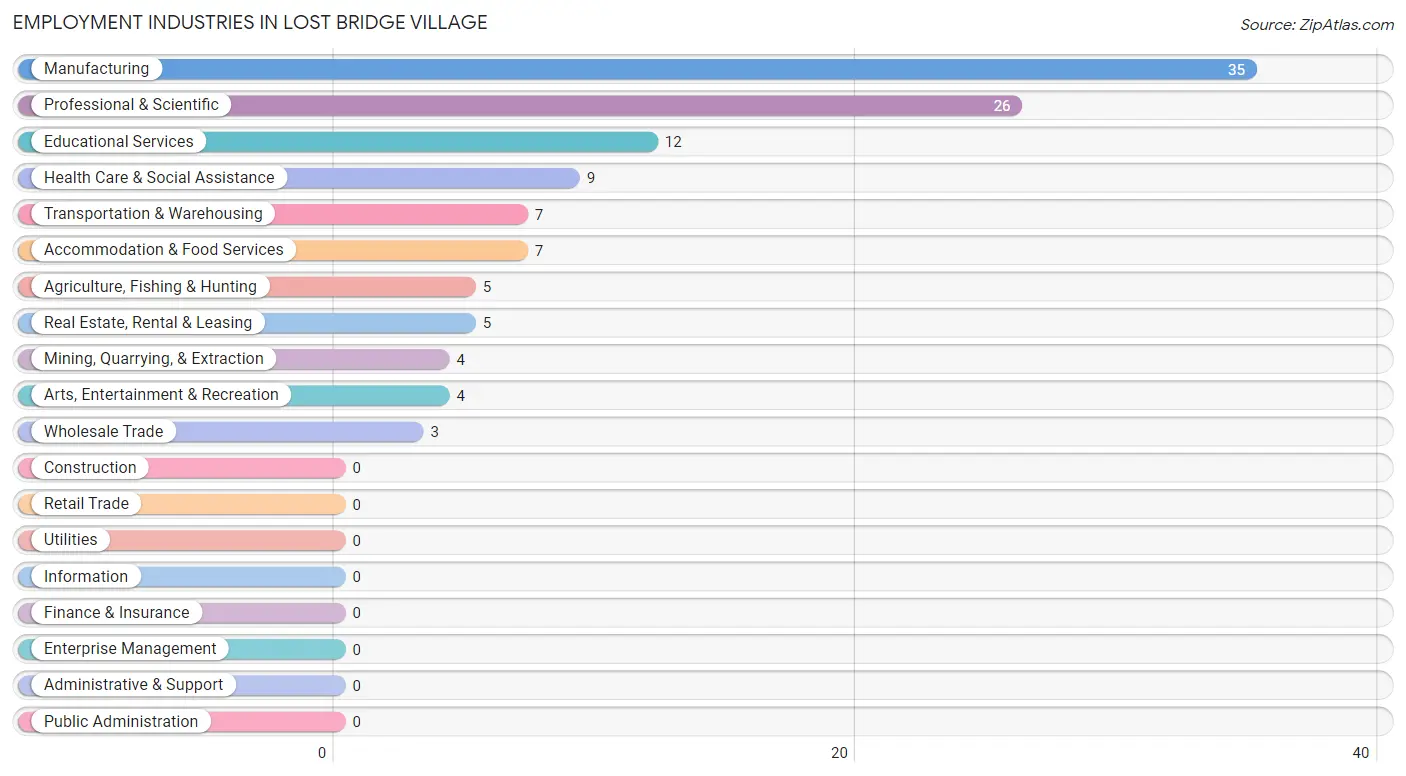
Employment Industries in Lost Bridge Village
The major employment industries in Lost Bridge Village include Manufacturing (35 | 29.4%), Professional & Scientific (26 | 21.8%), Educational Services (12 | 10.1%), Health Care & Social Assistance (9 | 7.6%), and Transportation & Warehousing (7 | 5.9%).
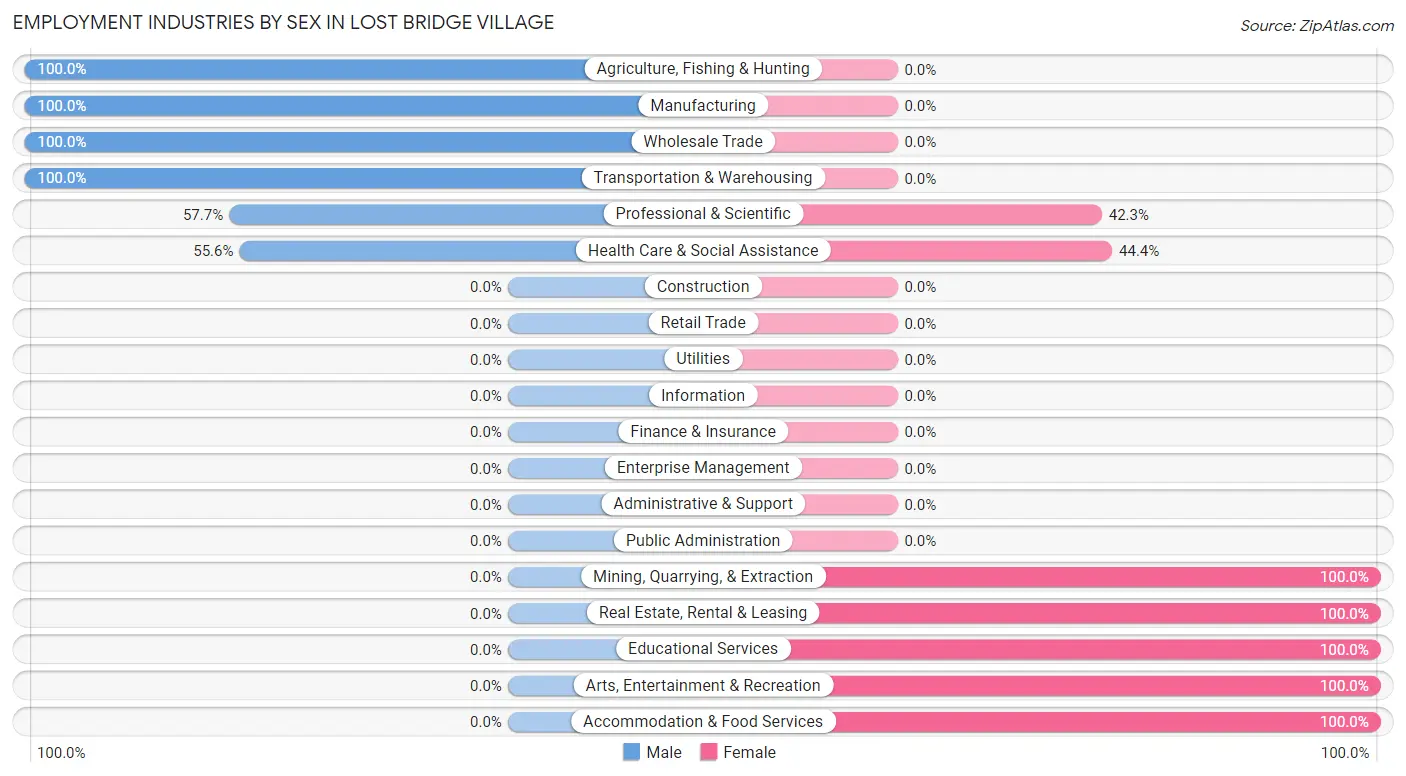
Employment Industries by Sex in Lost Bridge Village
The Lost Bridge Village industries that see more men than women are Agriculture, Fishing & Hunting (100.0%), Manufacturing (100.0%), and Wholesale Trade (100.0%), whereas the industries that tend to have a higher number of women are Mining, Quarrying, & Extraction (100.0%), Real Estate, Rental & Leasing (100.0%), and Educational Services (100.0%).
| Industry | Male | Female |
| Agriculture, Fishing & Hunting | 5 (100.0%) | 0 (0.0%) |
| Mining, Quarrying, & Extraction | 0 (0.0%) | 4 (100.0%) |
| Construction | 0 (0.0%) | 0 (0.0%) |
| Manufacturing | 35 (100.0%) | 0 (0.0%) |
| Wholesale Trade | 3 (100.0%) | 0 (0.0%) |
| Retail Trade | 0 (0.0%) | 0 (0.0%) |
| Transportation & Warehousing | 7 (100.0%) | 0 (0.0%) |
| Utilities | 0 (0.0%) | 0 (0.0%) |
| Information | 0 (0.0%) | 0 (0.0%) |
| Finance & Insurance | 0 (0.0%) | 0 (0.0%) |
| Real Estate, Rental & Leasing | 0 (0.0%) | 5 (100.0%) |
| Professional & Scientific | 15 (57.7%) | 11 (42.3%) |
| Enterprise Management | 0 (0.0%) | 0 (0.0%) |
| Administrative & Support | 0 (0.0%) | 0 (0.0%) |
| Educational Services | 0 (0.0%) | 12 (100.0%) |
| Health Care & Social Assistance | 5 (55.6%) | 4 (44.4%) |
| Arts, Entertainment & Recreation | 0 (0.0%) | 4 (100.0%) |
| Accommodation & Food Services | 0 (0.0%) | 7 (100.0%) |
| Public Administration | 0 (0.0%) | 0 (0.0%) |
| Total | 72 (60.5%) | 47 (39.5%) |
Education in Lost Bridge Village
School Enrollment in Lost Bridge Village
The most common levels of schooling among the 12 students in Lost Bridge Village are college / undergraduate (7 | 58.3%), high school (3 | 25.0%), and middle school (2 | 16.7%).
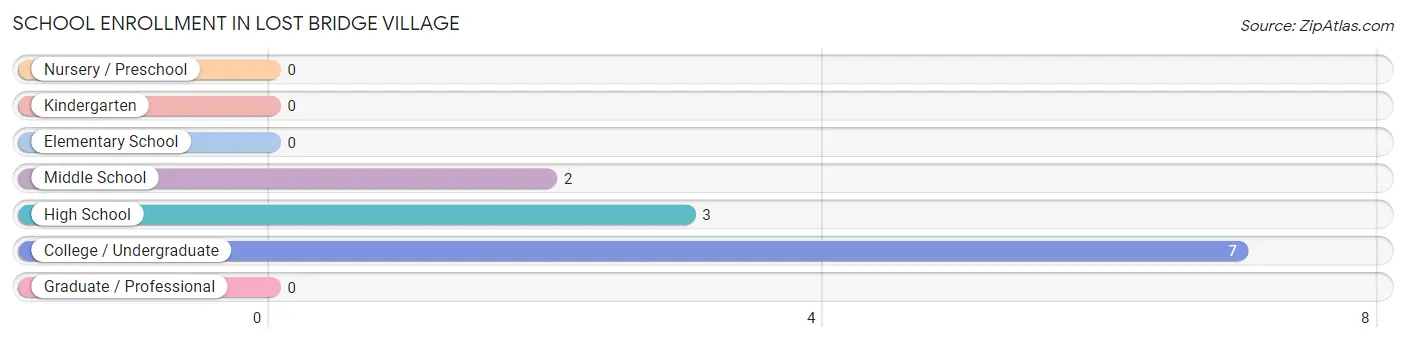
| School Level | # Students | % Students |
| Nursery / Preschool | 0 | 0.0% |
| Kindergarten | 0 | 0.0% |
| Elementary School | 0 | 0.0% |
| Middle School | 2 | 16.7% |
| High School | 3 | 25.0% |
| College / Undergraduate | 7 | 58.3% |
| Graduate / Professional | 0 | 0.0% |
| Total | 12 | 100.0% |
School Enrollment by Age by Funding Source in Lost Bridge Village
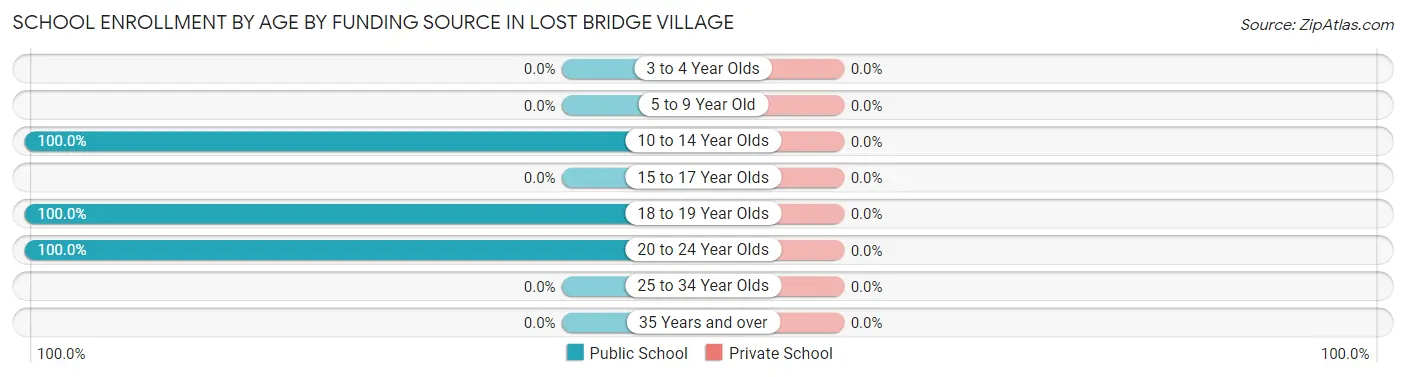
| Age Bracket | Public School | Private School |
| 3 to 4 Year Olds | 0 (0.0%) | 0 (0.0%) |
| 5 to 9 Year Old | 0 (0.0%) | 0 (0.0%) |
| 10 to 14 Year Olds | 2 (100.0%) | 0 (0.0%) |
| 15 to 17 Year Olds | 0 (0.0%) | 0 (0.0%) |
| 18 to 19 Year Olds | 6 (100.0%) | 0 (0.0%) |
| 20 to 24 Year Olds | 4 (100.0%) | 0 (0.0%) |
| 25 to 34 Year Olds | 0 (0.0%) | 0 (0.0%) |
| 35 Years and over | 0 (0.0%) | 0 (0.0%) |
| Total | 12 (100.0%) | 0 (0.0%) |
Educational Attainment by Field of Study in Lost Bridge Village
Business (40 | 32.5%), computers & mathematics (17 | 13.8%), science & technology (16 | 13.0%), social sciences (12 | 9.8%), and communications (11 | 8.9%) are the most common fields of study among 123 individuals in Lost Bridge Village who have obtained a bachelor's degree or higher.
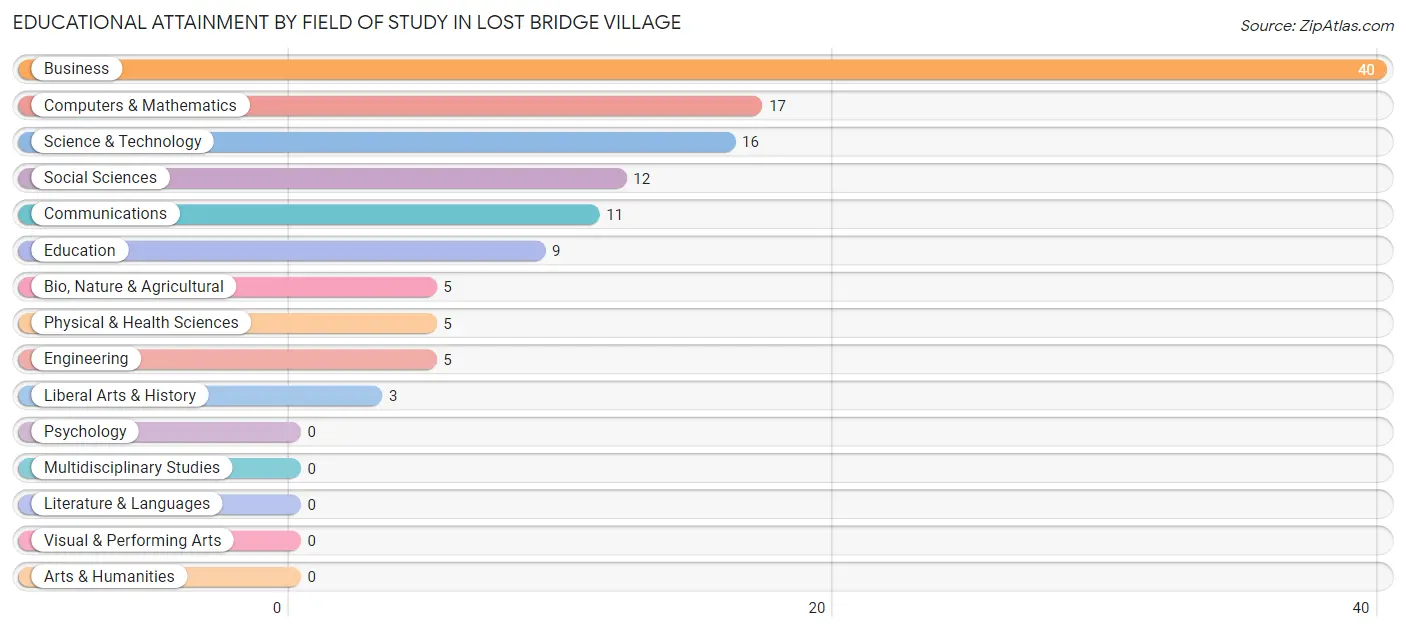
| Field of Study | # Graduates | % Graduates |
| Computers & Mathematics | 17 | 13.8% |
| Bio, Nature & Agricultural | 5 | 4.1% |
| Physical & Health Sciences | 5 | 4.1% |
| Psychology | 0 | 0.0% |
| Social Sciences | 12 | 9.8% |
| Engineering | 5 | 4.1% |
| Multidisciplinary Studies | 0 | 0.0% |
| Science & Technology | 16 | 13.0% |
| Business | 40 | 32.5% |
| Education | 9 | 7.3% |
| Literature & Languages | 0 | 0.0% |
| Liberal Arts & History | 3 | 2.4% |
| Visual & Performing Arts | 0 | 0.0% |
| Communications | 11 | 8.9% |
| Arts & Humanities | 0 | 0.0% |
| Total | 123 | 100.0% |
Transportation & Commute in Lost Bridge Village
Vehicle Availability by Sex in Lost Bridge Village
The most prevalent vehicle ownership categories in Lost Bridge Village are males with 4 vehicles (37, accounting for 48.7%) and females with 4 vehicles (9, making up 78.7%).
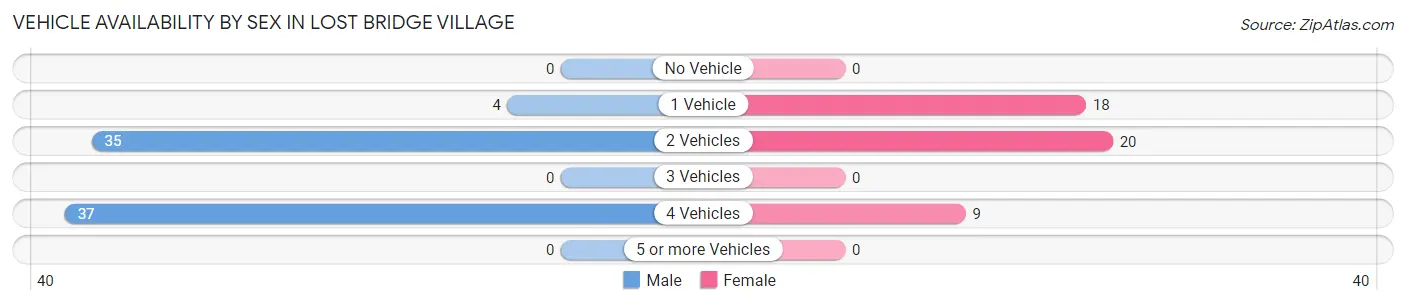
| Vehicles Available | Male | Female |
| No Vehicle | 0 (0.0%) | 0 (0.0%) |
| 1 Vehicle | 4 (5.3%) | 18 (38.3%) |
| 2 Vehicles | 35 (46.1%) | 20 (42.5%) |
| 3 Vehicles | 0 (0.0%) | 0 (0.0%) |
| 4 Vehicles | 37 (48.7%) | 9 (19.2%) |
| 5 or more Vehicles | 0 (0.0%) | 0 (0.0%) |
| Total | 76 (100.0%) | 47 (100.0%) |
Commute Time in Lost Bridge Village
The most frequently occuring commute durations in Lost Bridge Village are 45 to 59 minutes (43 commuters, 35.0%), 25 to 29 minutes (35 commuters, 28.5%), and 10 to 14 minutes (12 commuters, 9.8%).
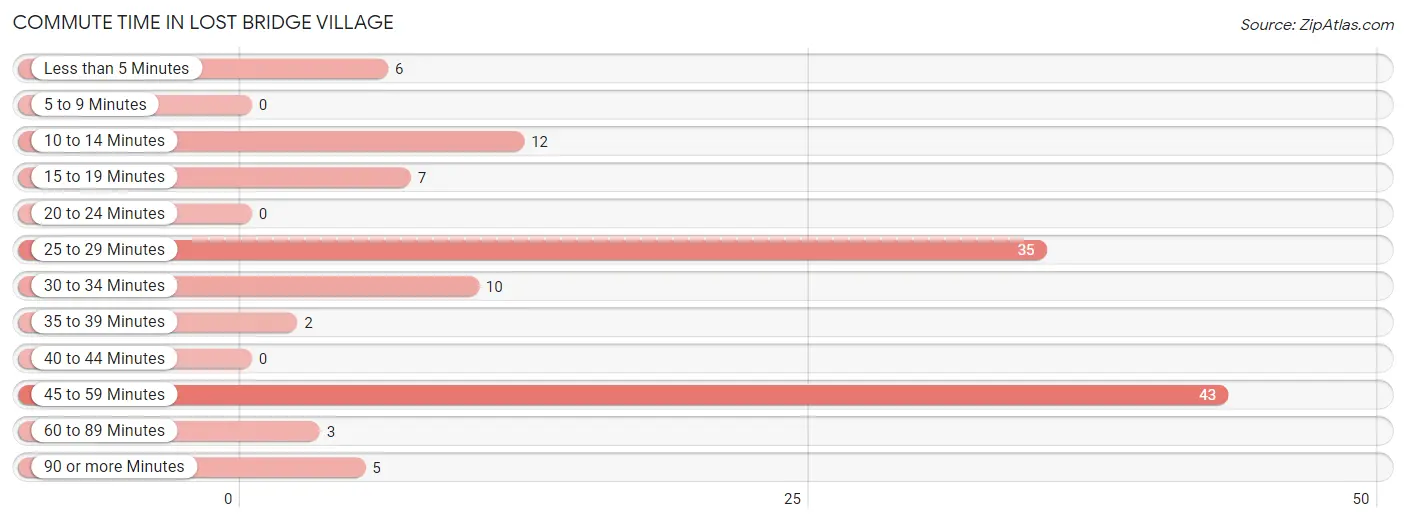
| Commute Time | # Commuters | % Commuters |
| Less than 5 Minutes | 6 | 4.9% |
| 5 to 9 Minutes | 0 | 0.0% |
| 10 to 14 Minutes | 12 | 9.8% |
| 15 to 19 Minutes | 7 | 5.7% |
| 20 to 24 Minutes | 0 | 0.0% |
| 25 to 29 Minutes | 35 | 28.5% |
| 30 to 34 Minutes | 10 | 8.1% |
| 35 to 39 Minutes | 2 | 1.6% |
| 40 to 44 Minutes | 0 | 0.0% |
| 45 to 59 Minutes | 43 | 35.0% |
| 60 to 89 Minutes | 3 | 2.4% |
| 90 or more Minutes | 5 | 4.1% |
Commute Time by Sex in Lost Bridge Village
The most common commute times in Lost Bridge Village are 25 to 29 minutes (35 commuters, 46.1%) for males and 45 to 59 minutes (22 commuters, 46.8%) for females.
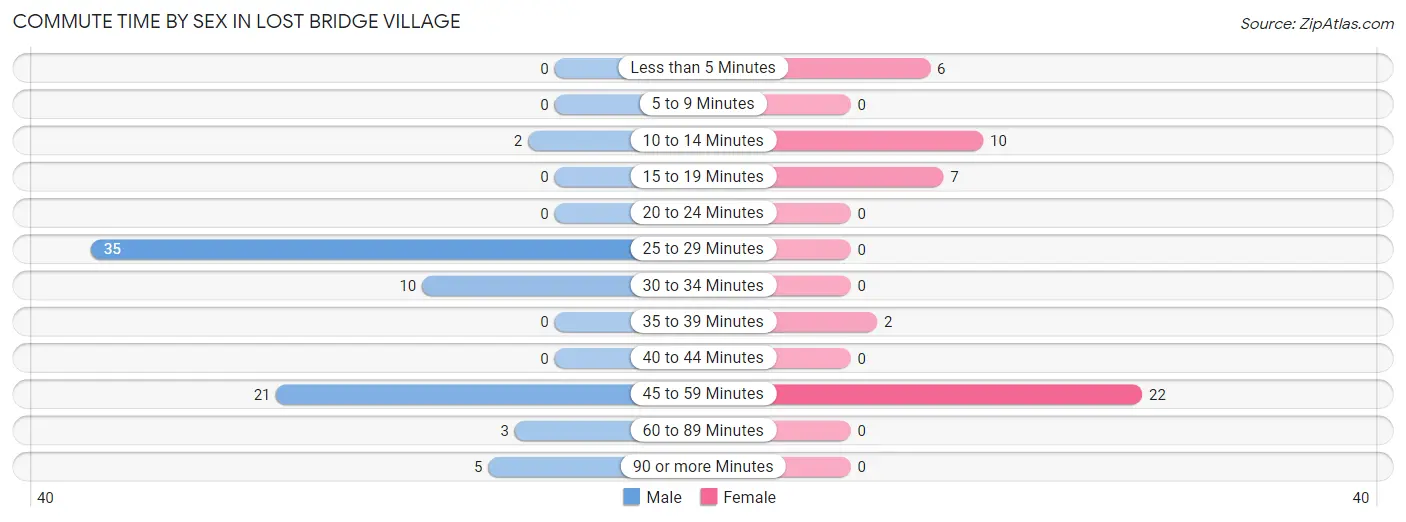
| Commute Time | Male | Female |
| Less than 5 Minutes | 0 (0.0%) | 6 (12.8%) |
| 5 to 9 Minutes | 0 (0.0%) | 0 (0.0%) |
| 10 to 14 Minutes | 2 (2.6%) | 10 (21.3%) |
| 15 to 19 Minutes | 0 (0.0%) | 7 (14.9%) |
| 20 to 24 Minutes | 0 (0.0%) | 0 (0.0%) |
| 25 to 29 Minutes | 35 (46.1%) | 0 (0.0%) |
| 30 to 34 Minutes | 10 (13.2%) | 0 (0.0%) |
| 35 to 39 Minutes | 0 (0.0%) | 2 (4.3%) |
| 40 to 44 Minutes | 0 (0.0%) | 0 (0.0%) |
| 45 to 59 Minutes | 21 (27.6%) | 22 (46.8%) |
| 60 to 89 Minutes | 3 (4.0%) | 0 (0.0%) |
| 90 or more Minutes | 5 (6.6%) | 0 (0.0%) |
Time of Departure to Work by Sex in Lost Bridge Village
The most frequent times of departure to work in Lost Bridge Village are 7:00 AM to 7:29 AM (38, 50.0%) for males and 9:00 AM to 9:59 AM (14, 29.8%) for females.
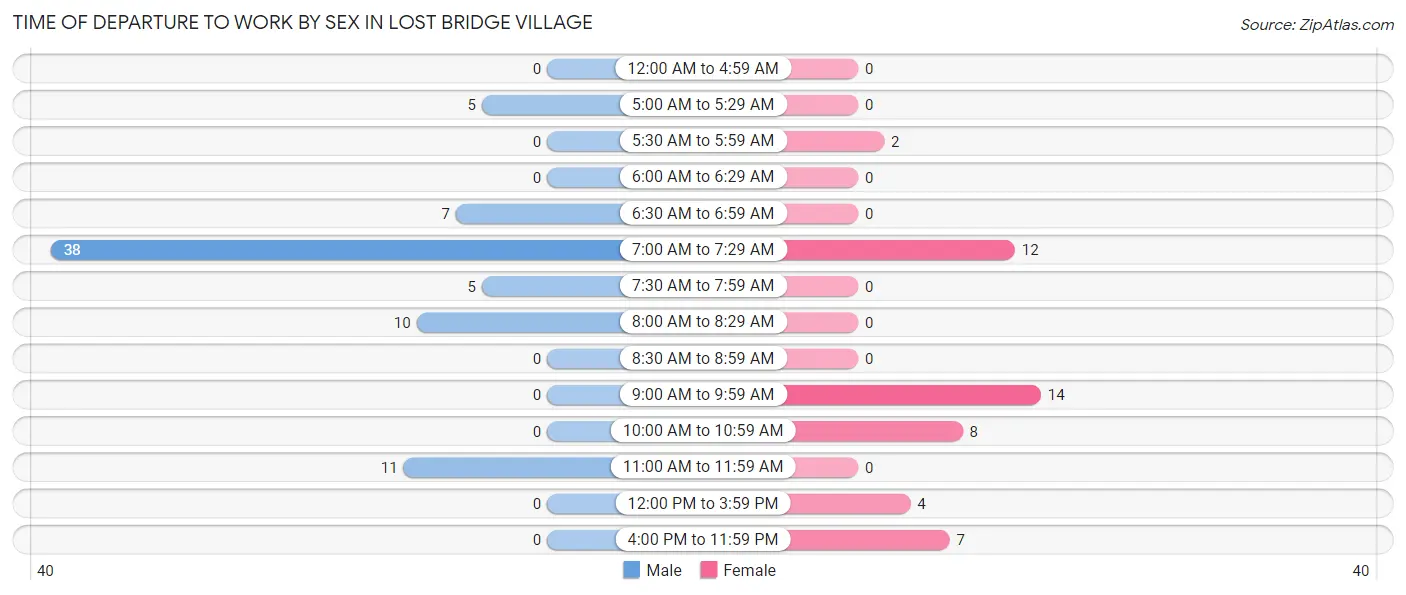
| Time of Departure | Male | Female |
| 12:00 AM to 4:59 AM | 0 (0.0%) | 0 (0.0%) |
| 5:00 AM to 5:29 AM | 5 (6.6%) | 0 (0.0%) |
| 5:30 AM to 5:59 AM | 0 (0.0%) | 2 (4.3%) |
| 6:00 AM to 6:29 AM | 0 (0.0%) | 0 (0.0%) |
| 6:30 AM to 6:59 AM | 7 (9.2%) | 0 (0.0%) |
| 7:00 AM to 7:29 AM | 38 (50.0%) | 12 (25.5%) |
| 7:30 AM to 7:59 AM | 5 (6.6%) | 0 (0.0%) |
| 8:00 AM to 8:29 AM | 10 (13.2%) | 0 (0.0%) |
| 8:30 AM to 8:59 AM | 0 (0.0%) | 0 (0.0%) |
| 9:00 AM to 9:59 AM | 0 (0.0%) | 14 (29.8%) |
| 10:00 AM to 10:59 AM | 0 (0.0%) | 8 (17.0%) |
| 11:00 AM to 11:59 AM | 11 (14.5%) | 0 (0.0%) |
| 12:00 PM to 3:59 PM | 0 (0.0%) | 4 (8.5%) |
| 4:00 PM to 11:59 PM | 0 (0.0%) | 7 (14.9%) |
| Total | 76 (100.0%) | 47 (100.0%) |
Housing Occupancy in Lost Bridge Village
Occupancy by Ownership in Lost Bridge Village
Of the total 189 dwellings in Lost Bridge Village, owner-occupied units account for 179 (94.7%), while renter-occupied units make up 10 (5.3%).
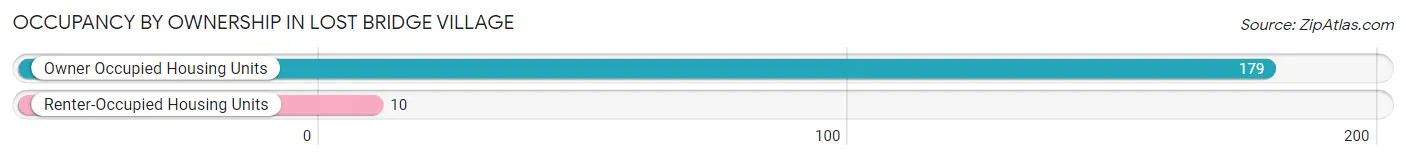
| Occupancy | # Housing Units | % Housing Units |
| Owner Occupied Housing Units | 179 | 94.7% |
| Renter-Occupied Housing Units | 10 | 5.3% |
| Total Occupied Housing Units | 189 | 100.0% |
Occupancy by Household Size in Lost Bridge Village
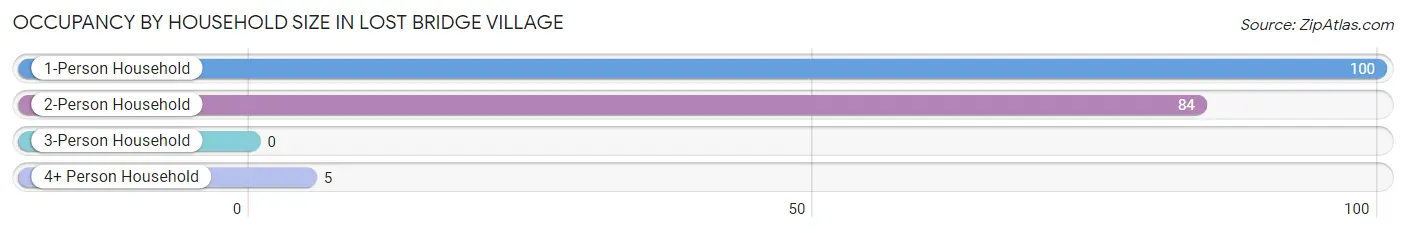
| Household Size | # Housing Units | % Housing Units |
| 1-Person Household | 100 | 52.9% |
| 2-Person Household | 84 | 44.4% |
| 3-Person Household | 0 | 0.0% |
| 4+ Person Household | 5 | 2.6% |
| Total Housing Units | 189 | 100.0% |
Occupancy by Ownership by Household Size in Lost Bridge Village
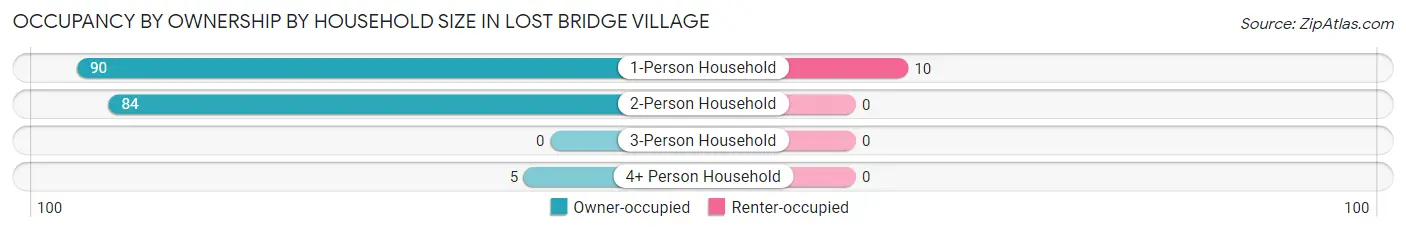
| Household Size | Owner-occupied | Renter-occupied |
| 1-Person Household | 90 (90.0%) | 10 (10.0%) |
| 2-Person Household | 84 (100.0%) | 0 (0.0%) |
| 3-Person Household | 0 (0.0%) | 0 (0.0%) |
| 4+ Person Household | 5 (100.0%) | 0 (0.0%) |
| Total Housing Units | 179 (94.7%) | 10 (5.3%) |
Occupancy by Educational Attainment in Lost Bridge Village
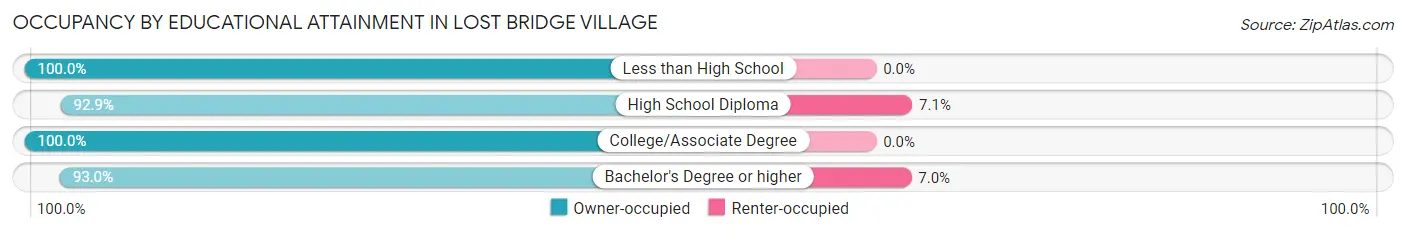
| Household Size | Owner-occupied | Renter-occupied |
| Less than High School | 15 (100.0%) | 0 (0.0%) |
| High School Diploma | 52 (92.9%) | 4 (7.1%) |
| College/Associate Degree | 32 (100.0%) | 0 (0.0%) |
| Bachelor's Degree or higher | 80 (93.0%) | 6 (7.0%) |
Occupancy by Age of Householder in Lost Bridge Village
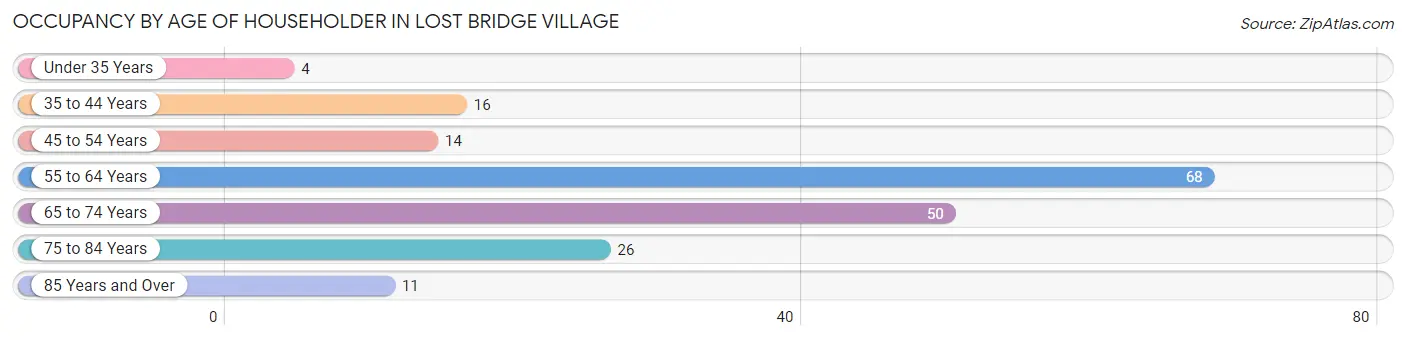
| Age Bracket | # Households | % Households |
| Under 35 Years | 4 | 2.1% |
| 35 to 44 Years | 16 | 8.5% |
| 45 to 54 Years | 14 | 7.4% |
| 55 to 64 Years | 68 | 36.0% |
| 65 to 74 Years | 50 | 26.5% |
| 75 to 84 Years | 26 | 13.8% |
| 85 Years and Over | 11 | 5.8% |
| Total | 189 | 100.0% |
Housing Finances in Lost Bridge Village
Median Income by Occupancy in Lost Bridge Village
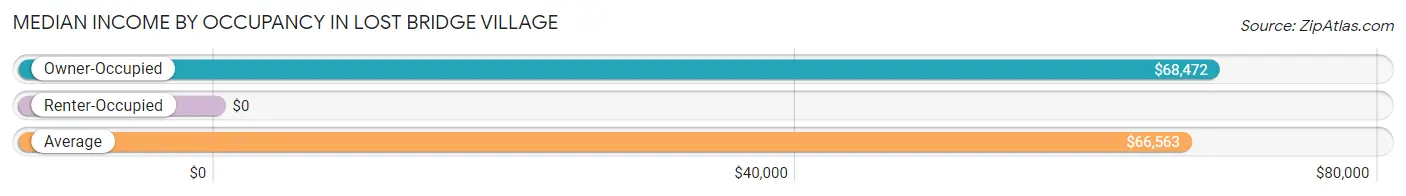
| Occupancy Type | # Households | Median Income |
| Owner-Occupied | 179 (94.7%) | $68,472 |
| Renter-Occupied | 10 (5.3%) | $0 |
| Average | 189 (100.0%) | $66,563 |
Occupancy by Householder Income Bracket in Lost Bridge Village
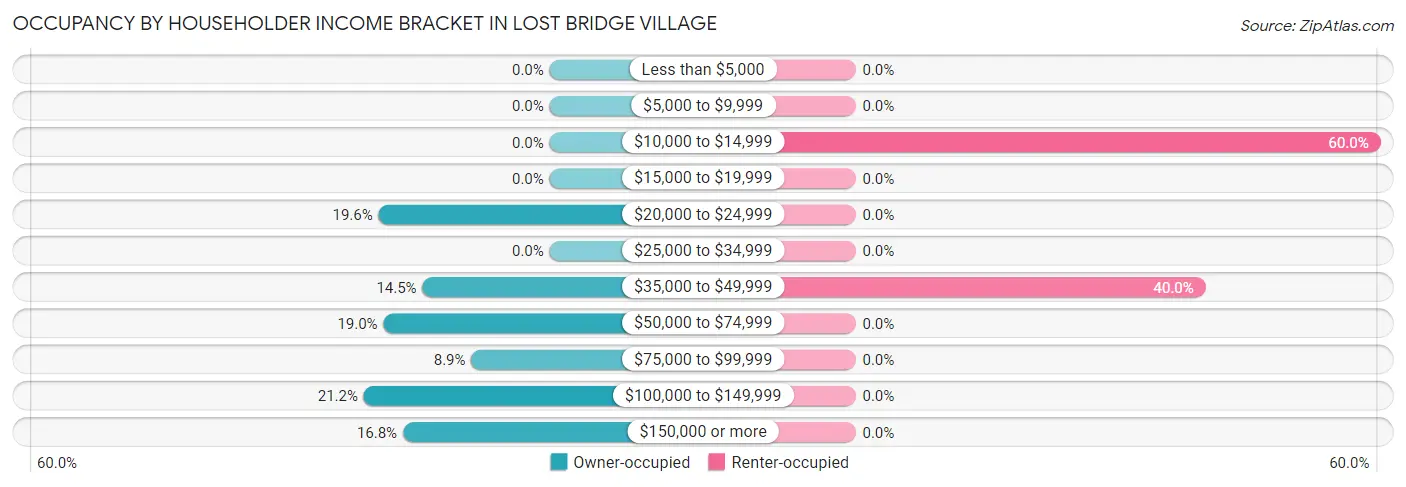
| Income Bracket | Owner-occupied | Renter-occupied |
| Less than $5,000 | 0 (0.0%) | 0 (0.0%) |
| $5,000 to $9,999 | 0 (0.0%) | 0 (0.0%) |
| $10,000 to $14,999 | 0 (0.0%) | 6 (60.0%) |
| $15,000 to $19,999 | 0 (0.0%) | 0 (0.0%) |
| $20,000 to $24,999 | 35 (19.6%) | 0 (0.0%) |
| $25,000 to $34,999 | 0 (0.0%) | 0 (0.0%) |
| $35,000 to $49,999 | 26 (14.5%) | 4 (40.0%) |
| $50,000 to $74,999 | 34 (19.0%) | 0 (0.0%) |
| $75,000 to $99,999 | 16 (8.9%) | 0 (0.0%) |
| $100,000 to $149,999 | 38 (21.2%) | 0 (0.0%) |
| $150,000 or more | 30 (16.8%) | 0 (0.0%) |
| Total | 179 (100.0%) | 10 (100.0%) |
Monthly Housing Cost Tiers in Lost Bridge Village
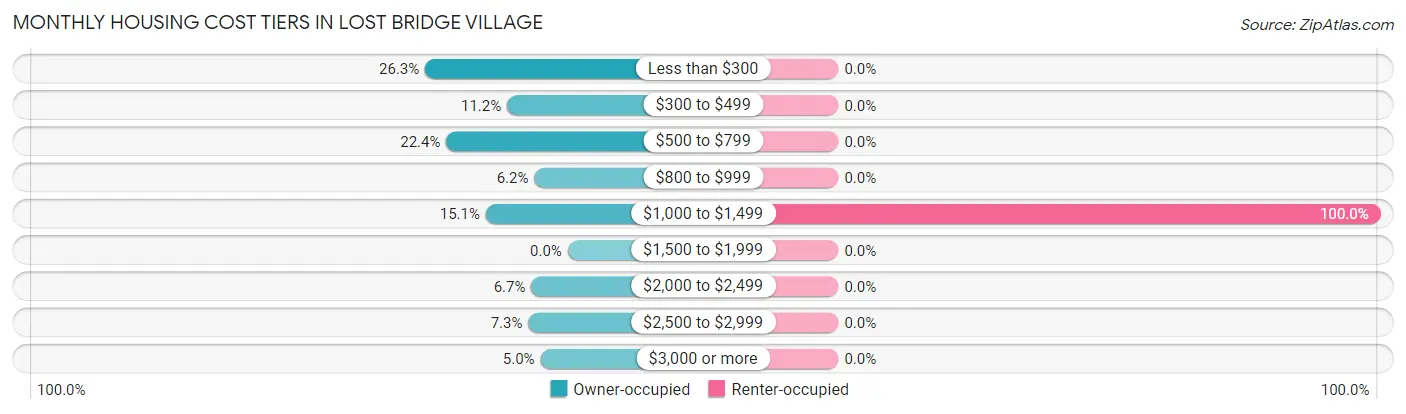
| Monthly Cost | Owner-occupied | Renter-occupied |
| Less than $300 | 47 (26.3%) | 0 (0.0%) |
| $300 to $499 | 20 (11.2%) | 0 (0.0%) |
| $500 to $799 | 40 (22.4%) | 0 (0.0%) |
| $800 to $999 | 11 (6.1%) | 0 (0.0%) |
| $1,000 to $1,499 | 27 (15.1%) | 10 (100.0%) |
| $1,500 to $1,999 | 0 (0.0%) | 0 (0.0%) |
| $2,000 to $2,499 | 12 (6.7%) | 0 (0.0%) |
| $2,500 to $2,999 | 13 (7.3%) | 0 (0.0%) |
| $3,000 or more | 9 (5.0%) | 0 (0.0%) |
| Total | 179 (100.0%) | 10 (100.0%) |
Physical Housing Characteristics in Lost Bridge Village
Housing Structures in Lost Bridge Village
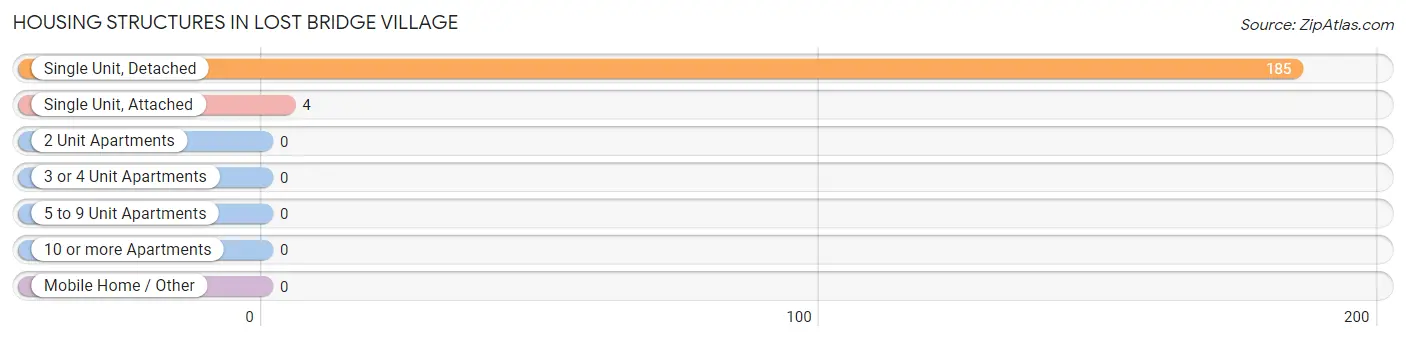
| Structure Type | # Housing Units | % Housing Units |
| Single Unit, Detached | 185 | 97.9% |
| Single Unit, Attached | 4 | 2.1% |
| 2 Unit Apartments | 0 | 0.0% |
| 3 or 4 Unit Apartments | 0 | 0.0% |
| 5 to 9 Unit Apartments | 0 | 0.0% |
| 10 or more Apartments | 0 | 0.0% |
| Mobile Home / Other | 0 | 0.0% |
| Total | 189 | 100.0% |
Housing Structures by Occupancy in Lost Bridge Village
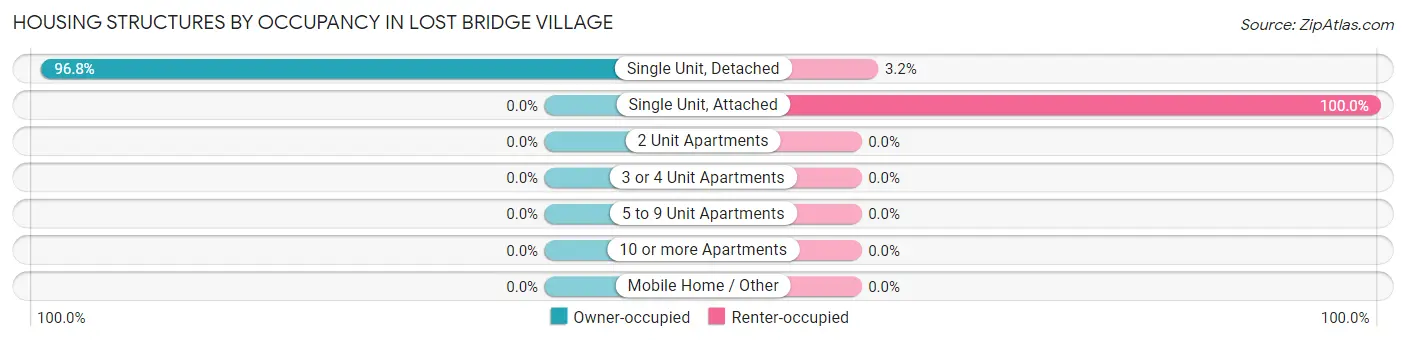
| Structure Type | Owner-occupied | Renter-occupied |
| Single Unit, Detached | 179 (96.8%) | 6 (3.2%) |
| Single Unit, Attached | 0 (0.0%) | 4 (100.0%) |
| 2 Unit Apartments | 0 (0.0%) | 0 (0.0%) |
| 3 or 4 Unit Apartments | 0 (0.0%) | 0 (0.0%) |
| 5 to 9 Unit Apartments | 0 (0.0%) | 0 (0.0%) |
| 10 or more Apartments | 0 (0.0%) | 0 (0.0%) |
| Mobile Home / Other | 0 (0.0%) | 0 (0.0%) |
| Total | 179 (94.7%) | 10 (5.3%) |
Housing Structures by Number of Rooms in Lost Bridge Village
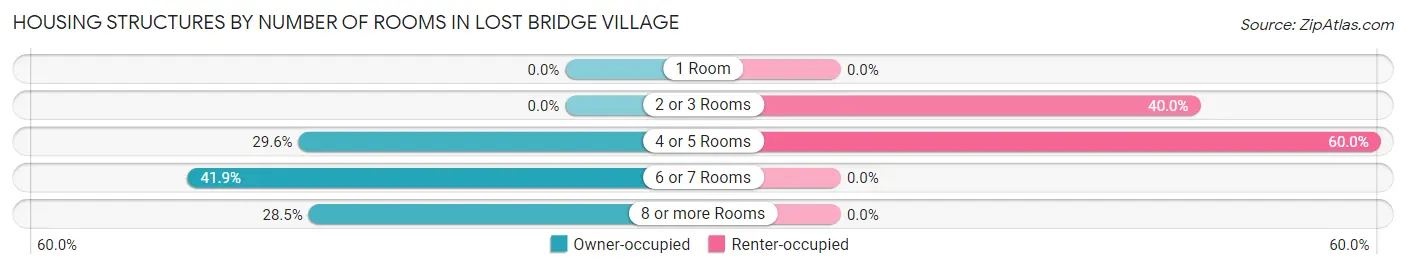
| Number of Rooms | Owner-occupied | Renter-occupied |
| 1 Room | 0 (0.0%) | 0 (0.0%) |
| 2 or 3 Rooms | 0 (0.0%) | 4 (40.0%) |
| 4 or 5 Rooms | 53 (29.6%) | 6 (60.0%) |
| 6 or 7 Rooms | 75 (41.9%) | 0 (0.0%) |
| 8 or more Rooms | 51 (28.5%) | 0 (0.0%) |
| Total | 179 (100.0%) | 10 (100.0%) |
Housing Structure by Heating Type in Lost Bridge Village
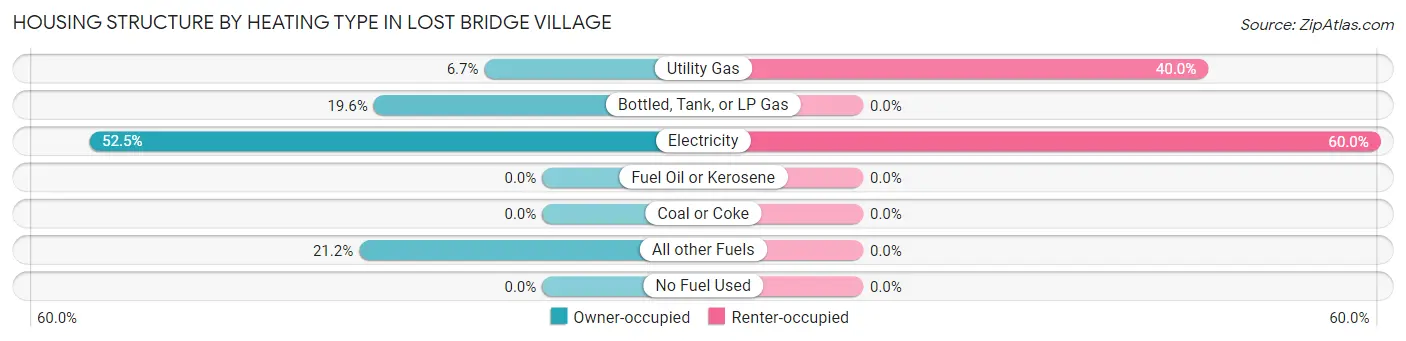
| Heating Type | Owner-occupied | Renter-occupied |
| Utility Gas | 12 (6.7%) | 4 (40.0%) |
| Bottled, Tank, or LP Gas | 35 (19.6%) | 0 (0.0%) |
| Electricity | 94 (52.5%) | 6 (60.0%) |
| Fuel Oil or Kerosene | 0 (0.0%) | 0 (0.0%) |
| Coal or Coke | 0 (0.0%) | 0 (0.0%) |
| All other Fuels | 38 (21.2%) | 0 (0.0%) |
| No Fuel Used | 0 (0.0%) | 0 (0.0%) |
| Total | 179 (100.0%) | 10 (100.0%) |
Household Vehicle Usage in Lost Bridge Village
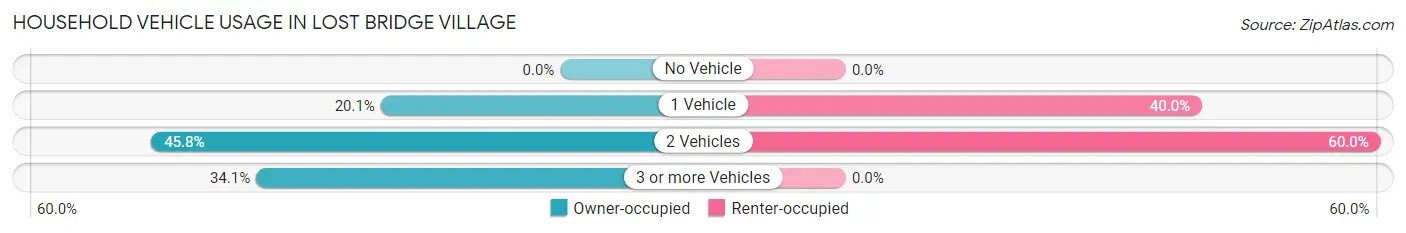
| Vehicles per Household | Owner-occupied | Renter-occupied |
| No Vehicle | 0 (0.0%) | 0 (0.0%) |
| 1 Vehicle | 36 (20.1%) | 4 (40.0%) |
| 2 Vehicles | 82 (45.8%) | 6 (60.0%) |
| 3 or more Vehicles | 61 (34.1%) | 0 (0.0%) |
| Total | 179 (100.0%) | 10 (100.0%) |
Real Estate & Mortgages in Lost Bridge Village
Real Estate and Mortgage Overview in Lost Bridge Village
| Characteristic | Without Mortgage | With Mortgage |
| Housing Units | 119 | 60 |
| Median Property Value | $268,300 | $275,000 |
| Median Household Income | $53,295 | $30 |
| Monthly Housing Costs | $442 | $9 |
| Real Estate Taxes | - | - |
Property Value by Mortgage Status in Lost Bridge Village
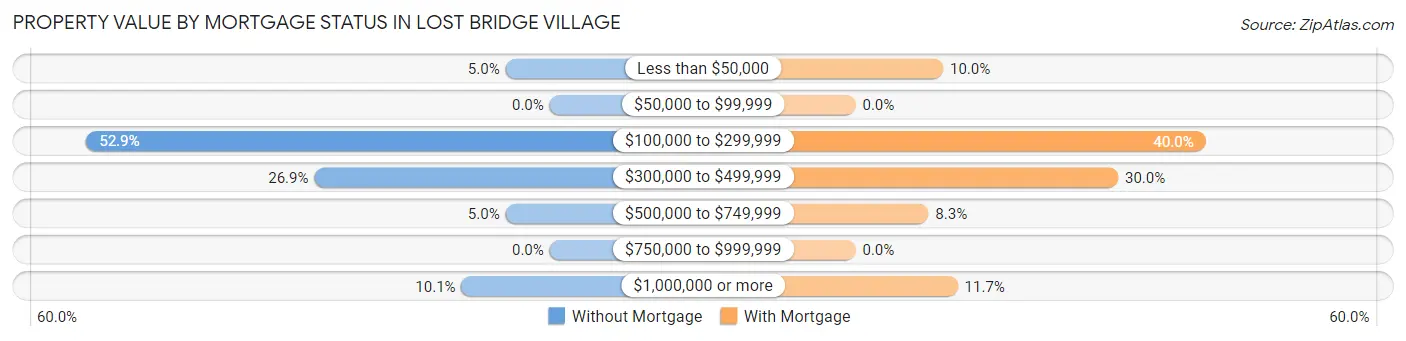
| Property Value | Without Mortgage | With Mortgage |
| Less than $50,000 | 6 (5.0%) | 6 (10.0%) |
| $50,000 to $99,999 | 0 (0.0%) | 0 (0.0%) |
| $100,000 to $299,999 | 63 (52.9%) | 24 (40.0%) |
| $300,000 to $499,999 | 32 (26.9%) | 18 (30.0%) |
| $500,000 to $749,999 | 6 (5.0%) | 5 (8.3%) |
| $750,000 to $999,999 | 0 (0.0%) | 0 (0.0%) |
| $1,000,000 or more | 12 (10.1%) | 7 (11.7%) |
| Total | 119 (100.0%) | 60 (100.0%) |
Household Income by Mortgage Status in Lost Bridge Village
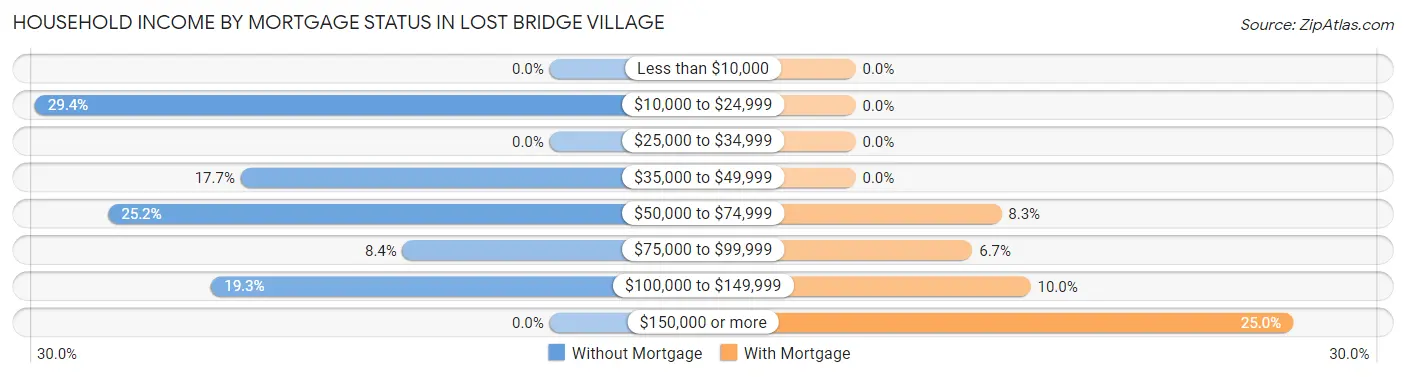
| Household Income | Without Mortgage | With Mortgage |
| Less than $10,000 | 0 (0.0%) | 0 (0.0%) |
| $10,000 to $24,999 | 35 (29.4%) | 0 (0.0%) |
| $25,000 to $34,999 | 0 (0.0%) | 0 (0.0%) |
| $35,000 to $49,999 | 21 (17.6%) | 0 (0.0%) |
| $50,000 to $74,999 | 30 (25.2%) | 5 (8.3%) |
| $75,000 to $99,999 | 10 (8.4%) | 4 (6.7%) |
| $100,000 to $149,999 | 23 (19.3%) | 6 (10.0%) |
| $150,000 or more | 0 (0.0%) | 15 (25.0%) |
| Total | 119 (100.0%) | 60 (100.0%) |
Property Value to Household Income Ratio in Lost Bridge Village
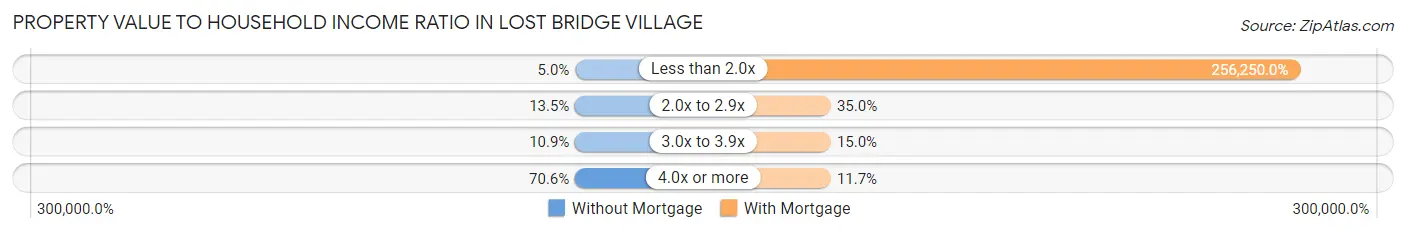
| Value-to-Income Ratio | Without Mortgage | With Mortgage |
| Less than 2.0x | 6 (5.0%) | 153,750 (256,250.0%) |
| 2.0x to 2.9x | 16 (13.5%) | 21 (35.0%) |
| 3.0x to 3.9x | 13 (10.9%) | 9 (15.0%) |
| 4.0x or more | 84 (70.6%) | 7 (11.7%) |
| Total | 119 (100.0%) | 60 (100.0%) |
Real Estate Taxes by Mortgage Status in Lost Bridge Village
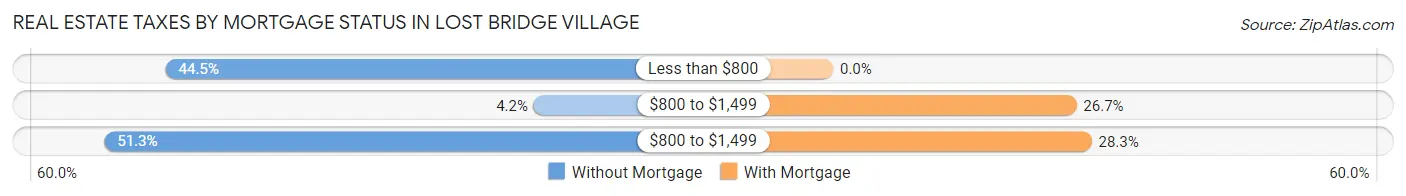
| Property Taxes | Without Mortgage | With Mortgage |
| Less than $800 | 53 (44.5%) | 0 (0.0%) |
| $800 to $1,499 | 5 (4.2%) | 16 (26.7%) |
| $800 to $1,499 | 61 (51.3%) | 17 (28.3%) |
| Total | 119 (100.0%) | 60 (100.0%) |
Health & Disability in Lost Bridge Village
Health Insurance Coverage by Age in Lost Bridge Village
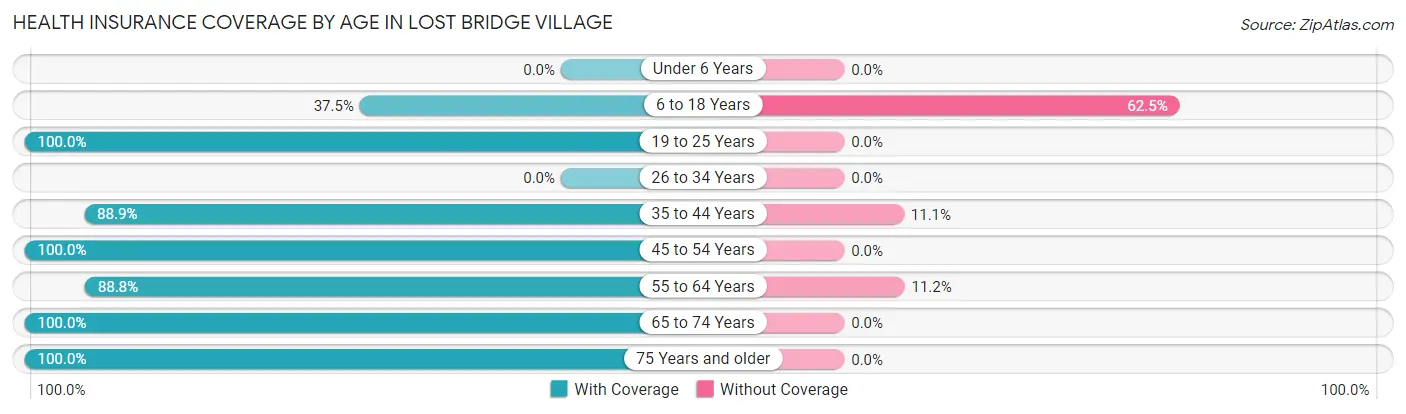
| Age Bracket | With Coverage | Without Coverage |
| Under 6 Years | 0 (0.0%) | 0 (0.0%) |
| 6 to 18 Years | 3 (37.5%) | 5 (62.5%) |
| 19 to 25 Years | 4 (100.0%) | 0 (0.0%) |
| 26 to 34 Years | 0 (0.0%) | 0 (0.0%) |
| 35 to 44 Years | 16 (88.9%) | 2 (11.1%) |
| 45 to 54 Years | 28 (100.0%) | 0 (0.0%) |
| 55 to 64 Years | 79 (88.8%) | 10 (11.2%) |
| 65 to 74 Years | 65 (100.0%) | 0 (0.0%) |
| 75 Years and older | 73 (100.0%) | 0 (0.0%) |
| Total | 268 (94.0%) | 17 (6.0%) |
Health Insurance Coverage by Citizenship Status in Lost Bridge Village

| Citizenship Status | With Coverage | Without Coverage |
| Native Born | 0 (0.0%) | 0 (0.0%) |
| Foreign Born, Citizen | 3 (37.5%) | 5 (62.5%) |
| Foreign Born, not a Citizen | 4 (100.0%) | 0 (0.0%) |
Health Insurance Coverage by Household Income in Lost Bridge Village
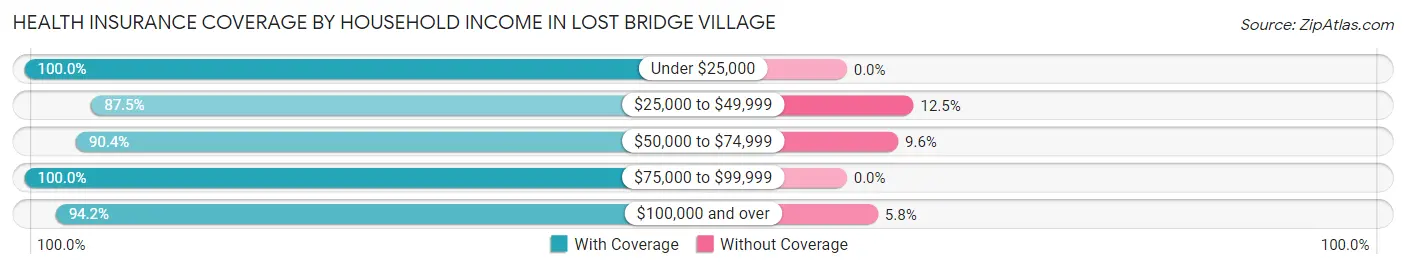
| Household Income | With Coverage | Without Coverage |
| Under $25,000 | 41 (100.0%) | 0 (0.0%) |
| $25,000 to $49,999 | 35 (87.5%) | 5 (12.5%) |
| $50,000 to $74,999 | 47 (90.4%) | 5 (9.6%) |
| $75,000 to $99,999 | 32 (100.0%) | 0 (0.0%) |
| $100,000 and over | 113 (94.2%) | 7 (5.8%) |
Public vs Private Health Insurance Coverage by Age in Lost Bridge Village
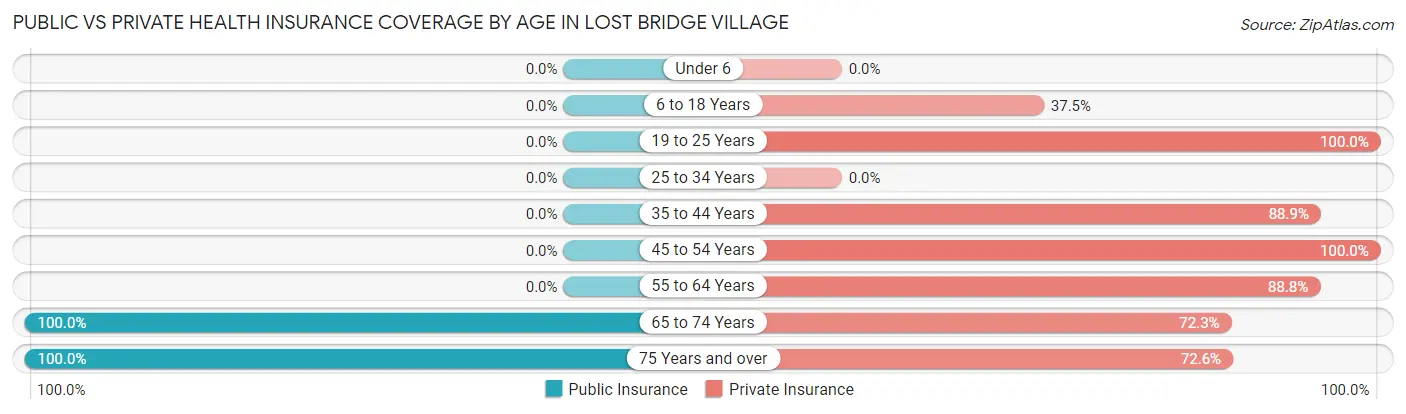
| Age Bracket | Public Insurance | Private Insurance |
| Under 6 | 0 (0.0%) | 0 (0.0%) |
| 6 to 18 Years | 0 (0.0%) | 3 (37.5%) |
| 19 to 25 Years | 0 (0.0%) | 4 (100.0%) |
| 25 to 34 Years | 0 (0.0%) | 0 (0.0%) |
| 35 to 44 Years | 0 (0.0%) | 16 (88.9%) |
| 45 to 54 Years | 0 (0.0%) | 28 (100.0%) |
| 55 to 64 Years | 0 (0.0%) | 79 (88.8%) |
| 65 to 74 Years | 65 (100.0%) | 47 (72.3%) |
| 75 Years and over | 73 (100.0%) | 53 (72.6%) |
| Total | 138 (48.4%) | 230 (80.7%) |
Disability Status by Sex by Age in Lost Bridge Village
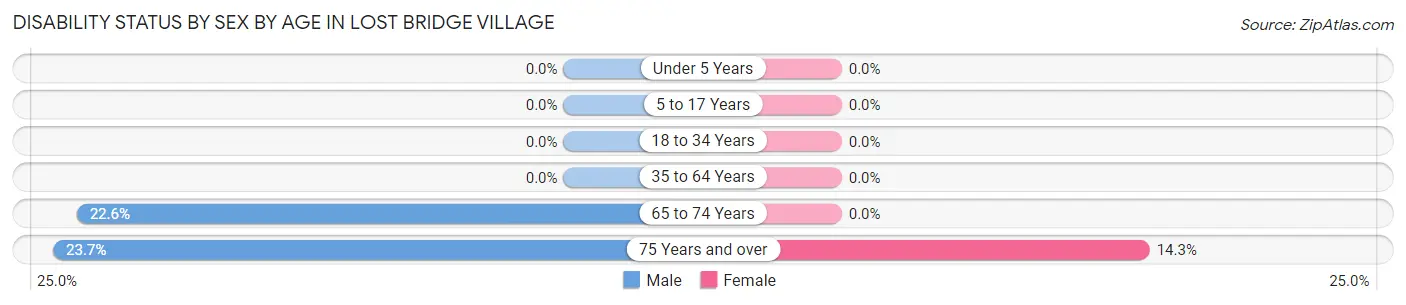
| Age Bracket | Male | Female |
| Under 5 Years | 0 (0.0%) | 0 (0.0%) |
| 5 to 17 Years | 0 (0.0%) | 0 (0.0%) |
| 18 to 34 Years | 0 (0.0%) | 0 (0.0%) |
| 35 to 64 Years | 0 (0.0%) | 0 (0.0%) |
| 65 to 74 Years | 7 (22.6%) | 0 (0.0%) |
| 75 Years and over | 9 (23.7%) | 5 (14.3%) |
Disability Class by Sex by Age in Lost Bridge Village
Disability Class: Hearing Difficulty
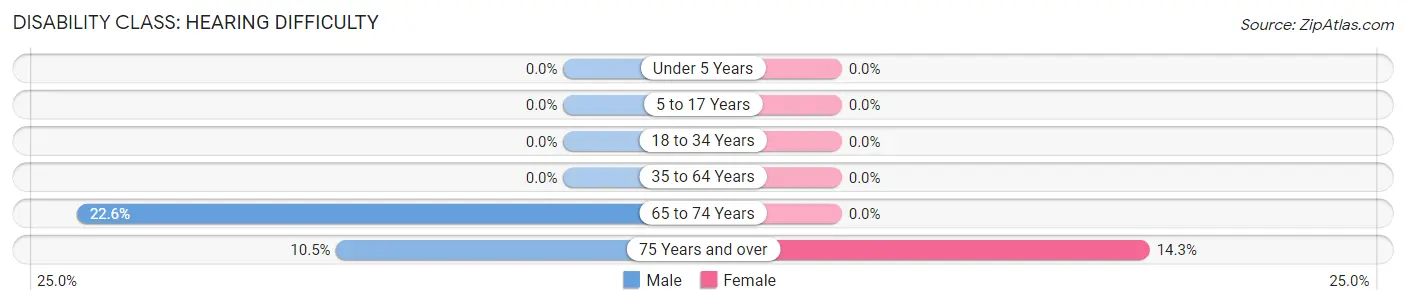
| Age Bracket | Male | Female |
| Under 5 Years | 0 (0.0%) | 0 (0.0%) |
| 5 to 17 Years | 0 (0.0%) | 0 (0.0%) |
| 18 to 34 Years | 0 (0.0%) | 0 (0.0%) |
| 35 to 64 Years | 0 (0.0%) | 0 (0.0%) |
| 65 to 74 Years | 7 (22.6%) | 0 (0.0%) |
| 75 Years and over | 4 (10.5%) | 5 (14.3%) |
Disability Class: Vision Difficulty
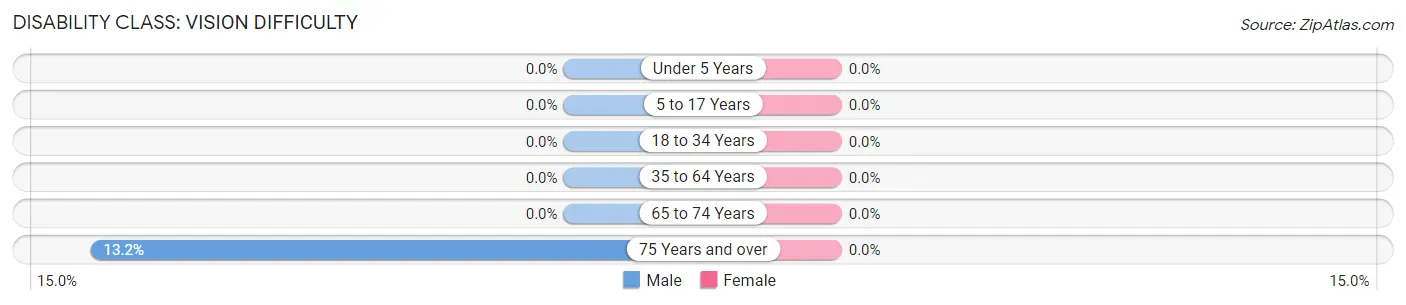
| Age Bracket | Male | Female |
| Under 5 Years | 0 (0.0%) | 0 (0.0%) |
| 5 to 17 Years | 0 (0.0%) | 0 (0.0%) |
| 18 to 34 Years | 0 (0.0%) | 0 (0.0%) |
| 35 to 64 Years | 0 (0.0%) | 0 (0.0%) |
| 65 to 74 Years | 0 (0.0%) | 0 (0.0%) |
| 75 Years and over | 5 (13.2%) | 0 (0.0%) |
Disability Class: Cognitive Difficulty
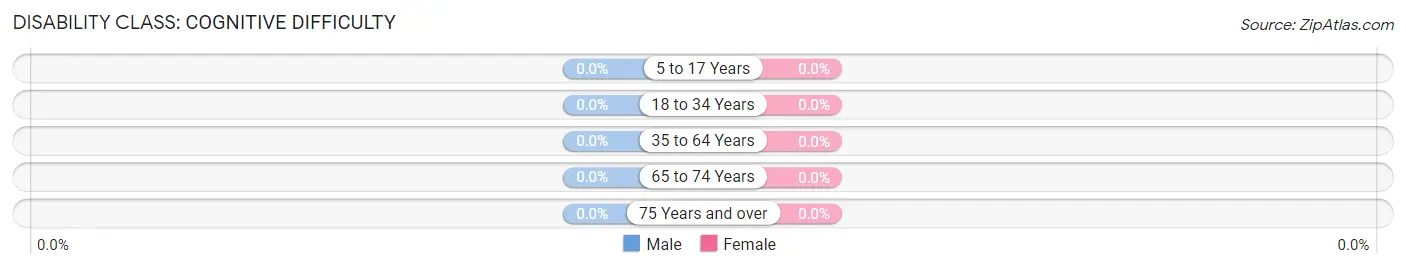
| Age Bracket | Male | Female |
| 5 to 17 Years | 0 (0.0%) | 0 (0.0%) |
| 18 to 34 Years | 0 (0.0%) | 0 (0.0%) |
| 35 to 64 Years | 0 (0.0%) | 0 (0.0%) |
| 65 to 74 Years | 0 (0.0%) | 0 (0.0%) |
| 75 Years and over | 0 (0.0%) | 0 (0.0%) |
Disability Class: Ambulatory Difficulty
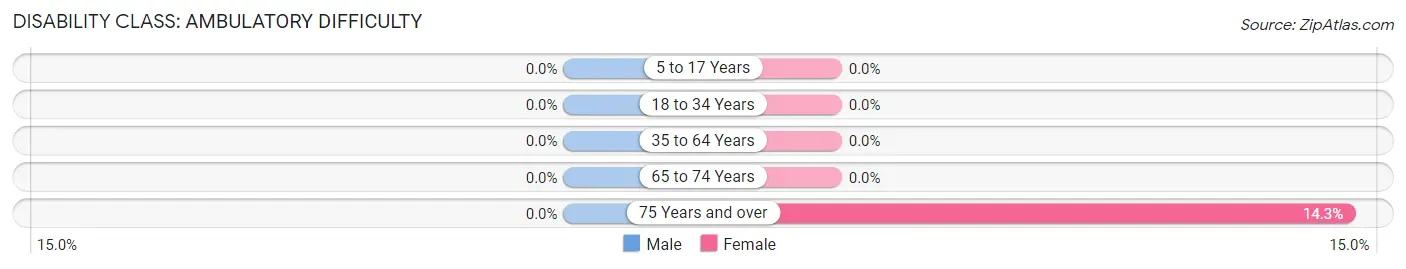
| Age Bracket | Male | Female |
| 5 to 17 Years | 0 (0.0%) | 0 (0.0%) |
| 18 to 34 Years | 0 (0.0%) | 0 (0.0%) |
| 35 to 64 Years | 0 (0.0%) | 0 (0.0%) |
| 65 to 74 Years | 0 (0.0%) | 0 (0.0%) |
| 75 Years and over | 0 (0.0%) | 5 (14.3%) |
Disability Class: Self-Care Difficulty
| Age Bracket | Male | Female |
| 5 to 17 Years | 0 (0.0%) | 0 (0.0%) |
| 18 to 34 Years | 0 (0.0%) | 0 (0.0%) |
| 35 to 64 Years | 0 (0.0%) | 0 (0.0%) |
| 65 to 74 Years | 0 (0.0%) | 0 (0.0%) |
| 75 Years and over | 0 (0.0%) | 0 (0.0%) |
Technology Access in Lost Bridge Village
Computing Device Access in Lost Bridge Village
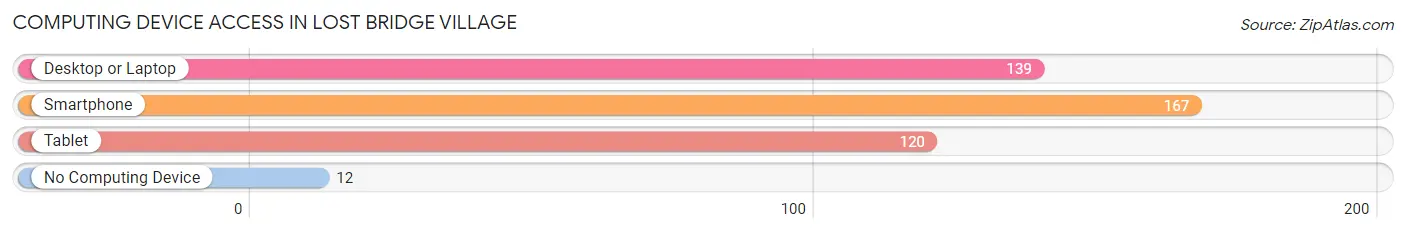
| Device Type | # Households | % Households |
| Desktop or Laptop | 139 | 73.5% |
| Smartphone | 167 | 88.4% |
| Tablet | 120 | 63.5% |
| No Computing Device | 12 | 6.4% |
| Total | 189 | 100.0% |
Internet Access in Lost Bridge Village
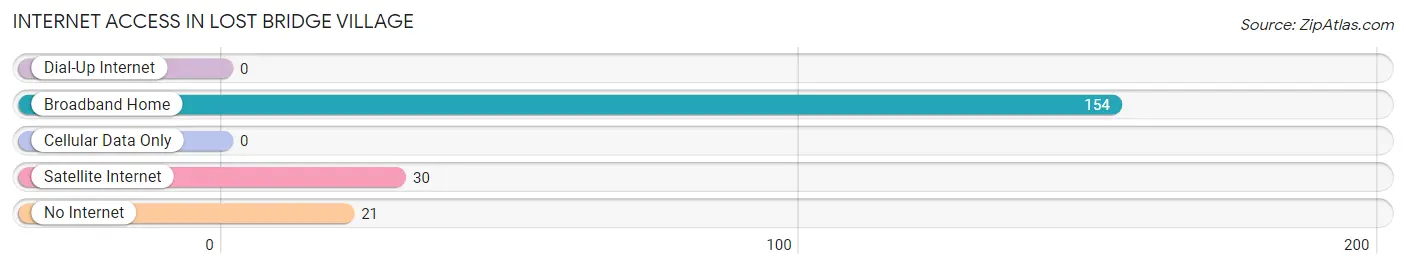
| Internet Type | # Households | % Households |
| Dial-Up Internet | 0 | 0.0% |
| Broadband Home | 154 | 81.5% |
| Cellular Data Only | 0 | 0.0% |
| Satellite Internet | 30 | 15.9% |
| No Internet | 21 | 11.1% |
| Total | 189 | 100.0% |
Lost Bridge Village Summary
History
Lost Bridge Village is a small unincorporated community located in Benton County, Arkansas. It is situated on the western shore of Beaver Lake, a man-made reservoir created by the U.S. Army Corps of Engineers in the 1960s. The village was founded in the late 1800s by a group of settlers who were looking for a place to call home. The original settlers were mostly farmers and loggers, and the village was named after a bridge that was lost in a flood.
The village was a small, rural community until the 1960s when the Beaver Lake was created. The lake brought in a new wave of people who were looking for a place to relax and enjoy the outdoors. The village quickly grew and became a popular destination for fishing, boating, and camping.
In the 1970s, the village began to attract more people who were looking for a place to retire. The village was known for its peaceful atmosphere and its proximity to the lake. The village also had a few small businesses, including a general store, a gas station, and a post office.
Geography
Lost Bridge Village is located in the Ozark Mountains of Northwest Arkansas. It is situated on the western shore of Beaver Lake, a man-made reservoir created by the U.S. Army Corps of Engineers in the 1960s. The lake is approximately 8,000 acres in size and is a popular destination for fishing, boating, and camping.
The village is surrounded by the Ozark National Forest, which is home to a variety of wildlife, including deer, turkey, and black bear. The forest is also home to a variety of plants, including wildflowers, ferns, and mosses.
The village is located approximately 30 miles from the city of Fayetteville, Arkansas. It is also close to the cities of Rogers and Bentonville, which are both home to a variety of shopping, dining, and entertainment options.
Economy
The economy of Lost Bridge Village is largely based on tourism. The village is a popular destination for fishing, boating, and camping, and it is also home to a few small businesses, including a general store, a gas station, and a post office.
The village also has a few restaurants, including a pizza parlor and a Mexican restaurant. There is also a small marina located on the lake, which offers boat rentals and other services.
Demographics
As of the 2010 census, the population of Lost Bridge Village was 1,092. The population is predominantly white (94.3%), with a small percentage of African Americans (2.2%) and Hispanics (2.2%). The median household income is $41,250, and the median age is 44.
Conclusion
Lost Bridge Village is a small unincorporated community located in Benton County, Arkansas. It is situated on the western shore of Beaver Lake, a man-made reservoir created by the U.S. Army Corps of Engineers in the 1960s. The village was founded in the late 1800s by a group of settlers who were looking for a place to call home. The village is surrounded by the Ozark National Forest and is a popular destination for fishing, boating, and camping. The economy of Lost Bridge Village is largely based on tourism, and the population is predominantly white.
Common Questions
What is Per Capita Income in Lost Bridge Village?
Per Capita income in Lost Bridge Village is $63,715.
What is the Median Family Income in Lost Bridge Village?
Median Family Income in Lost Bridge Village is $89,000.
What is the Median Household income in Lost Bridge Village?
Median Household Income in Lost Bridge Village is $66,563.
What is Inequality or Gini Index in Lost Bridge Village?
Inequality or Gini Index in Lost Bridge Village is 0.46.
What is the Total Population of Lost Bridge Village?
Total Population of Lost Bridge Village is 289.
What is the Total Male Population of Lost Bridge Village?
Total Male Population of Lost Bridge Village is 156.
What is the Total Female Population of Lost Bridge Village?
Total Female Population of Lost Bridge Village is 133.
What is the Ratio of Males per 100 Females in Lost Bridge Village?
There are 117.29 Males per 100 Females in Lost Bridge Village.
What is the Ratio of Females per 100 Males in Lost Bridge Village?
There are 85.26 Females per 100 Males in Lost Bridge Village.
What is the Median Population Age in Lost Bridge Village?
Median Population Age in Lost Bridge Village is 63.9 Years.
What is the Average Family Size in Lost Bridge Village
Average Family Size in Lost Bridge Village is 2.2 People.
What is the Average Household Size in Lost Bridge Village
Average Household Size in Lost Bridge Village is 1.5 People.
How Large is the Labor Force in Lost Bridge Village?
There are 129 People in the Labor Forcein in Lost Bridge Village.
What is the Percentage of People in the Labor Force in Lost Bridge Village?
44.9% of People are in the Labor Force in Lost Bridge Village.
What is the Unemployment Rate in Lost Bridge Village?
Unemployment Rate in Lost Bridge Village is 4.8%.