Rockwell, AR Map & Demographics
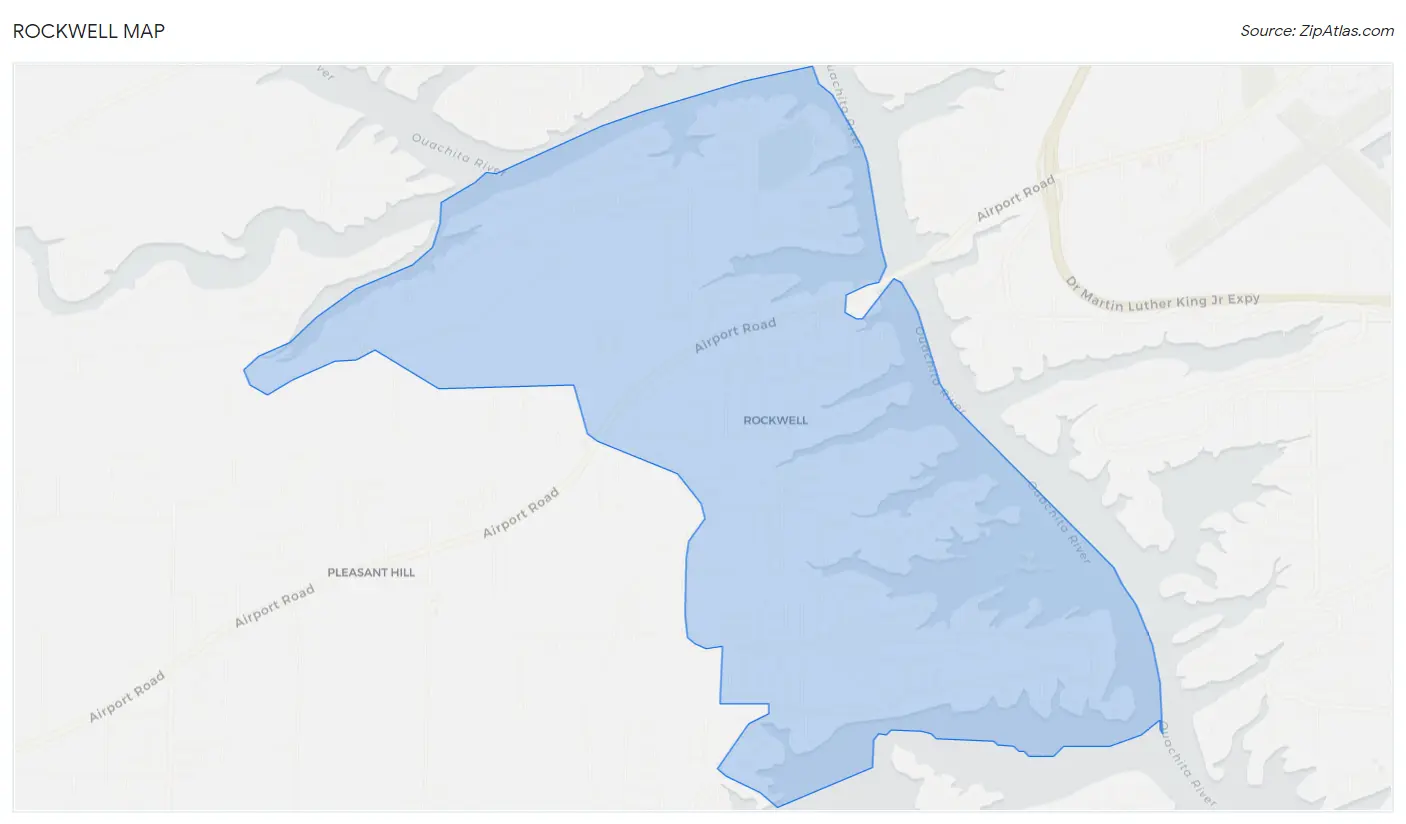
Rockwell Map
Rockwell Overview
$46,806
PER CAPITA INCOME
$69,717
AVG FAMILY INCOME
$67,344
AVG HOUSEHOLD INCOME
26.7%
WAGE / INCOME GAP [ % ]
73.3¢/ $1
WAGE / INCOME GAP [ $ ]
$10,677
FAMILY INCOME DEFICIT
0.61
INEQUALITY / GINI INDEX
4,205
TOTAL POPULATION
1,986
MALE POPULATION
2,219
FEMALE POPULATION
89.50
MALES / 100 FEMALES
111.73
FEMALES / 100 MALES
39.6
MEDIAN AGE
2.7
AVG FAMILY SIZE
2.4
AVG HOUSEHOLD SIZE
1,920
LABOR FORCE [ PEOPLE ]
55.5%
PERCENT IN LABOR FORCE
9.6%
UNEMPLOYMENT RATE
Income in Rockwell
Income Overview in Rockwell
Per Capita Income in Rockwell is $46,806, while median incomes of families and households are $69,717 and $67,344 respectively.
| Characteristic | Number | Measure |
| Per Capita Income | 4,205 | $46,806 |
| Median Family Income | 1,337 | $69,717 |
| Mean Family Income | 1,337 | $124,834 |
| Median Household Income | 1,772 | $67,344 |
| Mean Household Income | 1,772 | $109,873 |
| Income Deficit | 1,337 | $10,677 |
| Wage / Income Gap (%) | 4,205 | 26.68% |
| Wage / Income Gap ($) | 4,205 | 73.32¢ per $1 |
| Gini / Inequality Index | 4,205 | 0.61 |
Earnings by Sex in Rockwell
Average Earnings in Rockwell are $35,208, $39,188 for men and $28,731 for women, a difference of 26.7%.
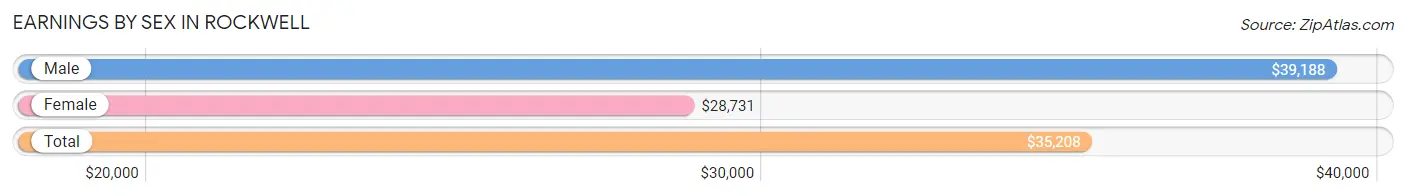
| Sex | Number | Average Earnings |
| Male | 1,021 (50.5%) | $39,188 |
| Female | 1,002 (49.5%) | $28,731 |
| Total | 2,023 (100.0%) | $35,208 |
Earnings by Sex by Income Bracket in Rockwell
The most common earnings brackets in Rockwell are $100,000+ for men (182 | 17.8%) and $15,000 to $17,499 for women (129 | 12.9%).
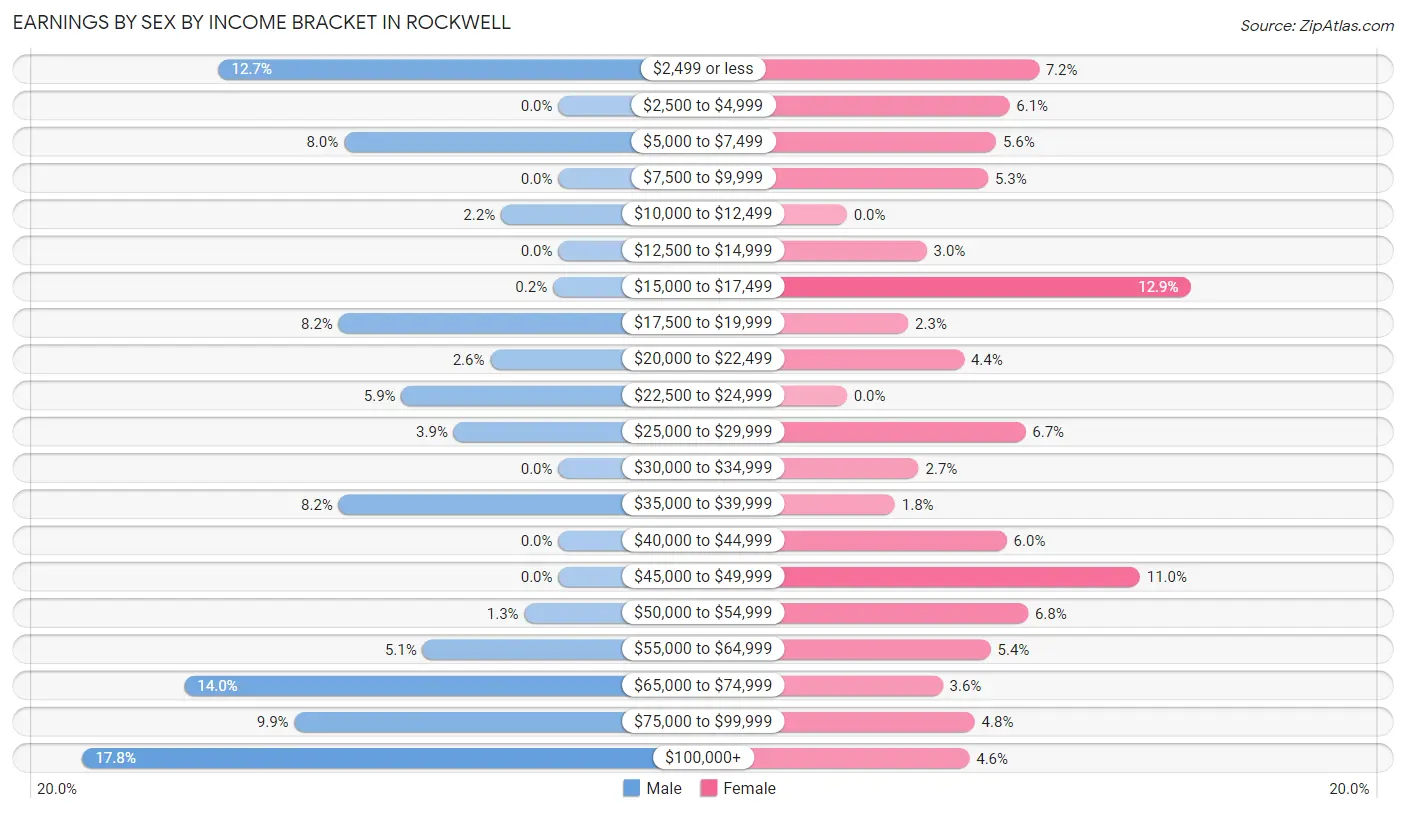
| Income | Male | Female |
| $2,499 or less | 130 (12.7%) | 72 (7.2%) |
| $2,500 to $4,999 | 0 (0.0%) | 61 (6.1%) |
| $5,000 to $7,499 | 82 (8.0%) | 56 (5.6%) |
| $7,500 to $9,999 | 0 (0.0%) | 53 (5.3%) |
| $10,000 to $12,499 | 22 (2.1%) | 0 (0.0%) |
| $12,500 to $14,999 | 0 (0.0%) | 30 (3.0%) |
| $15,000 to $17,499 | 2 (0.2%) | 129 (12.9%) |
| $17,500 to $19,999 | 84 (8.2%) | 23 (2.3%) |
| $20,000 to $22,499 | 26 (2.5%) | 44 (4.4%) |
| $22,500 to $24,999 | 60 (5.9%) | 0 (0.0%) |
| $25,000 to $29,999 | 40 (3.9%) | 67 (6.7%) |
| $30,000 to $34,999 | 0 (0.0%) | 27 (2.7%) |
| $35,000 to $39,999 | 84 (8.2%) | 18 (1.8%) |
| $40,000 to $44,999 | 0 (0.0%) | 60 (6.0%) |
| $45,000 to $49,999 | 0 (0.0%) | 110 (11.0%) |
| $50,000 to $54,999 | 13 (1.3%) | 68 (6.8%) |
| $55,000 to $64,999 | 52 (5.1%) | 54 (5.4%) |
| $65,000 to $74,999 | 143 (14.0%) | 36 (3.6%) |
| $75,000 to $99,999 | 101 (9.9%) | 48 (4.8%) |
| $100,000+ | 182 (17.8%) | 46 (4.6%) |
| Total | 1,021 (100.0%) | 1,002 (100.0%) |
Earnings by Sex by Educational Attainment in Rockwell
Average earnings in Rockwell are $55,956 for men and $41,375 for women, a difference of 26.1%. Men with an educational attainment of graduate degree enjoy the highest average annual earnings of $81,563, while those with less than high school education earn the least with $24,667. Women with an educational attainment of graduate degree earn the most with the average annual earnings of $58,313, while those with high school diploma education have the smallest earnings of $33,102.
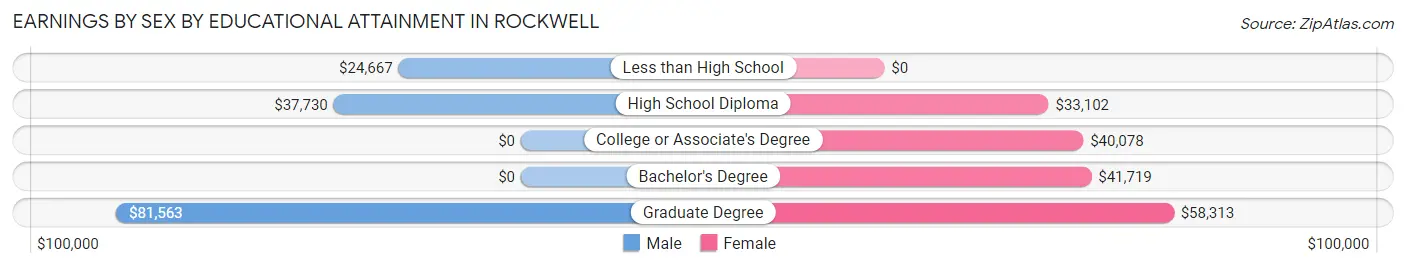
| Educational Attainment | Male Income | Female Income |
| Less than High School | $24,667 | $0 |
| High School Diploma | $37,730 | $33,102 |
| College or Associate's Degree | - | - |
| Bachelor's Degree | - | - |
| Graduate Degree | $81,563 | $58,313 |
| Total | $55,956 | $41,375 |
Family Income in Rockwell
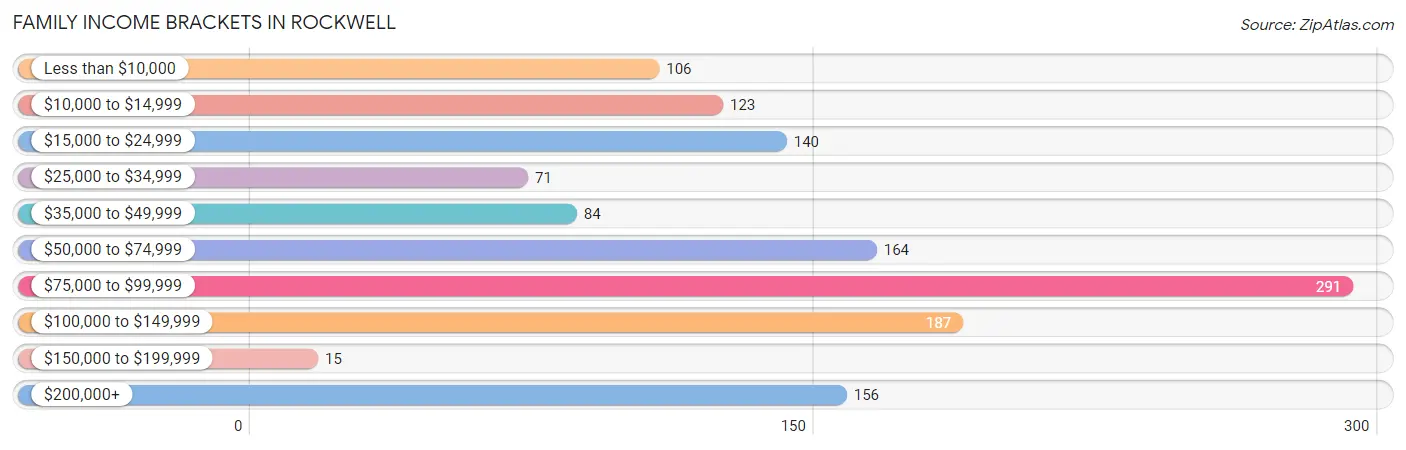
Family Income Brackets in Rockwell
According to the Rockwell family income data, there are 291 families falling into the $75,000 to $99,999 income range, which is the most common income bracket and makes up 21.8% of all families. Conversely, the $150,000 to $199,999 income bracket is the least frequent group with only 15 families (1.1%) belonging to this category.
| Income Bracket | # Families | % Families |
| Less than $10,000 | 106 | 7.9% |
| $10,000 to $14,999 | 123 | 9.2% |
| $15,000 to $24,999 | 140 | 10.5% |
| $25,000 to $34,999 | 71 | 5.3% |
| $35,000 to $49,999 | 84 | 6.3% |
| $50,000 to $74,999 | 164 | 12.3% |
| $75,000 to $99,999 | 291 | 21.8% |
| $100,000 to $149,999 | 187 | 14.0% |
| $150,000 to $199,999 | 15 | 1.1% |
| $200,000+ | 156 | 11.7% |
Family Income by Famaliy Size in Rockwell
4-person families (158 | 11.8%) account for the highest median family income in Rockwell with $78,077 per family, while 2-person families (692 | 51.8%) have the highest median income of $29,458 per family member.
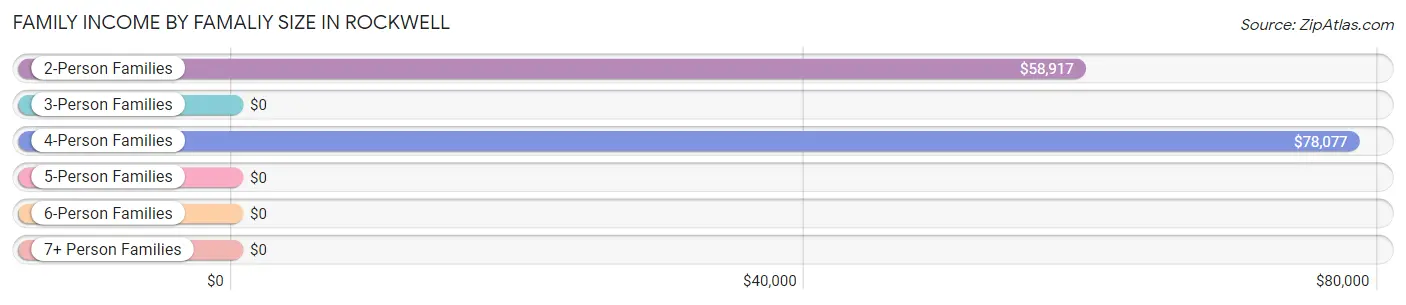
| Income Bracket | # Families | Median Income |
| 2-Person Families | 692 (51.8%) | $58,917 |
| 3-Person Families | 373 (27.9%) | $0 |
| 4-Person Families | 158 (11.8%) | $78,077 |
| 5-Person Families | 114 (8.5%) | $0 |
| 6-Person Families | 0 (0.0%) | $0 |
| 7+ Person Families | 0 (0.0%) | $0 |
| Total | 1,337 (100.0%) | $69,717 |
Family Income by Number of Earners in Rockwell
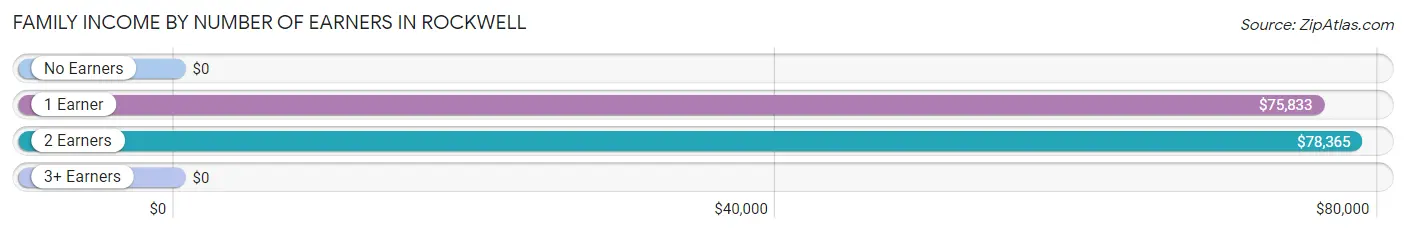
| Number of Earners | # Families | Median Income |
| No Earners | 287 (21.5%) | $0 |
| 1 Earner | 512 (38.3%) | $75,833 |
| 2 Earners | 444 (33.2%) | $78,365 |
| 3+ Earners | 94 (7.0%) | $0 |
| Total | 1,337 (100.0%) | $69,717 |
Household Income in Rockwell
Household Income Brackets in Rockwell
With 315 households falling in the category, the $75,000 to $99,999 income range is the most frequent in Rockwell, accounting for 17.8% of all households. In contrast, only 50 households (2.8%) fall into the $150,000 to $199,999 income bracket, making it the least populous group.
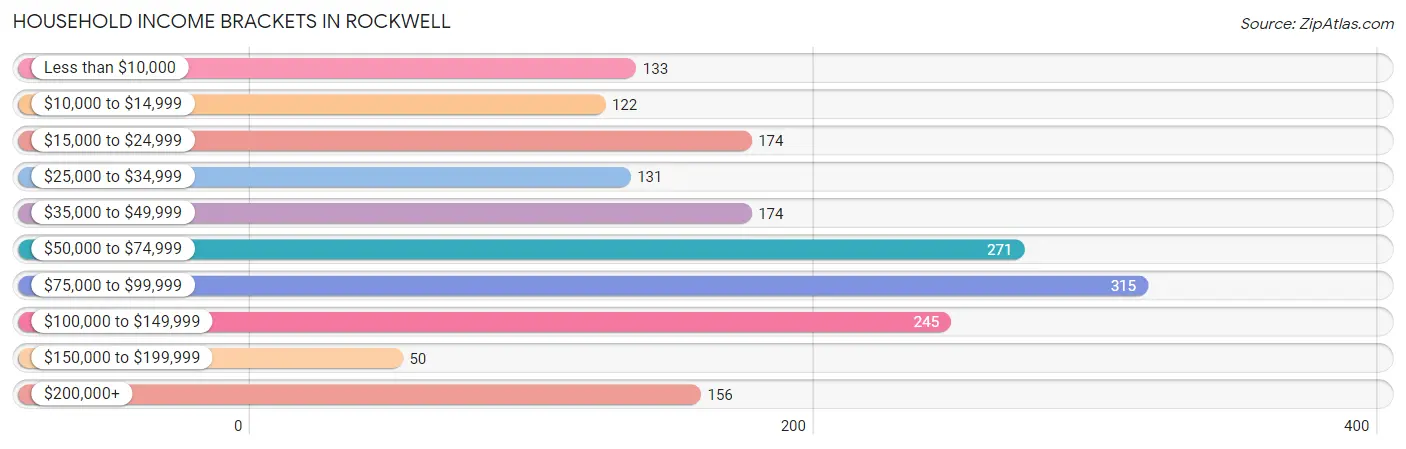
| Income Bracket | # Households | % Households |
| Less than $10,000 | 133 | 7.5% |
| $10,000 to $14,999 | 122 | 6.9% |
| $15,000 to $24,999 | 174 | 9.8% |
| $25,000 to $34,999 | 131 | 7.4% |
| $35,000 to $49,999 | 174 | 9.8% |
| $50,000 to $74,999 | 271 | 15.3% |
| $75,000 to $99,999 | 315 | 17.8% |
| $100,000 to $149,999 | 245 | 13.8% |
| $150,000 to $199,999 | 50 | 2.8% |
| $200,000+ | 156 | 8.8% |
Household Income by Householder Age in Rockwell
The median household income in Rockwell is $67,344, with the highest median household income of $71,957 found in the 65+ years age bracket for the primary householder. A total of 578 households (32.6%) fall into this category. Meanwhile, the 15 to 24 years age bracket for the primary householder has the lowest median household income of $0, with 61 households (3.4%) in this group.
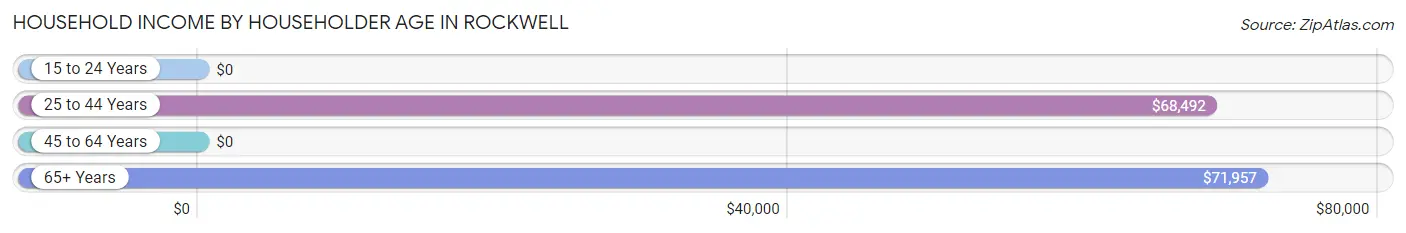
| Income Bracket | # Households | Median Income |
| 15 to 24 Years | 61 (3.4%) | $0 |
| 25 to 44 Years | 657 (37.1%) | $68,492 |
| 45 to 64 Years | 476 (26.9%) | $0 |
| 65+ Years | 578 (32.6%) | $71,957 |
| Total | 1,772 (100.0%) | $67,344 |
Poverty in Rockwell
Income Below Poverty by Sex and Age in Rockwell
With 12.8% poverty level for males and 25.2% for females among the residents of Rockwell, 16 and 17 year old males and 12 to 14 year old females are the most vulnerable to poverty, with 86 males (71.1%) and 77 females (100.0%) in their respective age groups living below the poverty level.
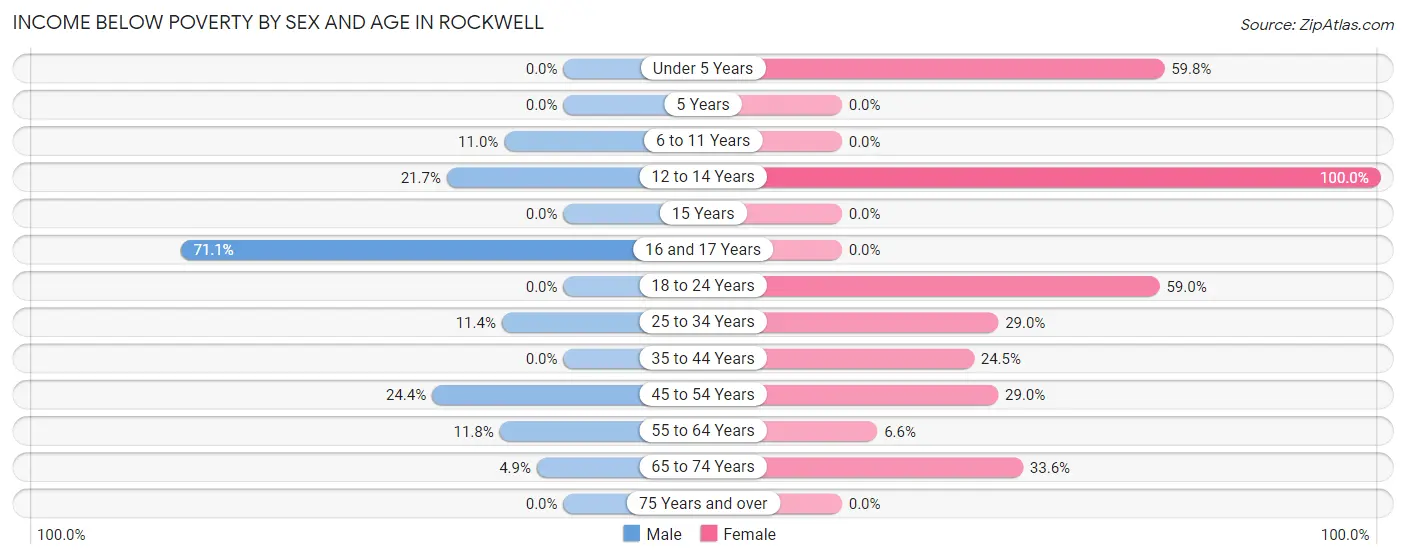
| Age Bracket | Male | Female |
| Under 5 Years | 0 (0.0%) | 76 (59.8%) |
| 5 Years | 0 (0.0%) | 0 (0.0%) |
| 6 to 11 Years | 21 (11.0%) | 0 (0.0%) |
| 12 to 14 Years | 21 (21.6%) | 77 (100.0%) |
| 15 Years | 0 (0.0%) | 0 (0.0%) |
| 16 and 17 Years | 86 (71.1%) | 0 (0.0%) |
| 18 to 24 Years | 0 (0.0%) | 92 (59.0%) |
| 25 to 34 Years | 35 (11.4%) | 54 (29.0%) |
| 35 to 44 Years | 0 (0.0%) | 111 (24.5%) |
| 45 to 54 Years | 48 (24.4%) | 47 (29.0%) |
| 55 to 64 Years | 27 (11.8%) | 26 (6.6%) |
| 65 to 74 Years | 16 (4.9%) | 77 (33.6%) |
| 75 Years and over | 0 (0.0%) | 0 (0.0%) |
| Total | 254 (12.8%) | 560 (25.2%) |
Income Above Poverty by Sex and Age in Rockwell
According to the poverty statistics in Rockwell, males aged under 5 years and females aged 6 to 11 years are the age groups that are most secure financially, with 100.0% of males and 100.0% of females in these age groups living above the poverty line.
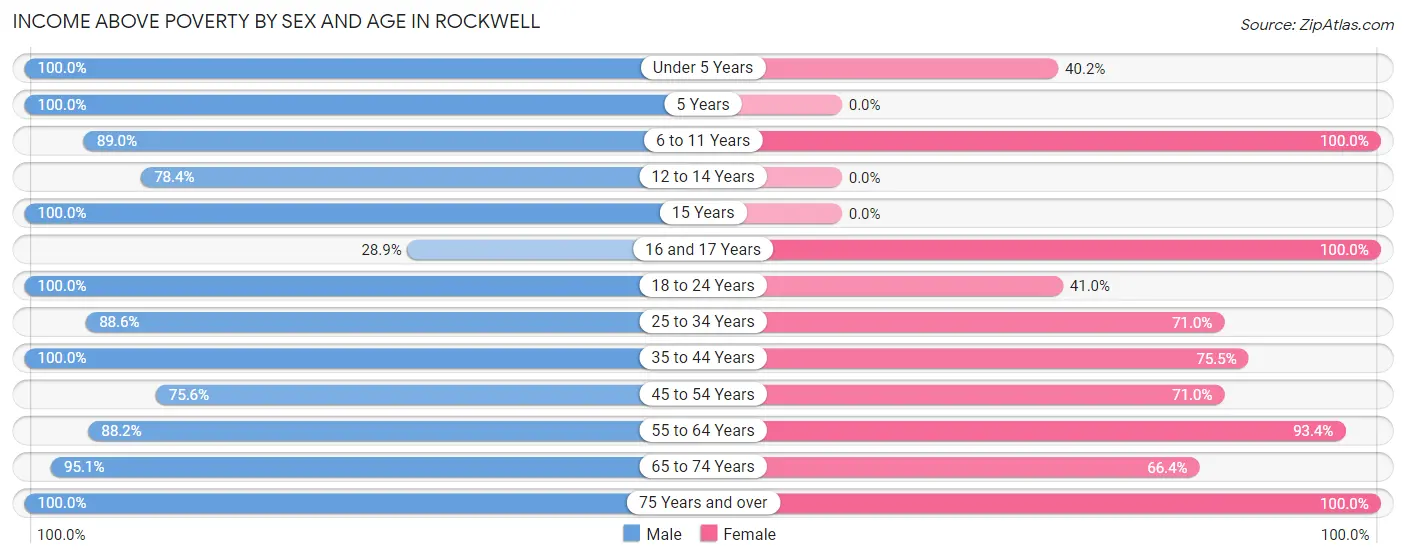
| Age Bracket | Male | Female |
| Under 5 Years | 88 (100.0%) | 51 (40.2%) |
| 5 Years | 28 (100.0%) | 0 (0.0%) |
| 6 to 11 Years | 170 (89.0%) | 121 (100.0%) |
| 12 to 14 Years | 76 (78.3%) | 0 (0.0%) |
| 15 Years | 17 (100.0%) | 0 (0.0%) |
| 16 and 17 Years | 35 (28.9%) | 124 (100.0%) |
| 18 to 24 Years | 57 (100.0%) | 64 (41.0%) |
| 25 to 34 Years | 271 (88.6%) | 132 (71.0%) |
| 35 to 44 Years | 232 (100.0%) | 342 (75.5%) |
| 45 to 54 Years | 149 (75.6%) | 115 (71.0%) |
| 55 to 64 Years | 201 (88.2%) | 370 (93.4%) |
| 65 to 74 Years | 309 (95.1%) | 152 (66.4%) |
| 75 Years and over | 99 (100.0%) | 188 (100.0%) |
| Total | 1,732 (87.2%) | 1,659 (74.8%) |
Income Below Poverty Among Married-Couple Families in Rockwell
The poverty statistics for married-couple families in Rockwell show that 7.5% or 76 of the total 1,010 families live below the poverty line. Families with no children have the highest poverty rate of 11.9%, comprising of 76 families. On the other hand, families with 1 or 2 children have the lowest poverty rate of 0.0%, which includes 0 families.
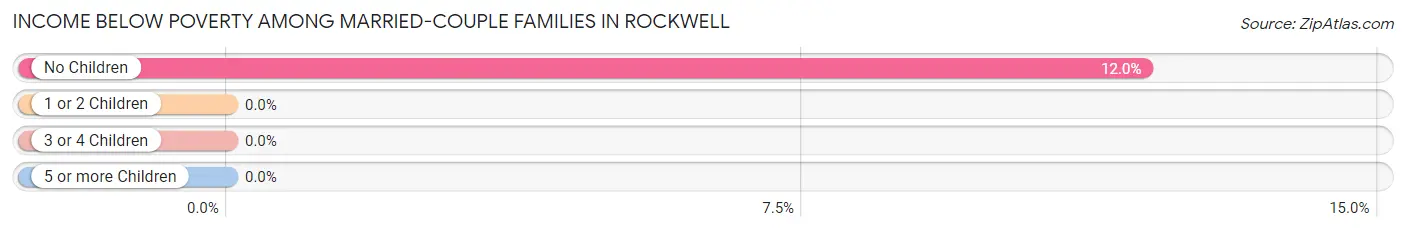
| Children | Above Poverty | Below Poverty |
| No Children | 560 (88.0%) | 76 (11.9%) |
| 1 or 2 Children | 260 (100.0%) | 0 (0.0%) |
| 3 or 4 Children | 114 (100.0%) | 0 (0.0%) |
| 5 or more Children | 0 (0.0%) | 0 (0.0%) |
| Total | 934 (92.5%) | 76 (7.5%) |
Income Below Poverty Among Single-Parent Households in Rockwell
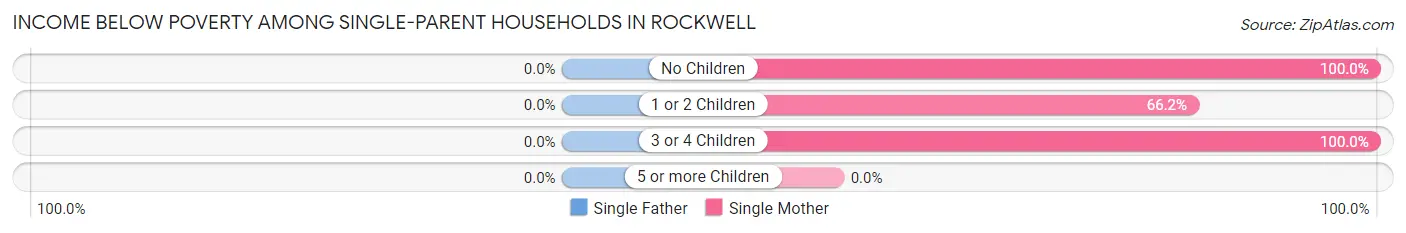
| Children | Single Father | Single Mother |
| No Children | 0 (0.0%) | 47 (100.0%) |
| 1 or 2 Children | 0 (0.0%) | 172 (66.1%) |
| 3 or 4 Children | 0 (0.0%) | 20 (100.0%) |
| 5 or more Children | 0 (0.0%) | 0 (0.0%) |
| Total | 0 (0.0%) | 239 (73.1%) |
Income Below Poverty Among Married-Couple vs Single-Parent Households in Rockwell
The poverty data for Rockwell shows that 76 of the married-couple family households (7.5%) and 239 of the single-parent households (73.1%) are living below the poverty level. Within the married-couple family households, those with no children have the highest poverty rate, with 76 households (11.9%) falling below the poverty line. Among the single-parent households, those with no children have the highest poverty rate, with 47 household (100.0%) living below poverty.
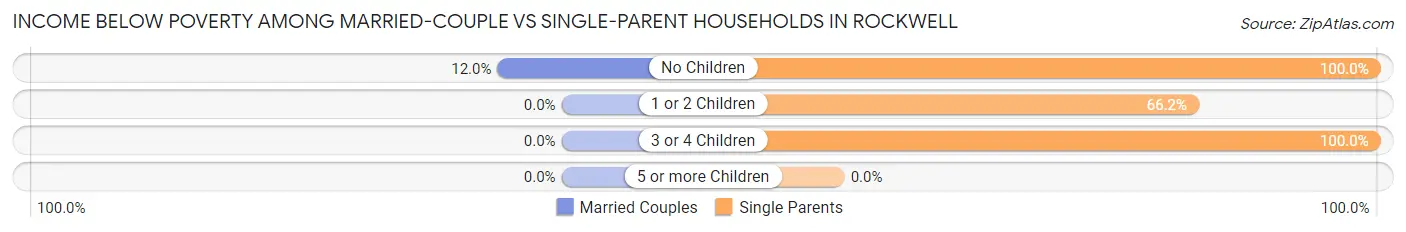
| Children | Married-Couple Families | Single-Parent Households |
| No Children | 76 (11.9%) | 47 (100.0%) |
| 1 or 2 Children | 0 (0.0%) | 172 (66.1%) |
| 3 or 4 Children | 0 (0.0%) | 20 (100.0%) |
| 5 or more Children | 0 (0.0%) | 0 (0.0%) |
| Total | 76 (7.5%) | 239 (73.1%) |
Race in Rockwell
The most populous races in Rockwell are White / Caucasian (3,683 | 87.6%), Black / African American (340 | 8.1%), and Two or more Races (170 | 4.0%).
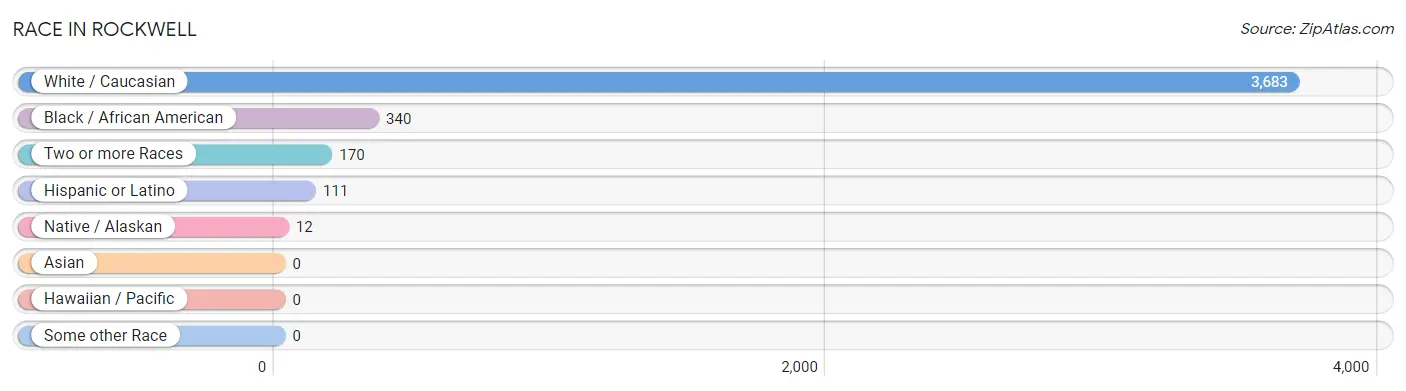
| Race | # Population | % Population |
| Asian | 0 | 0.0% |
| Black / African American | 340 | 8.1% |
| Hawaiian / Pacific | 0 | 0.0% |
| Hispanic or Latino | 111 | 2.6% |
| Native / Alaskan | 12 | 0.3% |
| White / Caucasian | 3,683 | 87.6% |
| Two or more Races | 170 | 4.0% |
| Some other Race | 0 | 0.0% |
| Total | 4,205 | 100.0% |
Ancestry in Rockwell
The most populous ancestries reported in Rockwell are Irish (584 | 13.9%), English (573 | 13.6%), American (555 | 13.2%), German (338 | 8.0%), and European (253 | 6.0%), together accounting for 54.8% of all Rockwell residents.
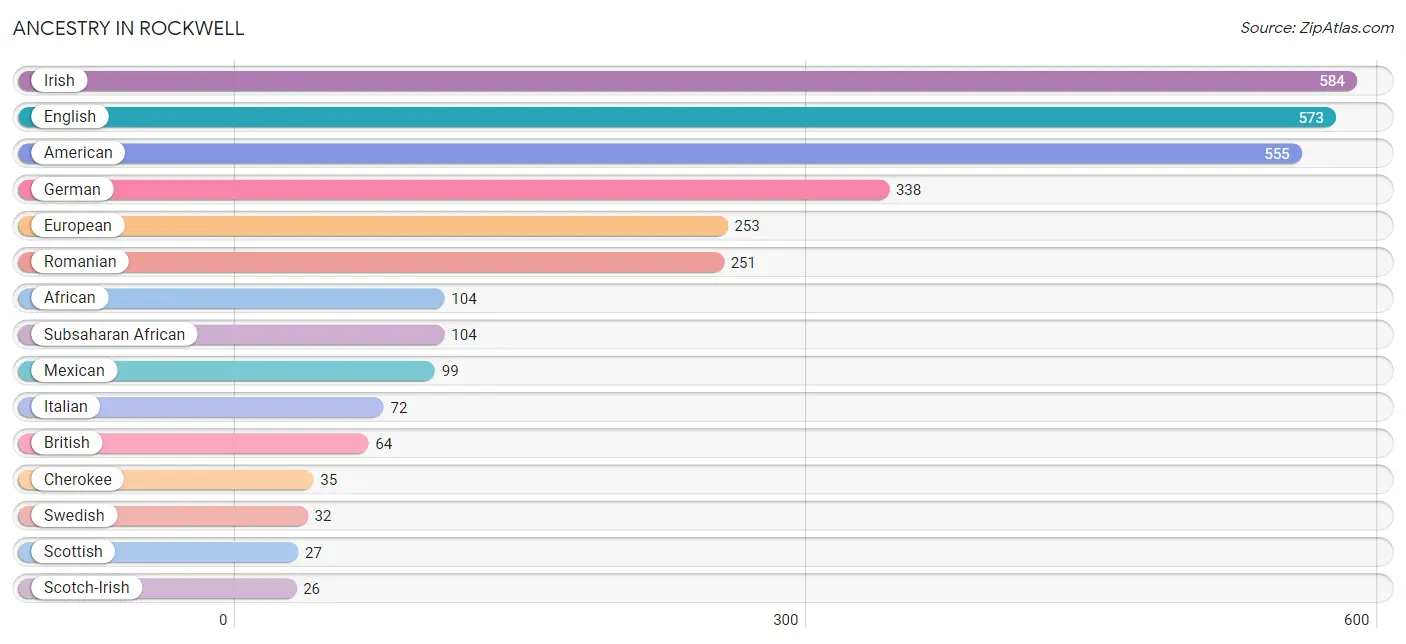
| Ancestry | # Population | % Population |
| African | 104 | 2.5% |
| American | 555 | 13.2% |
| Belgian | 11 | 0.3% |
| Blackfeet | 15 | 0.4% |
| British | 64 | 1.5% |
| Cherokee | 35 | 0.8% |
| Chickasaw | 11 | 0.3% |
| Chilean | 12 | 0.3% |
| Danish | 11 | 0.3% |
| Dutch | 9 | 0.2% |
| English | 573 | 13.6% |
| European | 253 | 6.0% |
| French | 21 | 0.5% |
| German | 338 | 8.0% |
| Irish | 584 | 13.9% |
| Italian | 72 | 1.7% |
| Korean | 23 | 0.5% |
| Mexican | 99 | 2.4% |
| Norwegian | 18 | 0.4% |
| Romanian | 251 | 6.0% |
| Scandinavian | 9 | 0.2% |
| Scotch-Irish | 26 | 0.6% |
| Scottish | 27 | 0.6% |
| South American | 12 | 0.3% |
| Subsaharan African | 104 | 2.5% |
| Swedish | 32 | 0.8% |
| Swiss | 16 | 0.4% |
| Welsh | 18 | 0.4% |
| Yugoslavian | 19 | 0.4% | View All 29 Rows |
Immigrants in Rockwell
The most numerous immigrant groups reported in Rockwell came from Eastern Europe (126 | 3.0%), Europe (126 | 3.0%), Romania (107 | 2.5%), Central America (27 | 0.6%), and Latin America (27 | 0.6%), together accounting for 9.8% of all Rockwell residents.
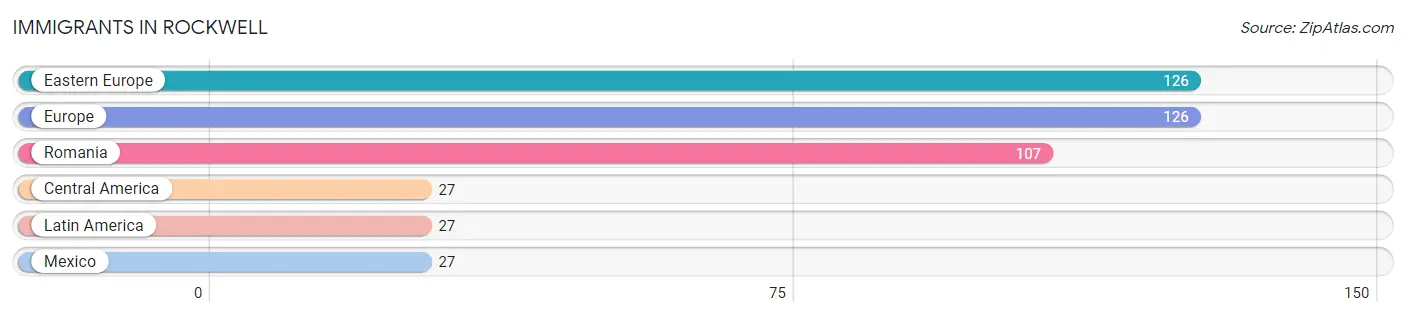
| Immigration Origin | # Population | % Population |
| Central America | 27 | 0.6% |
| Eastern Europe | 126 | 3.0% |
| Europe | 126 | 3.0% |
| Latin America | 27 | 0.6% |
| Mexico | 27 | 0.6% |
| Romania | 107 | 2.5% | View All 6 Rows |
Sex and Age in Rockwell
Sex and Age in Rockwell
The most populous age groups in Rockwell are 65 to 69 Years (273 | 13.8%) for men and 60 to 64 Years (292 | 13.2%) for women.
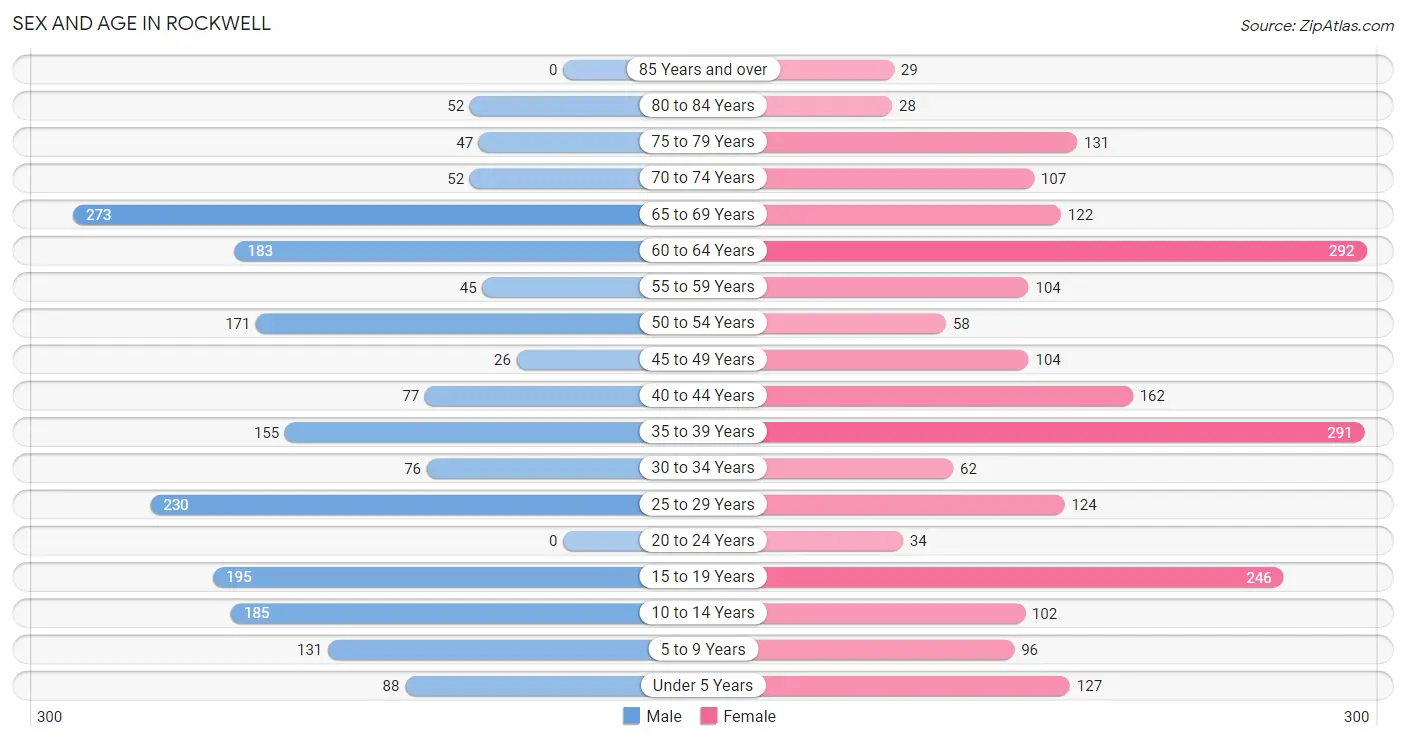
| Age Bracket | Male | Female |
| Under 5 Years | 88 (4.4%) | 127 (5.7%) |
| 5 to 9 Years | 131 (6.6%) | 96 (4.3%) |
| 10 to 14 Years | 185 (9.3%) | 102 (4.6%) |
| 15 to 19 Years | 195 (9.8%) | 246 (11.1%) |
| 20 to 24 Years | 0 (0.0%) | 34 (1.5%) |
| 25 to 29 Years | 230 (11.6%) | 124 (5.6%) |
| 30 to 34 Years | 76 (3.8%) | 62 (2.8%) |
| 35 to 39 Years | 155 (7.8%) | 291 (13.1%) |
| 40 to 44 Years | 77 (3.9%) | 162 (7.3%) |
| 45 to 49 Years | 26 (1.3%) | 104 (4.7%) |
| 50 to 54 Years | 171 (8.6%) | 58 (2.6%) |
| 55 to 59 Years | 45 (2.3%) | 104 (4.7%) |
| 60 to 64 Years | 183 (9.2%) | 292 (13.2%) |
| 65 to 69 Years | 273 (13.8%) | 122 (5.5%) |
| 70 to 74 Years | 52 (2.6%) | 107 (4.8%) |
| 75 to 79 Years | 47 (2.4%) | 131 (5.9%) |
| 80 to 84 Years | 52 (2.6%) | 28 (1.3%) |
| 85 Years and over | 0 (0.0%) | 29 (1.3%) |
| Total | 1,986 (100.0%) | 2,219 (100.0%) |
Families and Households in Rockwell
Median Family Size in Rockwell
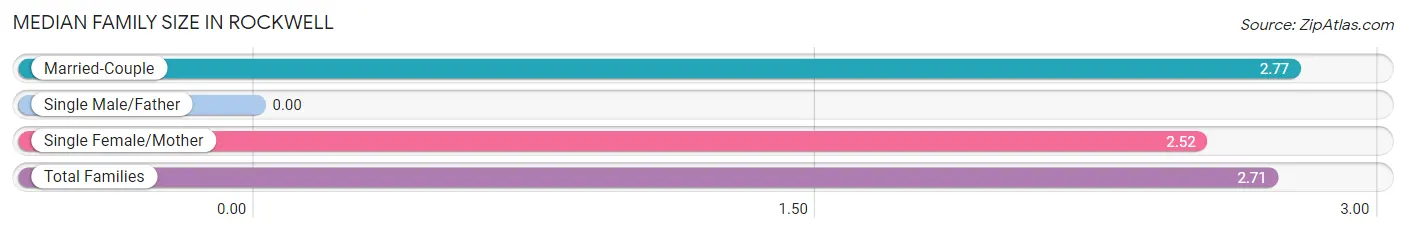
| Family Type | # Families | Family Size |
| Married-Couple | 1,010 (75.5%) | 2.77 |
| Single Male/Father | 0 (0.0%) | - |
| Single Female/Mother | 327 (24.5%) | 2.52 |
| Total Families | 1,337 (100.0%) | 2.71 |
Median Household Size in Rockwell
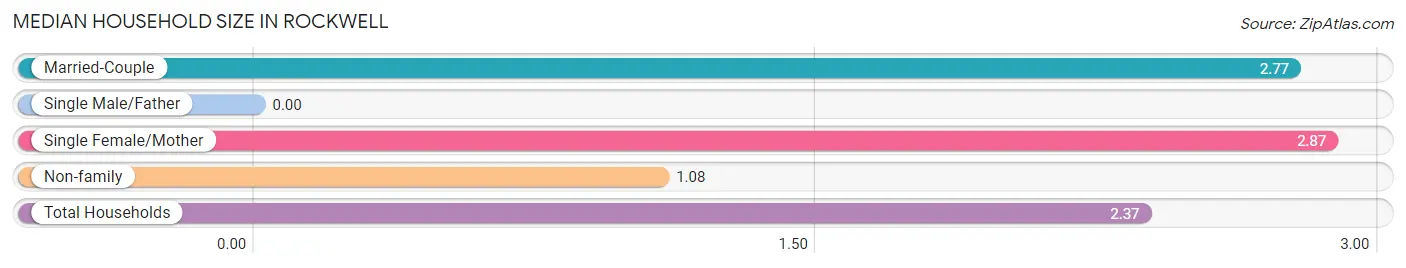
| Household Type | # Households | Household Size |
| Married-Couple | 1,010 (57.0%) | 2.77 |
| Single Male/Father | 0 (0.0%) | - |
| Single Female/Mother | 327 (18.4%) | 2.87 |
| Non-family | 435 (24.5%) | 1.08 |
| Total Households | 1,772 (100.0%) | 2.37 |
Household Size by Marriage Status in Rockwell
Out of a total of 1,772 households in Rockwell, 1,337 (75.4%) are family households, while 435 (24.5%) are nonfamily households. The most numerous type of family households are 2-person households, comprising 604, and the most common type of nonfamily households are 1-person households, comprising 399.
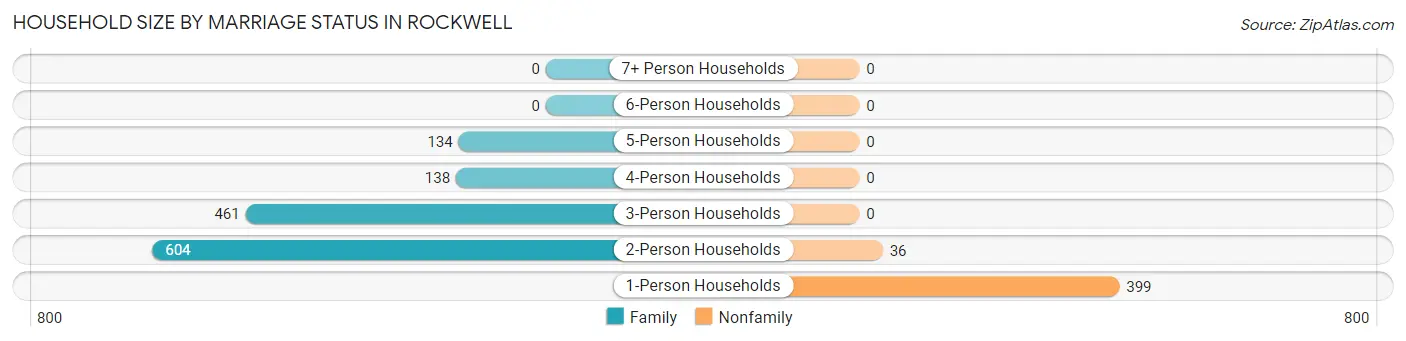
| Household Size | Family Households | Nonfamily Households |
| 1-Person Households | - | 399 (22.5%) |
| 2-Person Households | 604 (34.1%) | 36 (2.0%) |
| 3-Person Households | 461 (26.0%) | 0 (0.0%) |
| 4-Person Households | 138 (7.8%) | 0 (0.0%) |
| 5-Person Households | 134 (7.6%) | 0 (0.0%) |
| 6-Person Households | 0 (0.0%) | 0 (0.0%) |
| 7+ Person Households | 0 (0.0%) | 0 (0.0%) |
| Total | 1,337 (75.4%) | 435 (24.5%) |
Female Fertility in Rockwell
Fertility by Age in Rockwell
Average fertility rate in Rockwell is 91.0 births per 1,000 women. Women in the age bracket of 15 to 19 years have the highest fertility rate with 248.0 births per 1,000 women. Women in the age bracket of 15 to 19 years acount for 65.6% of all women with births.
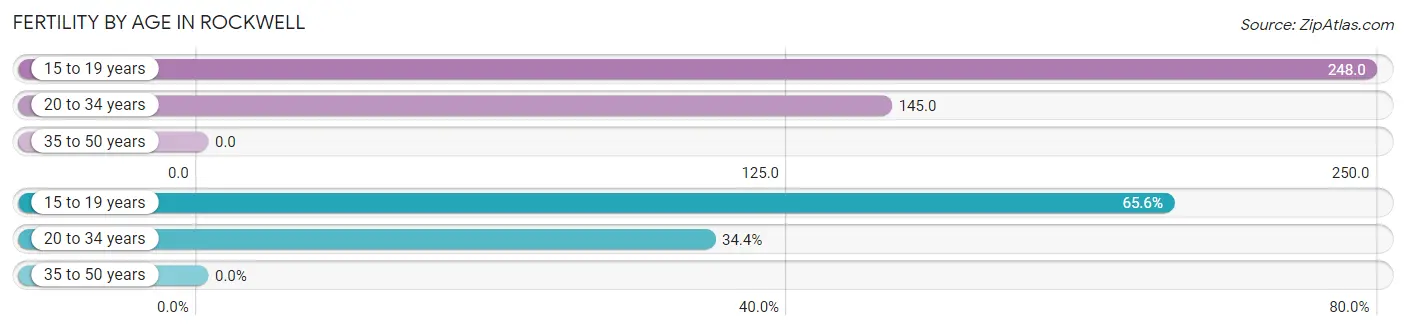
| Age Bracket | Women with Births | Births / 1,000 Women |
| 15 to 19 years | 61 (65.6%) | 248.0 |
| 20 to 34 years | 32 (34.4%) | 145.0 |
| 35 to 50 years | 0 (0.0%) | 0.0 |
| Total | 93 (100.0%) | 91.0 |
Fertility by Age by Marriage Status in Rockwell
12.9% of women with births (93) in Rockwell are married. The highest percentage of unmarried women with births falls into 15 to 19 years age bracket with 100.0% of them unmarried at the time of birth, while the lowest percentage of unmarried women with births belong to 20 to 34 years age bracket with 62.5% of them unmarried.
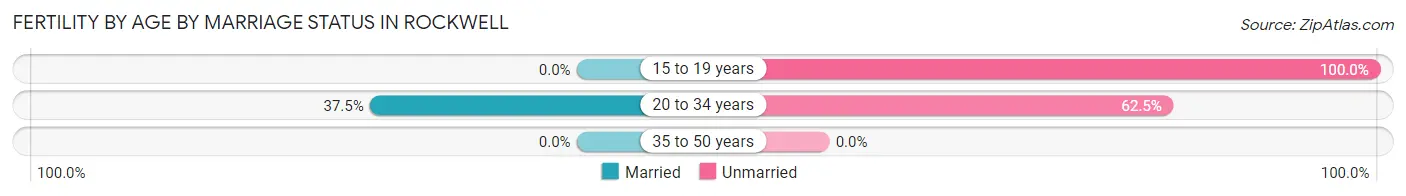
| Age Bracket | Married | Unmarried |
| 15 to 19 years | 0 (0.0%) | 61 (100.0%) |
| 20 to 34 years | 12 (37.5%) | 20 (62.5%) |
| 35 to 50 years | 0 (0.0%) | 0 (0.0%) |
| Total | 12 (12.9%) | 81 (87.1%) |
Fertility by Education in Rockwell
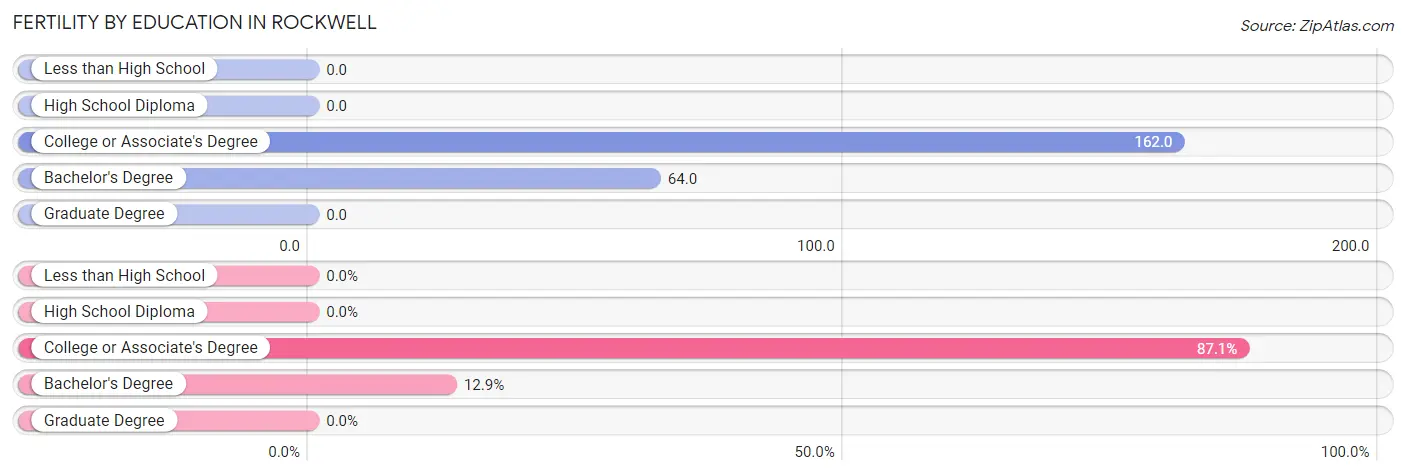
| Educational Attainment | Women with Births | Births / 1,000 Women |
| Less than High School | 0 (0.0%) | 0.0 |
| High School Diploma | 0 (0.0%) | 0.0 |
| College or Associate's Degree | 81 (87.1%) | 162.0 |
| Bachelor's Degree | 12 (12.9%) | 64.0 |
| Graduate Degree | 0 (0.0%) | 0.0 |
| Total | 93 (100.0%) | 91.0 |
Fertility by Education by Marriage Status in Rockwell
87.1% of women with births in Rockwell are unmarried. Women with the educational attainment of bachelor's degree are most likely to be married with 100.0% of them married at childbirth, while women with the educational attainment of college or associate's degree are least likely to be married with 100.0% of them unmarried at childbirth.
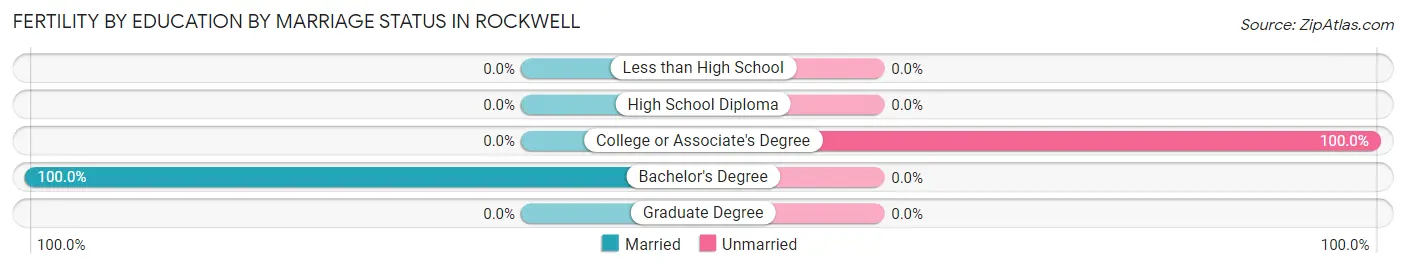
| Educational Attainment | Married | Unmarried |
| Less than High School | 0 (0.0%) | 0 (0.0%) |
| High School Diploma | 0 (0.0%) | 0 (0.0%) |
| College or Associate's Degree | 0 (0.0%) | 81 (100.0%) |
| Bachelor's Degree | 12 (100.0%) | 0 (0.0%) |
| Graduate Degree | 0 (0.0%) | 0 (0.0%) |
| Total | 12 (12.9%) | 81 (87.1%) |
Employment Characteristics in Rockwell
Employment by Class of Employer in Rockwell
Among the 1,729 employed individuals in Rockwell, private company employees (1,119 | 64.7%), not-for-profit organizations (207 | 12.0%), and self-employed (incorporated) (149 | 8.6%) make up the most common classes of employment.
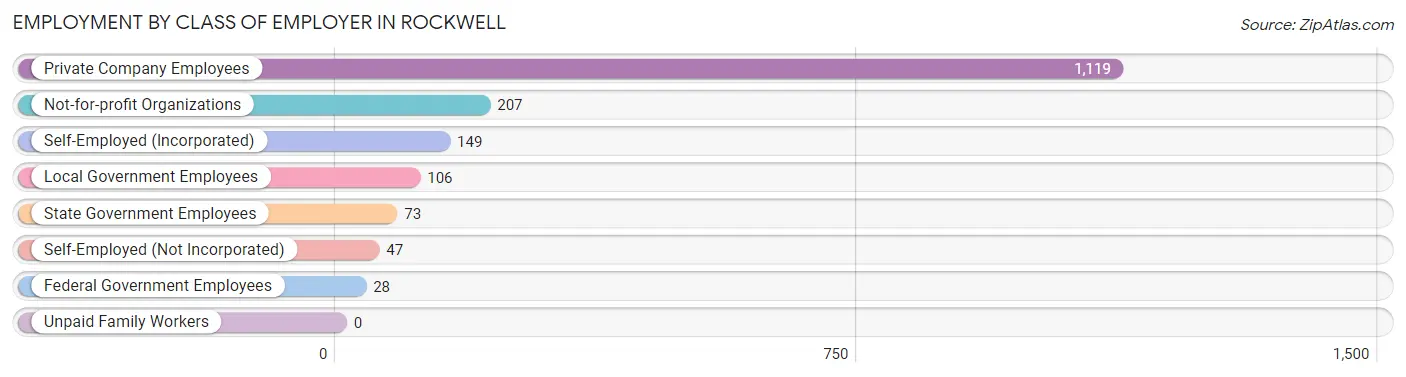
| Employer Class | # Employees | % Employees |
| Private Company Employees | 1,119 | 64.7% |
| Self-Employed (Incorporated) | 149 | 8.6% |
| Self-Employed (Not Incorporated) | 47 | 2.7% |
| Not-for-profit Organizations | 207 | 12.0% |
| Local Government Employees | 106 | 6.1% |
| State Government Employees | 73 | 4.2% |
| Federal Government Employees | 28 | 1.6% |
| Unpaid Family Workers | 0 | 0.0% |
| Total | 1,729 | 100.0% |
Employment Status by Age in Rockwell
According to the labor force statistics for Rockwell, out of the total population over 16 years of age (3,459), 55.5% or 1,920 individuals are in the labor force, with 9.6% or 184 of them unemployed. The age group with the highest labor force participation rate is 20 to 24 years, with 100.0% or 34 individuals in the labor force. Within the labor force, the 30 to 34 years age range has the highest percentage of unemployed individuals, with 53.8% or 49 of them being unemployed.
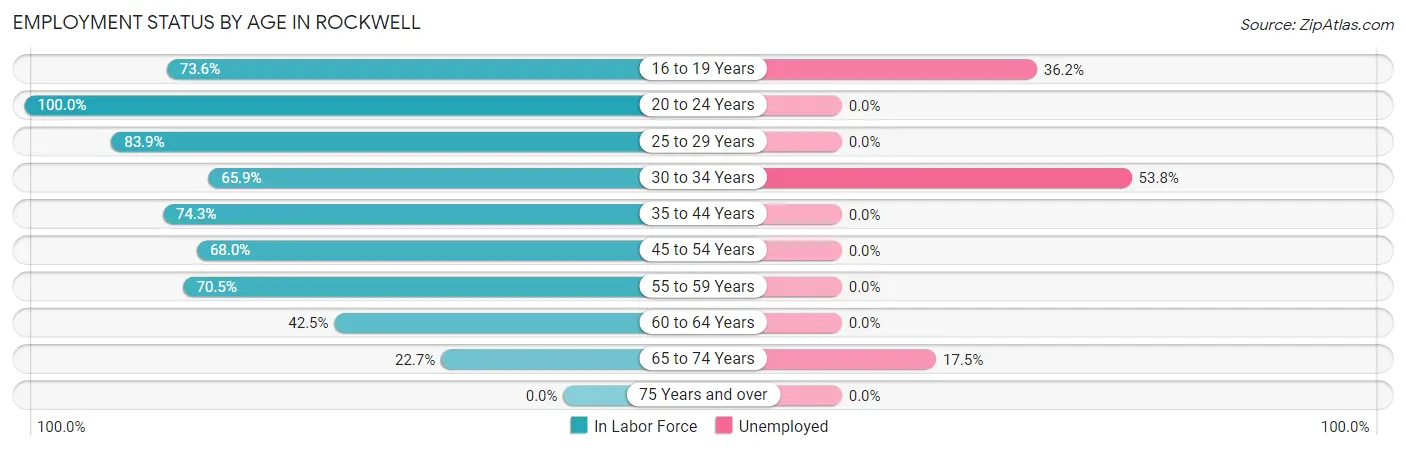
| Age Bracket | In Labor Force | Unemployed |
| 16 to 19 Years | 312 (73.6%) | 113 (36.2%) |
| 20 to 24 Years | 34 (100.0%) | 0 (0.0%) |
| 25 to 29 Years | 297 (83.9%) | 0 (0.0%) |
| 30 to 34 Years | 91 (65.9%) | 49 (53.8%) |
| 35 to 44 Years | 509 (74.3%) | 0 (0.0%) |
| 45 to 54 Years | 244 (68.0%) | 0 (0.0%) |
| 55 to 59 Years | 105 (70.5%) | 0 (0.0%) |
| 60 to 64 Years | 202 (42.5%) | 0 (0.0%) |
| 65 to 74 Years | 126 (22.7%) | 22 (17.5%) |
| 75 Years and over | 0 (0.0%) | 0 (0.0%) |
| Total | 1,920 (55.5%) | 184 (9.6%) |
Employment Status by Educational Attainment in Rockwell
According to labor force statistics for Rockwell, 67.0% of individuals (1,447) out of the total population between 25 and 64 years of age (2,160) are in the labor force, with 3.4% or 49 of them being unemployed. The group with the highest labor force participation rate are those with the educational attainment of less than high school, with 100.0% or 99 individuals in the labor force. Within the labor force, individuals with high school diploma education have the highest percentage of unemployment, with 6.7% or 22 of them being unemployed.
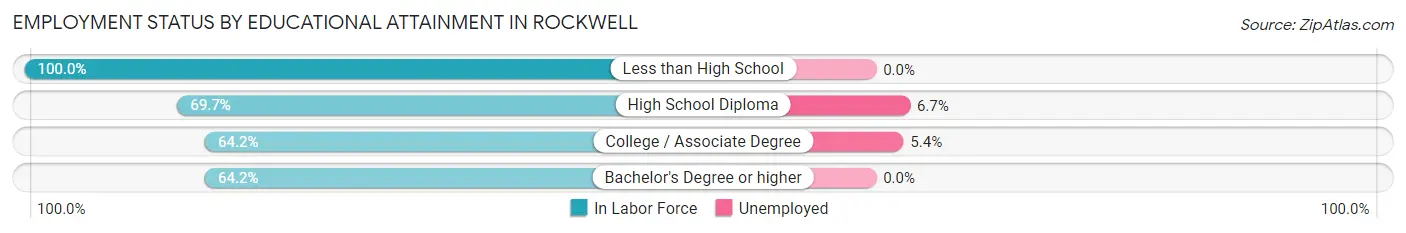
| Educational Attainment | In Labor Force | Unemployed |
| Less than High School | 99 (100.0%) | 0 (0.0%) |
| High School Diploma | 327 (69.7%) | 31 (6.7%) |
| College / Associate Degree | 503 (64.2%) | 42 (5.4%) |
| Bachelor's Degree or higher | 519 (64.2%) | 0 (0.0%) |
| Total | 1,447 (67.0%) | 73 (3.4%) |
Employment Occupations by Sex in Rockwell
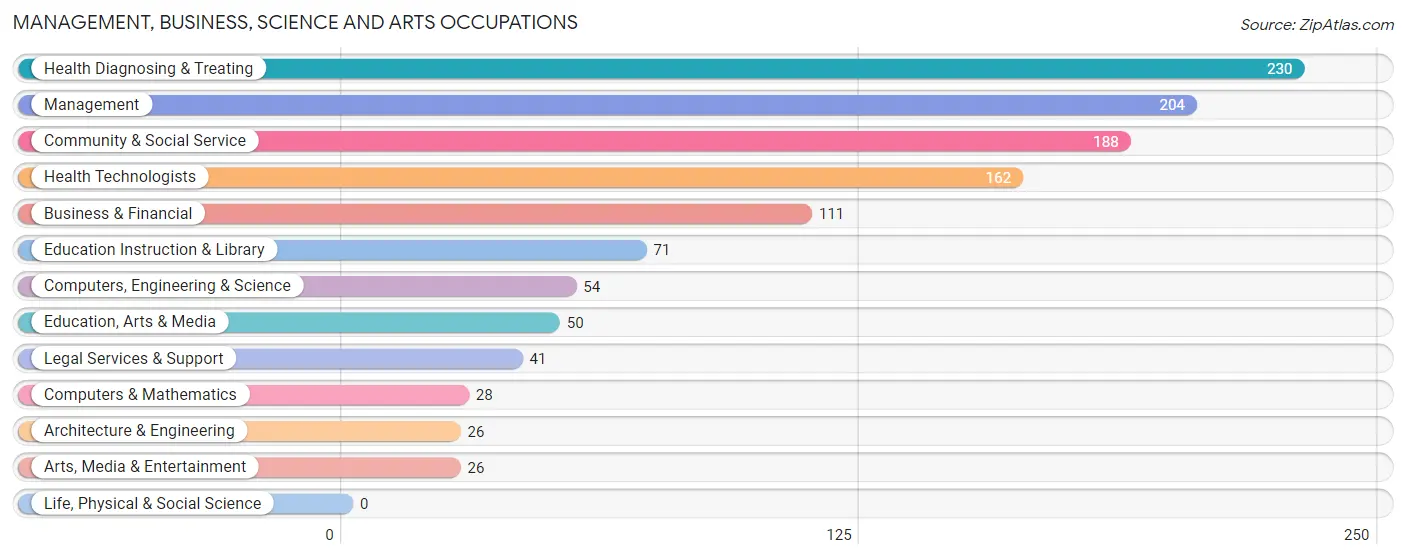
Management, Business, Science and Arts Occupations
The most common Management, Business, Science and Arts occupations in Rockwell are Health Diagnosing & Treating (230 | 13.3%), Management (204 | 11.7%), Community & Social Service (188 | 10.8%), Health Technologists (162 | 9.3%), and Business & Financial (111 | 6.4%).
Management, Business, Science and Arts Occupations by Sex
Within the Management, Business, Science and Arts occupations in Rockwell, the most male-oriented occupations are Computers, Engineering & Science (100.0%), Computers & Mathematics (100.0%), and Architecture & Engineering (100.0%), while the most female-oriented occupations are Education Instruction & Library (100.0%), Arts, Media & Entertainment (100.0%), and Community & Social Service (60.1%).
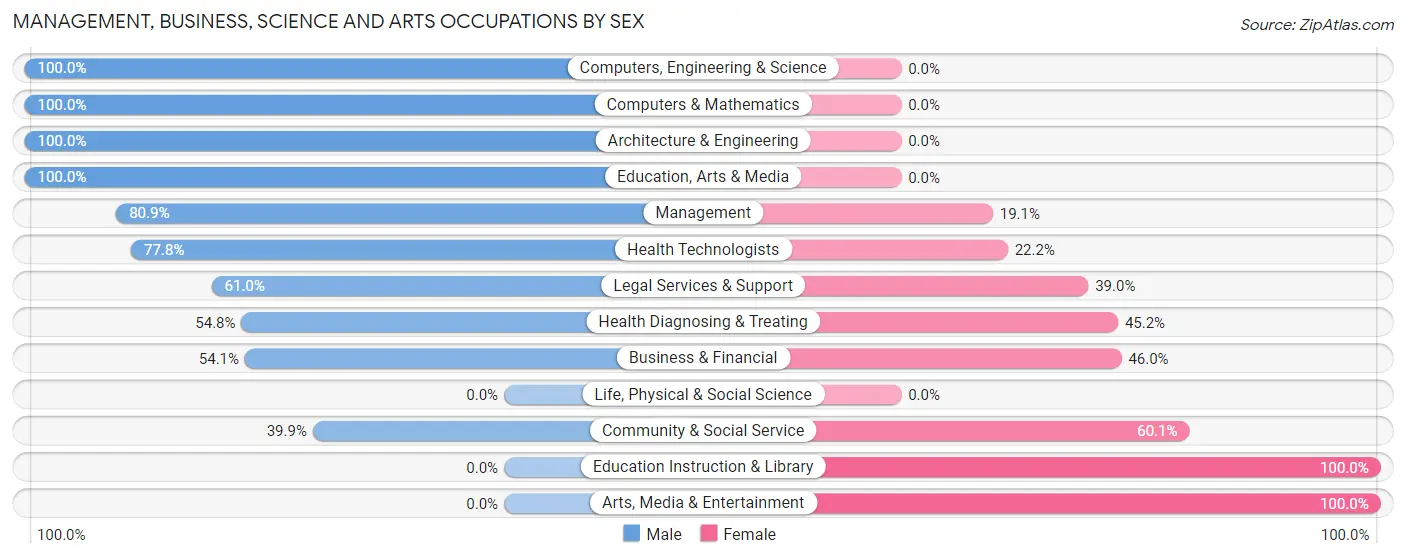
| Occupation | Male | Female |
| Management | 165 (80.9%) | 39 (19.1%) |
| Business & Financial | 60 (54.0%) | 51 (46.0%) |
| Computers, Engineering & Science | 54 (100.0%) | 0 (0.0%) |
| Computers & Mathematics | 28 (100.0%) | 0 (0.0%) |
| Architecture & Engineering | 26 (100.0%) | 0 (0.0%) |
| Life, Physical & Social Science | 0 (0.0%) | 0 (0.0%) |
| Community & Social Service | 75 (39.9%) | 113 (60.1%) |
| Education, Arts & Media | 50 (100.0%) | 0 (0.0%) |
| Legal Services & Support | 25 (61.0%) | 16 (39.0%) |
| Education Instruction & Library | 0 (0.0%) | 71 (100.0%) |
| Arts, Media & Entertainment | 0 (0.0%) | 26 (100.0%) |
| Health Diagnosing & Treating | 126 (54.8%) | 104 (45.2%) |
| Health Technologists | 126 (77.8%) | 36 (22.2%) |
| Total (Category) | 480 (61.0%) | 307 (39.0%) |
| Total (Overall) | 885 (51.0%) | 851 (49.0%) |
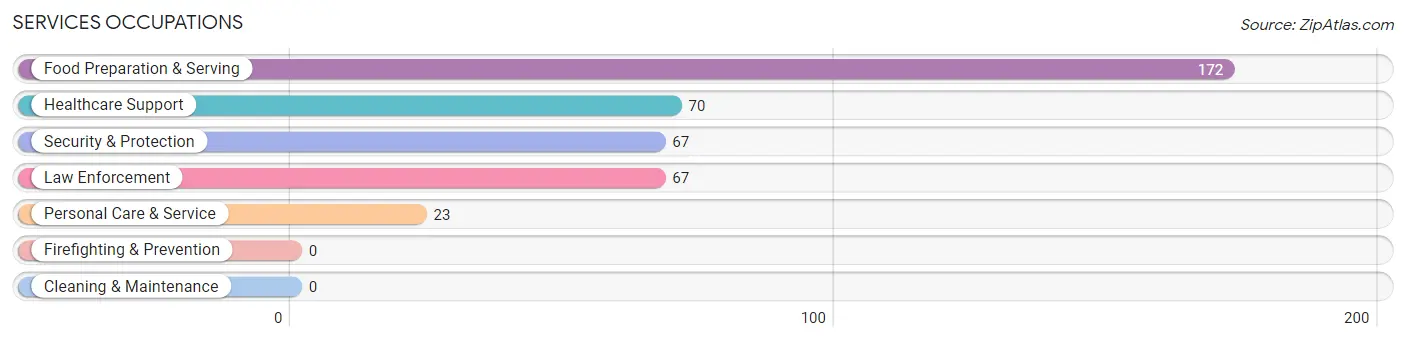
Services Occupations
The most common Services occupations in Rockwell are Food Preparation & Serving (172 | 9.9%), Healthcare Support (70 | 4.0%), Security & Protection (67 | 3.9%), Law Enforcement (67 | 3.9%), and Personal Care & Service (23 | 1.3%).
Services Occupations by Sex
Within the Services occupations in Rockwell, the most male-oriented occupations are Food Preparation & Serving (54.6%), Security & Protection (19.4%), and Law Enforcement (19.4%), while the most female-oriented occupations are Healthcare Support (100.0%), Personal Care & Service (100.0%), and Security & Protection (80.6%).
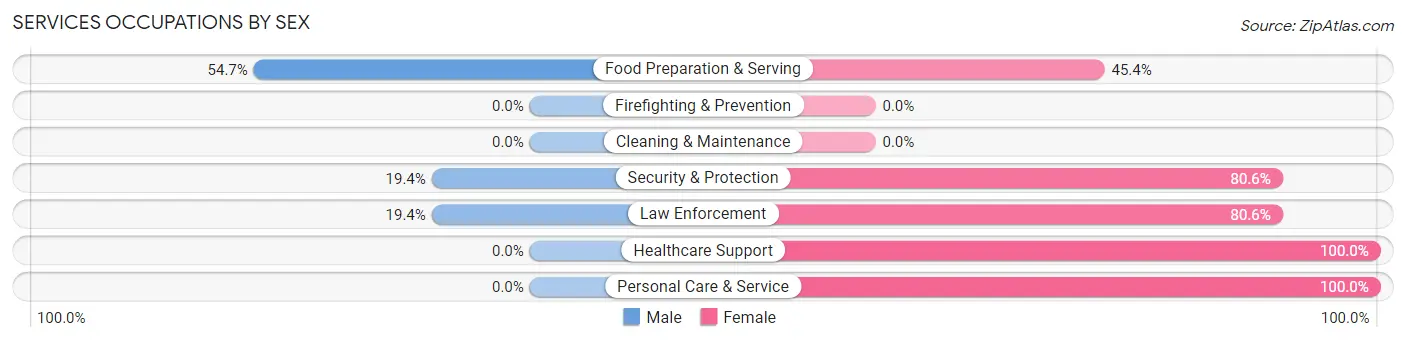
| Occupation | Male | Female |
| Healthcare Support | 0 (0.0%) | 70 (100.0%) |
| Security & Protection | 13 (19.4%) | 54 (80.6%) |
| Firefighting & Prevention | 0 (0.0%) | 0 (0.0%) |
| Law Enforcement | 13 (19.4%) | 54 (80.6%) |
| Food Preparation & Serving | 94 (54.6%) | 78 (45.4%) |
| Cleaning & Maintenance | 0 (0.0%) | 0 (0.0%) |
| Personal Care & Service | 0 (0.0%) | 23 (100.0%) |
| Total (Category) | 107 (32.2%) | 225 (67.8%) |
| Total (Overall) | 885 (51.0%) | 851 (49.0%) |
Sales and Office Occupations
The most common Sales and Office occupations in Rockwell are Office & Administration (197 | 11.4%), and Sales & Related (162 | 9.3%).
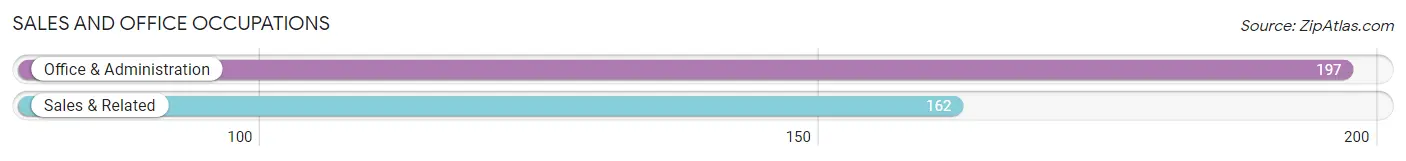
Sales and Office Occupations by Sex

| Occupation | Male | Female |
| Sales & Related | 54 (33.3%) | 108 (66.7%) |
| Office & Administration | 37 (18.8%) | 160 (81.2%) |
| Total (Category) | 91 (25.4%) | 268 (74.7%) |
| Total (Overall) | 885 (51.0%) | 851 (49.0%) |
Natural Resources, Construction and Maintenance Occupations
The most common Natural Resources, Construction and Maintenance occupations in Rockwell are Construction & Extraction (92 | 5.3%), and Installation, Maintenance & Repair (38 | 2.2%).
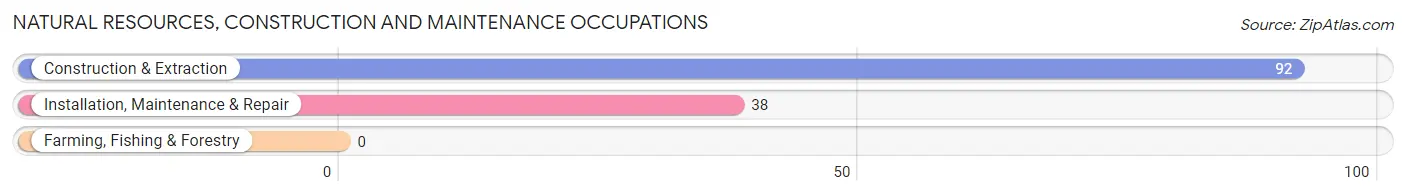
Natural Resources, Construction and Maintenance Occupations by Sex
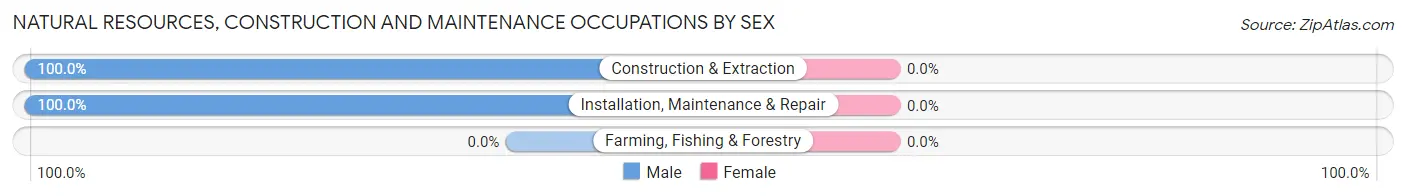
| Occupation | Male | Female |
| Farming, Fishing & Forestry | 0 (0.0%) | 0 (0.0%) |
| Construction & Extraction | 92 (100.0%) | 0 (0.0%) |
| Installation, Maintenance & Repair | 38 (100.0%) | 0 (0.0%) |
| Total (Category) | 130 (100.0%) | 0 (0.0%) |
| Total (Overall) | 885 (51.0%) | 851 (49.0%) |
Production, Transportation and Moving Occupations
The most common Production, Transportation and Moving occupations in Rockwell are Material Moving (80 | 4.6%), and Production (48 | 2.8%).
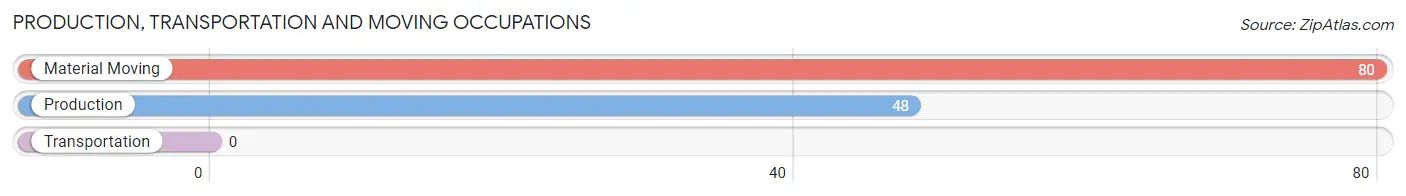
Production, Transportation and Moving Occupations by Sex
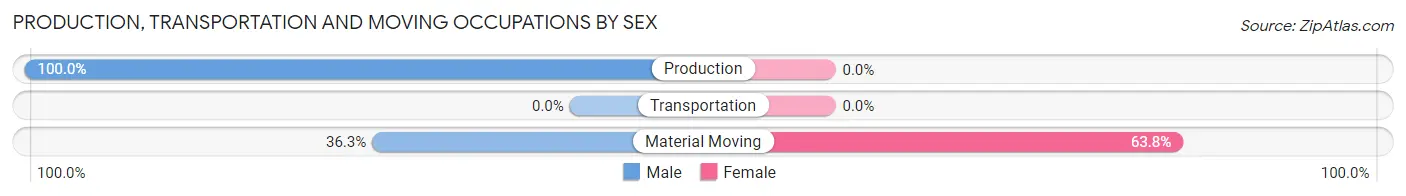
| Occupation | Male | Female |
| Production | 48 (100.0%) | 0 (0.0%) |
| Transportation | 0 (0.0%) | 0 (0.0%) |
| Material Moving | 29 (36.2%) | 51 (63.7%) |
| Total (Category) | 77 (60.2%) | 51 (39.8%) |
| Total (Overall) | 885 (51.0%) | 851 (49.0%) |
Employment Industries by Sex in Rockwell
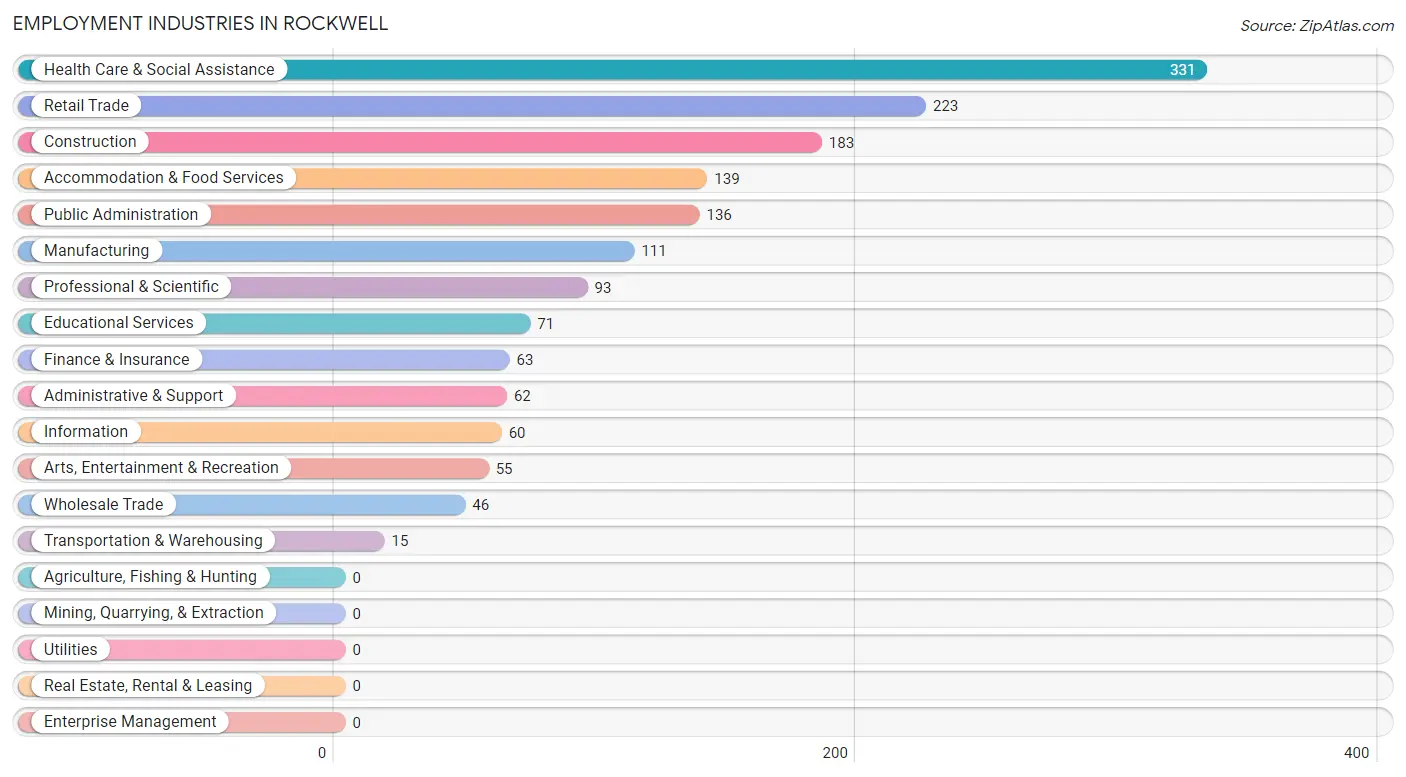
Employment Industries in Rockwell
The major employment industries in Rockwell include Health Care & Social Assistance (331 | 19.1%), Retail Trade (223 | 12.9%), Construction (183 | 10.5%), Accommodation & Food Services (139 | 8.0%), and Public Administration (136 | 7.8%).
Employment Industries by Sex in Rockwell
The Rockwell industries that see more men than women are Transportation & Warehousing (100.0%), Information (100.0%), and Professional & Scientific (82.8%), whereas the industries that tend to have a higher number of women are Administrative & Support (100.0%), Educational Services (100.0%), and Public Administration (72.1%).
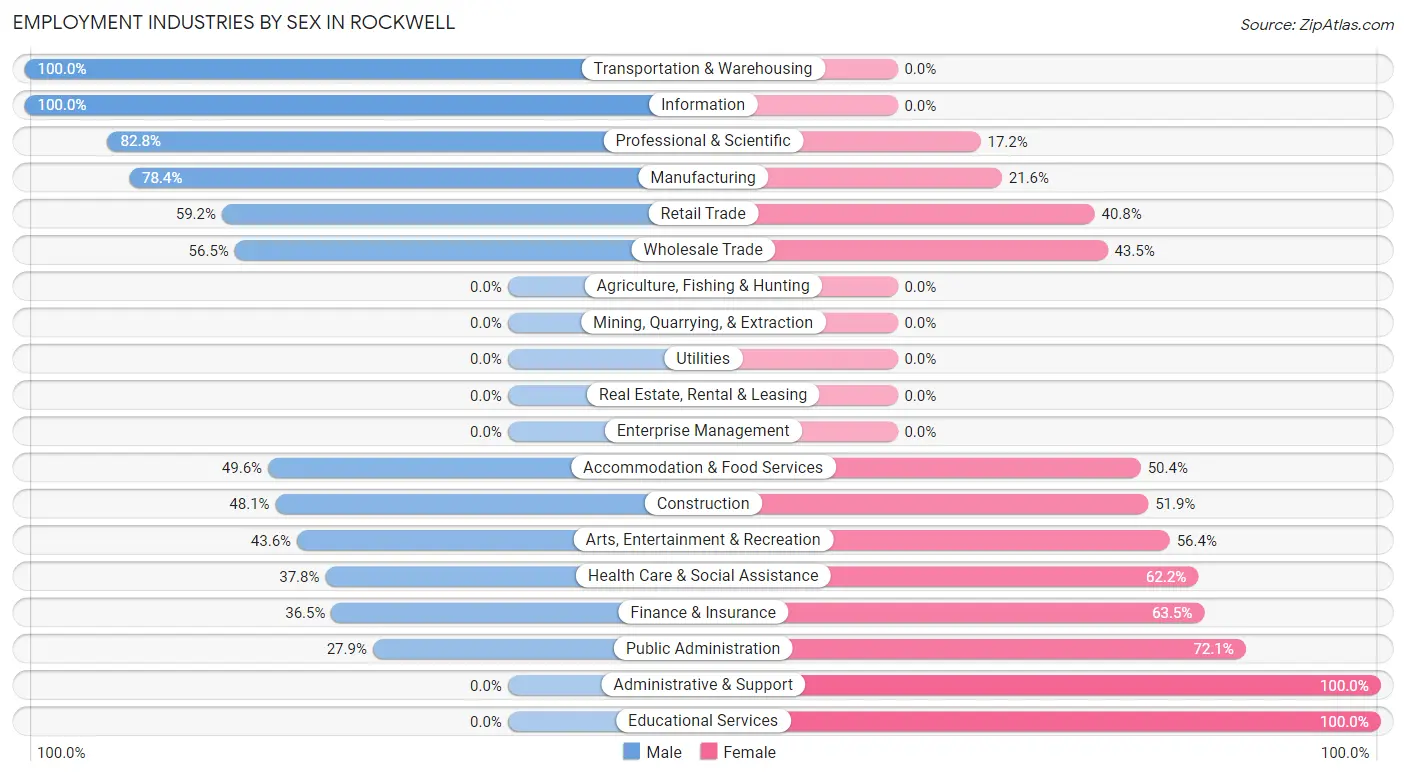
| Industry | Male | Female |
| Agriculture, Fishing & Hunting | 0 (0.0%) | 0 (0.0%) |
| Mining, Quarrying, & Extraction | 0 (0.0%) | 0 (0.0%) |
| Construction | 88 (48.1%) | 95 (51.9%) |
| Manufacturing | 87 (78.4%) | 24 (21.6%) |
| Wholesale Trade | 26 (56.5%) | 20 (43.5%) |
| Retail Trade | 132 (59.2%) | 91 (40.8%) |
| Transportation & Warehousing | 15 (100.0%) | 0 (0.0%) |
| Utilities | 0 (0.0%) | 0 (0.0%) |
| Information | 60 (100.0%) | 0 (0.0%) |
| Finance & Insurance | 23 (36.5%) | 40 (63.5%) |
| Real Estate, Rental & Leasing | 0 (0.0%) | 0 (0.0%) |
| Professional & Scientific | 77 (82.8%) | 16 (17.2%) |
| Enterprise Management | 0 (0.0%) | 0 (0.0%) |
| Administrative & Support | 0 (0.0%) | 62 (100.0%) |
| Educational Services | 0 (0.0%) | 71 (100.0%) |
| Health Care & Social Assistance | 125 (37.8%) | 206 (62.2%) |
| Arts, Entertainment & Recreation | 24 (43.6%) | 31 (56.4%) |
| Accommodation & Food Services | 69 (49.6%) | 70 (50.4%) |
| Public Administration | 38 (27.9%) | 98 (72.1%) |
| Total | 885 (51.0%) | 851 (49.0%) |
Education in Rockwell
School Enrollment in Rockwell
The most common levels of schooling among the 963 students in Rockwell are high school (294 | 30.5%), middle school (237 | 24.6%), and elementary school (184 | 19.1%).
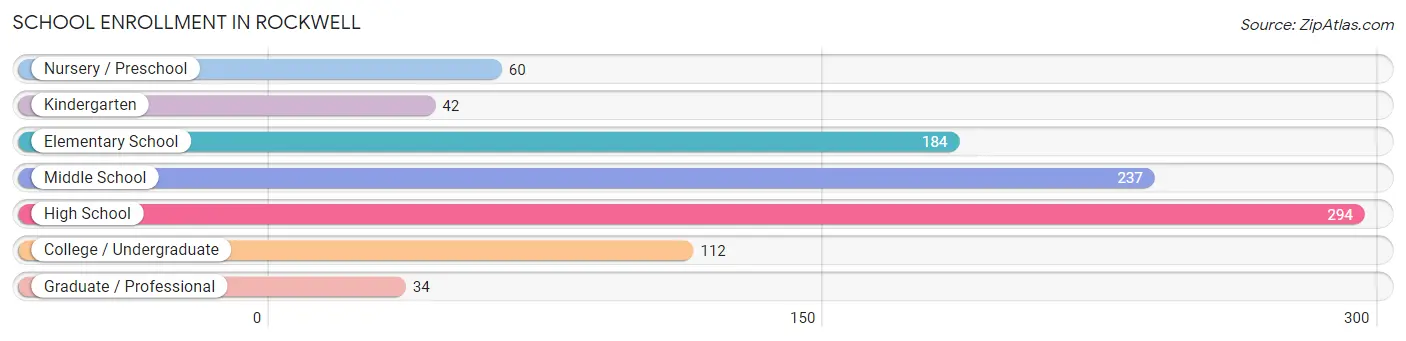
| School Level | # Students | % Students |
| Nursery / Preschool | 60 | 6.2% |
| Kindergarten | 42 | 4.4% |
| Elementary School | 184 | 19.1% |
| Middle School | 237 | 24.6% |
| High School | 294 | 30.5% |
| College / Undergraduate | 112 | 11.6% |
| Graduate / Professional | 34 | 3.5% |
| Total | 963 | 100.0% |
School Enrollment by Age by Funding Source in Rockwell
Out of a total of 963 students who are enrolled in schools in Rockwell, 140 (14.5%) attend a private institution, while the remaining 823 (85.5%) are enrolled in public schools. The age group of 20 to 24 year olds has the highest likelihood of being enrolled in private schools, with 34 (100.0% in the age bracket) enrolled. Conversely, the age group of 15 to 17 year olds has the lowest likelihood of being enrolled in a private school, with 262 (100.0% in the age bracket) attending a public institution.
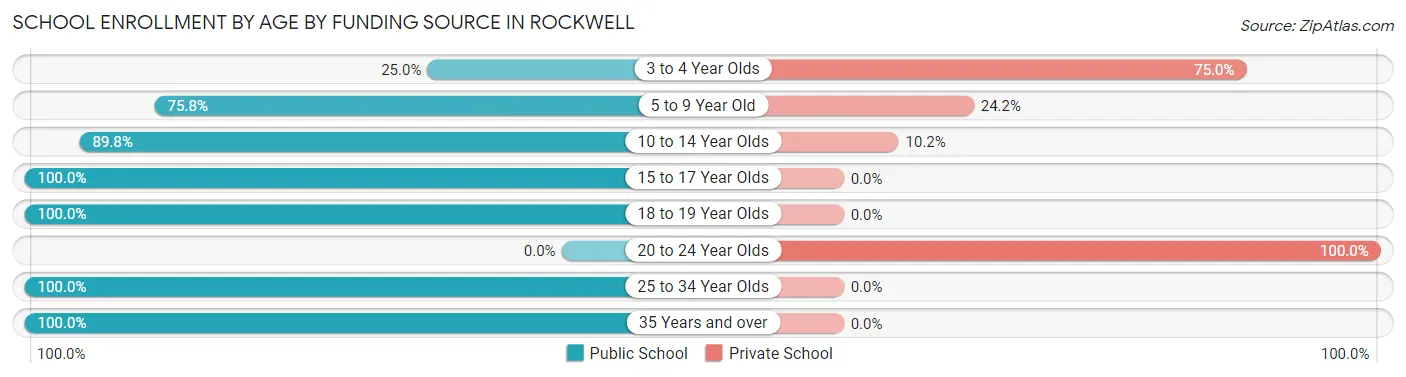
| Age Bracket | Public School | Private School |
| 3 to 4 Year Olds | 8 (25.0%) | 24 (75.0%) |
| 5 to 9 Year Old | 172 (75.8%) | 55 (24.2%) |
| 10 to 14 Year Olds | 237 (89.8%) | 27 (10.2%) |
| 15 to 17 Year Olds | 262 (100.0%) | 0 (0.0%) |
| 18 to 19 Year Olds | 57 (100.0%) | 0 (0.0%) |
| 20 to 24 Year Olds | 0 (0.0%) | 34 (100.0%) |
| 25 to 34 Year Olds | 44 (100.0%) | 0 (0.0%) |
| 35 Years and over | 43 (100.0%) | 0 (0.0%) |
| Total | 823 (85.5%) | 140 (14.5%) |
Educational Attainment by Field of Study in Rockwell
Education (235 | 20.1%), science & technology (152 | 13.0%), liberal arts & history (141 | 12.1%), business (127 | 10.9%), and social sciences (88 | 7.5%) are the most common fields of study among 1,169 individuals in Rockwell who have obtained a bachelor's degree or higher.
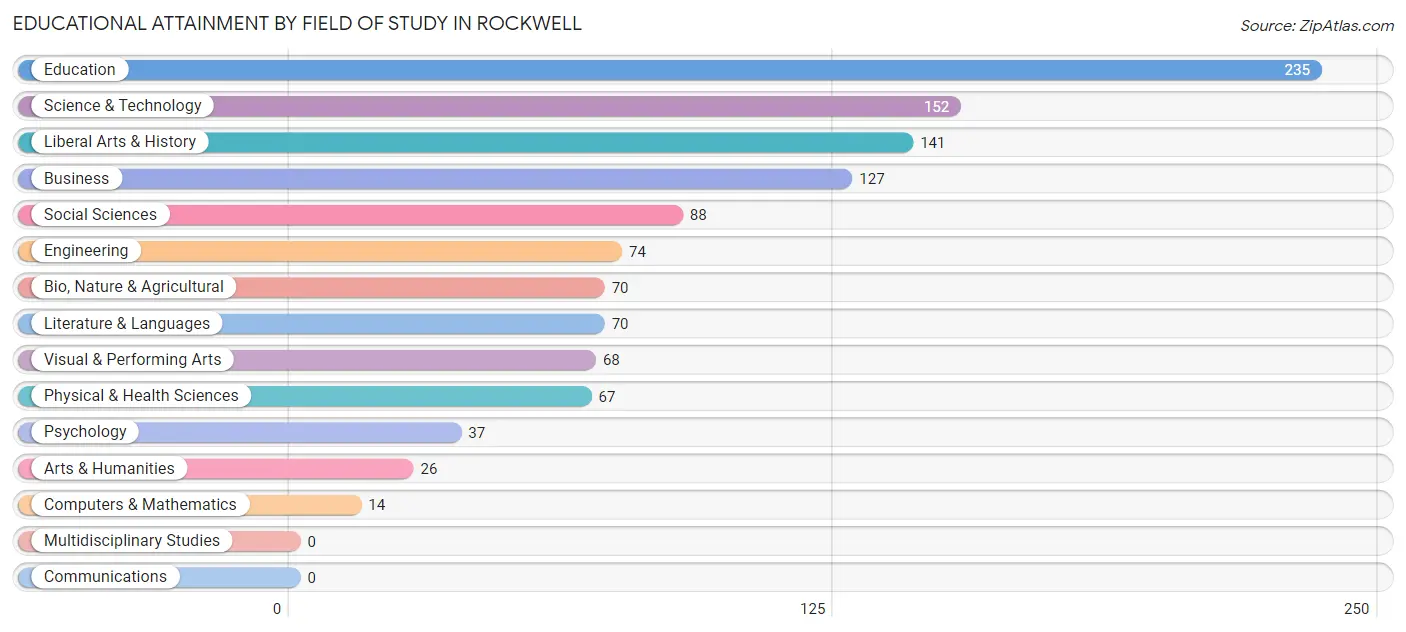
| Field of Study | # Graduates | % Graduates |
| Computers & Mathematics | 14 | 1.2% |
| Bio, Nature & Agricultural | 70 | 6.0% |
| Physical & Health Sciences | 67 | 5.7% |
| Psychology | 37 | 3.2% |
| Social Sciences | 88 | 7.5% |
| Engineering | 74 | 6.3% |
| Multidisciplinary Studies | 0 | 0.0% |
| Science & Technology | 152 | 13.0% |
| Business | 127 | 10.9% |
| Education | 235 | 20.1% |
| Literature & Languages | 70 | 6.0% |
| Liberal Arts & History | 141 | 12.1% |
| Visual & Performing Arts | 68 | 5.8% |
| Communications | 0 | 0.0% |
| Arts & Humanities | 26 | 2.2% |
| Total | 1,169 | 100.0% |
Transportation & Commute in Rockwell
Vehicle Availability by Sex in Rockwell
The most prevalent vehicle ownership categories in Rockwell are males with 2 vehicles (401, accounting for 45.3%) and females with 2 vehicles (381, making up 47.5%).
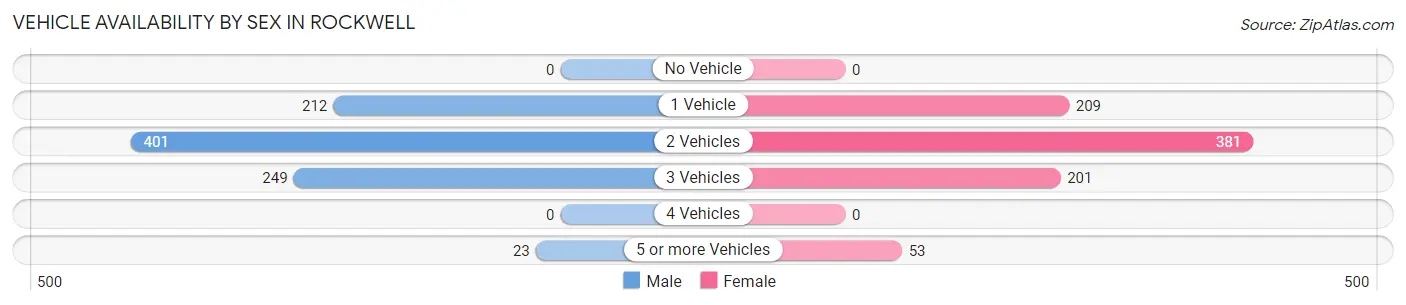
| Vehicles Available | Male | Female |
| No Vehicle | 0 (0.0%) | 0 (0.0%) |
| 1 Vehicle | 212 (23.9%) | 209 (24.8%) |
| 2 Vehicles | 401 (45.3%) | 381 (45.1%) |
| 3 Vehicles | 249 (28.1%) | 201 (23.8%) |
| 4 Vehicles | 0 (0.0%) | 0 (0.0%) |
| 5 or more Vehicles | 23 (2.6%) | 53 (6.3%) |
| Total | 885 (100.0%) | 844 (100.0%) |
Commute Time in Rockwell
The most frequently occuring commute durations in Rockwell are 15 to 19 minutes (454 commuters, 27.8%), 10 to 14 minutes (373 commuters, 22.9%), and 5 to 9 minutes (299 commuters, 18.3%).
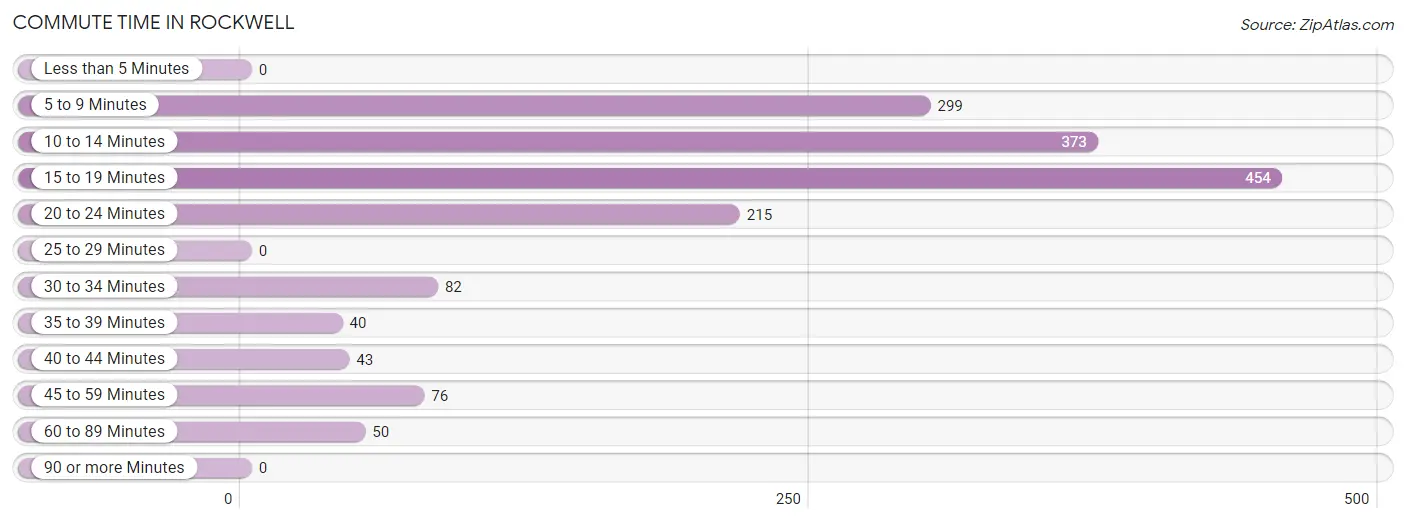
| Commute Time | # Commuters | % Commuters |
| Less than 5 Minutes | 0 | 0.0% |
| 5 to 9 Minutes | 299 | 18.3% |
| 10 to 14 Minutes | 373 | 22.9% |
| 15 to 19 Minutes | 454 | 27.8% |
| 20 to 24 Minutes | 215 | 13.2% |
| 25 to 29 Minutes | 0 | 0.0% |
| 30 to 34 Minutes | 82 | 5.0% |
| 35 to 39 Minutes | 40 | 2.5% |
| 40 to 44 Minutes | 43 | 2.6% |
| 45 to 59 Minutes | 76 | 4.7% |
| 60 to 89 Minutes | 50 | 3.1% |
| 90 or more Minutes | 0 | 0.0% |
Commute Time by Sex in Rockwell
The most common commute times in Rockwell are 15 to 19 minutes (304 commuters, 35.5%) for males and 5 to 9 minutes (183 commuters, 23.6%) for females.
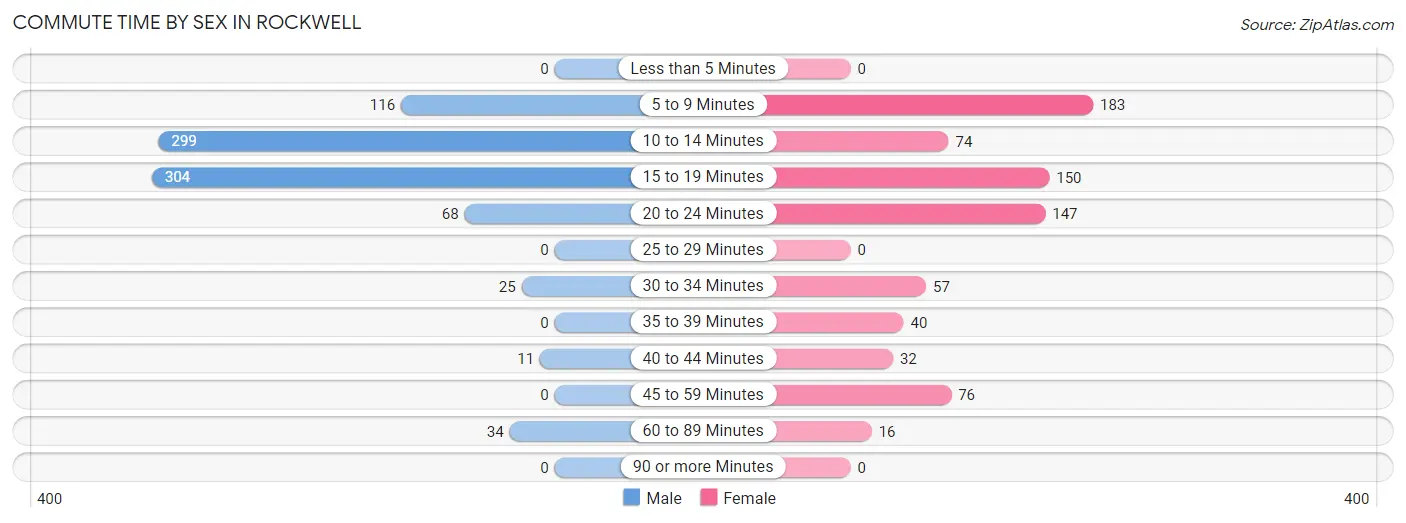
| Commute Time | Male | Female |
| Less than 5 Minutes | 0 (0.0%) | 0 (0.0%) |
| 5 to 9 Minutes | 116 (13.5%) | 183 (23.6%) |
| 10 to 14 Minutes | 299 (34.9%) | 74 (9.6%) |
| 15 to 19 Minutes | 304 (35.5%) | 150 (19.4%) |
| 20 to 24 Minutes | 68 (7.9%) | 147 (19.0%) |
| 25 to 29 Minutes | 0 (0.0%) | 0 (0.0%) |
| 30 to 34 Minutes | 25 (2.9%) | 57 (7.3%) |
| 35 to 39 Minutes | 0 (0.0%) | 40 (5.2%) |
| 40 to 44 Minutes | 11 (1.3%) | 32 (4.1%) |
| 45 to 59 Minutes | 0 (0.0%) | 76 (9.8%) |
| 60 to 89 Minutes | 34 (4.0%) | 16 (2.1%) |
| 90 or more Minutes | 0 (0.0%) | 0 (0.0%) |
Time of Departure to Work by Sex in Rockwell
The most frequent times of departure to work in Rockwell are 7:30 AM to 7:59 AM (218, 25.4%) for males and 7:00 AM to 7:29 AM (171, 22.1%) for females.
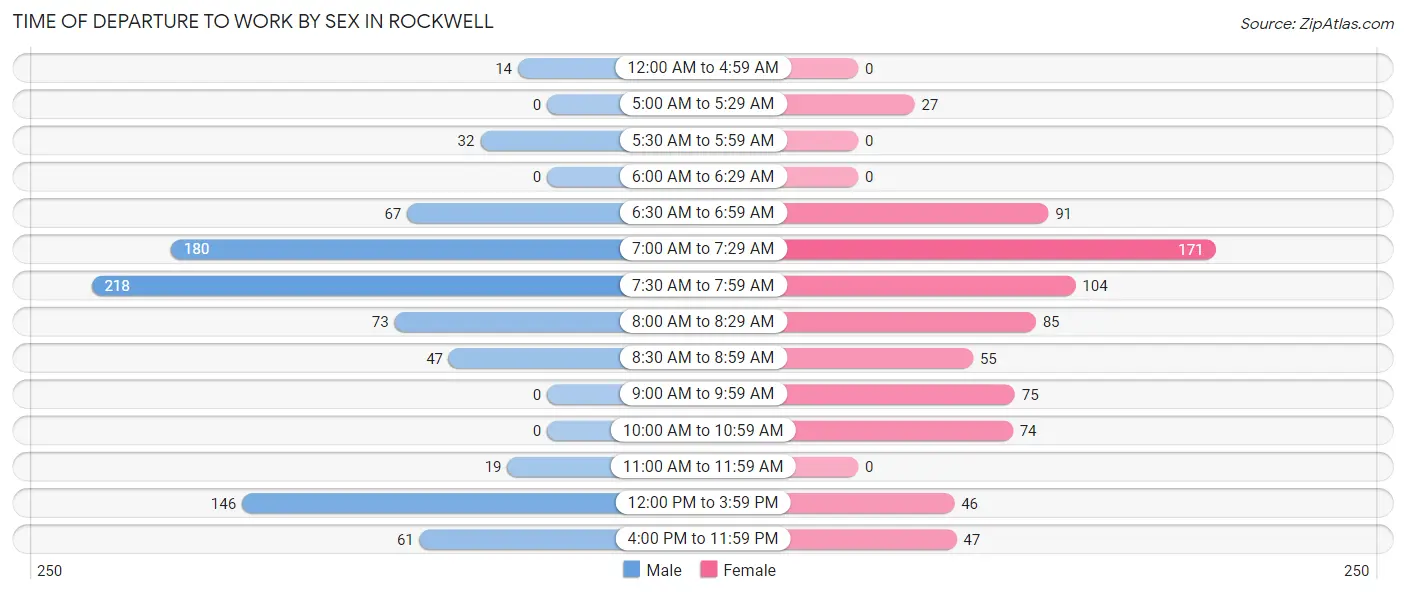
| Time of Departure | Male | Female |
| 12:00 AM to 4:59 AM | 14 (1.6%) | 0 (0.0%) |
| 5:00 AM to 5:29 AM | 0 (0.0%) | 27 (3.5%) |
| 5:30 AM to 5:59 AM | 32 (3.7%) | 0 (0.0%) |
| 6:00 AM to 6:29 AM | 0 (0.0%) | 0 (0.0%) |
| 6:30 AM to 6:59 AM | 67 (7.8%) | 91 (11.7%) |
| 7:00 AM to 7:29 AM | 180 (21.0%) | 171 (22.1%) |
| 7:30 AM to 7:59 AM | 218 (25.4%) | 104 (13.4%) |
| 8:00 AM to 8:29 AM | 73 (8.5%) | 85 (11.0%) |
| 8:30 AM to 8:59 AM | 47 (5.5%) | 55 (7.1%) |
| 9:00 AM to 9:59 AM | 0 (0.0%) | 75 (9.7%) |
| 10:00 AM to 10:59 AM | 0 (0.0%) | 74 (9.6%) |
| 11:00 AM to 11:59 AM | 19 (2.2%) | 0 (0.0%) |
| 12:00 PM to 3:59 PM | 146 (17.0%) | 46 (5.9%) |
| 4:00 PM to 11:59 PM | 61 (7.1%) | 47 (6.1%) |
| Total | 857 (100.0%) | 775 (100.0%) |
Housing Occupancy in Rockwell
Occupancy by Ownership in Rockwell
Of the total 1,772 dwellings in Rockwell, owner-occupied units account for 1,236 (69.8%), while renter-occupied units make up 536 (30.2%).
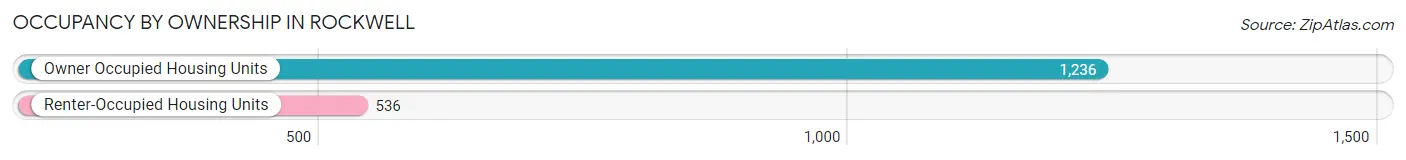
| Occupancy | # Housing Units | % Housing Units |
| Owner Occupied Housing Units | 1,236 | 69.8% |
| Renter-Occupied Housing Units | 536 | 30.2% |
| Total Occupied Housing Units | 1,772 | 100.0% |
Occupancy by Household Size in Rockwell
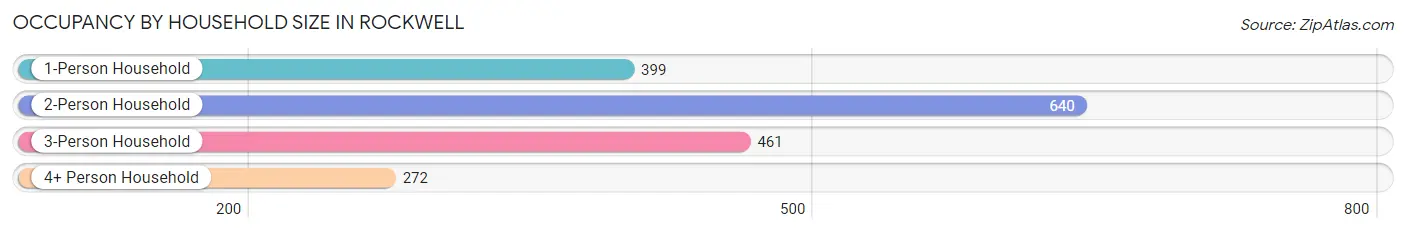
| Household Size | # Housing Units | % Housing Units |
| 1-Person Household | 399 | 22.5% |
| 2-Person Household | 640 | 36.1% |
| 3-Person Household | 461 | 26.0% |
| 4+ Person Household | 272 | 15.3% |
| Total Housing Units | 1,772 | 100.0% |
Occupancy by Ownership by Household Size in Rockwell
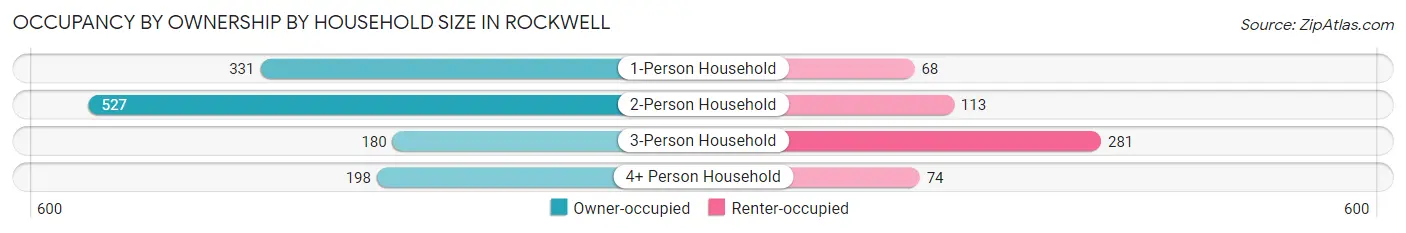
| Household Size | Owner-occupied | Renter-occupied |
| 1-Person Household | 331 (83.0%) | 68 (17.0%) |
| 2-Person Household | 527 (82.3%) | 113 (17.7%) |
| 3-Person Household | 180 (39.1%) | 281 (61.0%) |
| 4+ Person Household | 198 (72.8%) | 74 (27.2%) |
| Total Housing Units | 1,236 (69.8%) | 536 (30.2%) |
Occupancy by Educational Attainment in Rockwell
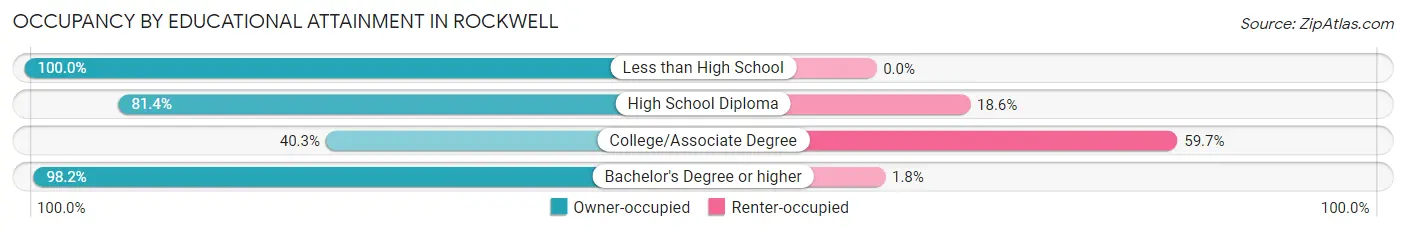
| Household Size | Owner-occupied | Renter-occupied |
| Less than High School | 10 (100.0%) | 0 (0.0%) |
| High School Diploma | 306 (81.4%) | 70 (18.6%) |
| College/Associate Degree | 307 (40.3%) | 455 (59.7%) |
| Bachelor's Degree or higher | 613 (98.2%) | 11 (1.8%) |
Occupancy by Age of Householder in Rockwell
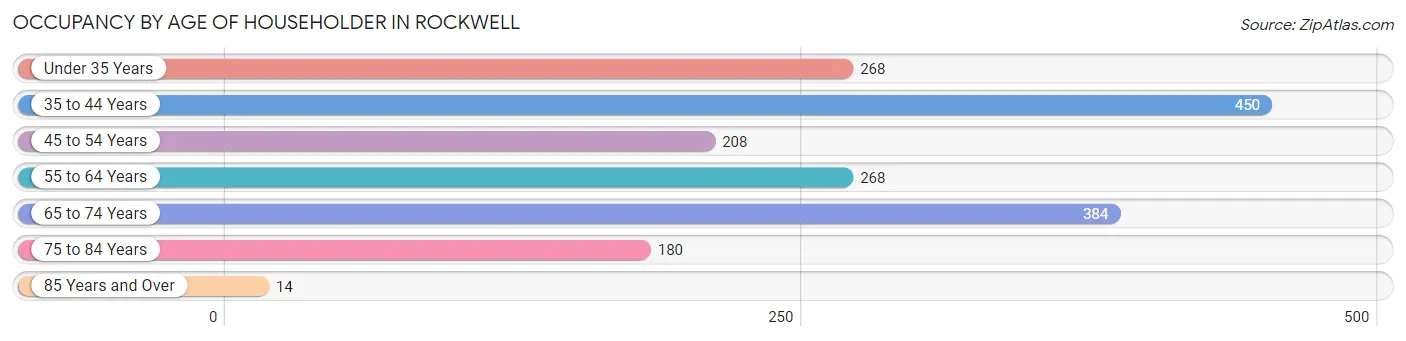
| Age Bracket | # Households | % Households |
| Under 35 Years | 268 | 15.1% |
| 35 to 44 Years | 450 | 25.4% |
| 45 to 54 Years | 208 | 11.7% |
| 55 to 64 Years | 268 | 15.1% |
| 65 to 74 Years | 384 | 21.7% |
| 75 to 84 Years | 180 | 10.2% |
| 85 Years and Over | 14 | 0.8% |
| Total | 1,772 | 100.0% |
Housing Finances in Rockwell
Median Income by Occupancy in Rockwell
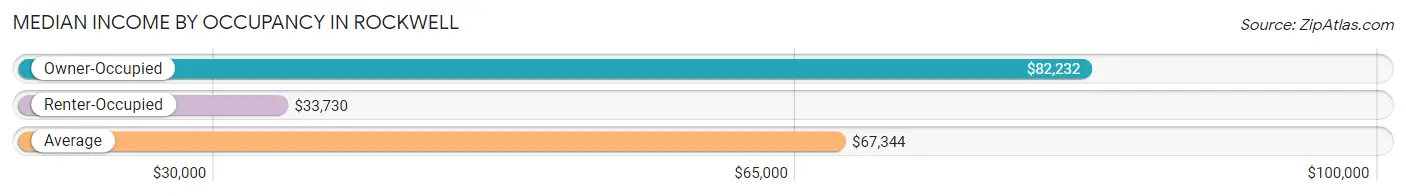
| Occupancy Type | # Households | Median Income |
| Owner-Occupied | 1,236 (69.8%) | $82,232 |
| Renter-Occupied | 536 (30.2%) | $33,730 |
| Average | 1,772 (100.0%) | $67,344 |
Occupancy by Householder Income Bracket in Rockwell
| Income Bracket | Owner-occupied | Renter-occupied |
| Less than $5,000 | 48 (3.9%) | 85 (15.9%) |
| $5,000 to $9,999 | 0 (0.0%) | 0 (0.0%) |
| $10,000 to $14,999 | 42 (3.4%) | 81 (15.1%) |
| $15,000 to $19,999 | 103 (8.3%) | 49 (9.1%) |
| $20,000 to $24,999 | 22 (1.8%) | 0 (0.0%) |
| $25,000 to $34,999 | 47 (3.8%) | 84 (15.7%) |
| $35,000 to $49,999 | 84 (6.8%) | 90 (16.8%) |
| $50,000 to $74,999 | 141 (11.4%) | 131 (24.4%) |
| $75,000 to $99,999 | 299 (24.2%) | 16 (3.0%) |
| $100,000 to $149,999 | 245 (19.8%) | 0 (0.0%) |
| $150,000 or more | 205 (16.6%) | 0 (0.0%) |
| Total | 1,236 (100.0%) | 536 (100.0%) |
Monthly Housing Cost Tiers in Rockwell
| Monthly Cost | Owner-occupied | Renter-occupied |
| Less than $300 | 23 (1.9%) | 0 (0.0%) |
| $300 to $499 | 240 (19.4%) | 0 (0.0%) |
| $500 to $799 | 241 (19.5%) | 27 (5.0%) |
| $800 to $999 | 31 (2.5%) | 203 (37.9%) |
| $1,000 to $1,499 | 309 (25.0%) | 237 (44.2%) |
| $1,500 to $1,999 | 172 (13.9%) | 27 (5.0%) |
| $2,000 to $2,499 | 176 (14.2%) | 0 (0.0%) |
| $2,500 to $2,999 | 35 (2.8%) | 0 (0.0%) |
| $3,000 or more | 9 (0.7%) | 0 (0.0%) |
| Total | 1,236 (100.0%) | 536 (100.0%) |
Physical Housing Characteristics in Rockwell
Housing Structures in Rockwell
| Structure Type | # Housing Units | % Housing Units |
| Single Unit, Detached | 1,313 | 74.1% |
| Single Unit, Attached | 49 | 2.8% |
| 2 Unit Apartments | 0 | 0.0% |
| 3 or 4 Unit Apartments | 87 | 4.9% |
| 5 to 9 Unit Apartments | 34 | 1.9% |
| 10 or more Apartments | 263 | 14.8% |
| Mobile Home / Other | 26 | 1.5% |
| Total | 1,772 | 100.0% |
Housing Structures by Occupancy in Rockwell
| Structure Type | Owner-occupied | Renter-occupied |
| Single Unit, Detached | 1,169 (89.0%) | 144 (11.0%) |
| Single Unit, Attached | 0 (0.0%) | 49 (100.0%) |
| 2 Unit Apartments | 0 (0.0%) | 0 (0.0%) |
| 3 or 4 Unit Apartments | 0 (0.0%) | 87 (100.0%) |
| 5 to 9 Unit Apartments | 0 (0.0%) | 34 (100.0%) |
| 10 or more Apartments | 67 (25.5%) | 196 (74.5%) |
| Mobile Home / Other | 0 (0.0%) | 26 (100.0%) |
| Total | 1,236 (69.8%) | 536 (30.2%) |
Housing Structures by Number of Rooms in Rockwell
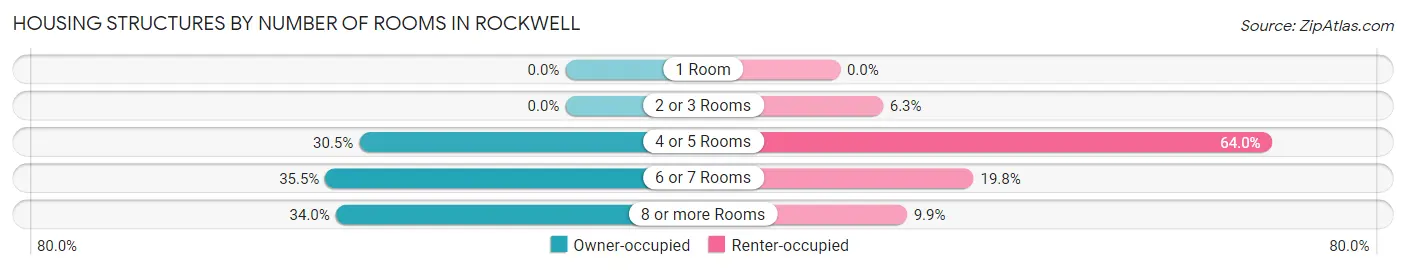
| Number of Rooms | Owner-occupied | Renter-occupied |
| 1 Room | 0 (0.0%) | 0 (0.0%) |
| 2 or 3 Rooms | 0 (0.0%) | 34 (6.3%) |
| 4 or 5 Rooms | 377 (30.5%) | 343 (64.0%) |
| 6 or 7 Rooms | 439 (35.5%) | 106 (19.8%) |
| 8 or more Rooms | 420 (34.0%) | 53 (9.9%) |
| Total | 1,236 (100.0%) | 536 (100.0%) |
Housing Structure by Heating Type in Rockwell
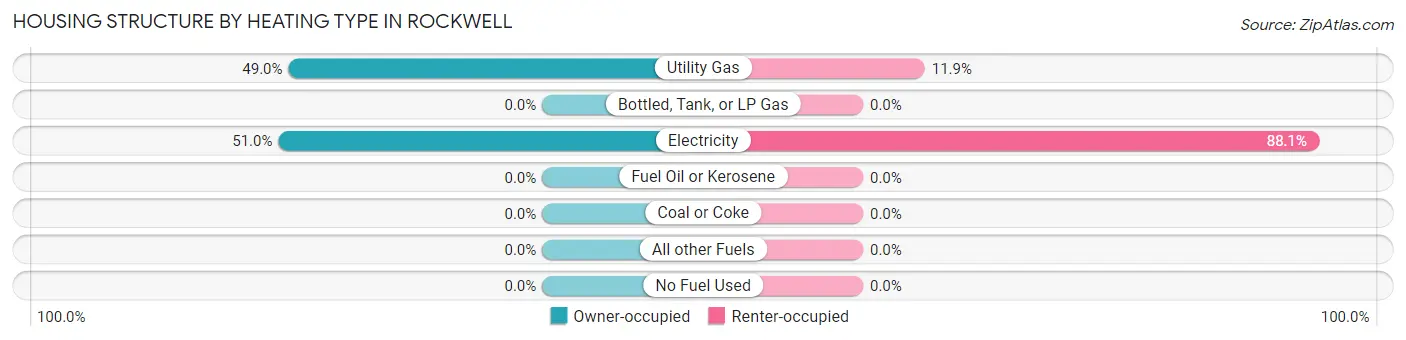
| Heating Type | Owner-occupied | Renter-occupied |
| Utility Gas | 606 (49.0%) | 64 (11.9%) |
| Bottled, Tank, or LP Gas | 0 (0.0%) | 0 (0.0%) |
| Electricity | 630 (51.0%) | 472 (88.1%) |
| Fuel Oil or Kerosene | 0 (0.0%) | 0 (0.0%) |
| Coal or Coke | 0 (0.0%) | 0 (0.0%) |
| All other Fuels | 0 (0.0%) | 0 (0.0%) |
| No Fuel Used | 0 (0.0%) | 0 (0.0%) |
| Total | 1,236 (100.0%) | 536 (100.0%) |
Household Vehicle Usage in Rockwell
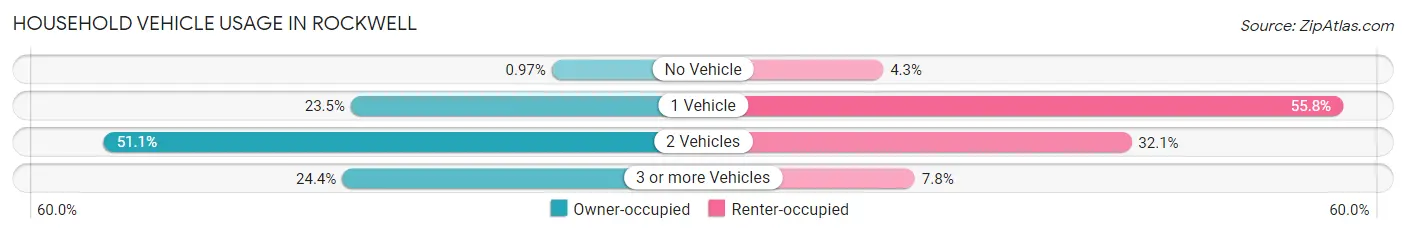
| Vehicles per Household | Owner-occupied | Renter-occupied |
| No Vehicle | 12 (1.0%) | 23 (4.3%) |
| 1 Vehicle | 290 (23.5%) | 299 (55.8%) |
| 2 Vehicles | 632 (51.1%) | 172 (32.1%) |
| 3 or more Vehicles | 302 (24.4%) | 42 (7.8%) |
| Total | 1,236 (100.0%) | 536 (100.0%) |
Real Estate & Mortgages in Rockwell
Real Estate and Mortgage Overview in Rockwell
| Characteristic | Without Mortgage | With Mortgage |
| Housing Units | 526 | 710 |
| Median Property Value | $252,700 | $257,800 |
| Median Household Income | $48,750 | $162 |
| Monthly Housing Costs | $516 | $9 |
| Real Estate Taxes | $1,200 | $26 |
Property Value by Mortgage Status in Rockwell
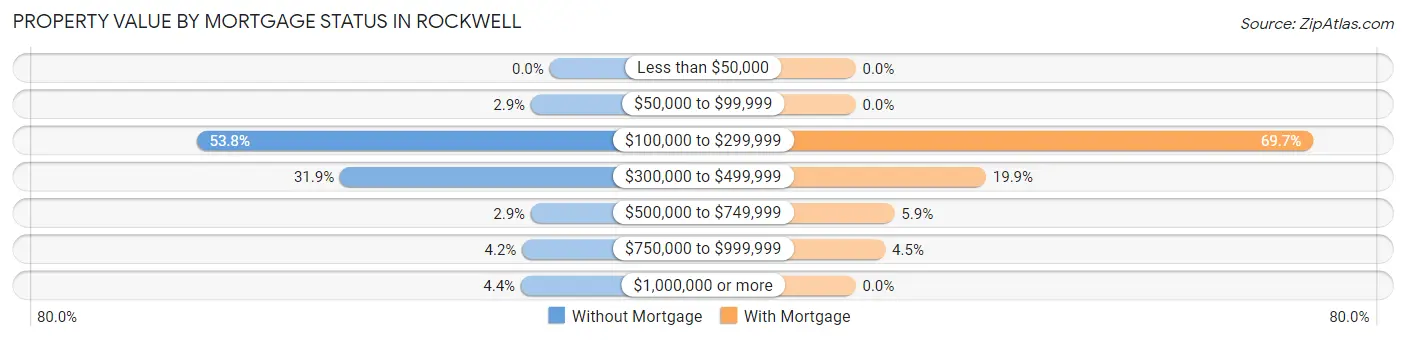
| Property Value | Without Mortgage | With Mortgage |
| Less than $50,000 | 0 (0.0%) | 0 (0.0%) |
| $50,000 to $99,999 | 15 (2.9%) | 0 (0.0%) |
| $100,000 to $299,999 | 283 (53.8%) | 495 (69.7%) |
| $300,000 to $499,999 | 168 (31.9%) | 141 (19.9%) |
| $500,000 to $749,999 | 15 (2.9%) | 42 (5.9%) |
| $750,000 to $999,999 | 22 (4.2%) | 32 (4.5%) |
| $1,000,000 or more | 23 (4.4%) | 0 (0.0%) |
| Total | 526 (100.0%) | 710 (100.0%) |
Household Income by Mortgage Status in Rockwell
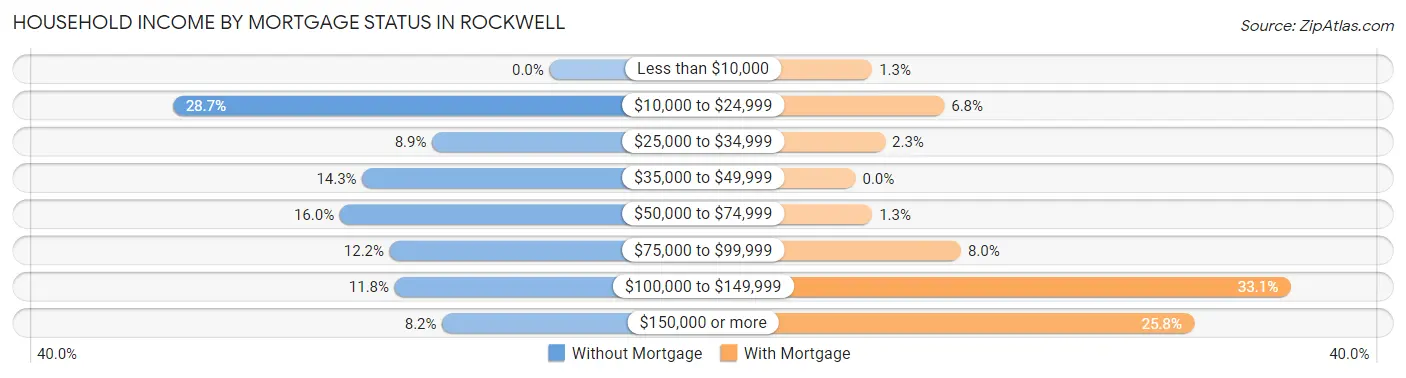
| Household Income | Without Mortgage | With Mortgage |
| Less than $10,000 | 0 (0.0%) | 9 (1.3%) |
| $10,000 to $24,999 | 151 (28.7%) | 48 (6.8%) |
| $25,000 to $34,999 | 47 (8.9%) | 16 (2.2%) |
| $35,000 to $49,999 | 75 (14.3%) | 0 (0.0%) |
| $50,000 to $74,999 | 84 (16.0%) | 9 (1.3%) |
| $75,000 to $99,999 | 64 (12.2%) | 57 (8.0%) |
| $100,000 to $149,999 | 62 (11.8%) | 235 (33.1%) |
| $150,000 or more | 43 (8.2%) | 183 (25.8%) |
| Total | 526 (100.0%) | 710 (100.0%) |
Property Value to Household Income Ratio in Rockwell
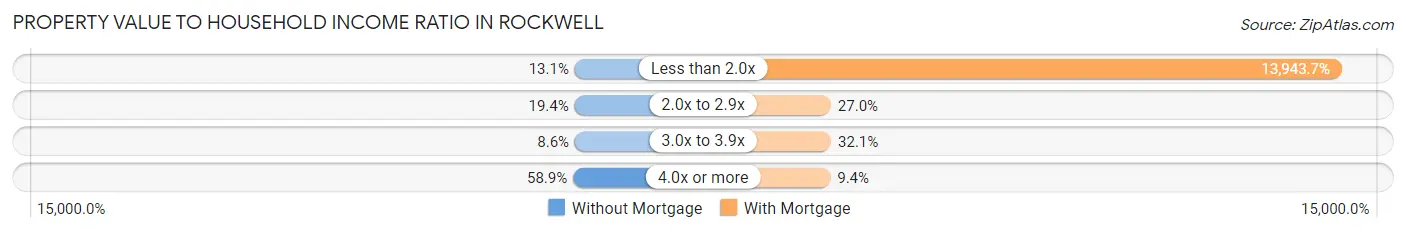
| Value-to-Income Ratio | Without Mortgage | With Mortgage |
| Less than 2.0x | 69 (13.1%) | 99,000 (13,943.7%) |
| 2.0x to 2.9x | 102 (19.4%) | 192 (27.0%) |
| 3.0x to 3.9x | 45 (8.6%) | 228 (32.1%) |
| 4.0x or more | 310 (58.9%) | 67 (9.4%) |
| Total | 526 (100.0%) | 710 (100.0%) |
Real Estate Taxes by Mortgage Status in Rockwell
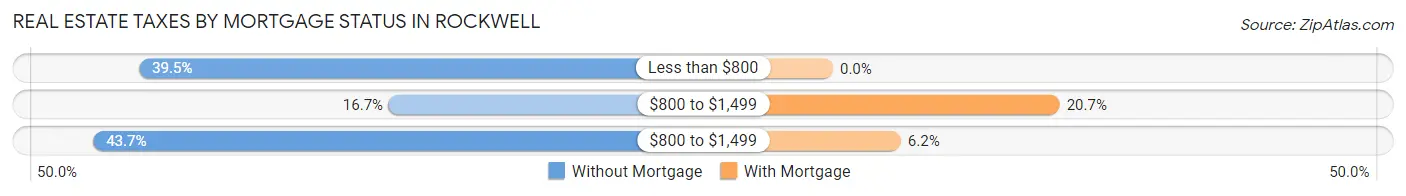
| Property Taxes | Without Mortgage | With Mortgage |
| Less than $800 | 208 (39.5%) | 0 (0.0%) |
| $800 to $1,499 | 88 (16.7%) | 147 (20.7%) |
| $800 to $1,499 | 230 (43.7%) | 44 (6.2%) |
| Total | 526 (100.0%) | 710 (100.0%) |
Health & Disability in Rockwell
Health Insurance Coverage by Age in Rockwell
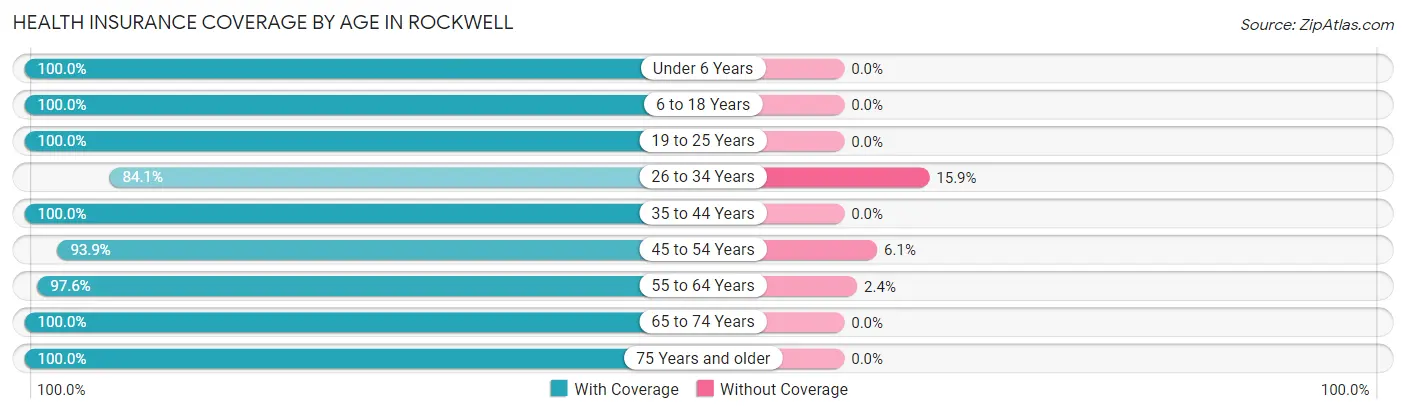
| Age Bracket | With Coverage | Without Coverage |
| Under 6 Years | 243 (100.0%) | 0 (0.0%) |
| 6 to 18 Years | 866 (100.0%) | 0 (0.0%) |
| 19 to 25 Years | 152 (100.0%) | 0 (0.0%) |
| 26 to 34 Years | 366 (84.1%) | 69 (15.9%) |
| 35 to 44 Years | 685 (100.0%) | 0 (0.0%) |
| 45 to 54 Years | 337 (93.9%) | 22 (6.1%) |
| 55 to 64 Years | 609 (97.6%) | 15 (2.4%) |
| 65 to 74 Years | 554 (100.0%) | 0 (0.0%) |
| 75 Years and older | 287 (100.0%) | 0 (0.0%) |
| Total | 4,099 (97.5%) | 106 (2.5%) |
Health Insurance Coverage by Citizenship Status in Rockwell

| Citizenship Status | With Coverage | Without Coverage |
| Native Born | 243 (100.0%) | 0 (0.0%) |
| Foreign Born, Citizen | 866 (100.0%) | 0 (0.0%) |
| Foreign Born, not a Citizen | 152 (100.0%) | 0 (0.0%) |
Health Insurance Coverage by Household Income in Rockwell
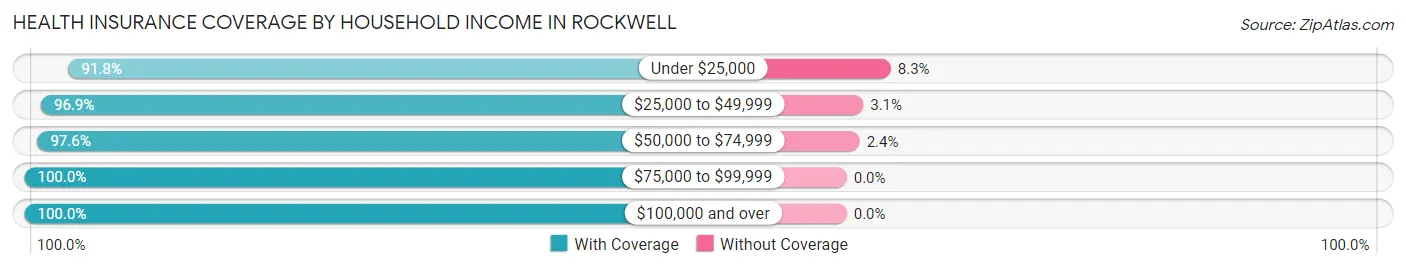
| Household Income | With Coverage | Without Coverage |
| Under $25,000 | 767 (91.7%) | 69 (8.3%) |
| $25,000 to $49,999 | 691 (96.9%) | 22 (3.1%) |
| $50,000 to $74,999 | 604 (97.6%) | 15 (2.4%) |
| $75,000 to $99,999 | 779 (100.0%) | 0 (0.0%) |
| $100,000 and over | 1,258 (100.0%) | 0 (0.0%) |
Public vs Private Health Insurance Coverage by Age in Rockwell
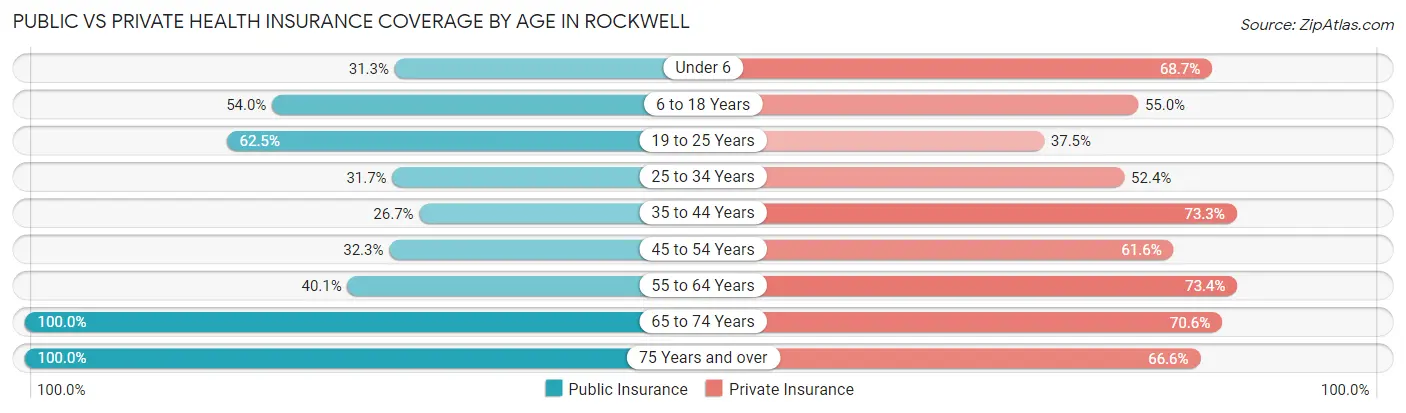
| Age Bracket | Public Insurance | Private Insurance |
| Under 6 | 76 (31.3%) | 167 (68.7%) |
| 6 to 18 Years | 468 (54.0%) | 476 (55.0%) |
| 19 to 25 Years | 95 (62.5%) | 57 (37.5%) |
| 25 to 34 Years | 138 (31.7%) | 228 (52.4%) |
| 35 to 44 Years | 183 (26.7%) | 502 (73.3%) |
| 45 to 54 Years | 116 (32.3%) | 221 (61.6%) |
| 55 to 64 Years | 250 (40.1%) | 458 (73.4%) |
| 65 to 74 Years | 554 (100.0%) | 391 (70.6%) |
| 75 Years and over | 287 (100.0%) | 191 (66.5%) |
| Total | 2,167 (51.5%) | 2,691 (64.0%) |
Disability Status by Sex by Age in Rockwell
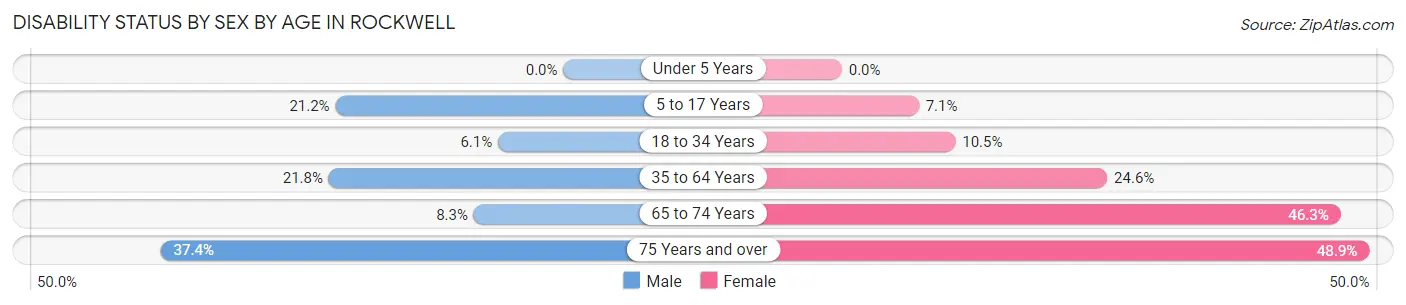
| Age Bracket | Male | Female |
| Under 5 Years | 0 (0.0%) | 0 (0.0%) |
| 5 to 17 Years | 96 (21.1%) | 23 (7.1%) |
| 18 to 34 Years | 22 (6.1%) | 36 (10.5%) |
| 35 to 64 Years | 143 (21.8%) | 249 (24.6%) |
| 65 to 74 Years | 27 (8.3%) | 106 (46.3%) |
| 75 Years and over | 37 (37.4%) | 92 (48.9%) |
Disability Class by Sex by Age in Rockwell
Disability Class: Hearing Difficulty
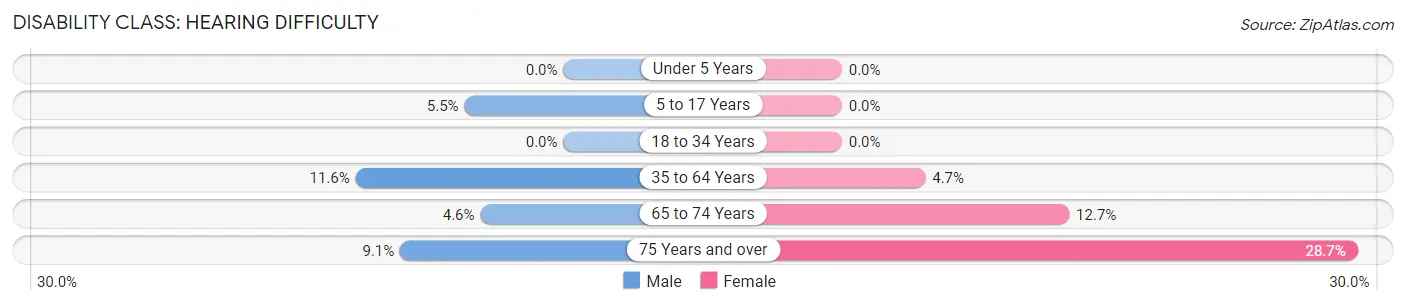
| Age Bracket | Male | Female |
| Under 5 Years | 0 (0.0%) | 0 (0.0%) |
| 5 to 17 Years | 25 (5.5%) | 0 (0.0%) |
| 18 to 34 Years | 0 (0.0%) | 0 (0.0%) |
| 35 to 64 Years | 76 (11.6%) | 47 (4.6%) |
| 65 to 74 Years | 15 (4.6%) | 29 (12.7%) |
| 75 Years and over | 9 (9.1%) | 54 (28.7%) |
Disability Class: Vision Difficulty
| Age Bracket | Male | Female |
| Under 5 Years | 0 (0.0%) | 0 (0.0%) |
| 5 to 17 Years | 0 (0.0%) | 0 (0.0%) |
| 18 to 34 Years | 0 (0.0%) | 0 (0.0%) |
| 35 to 64 Years | 0 (0.0%) | 47 (4.6%) |
| 65 to 74 Years | 0 (0.0%) | 0 (0.0%) |
| 75 Years and over | 11 (11.1%) | 0 (0.0%) |
Disability Class: Cognitive Difficulty
| Age Bracket | Male | Female |
| 5 to 17 Years | 71 (15.6%) | 23 (7.1%) |
| 18 to 34 Years | 22 (6.1%) | 20 (5.9%) |
| 35 to 64 Years | 22 (3.4%) | 156 (15.4%) |
| 65 to 74 Years | 0 (0.0%) | 0 (0.0%) |
| 75 Years and over | 11 (11.1%) | 0 (0.0%) |
Disability Class: Ambulatory Difficulty
| Age Bracket | Male | Female |
| 5 to 17 Years | 0 (0.0%) | 23 (7.1%) |
| 18 to 34 Years | 0 (0.0%) | 16 (4.7%) |
| 35 to 64 Years | 45 (6.9%) | 201 (19.9%) |
| 65 to 74 Years | 18 (5.5%) | 77 (33.6%) |
| 75 Years and over | 28 (28.3%) | 58 (30.8%) |
Disability Class: Self-Care Difficulty
| Age Bracket | Male | Female |
| 5 to 17 Years | 21 (4.6%) | 23 (7.1%) |
| 18 to 34 Years | 0 (0.0%) | 0 (0.0%) |
| 35 to 64 Years | 5 (0.8%) | 108 (10.7%) |
| 65 to 74 Years | 0 (0.0%) | 59 (25.8%) |
| 75 Years and over | 0 (0.0%) | 0 (0.0%) |
Technology Access in Rockwell
Computing Device Access in Rockwell
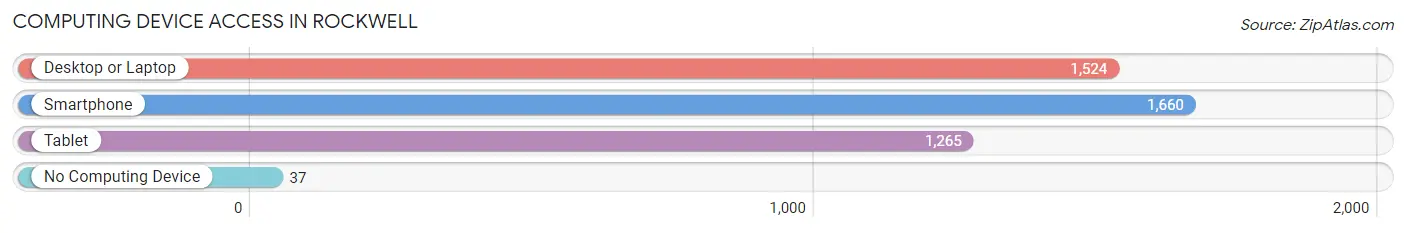
| Device Type | # Households | % Households |
| Desktop or Laptop | 1,524 | 86.0% |
| Smartphone | 1,660 | 93.7% |
| Tablet | 1,265 | 71.4% |
| No Computing Device | 37 | 2.1% |
| Total | 1,772 | 100.0% |
Internet Access in Rockwell
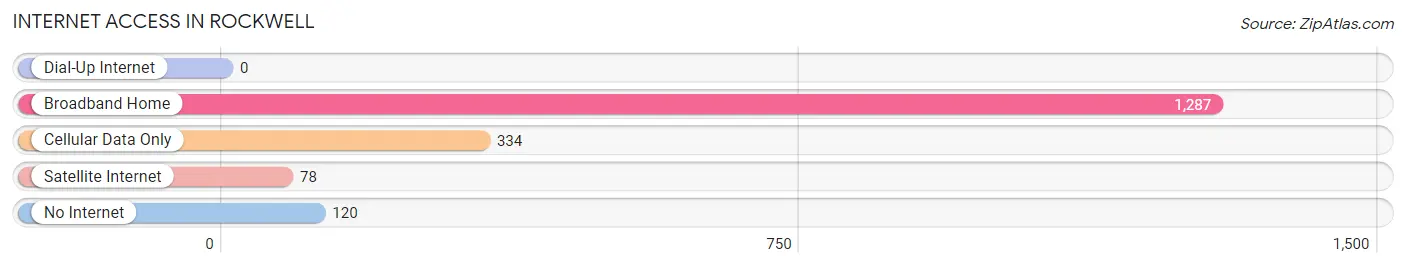
| Internet Type | # Households | % Households |
| Dial-Up Internet | 0 | 0.0% |
| Broadband Home | 1,287 | 72.6% |
| Cellular Data Only | 334 | 18.9% |
| Satellite Internet | 78 | 4.4% |
| No Internet | 120 | 6.8% |
| Total | 1,772 | 100.0% |
Rockwell Summary
Rockwell, Arkansas is a small town located in the northern part of the state, about 30 miles east of Little Rock. It is situated in the foothills of the Ouachita Mountains and is part of the Little Rock-North Little Rock-Conway Metropolitan Statistical Area. The town has a population of just over 1,000 people and is known for its rural charm and friendly atmosphere.
History
Rockwell was founded in 1883 by a group of settlers from the nearby town of Benton. The town was named after the Rockwell family, who were among the first settlers. The town was originally a farming community, but in the early 1900s, the timber industry began to take off in the area. The town was incorporated in 1912 and the first mayor was elected in 1913.
In the 1920s, the timber industry began to decline and the town began to focus more on agriculture. The town was also home to a number of small businesses, including a general store, a blacksmith shop, and a cotton gin.
Geography
Rockwell is located in the northern part of Arkansas, about 30 miles east of Little Rock. It is situated in the foothills of the Ouachita Mountains and is part of the Little Rock-North Little Rock-Conway Metropolitan Statistical Area. The town is located on the banks of the Saline River and is surrounded by rolling hills and forests.
Economy
Rockwell’s economy is largely based on agriculture and timber. The town is home to a number of small businesses, including a general store, a blacksmith shop, and a cotton gin. The town also has a number of small manufacturing companies, including a furniture factory and a woodworking shop.
Demographics
As of the 2010 census, the population of Rockwell was 1,072. The racial makeup of the town was 95.3% White, 0.7% African American, 0.3% Native American, 0.2% Asian, 0.1% Pacific Islander, and 3.4% from other races. The median household income was $31,250 and the median family income was $37,500.
Rockwell is a small town with a friendly atmosphere and a strong sense of community. The town is home to a number of small businesses and is a popular destination for outdoor activities such as fishing, hunting, and camping. The town is also home to a number of historic sites, including the Rockwell Historic District, which is listed on the National Register of Historic Places.
Common Questions
What is Per Capita Income in Rockwell?
Per Capita income in Rockwell is $46,806.
What is the Median Family Income in Rockwell?
Median Family Income in Rockwell is $69,717.
What is the Median Household income in Rockwell?
Median Household Income in Rockwell is $67,344.
What is Income or Wage Gap in Rockwell?
Income or Wage Gap in Rockwell is 26.7%.
Women in Rockwell earn 73.3 cents for every dollar earned by a man.
What is Family Income Deficit in Rockwell?
Family Income Deficit in Rockwell is $10,677.
Families that are below poverty line in Rockwell earn $10,677 less on average than the poverty threshold level.
What is Inequality or Gini Index in Rockwell?
Inequality or Gini Index in Rockwell is 0.61.
What is the Total Population of Rockwell?
Total Population of Rockwell is 4,205.
What is the Total Male Population of Rockwell?
Total Male Population of Rockwell is 1,986.
What is the Total Female Population of Rockwell?
Total Female Population of Rockwell is 2,219.
What is the Ratio of Males per 100 Females in Rockwell?
There are 89.50 Males per 100 Females in Rockwell.
What is the Ratio of Females per 100 Males in Rockwell?
There are 111.73 Females per 100 Males in Rockwell.
What is the Median Population Age in Rockwell?
Median Population Age in Rockwell is 39.6 Years.
What is the Average Family Size in Rockwell
Average Family Size in Rockwell is 2.7 People.
What is the Average Household Size in Rockwell
Average Household Size in Rockwell is 2.4 People.
How Large is the Labor Force in Rockwell?
There are 1,920 People in the Labor Forcein in Rockwell.
What is the Percentage of People in the Labor Force in Rockwell?
55.5% of People are in the Labor Force in Rockwell.
What is the Unemployment Rate in Rockwell?
Unemployment Rate in Rockwell is 9.6%.