Zip Codes with the Highest Percentage of Population Employed in Architecture & Engineering in Fort Smith, AR
RELATED REPORTS & OPTIONS
Architecture & Engineering
Fort Smith
Compare Zip Codes
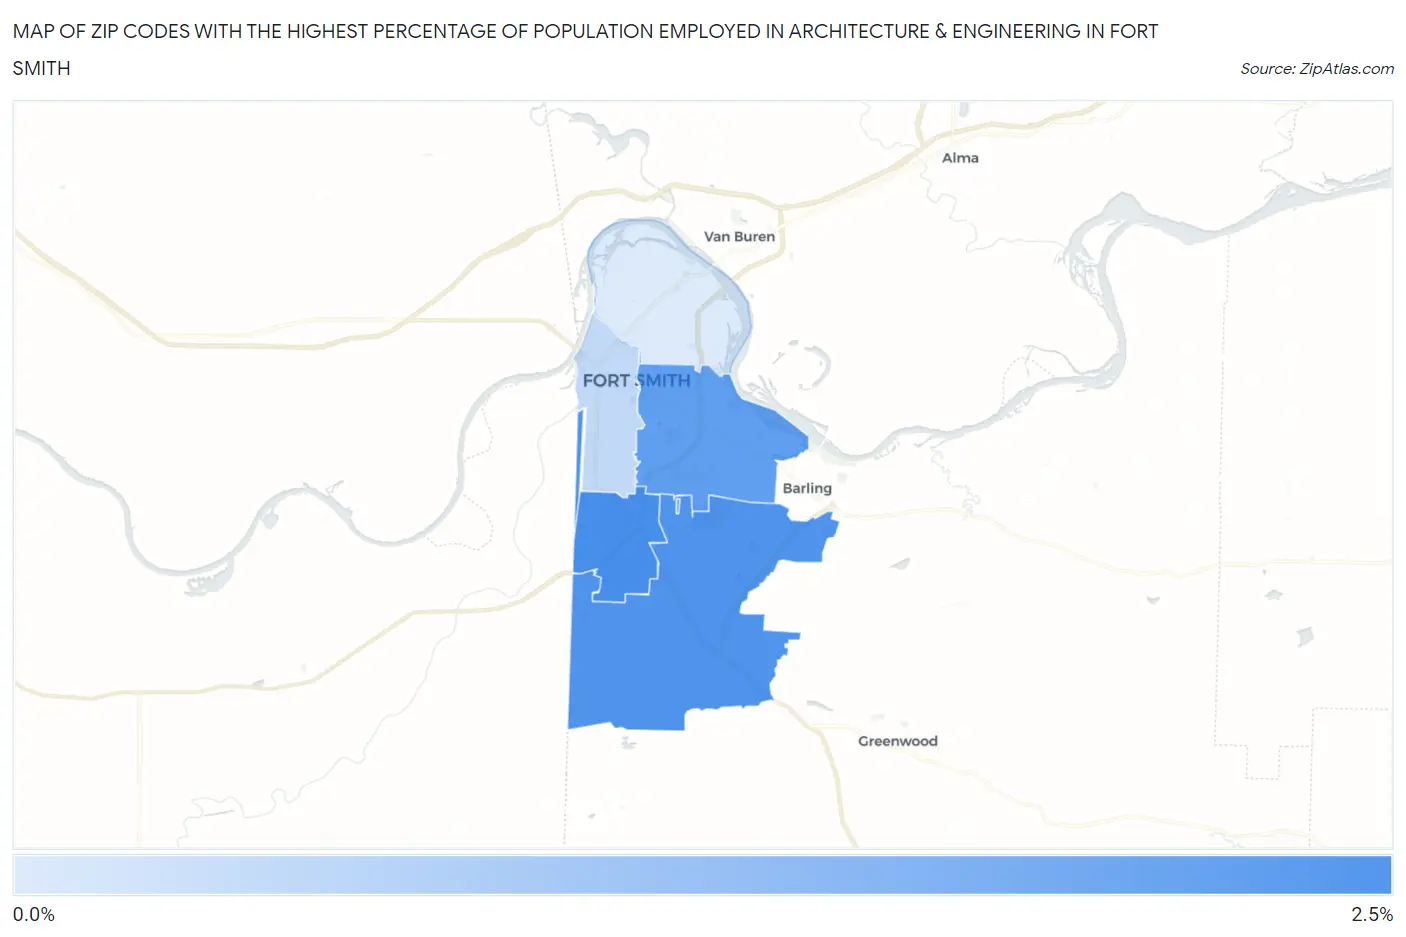
Map of Zip Codes with the Highest Percentage of Population Employed in Architecture & Engineering in Fort Smith
0.29%
2.2%
Zip Codes with the Highest Percentage of Population Employed in Architecture & Engineering in Fort Smith, AR
| Zip Code | % Employed | vs State | vs National | |
| 1. | 72908 | 2.2% | 1.3%(+0.956)#68 | 2.1%(+0.078)#8,325 |
| 2. | 72916 | 2.2% | 1.3%(+0.879)#70 | 2.1%(+0.001)#8,758 |
| 3. | 72903 | 1.9% | 1.3%(+0.632)#77 | 2.1%(-0.247)#10,228 |
| 4. | 72901 | 0.64% | 1.3%(-0.629)#206 | 2.1%(-1.51)#19,308 |
| 5. | 72904 | 0.29% | 1.3%(-0.982)#238 | 2.1%(-1.86)#21,620 |
1
Common Questions
What are the Top 3 Zip Codes with the Highest Percentage of Population Employed in Architecture & Engineering in Fort Smith, AR?
Top 3 Zip Codes with the Highest Percentage of Population Employed in Architecture & Engineering in Fort Smith, AR are:
What zip code has the Highest Percentage of Population Employed in Architecture & Engineering in Fort Smith, AR?
72908 has the Highest Percentage of Population Employed in Architecture & Engineering in Fort Smith, AR with 2.2%.
What is the Percentage of Population Employed in Architecture & Engineering in Fort Smith, AR?
Percentage of Population Employed in Architecture & Engineering in Fort Smith is 1.3%.
What is the Percentage of Population Employed in Architecture & Engineering in Arkansas?
Percentage of Population Employed in Architecture & Engineering in Arkansas is 1.3%.
What is the Percentage of Population Employed in Architecture & Engineering in the United States?
Percentage of Population Employed in Architecture & Engineering in the United States is 2.1%.