Goshen, AR Map & Demographics
Goshen Map
Goshen Overview
$67,199
PER CAPITA INCOME
$177,083
AVG FAMILY INCOME
$167,961
AVG HOUSEHOLD INCOME
47.4%
WAGE / INCOME GAP [ % ]
52.6¢/ $1
WAGE / INCOME GAP [ $ ]
0.43
INEQUALITY / GINI INDEX
2,632
TOTAL POPULATION
1,363
MALE POPULATION
1,269
FEMALE POPULATION
107.41
MALES / 100 FEMALES
93.10
FEMALES / 100 MALES
36.7
MEDIAN AGE
3.5
AVG FAMILY SIZE
3.3
AVG HOUSEHOLD SIZE
1,166
LABOR FORCE [ PEOPLE ]
65.2%
PERCENT IN LABOR FORCE
1.5%
UNEMPLOYMENT RATE
Goshen Area Codes
Income in Goshen
Income Overview in Goshen
Per Capita Income in Goshen is $67,199, while median incomes of families and households are $177,083 and $167,961 respectively.
| Characteristic | Number | Measure |
| Per Capita Income | 2,632 | $67,199 |
| Median Family Income | 711 | $177,083 |
| Mean Family Income | 711 | $241,523 |
| Median Household Income | 807 | $167,961 |
| Mean Household Income | 807 | $218,407 |
| Income Deficit | 711 | $0 |
| Wage / Income Gap (%) | 2,632 | 47.36% |
| Wage / Income Gap ($) | 2,632 | 52.64¢ per $1 |
| Gini / Inequality Index | 2,632 | 0.43 |
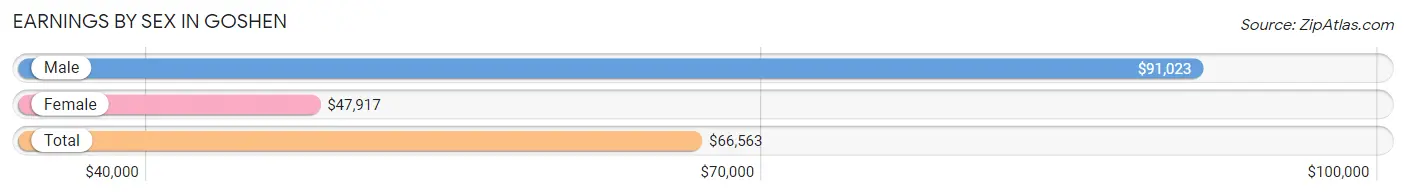
Earnings by Sex in Goshen
Average Earnings in Goshen are $66,563, $91,023 for men and $47,917 for women, a difference of 47.4%.
| Sex | Number | Average Earnings |
| Male | 739 (60.4%) | $91,023 |
| Female | 485 (39.6%) | $47,917 |
| Total | 1,224 (100.0%) | $66,563 |
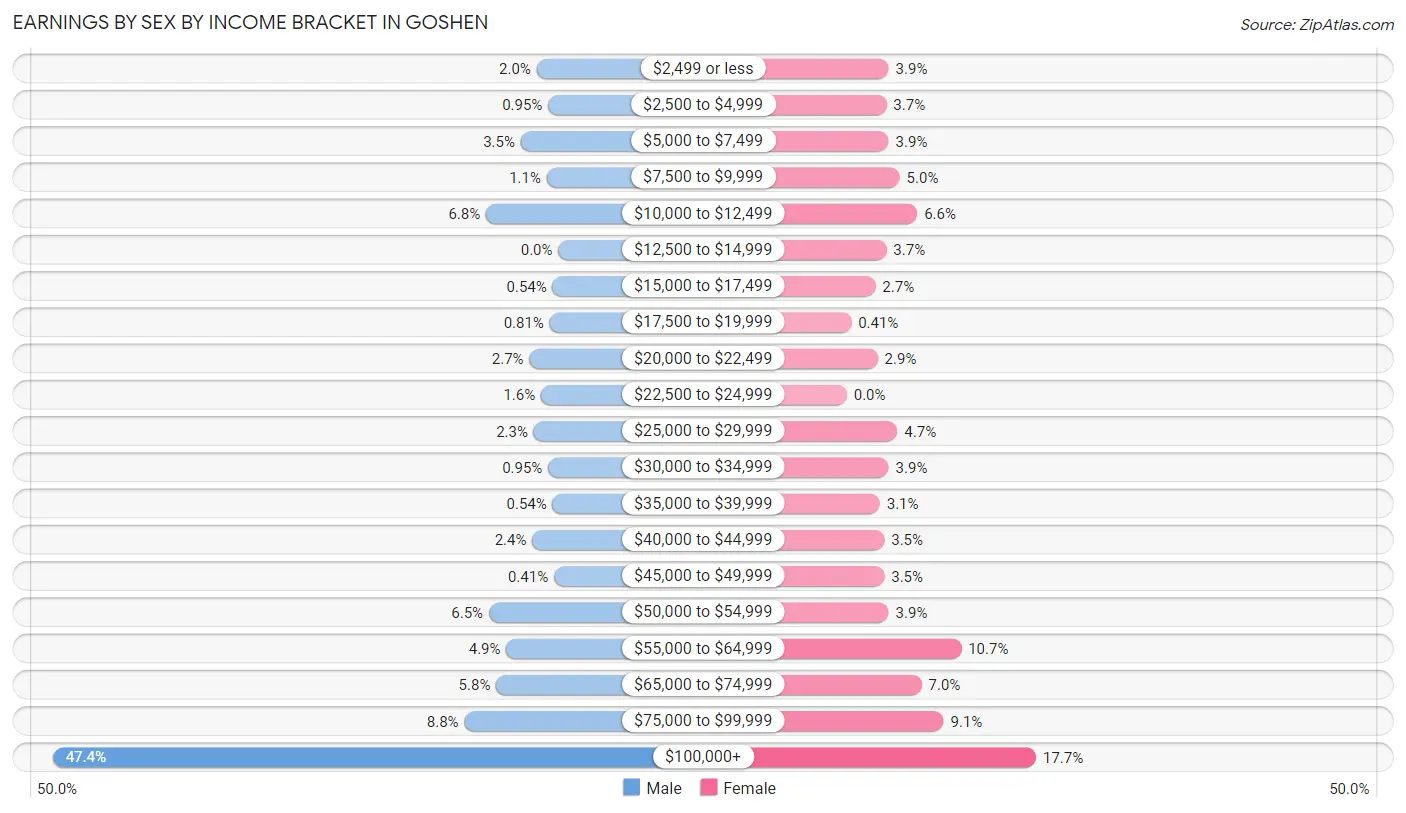
Earnings by Sex by Income Bracket in Goshen
The most common earnings brackets in Goshen are $100,000+ for men (350 | 47.4%) and $100,000+ for women (86 | 17.7%).
| Income | Male | Female |
| $2,499 or less | 15 (2.0%) | 19 (3.9%) |
| $2,500 to $4,999 | 7 (0.9%) | 18 (3.7%) |
| $5,000 to $7,499 | 26 (3.5%) | 19 (3.9%) |
| $7,500 to $9,999 | 8 (1.1%) | 24 (5.0%) |
| $10,000 to $12,499 | 50 (6.8%) | 32 (6.6%) |
| $12,500 to $14,999 | 0 (0.0%) | 18 (3.7%) |
| $15,000 to $17,499 | 4 (0.5%) | 13 (2.7%) |
| $17,500 to $19,999 | 6 (0.8%) | 2 (0.4%) |
| $20,000 to $22,499 | 20 (2.7%) | 14 (2.9%) |
| $22,500 to $24,999 | 12 (1.6%) | 0 (0.0%) |
| $25,000 to $29,999 | 17 (2.3%) | 23 (4.7%) |
| $30,000 to $34,999 | 7 (0.9%) | 19 (3.9%) |
| $35,000 to $39,999 | 4 (0.5%) | 15 (3.1%) |
| $40,000 to $44,999 | 18 (2.4%) | 17 (3.5%) |
| $45,000 to $49,999 | 3 (0.4%) | 17 (3.5%) |
| $50,000 to $54,999 | 48 (6.5%) | 19 (3.9%) |
| $55,000 to $64,999 | 36 (4.9%) | 52 (10.7%) |
| $65,000 to $74,999 | 43 (5.8%) | 34 (7.0%) |
| $75,000 to $99,999 | 65 (8.8%) | 44 (9.1%) |
| $100,000+ | 350 (47.4%) | 86 (17.7%) |
| Total | 739 (100.0%) | 485 (100.0%) |
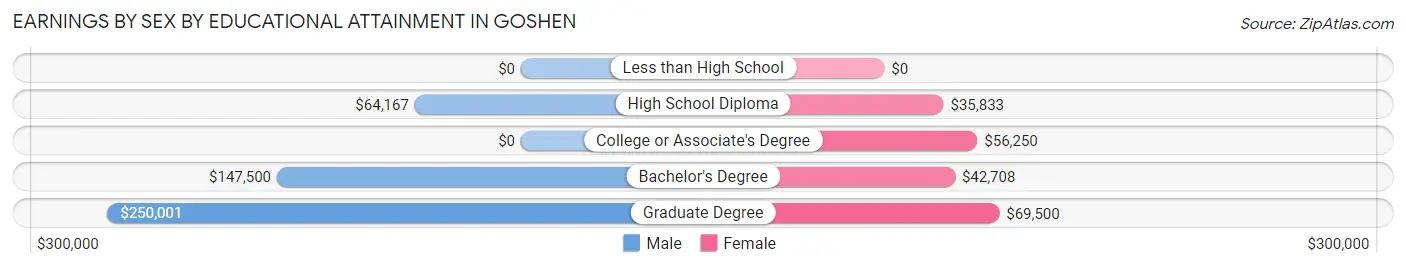
Earnings by Sex by Educational Attainment in Goshen
Average earnings in Goshen are $133,438 for men and $53,750 for women, a difference of 59.7%. Men with an educational attainment of graduate degree enjoy the highest average annual earnings of $250,001, while those with high school diploma education earn the least with $64,167. Women with an educational attainment of graduate degree earn the most with the average annual earnings of $69,500, while those with high school diploma education have the smallest earnings of $35,833.
| Educational Attainment | Male Income | Female Income |
| Less than High School | - | - |
| High School Diploma | $64,167 | $35,833 |
| College or Associate's Degree | - | - |
| Bachelor's Degree | $147,500 | $42,708 |
| Graduate Degree | $250,001 | $69,500 |
| Total | $133,438 | $53,750 |
Family Income in Goshen
Family Income Brackets in Goshen
According to the Goshen family income data, there are 313 families falling into the $200,000+ income range, which is the most common income bracket and makes up 44.0% of all families.
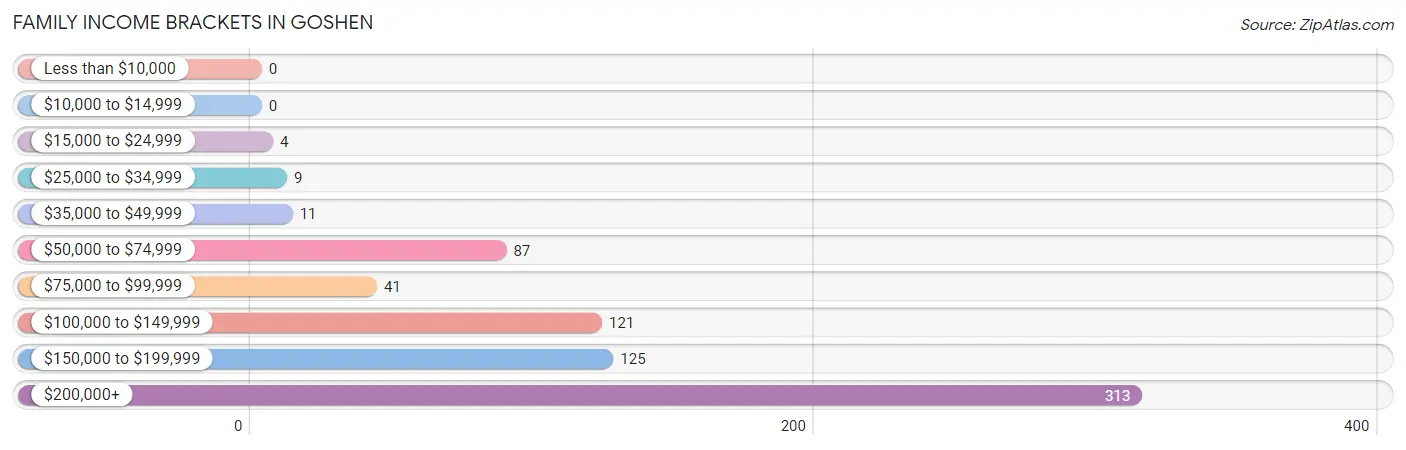
| Income Bracket | # Families | % Families |
| Less than $10,000 | 0 | 0.0% |
| $10,000 to $14,999 | 0 | 0.0% |
| $15,000 to $24,999 | 4 | 0.6% |
| $25,000 to $34,999 | 9 | 1.3% |
| $35,000 to $49,999 | 11 | 1.5% |
| $50,000 to $74,999 | 87 | 12.2% |
| $75,000 to $99,999 | 41 | 5.8% |
| $100,000 to $149,999 | 121 | 17.0% |
| $150,000 to $199,999 | 125 | 17.6% |
| $200,000+ | 313 | 44.0% |
Family Income by Famaliy Size in Goshen
5-person families (164 | 23.1%) account for the highest median family income in Goshen with $250,001 per family, while 3-person families (99 | 13.9%) have the highest median income of $57,426 per family member.
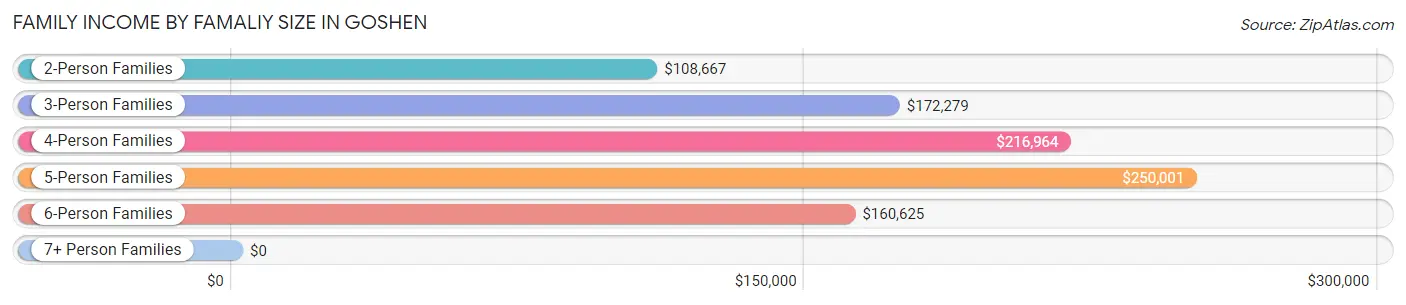
| Income Bracket | # Families | Median Income |
| 2-Person Families | 248 (34.9%) | $108,667 |
| 3-Person Families | 99 (13.9%) | $172,279 |
| 4-Person Families | 185 (26.0%) | $216,964 |
| 5-Person Families | 164 (23.1%) | $250,001 |
| 6-Person Families | 9 (1.3%) | $160,625 |
| 7+ Person Families | 6 (0.8%) | $0 |
| Total | 711 (100.0%) | $177,083 |
Family Income by Number of Earners in Goshen
The median family income in Goshen is $177,083, with families comprising 1 earner (248) having the highest median family income of $211,538, while families with no earners (62) have the lowest median family income of $106,167, accounting for 34.9% and 8.7% of families, respectively.
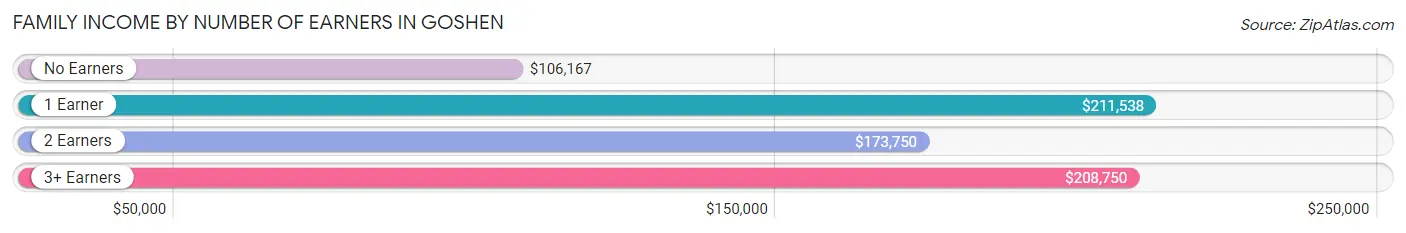
| Number of Earners | # Families | Median Income |
| No Earners | 62 (8.7%) | $106,167 |
| 1 Earner | 248 (34.9%) | $211,538 |
| 2 Earners | 331 (46.6%) | $173,750 |
| 3+ Earners | 70 (9.9%) | $208,750 |
| Total | 711 (100.0%) | $177,083 |
Household Income in Goshen
Household Income Brackets in Goshen
With 313 households falling in the category, the $200,000+ income range is the most frequent in Goshen, accounting for 38.8% of all households. In contrast, only 3 households (0.4%) fall into the less than $10,000 income bracket, making it the least populous group.
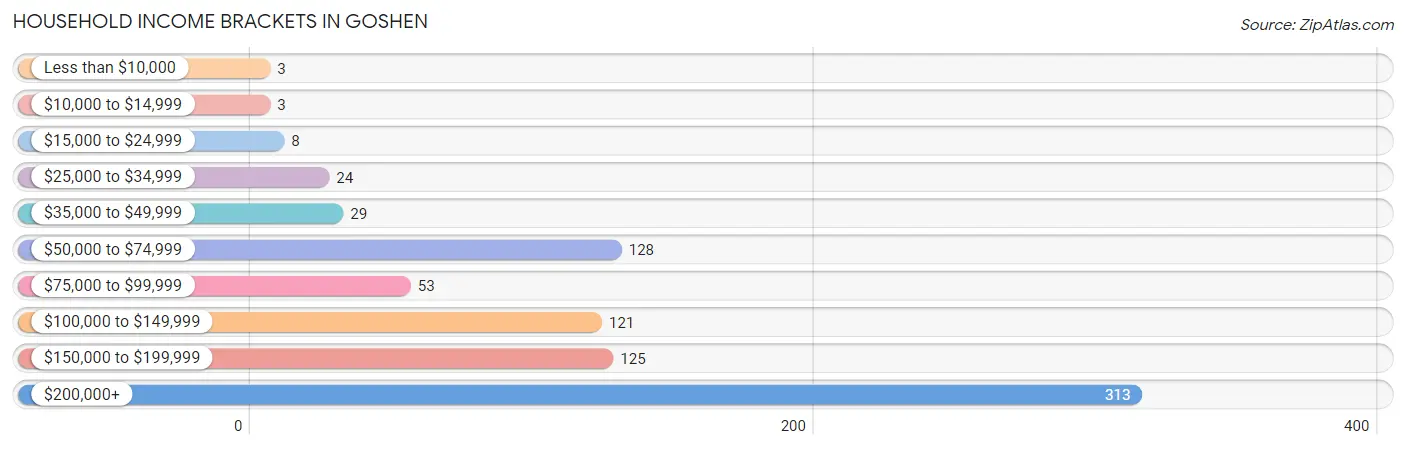
| Income Bracket | # Households | % Households |
| Less than $10,000 | 3 | 0.4% |
| $10,000 to $14,999 | 3 | 0.4% |
| $15,000 to $24,999 | 8 | 1.0% |
| $25,000 to $34,999 | 24 | 3.0% |
| $35,000 to $49,999 | 29 | 3.6% |
| $50,000 to $74,999 | 128 | 15.9% |
| $75,000 to $99,999 | 53 | 6.6% |
| $100,000 to $149,999 | 121 | 15.0% |
| $150,000 to $199,999 | 125 | 15.5% |
| $200,000+ | 313 | 38.8% |
Household Income by Householder Age in Goshen
The median household income in Goshen is $167,961, with the highest median household income of $207,813 found in the 45 to 64 years age bracket for the primary householder. A total of 327 households (40.5%) fall into this category. Meanwhile, the 15 to 24 years age bracket for the primary householder has the lowest median household income of $51,184, with 24 households (3.0%) in this group.
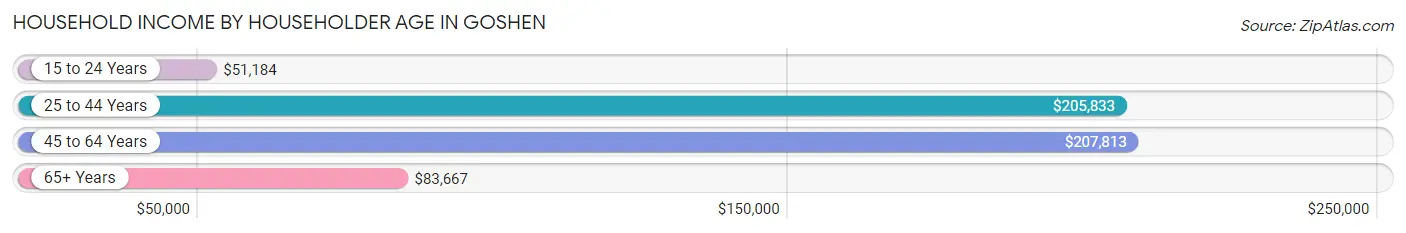
| Income Bracket | # Households | Median Income |
| 15 to 24 Years | 24 (3.0%) | $51,184 |
| 25 to 44 Years | 278 (34.4%) | $205,833 |
| 45 to 64 Years | 327 (40.5%) | $207,813 |
| 65+ Years | 178 (22.1%) | $83,667 |
| Total | 807 (100.0%) | $167,961 |
Poverty in Goshen
Income Below Poverty by Sex and Age in Goshen
With 0.9% poverty level for males and 1.0% for females among the residents of Goshen, 75 year old and over males and 65 to 74 year old females are the most vulnerable to poverty, with 3 males (9.1%) and 13 females (13.0%) in their respective age groups living below the poverty level.
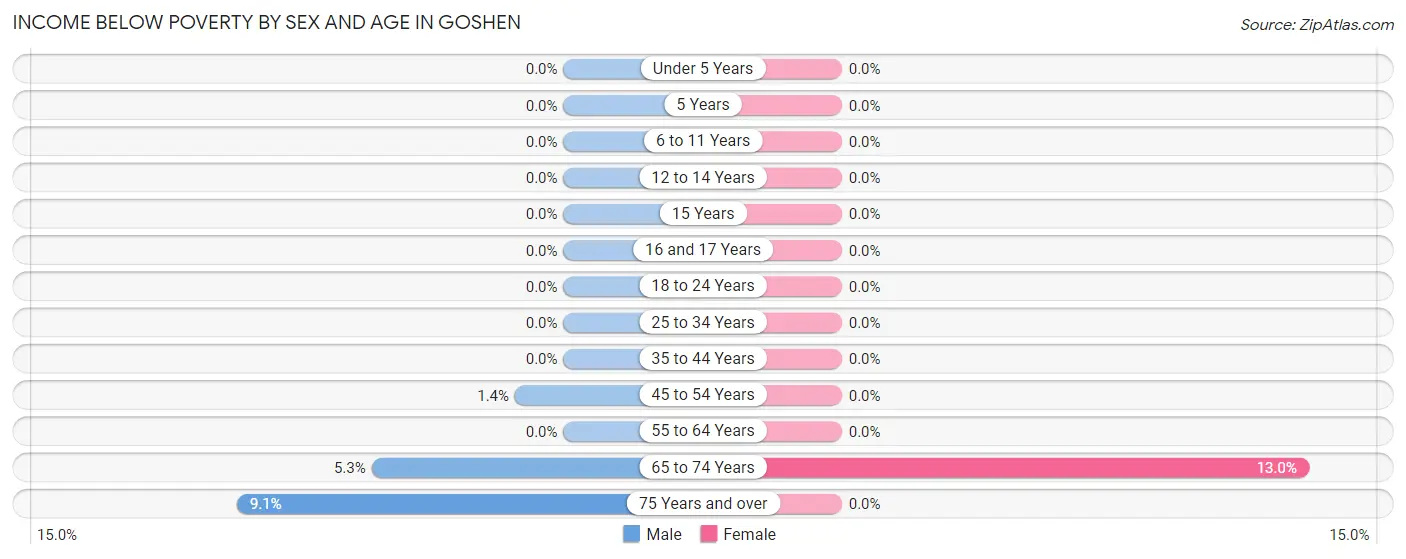
| Age Bracket | Male | Female |
| Under 5 Years | 0 (0.0%) | 0 (0.0%) |
| 5 Years | 0 (0.0%) | 0 (0.0%) |
| 6 to 11 Years | 0 (0.0%) | 0 (0.0%) |
| 12 to 14 Years | 0 (0.0%) | 0 (0.0%) |
| 15 Years | 0 (0.0%) | 0 (0.0%) |
| 16 and 17 Years | 0 (0.0%) | 0 (0.0%) |
| 18 to 24 Years | 0 (0.0%) | 0 (0.0%) |
| 25 to 34 Years | 0 (0.0%) | 0 (0.0%) |
| 35 to 44 Years | 0 (0.0%) | 0 (0.0%) |
| 45 to 54 Years | 3 (1.3%) | 0 (0.0%) |
| 55 to 64 Years | 0 (0.0%) | 0 (0.0%) |
| 65 to 74 Years | 7 (5.3%) | 13 (13.0%) |
| 75 Years and over | 3 (9.1%) | 0 (0.0%) |
| Total | 13 (0.9%) | 13 (1.0%) |
Income Above Poverty by Sex and Age in Goshen
According to the poverty statistics in Goshen, males aged under 5 years and females aged under 5 years are the age groups that are most secure financially, with 100.0% of males and 100.0% of females in these age groups living above the poverty line.
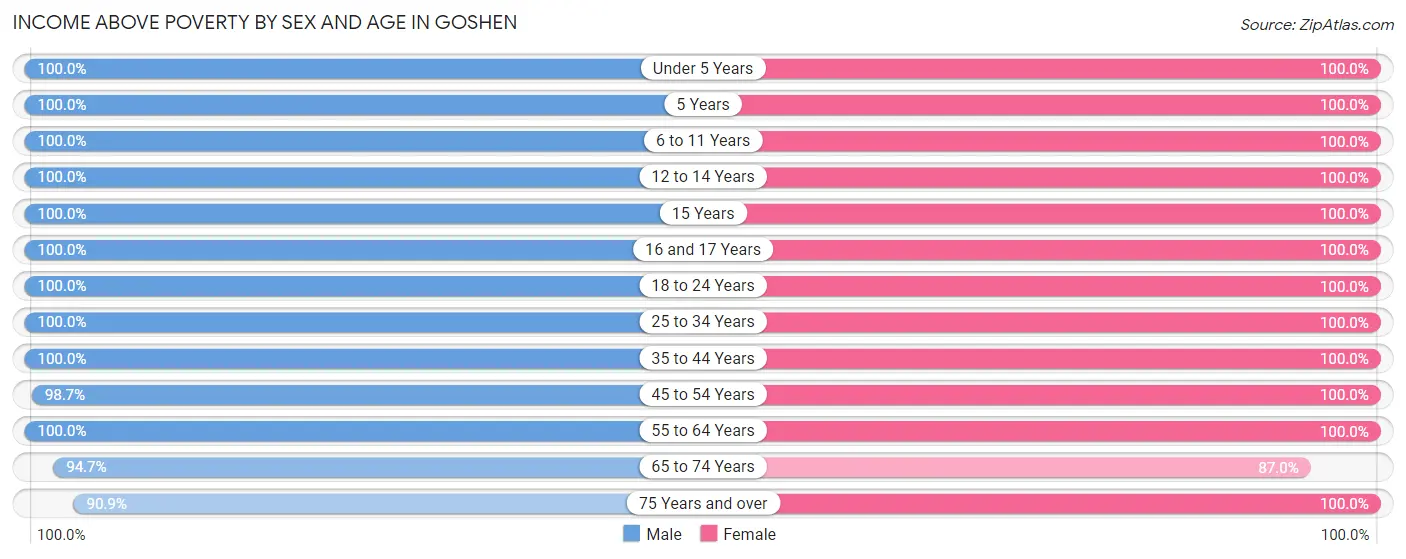
| Age Bracket | Male | Female |
| Under 5 Years | 111 (100.0%) | 99 (100.0%) |
| 5 Years | 4 (100.0%) | 31 (100.0%) |
| 6 to 11 Years | 191 (100.0%) | 209 (100.0%) |
| 12 to 14 Years | 90 (100.0%) | 40 (100.0%) |
| 15 Years | 48 (100.0%) | 20 (100.0%) |
| 16 and 17 Years | 23 (100.0%) | 71 (100.0%) |
| 18 to 24 Years | 110 (100.0%) | 46 (100.0%) |
| 25 to 34 Years | 64 (100.0%) | 62 (100.0%) |
| 35 to 44 Years | 225 (100.0%) | 303 (100.0%) |
| 45 to 54 Years | 219 (98.7%) | 138 (100.0%) |
| 55 to 64 Years | 111 (100.0%) | 123 (100.0%) |
| 65 to 74 Years | 124 (94.7%) | 87 (87.0%) |
| 75 Years and over | 30 (90.9%) | 27 (100.0%) |
| Total | 1,350 (99.1%) | 1,256 (99.0%) |
Income Below Poverty Among Married-Couple Families in Goshen
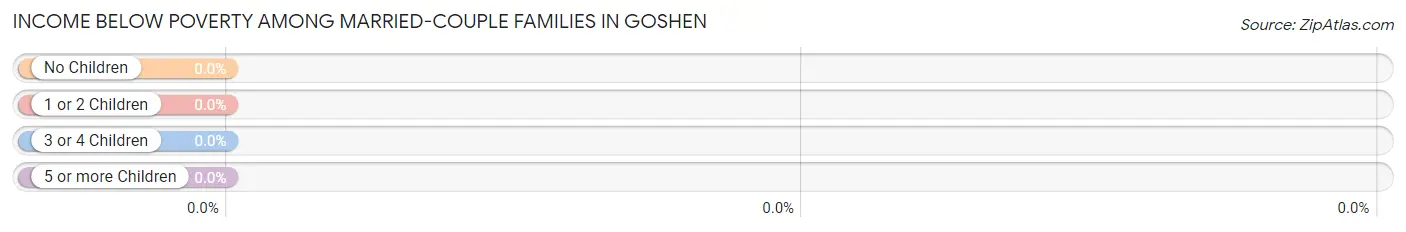
| Children | Above Poverty | Below Poverty |
| No Children | 263 (100.0%) | 0 (0.0%) |
| 1 or 2 Children | 277 (100.0%) | 0 (0.0%) |
| 3 or 4 Children | 130 (100.0%) | 0 (0.0%) |
| 5 or more Children | 0 (0.0%) | 0 (0.0%) |
| Total | 670 (100.0%) | 0 (0.0%) |
Income Below Poverty Among Single-Parent Households in Goshen
| Children | Single Father | Single Mother |
| No Children | 0 (0.0%) | 0 (0.0%) |
| 1 or 2 Children | 0 (0.0%) | 0 (0.0%) |
| 3 or 4 Children | 0 (0.0%) | 0 (0.0%) |
| 5 or more Children | 0 (0.0%) | 0 (0.0%) |
| Total | 0 (0.0%) | 0 (0.0%) |
Income Below Poverty Among Married-Couple vs Single-Parent Households in Goshen
| Children | Married-Couple Families | Single-Parent Households |
| No Children | 0 (0.0%) | 0 (0.0%) |
| 1 or 2 Children | 0 (0.0%) | 0 (0.0%) |
| 3 or 4 Children | 0 (0.0%) | 0 (0.0%) |
| 5 or more Children | 0 (0.0%) | 0 (0.0%) |
| Total | 0 (0.0%) | 0 (0.0%) |
Race in Goshen
The most populous races in Goshen are White / Caucasian (2,303 | 87.5%), Two or more Races (248 | 9.4%), and Hispanic or Latino (102 | 3.9%).
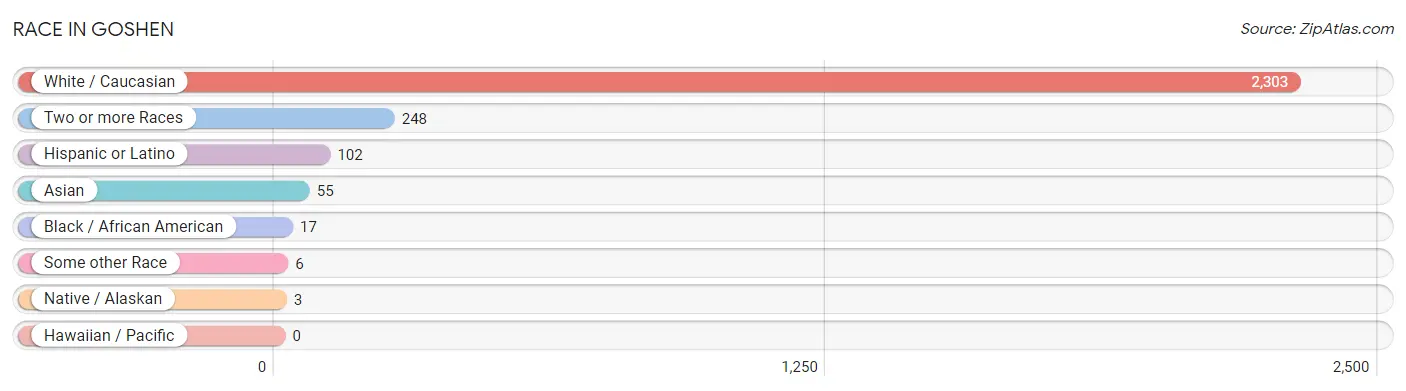
| Race | # Population | % Population |
| Asian | 55 | 2.1% |
| Black / African American | 17 | 0.6% |
| Hawaiian / Pacific | 0 | 0.0% |
| Hispanic or Latino | 102 | 3.9% |
| Native / Alaskan | 3 | 0.1% |
| White / Caucasian | 2,303 | 87.5% |
| Two or more Races | 248 | 9.4% |
| Some other Race | 6 | 0.2% |
| Total | 2,632 | 100.0% |
Ancestry in Goshen
The most populous ancestries reported in Goshen are English (310 | 11.8%), German (308 | 11.7%), Irish (268 | 10.2%), American (164 | 6.2%), and Mexican (69 | 2.6%), together accounting for 42.5% of all Goshen residents.
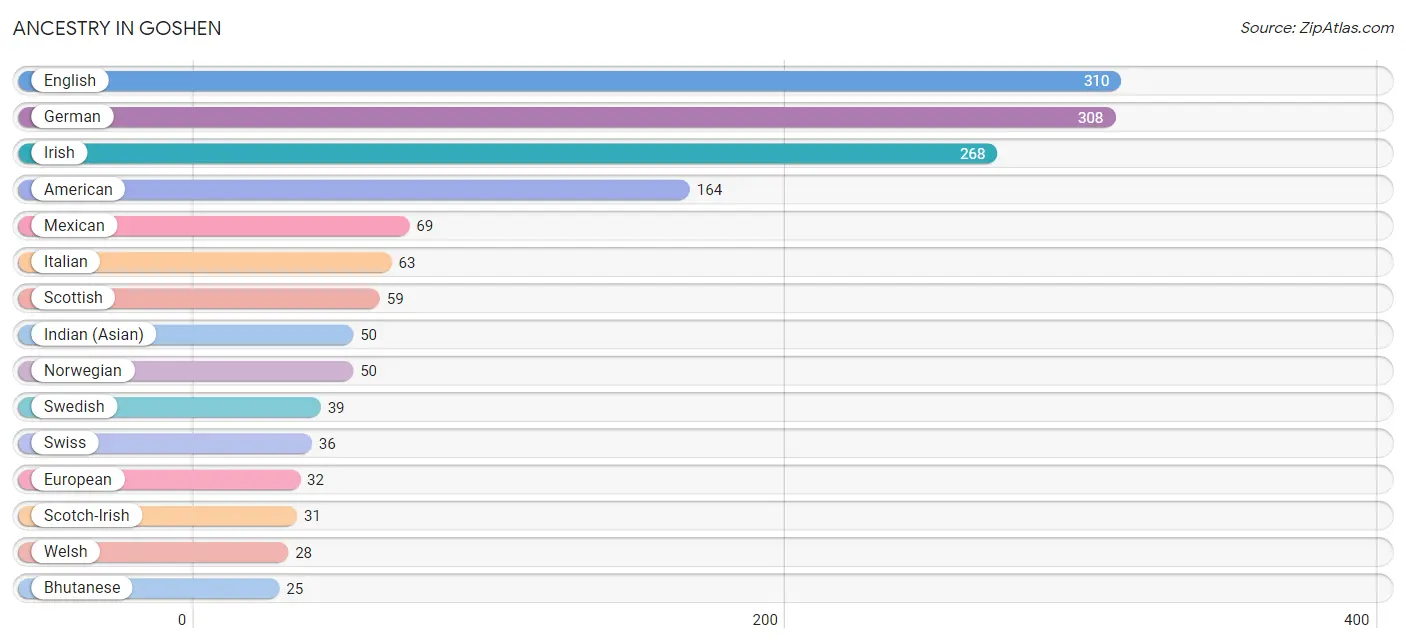
| Ancestry | # Population | % Population |
| American | 164 | 6.2% |
| Austrian | 3 | 0.1% |
| Belgian | 16 | 0.6% |
| Bhutanese | 25 | 0.9% |
| British | 18 | 0.7% |
| Burmese | 6 | 0.2% |
| Canadian | 4 | 0.2% |
| Cherokee | 10 | 0.4% |
| Colombian | 2 | 0.1% |
| Cuban | 13 | 0.5% |
| Danish | 16 | 0.6% |
| Dutch | 10 | 0.4% |
| Eastern European | 3 | 0.1% |
| English | 310 | 11.8% |
| European | 32 | 1.2% |
| French | 18 | 0.7% |
| French Canadian | 11 | 0.4% |
| German | 308 | 11.7% |
| Indian (Asian) | 50 | 1.9% |
| Irish | 268 | 10.2% |
| Italian | 63 | 2.4% |
| Korean | 11 | 0.4% |
| Malaysian | 3 | 0.1% |
| Mexican | 69 | 2.6% |
| Norwegian | 50 | 1.9% |
| Polish | 6 | 0.2% |
| Portuguese | 5 | 0.2% |
| Scotch-Irish | 31 | 1.2% |
| Scottish | 59 | 2.2% |
| Slovak | 4 | 0.2% |
| South American | 2 | 0.1% |
| Spaniard | 12 | 0.5% |
| Sri Lankan | 7 | 0.3% |
| Swedish | 39 | 1.5% |
| Swiss | 36 | 1.4% |
| Welsh | 28 | 1.1% | View All 36 Rows |
Immigrants in Goshen
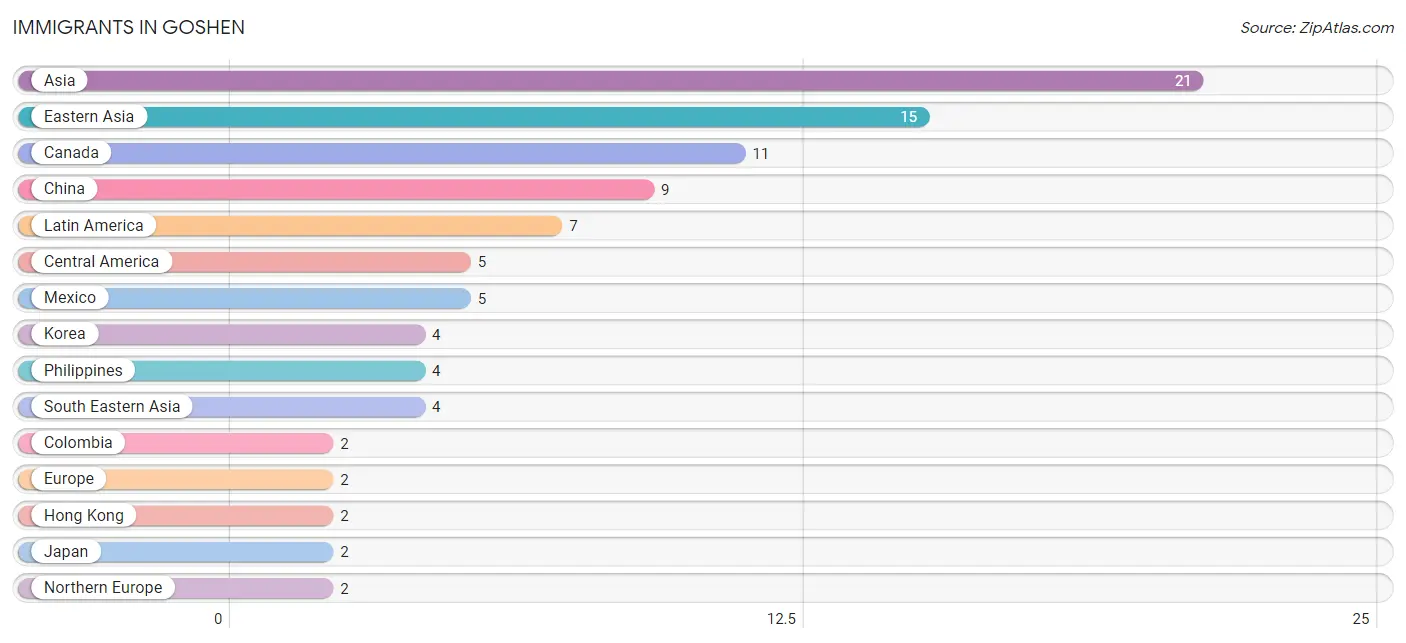
The most numerous immigrant groups reported in Goshen came from Asia (21 | 0.8%), Eastern Asia (15 | 0.6%), Canada (11 | 0.4%), China (9 | 0.3%), and Latin America (7 | 0.3%), together accounting for 2.4% of all Goshen residents.
| Immigration Origin | # Population | % Population |
| Asia | 21 | 0.8% |
| Canada | 11 | 0.4% |
| Central America | 5 | 0.2% |
| China | 9 | 0.3% |
| Colombia | 2 | 0.1% |
| Eastern Asia | 15 | 0.6% |
| Europe | 2 | 0.1% |
| Hong Kong | 2 | 0.1% |
| Japan | 2 | 0.1% |
| Korea | 4 | 0.2% |
| Latin America | 7 | 0.3% |
| Mexico | 5 | 0.2% |
| Northern Europe | 2 | 0.1% |
| Pakistan | 2 | 0.1% |
| Philippines | 4 | 0.2% |
| South America | 2 | 0.1% |
| South Central Asia | 2 | 0.1% |
| South Eastern Asia | 4 | 0.2% | View All 18 Rows |
Sex and Age in Goshen
Sex and Age in Goshen
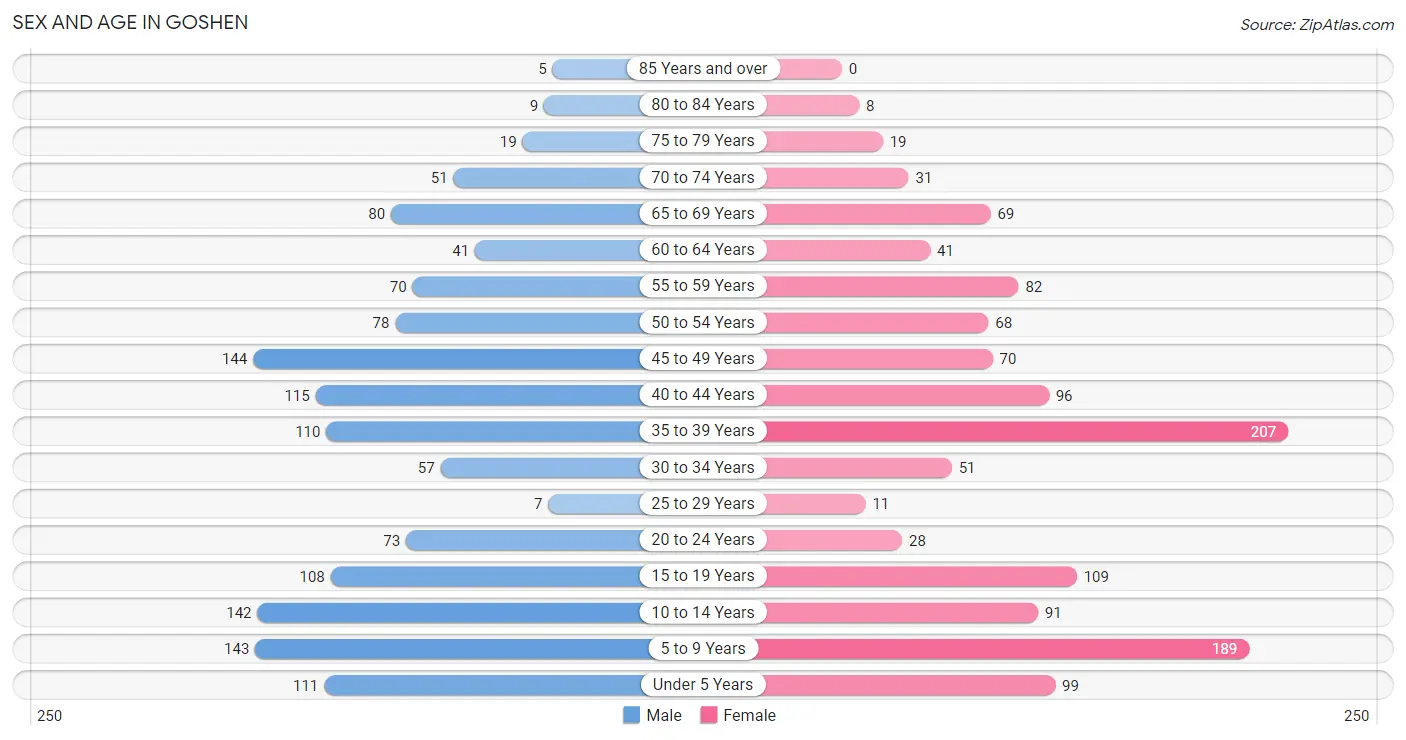
The most populous age groups in Goshen are 45 to 49 Years (144 | 10.6%) for men and 35 to 39 Years (207 | 16.3%) for women.
| Age Bracket | Male | Female |
| Under 5 Years | 111 (8.1%) | 99 (7.8%) |
| 5 to 9 Years | 143 (10.5%) | 189 (14.9%) |
| 10 to 14 Years | 142 (10.4%) | 91 (7.2%) |
| 15 to 19 Years | 108 (7.9%) | 109 (8.6%) |
| 20 to 24 Years | 73 (5.4%) | 28 (2.2%) |
| 25 to 29 Years | 7 (0.5%) | 11 (0.9%) |
| 30 to 34 Years | 57 (4.2%) | 51 (4.0%) |
| 35 to 39 Years | 110 (8.1%) | 207 (16.3%) |
| 40 to 44 Years | 115 (8.4%) | 96 (7.6%) |
| 45 to 49 Years | 144 (10.6%) | 70 (5.5%) |
| 50 to 54 Years | 78 (5.7%) | 68 (5.4%) |
| 55 to 59 Years | 70 (5.1%) | 82 (6.5%) |
| 60 to 64 Years | 41 (3.0%) | 41 (3.2%) |
| 65 to 69 Years | 80 (5.9%) | 69 (5.4%) |
| 70 to 74 Years | 51 (3.7%) | 31 (2.4%) |
| 75 to 79 Years | 19 (1.4%) | 19 (1.5%) |
| 80 to 84 Years | 9 (0.7%) | 8 (0.6%) |
| 85 Years and over | 5 (0.4%) | 0 (0.0%) |
| Total | 1,363 (100.0%) | 1,269 (100.0%) |
Families and Households in Goshen
Median Family Size in Goshen
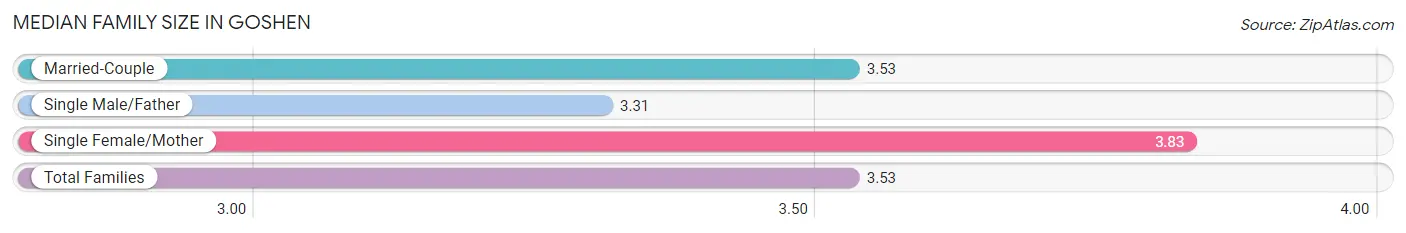
The median family size in Goshen is 3.53 persons per family, with single female/mother families (12 | 1.7%) accounting for the largest median family size of 3.83 persons per family. On the other hand, single male/father families (29 | 4.1%) represent the smallest median family size with 3.31 persons per family.
| Family Type | # Families | Family Size |
| Married-Couple | 670 (94.2%) | 3.53 |
| Single Male/Father | 29 (4.1%) | 3.31 |
| Single Female/Mother | 12 (1.7%) | 3.83 |
| Total Families | 711 (100.0%) | 3.53 |
Median Household Size in Goshen
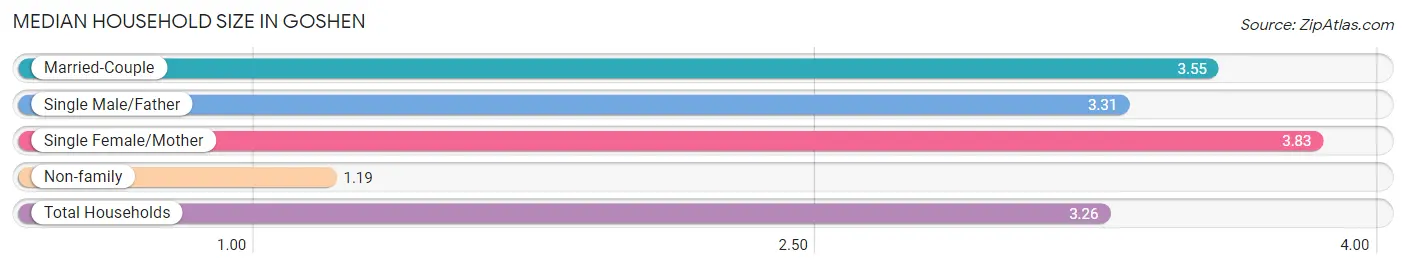
The median household size in Goshen is 3.26 persons per household, with single female/mother households (12 | 1.5%) accounting for the largest median household size of 3.83 persons per household. non-family households (96 | 11.9%) represent the smallest median household size with 1.19 persons per household.
| Household Type | # Households | Household Size |
| Married-Couple | 670 (83.0%) | 3.55 |
| Single Male/Father | 29 (3.6%) | 3.31 |
| Single Female/Mother | 12 (1.5%) | 3.83 |
| Non-family | 96 (11.9%) | 1.19 |
| Total Households | 807 (100.0%) | 3.26 |
Household Size by Marriage Status in Goshen
Out of a total of 807 households in Goshen, 711 (88.1%) are family households, while 96 (11.9%) are nonfamily households. The most numerous type of family households are 2-person households, comprising 242, and the most common type of nonfamily households are 1-person households, comprising 76.
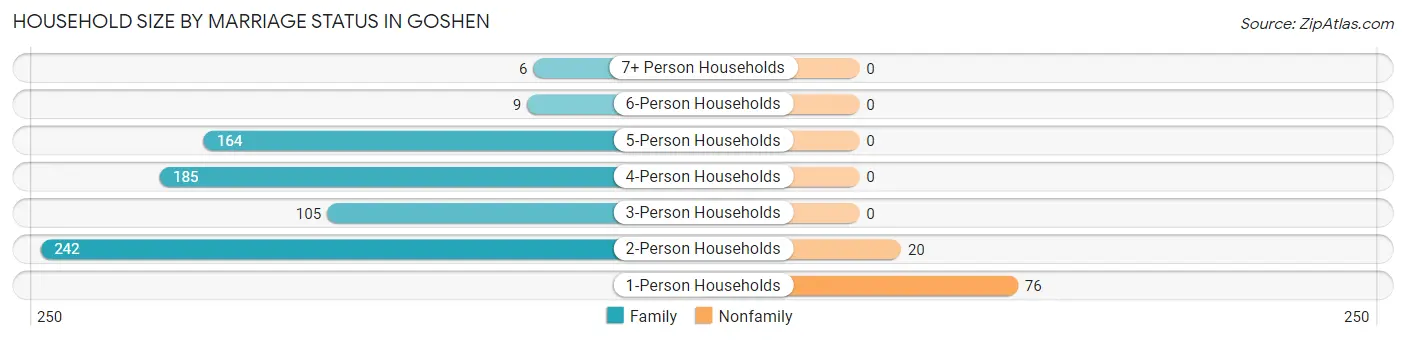
| Household Size | Family Households | Nonfamily Households |
| 1-Person Households | - | 76 (9.4%) |
| 2-Person Households | 242 (30.0%) | 20 (2.5%) |
| 3-Person Households | 105 (13.0%) | 0 (0.0%) |
| 4-Person Households | 185 (22.9%) | 0 (0.0%) |
| 5-Person Households | 164 (20.3%) | 0 (0.0%) |
| 6-Person Households | 9 (1.1%) | 0 (0.0%) |
| 7+ Person Households | 6 (0.7%) | 0 (0.0%) |
| Total | 711 (88.1%) | 96 (11.9%) |
Female Fertility in Goshen
Fertility by Age in Goshen
Average fertility rate in Goshen is 63.0 births per 1,000 women. Women in the age bracket of 20 to 34 years have the highest fertility rate with 289.0 births per 1,000 women. Women in the age bracket of 20 to 34 years acount for 70.3% of all women with births.
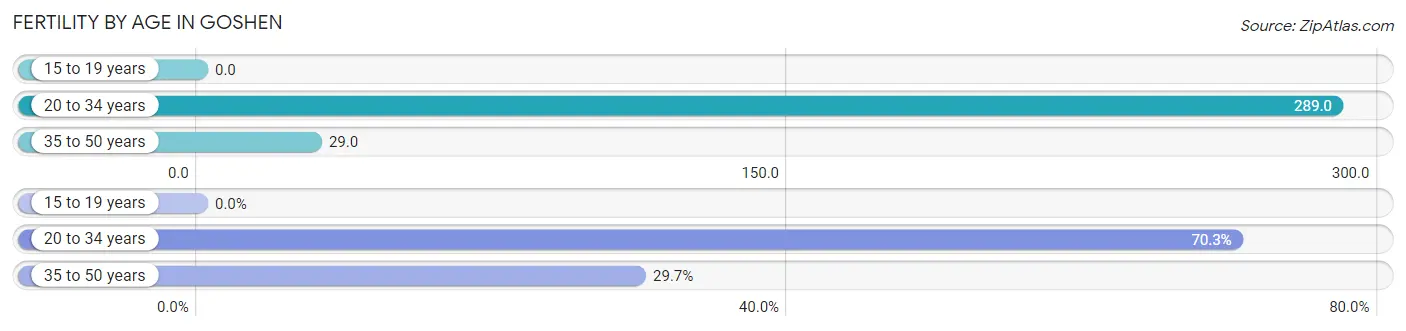
| Age Bracket | Women with Births | Births / 1,000 Women |
| 15 to 19 years | 0 (0.0%) | 0.0 |
| 20 to 34 years | 26 (70.3%) | 289.0 |
| 35 to 50 years | 11 (29.7%) | 29.0 |
| Total | 37 (100.0%) | 63.0 |
Fertility by Age by Marriage Status in Goshen
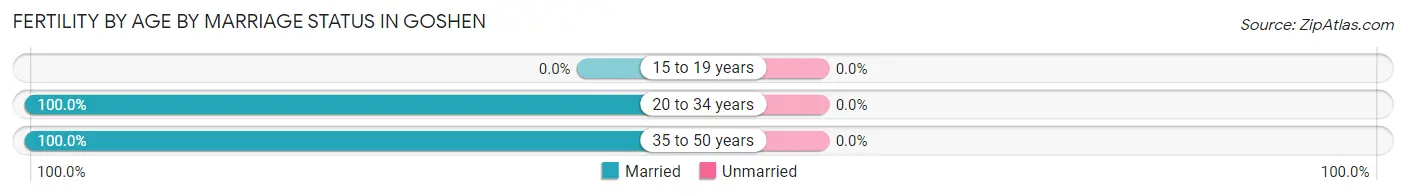
| Age Bracket | Married | Unmarried |
| 15 to 19 years | 0 (0.0%) | 0 (0.0%) |
| 20 to 34 years | 26 (100.0%) | 0 (0.0%) |
| 35 to 50 years | 11 (100.0%) | 0 (0.0%) |
| Total | 37 (100.0%) | 0 (0.0%) |
Fertility by Education in Goshen
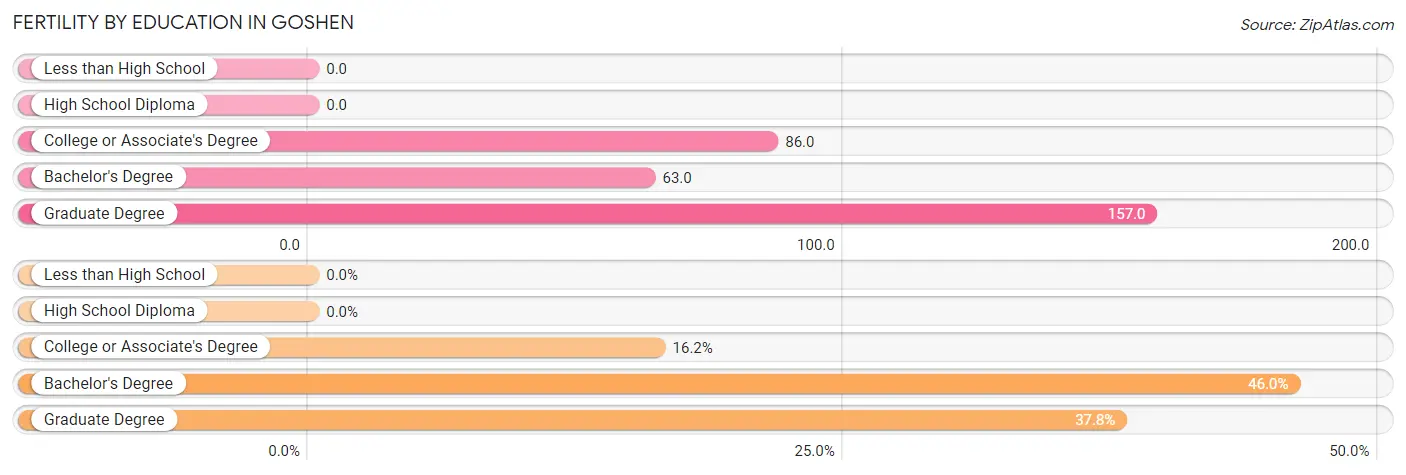
| Educational Attainment | Women with Births | Births / 1,000 Women |
| Less than High School | 0 (0.0%) | 0.0 |
| High School Diploma | 0 (0.0%) | 0.0 |
| College or Associate's Degree | 6 (16.2%) | 86.0 |
| Bachelor's Degree | 17 (46.0%) | 63.0 |
| Graduate Degree | 14 (37.8%) | 157.0 |
| Total | 37 (100.0%) | 63.0 |
Fertility by Education by Marriage Status in Goshen
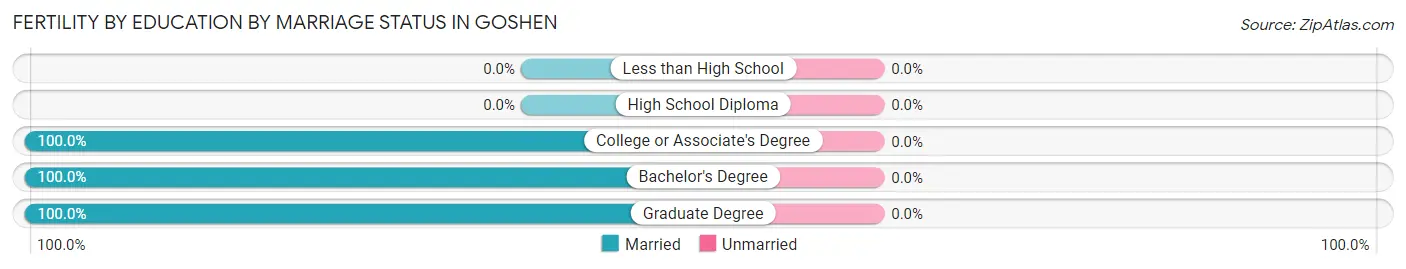
| Educational Attainment | Married | Unmarried |
| Less than High School | 0 (0.0%) | 0 (0.0%) |
| High School Diploma | 0 (0.0%) | 0 (0.0%) |
| College or Associate's Degree | 6 (100.0%) | 0 (0.0%) |
| Bachelor's Degree | 17 (100.0%) | 0 (0.0%) |
| Graduate Degree | 14 (100.0%) | 0 (0.0%) |
| Total | 37 (100.0%) | 0 (0.0%) |
Employment Characteristics in Goshen
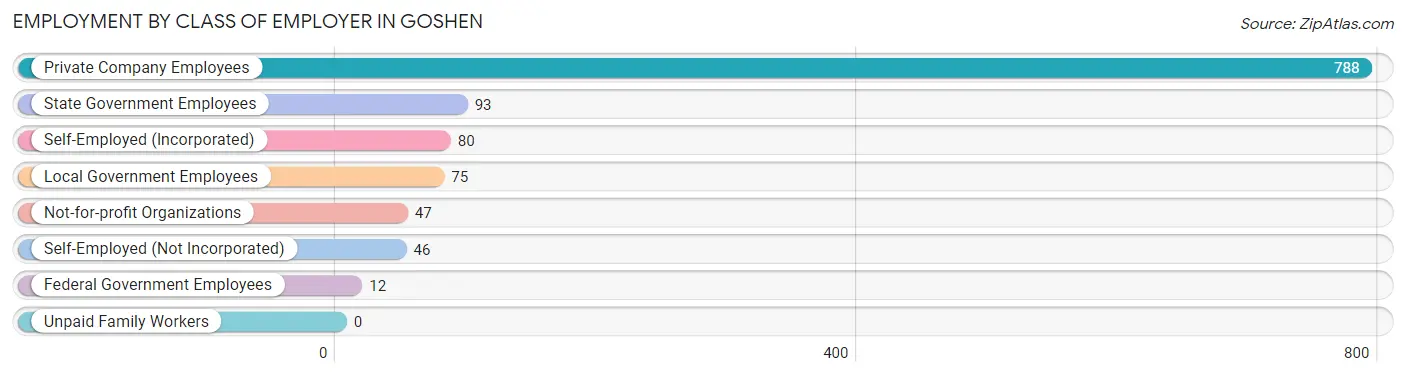
Employment by Class of Employer in Goshen
Among the 1,141 employed individuals in Goshen, private company employees (788 | 69.1%), state government employees (93 | 8.2%), and self-employed (incorporated) (80 | 7.0%) make up the most common classes of employment.
| Employer Class | # Employees | % Employees |
| Private Company Employees | 788 | 69.1% |
| Self-Employed (Incorporated) | 80 | 7.0% |
| Self-Employed (Not Incorporated) | 46 | 4.0% |
| Not-for-profit Organizations | 47 | 4.1% |
| Local Government Employees | 75 | 6.6% |
| State Government Employees | 93 | 8.2% |
| Federal Government Employees | 12 | 1.1% |
| Unpaid Family Workers | 0 | 0.0% |
| Total | 1,141 | 100.0% |
Employment Status by Age in Goshen
According to the labor force statistics for Goshen, out of the total population over 16 years of age (1,789), 65.2% or 1,166 individuals are in the labor force, with 1.5% or 17 of them unemployed. The age group with the highest labor force participation rate is 25 to 29 years, with 100.0% or 18 individuals in the labor force. Within the labor force, the 20 to 24 years age range has the highest percentage of unemployed individuals, with 12.5% or 11 of them being unemployed.
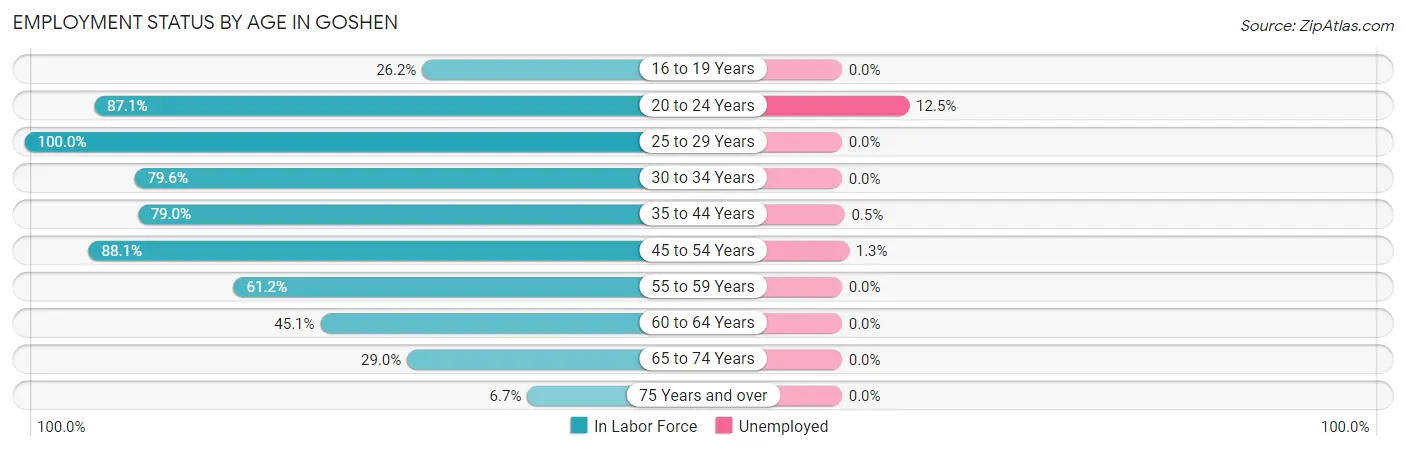
| Age Bracket | In Labor Force | Unemployed |
| 16 to 19 Years | 39 (26.2%) | 0 (0.0%) |
| 20 to 24 Years | 88 (87.1%) | 11 (12.5%) |
| 25 to 29 Years | 18 (100.0%) | 0 (0.0%) |
| 30 to 34 Years | 86 (79.6%) | 0 (0.0%) |
| 35 to 44 Years | 417 (79.0%) | 2 (0.5%) |
| 45 to 54 Years | 317 (88.1%) | 4 (1.3%) |
| 55 to 59 Years | 93 (61.2%) | 0 (0.0%) |
| 60 to 64 Years | 37 (45.1%) | 0 (0.0%) |
| 65 to 74 Years | 67 (29.0%) | 0 (0.0%) |
| 75 Years and over | 4 (6.7%) | 0 (0.0%) |
| Total | 1,166 (65.2%) | 17 (1.5%) |
Employment Status by Educational Attainment in Goshen
According to labor force statistics for Goshen, 77.6% of individuals (968) out of the total population between 25 and 64 years of age (1,248) are in the labor force, with 0.6% or 6 of them being unemployed. The group with the highest labor force participation rate are those with the educational attainment of less than high school, with 100.0% or 7 individuals in the labor force. Within the labor force, individuals with bachelor's degree or higher education have the highest percentage of unemployment, with 0.9% or 6 of them being unemployed.
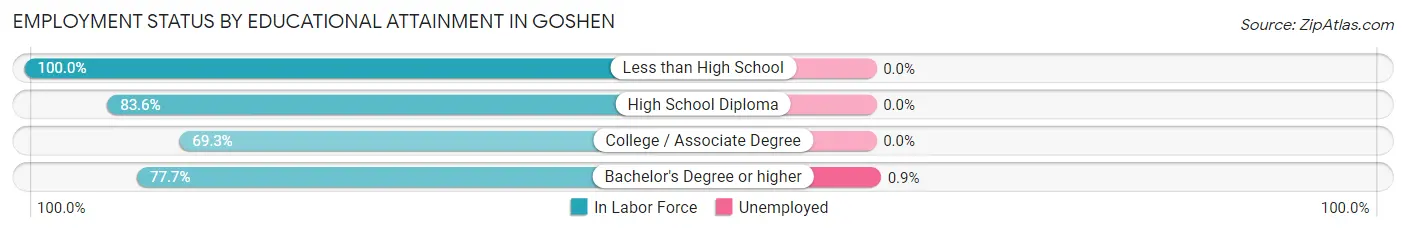
| Educational Attainment | In Labor Force | Unemployed |
| Less than High School | 7 (100.0%) | 0 (0.0%) |
| High School Diploma | 153 (83.6%) | 0 (0.0%) |
| College / Associate Degree | 115 (69.3%) | 0 (0.0%) |
| Bachelor's Degree or higher | 693 (77.7%) | 8 (0.9%) |
| Total | 968 (77.6%) | 7 (0.6%) |
Employment Occupations by Sex in Goshen
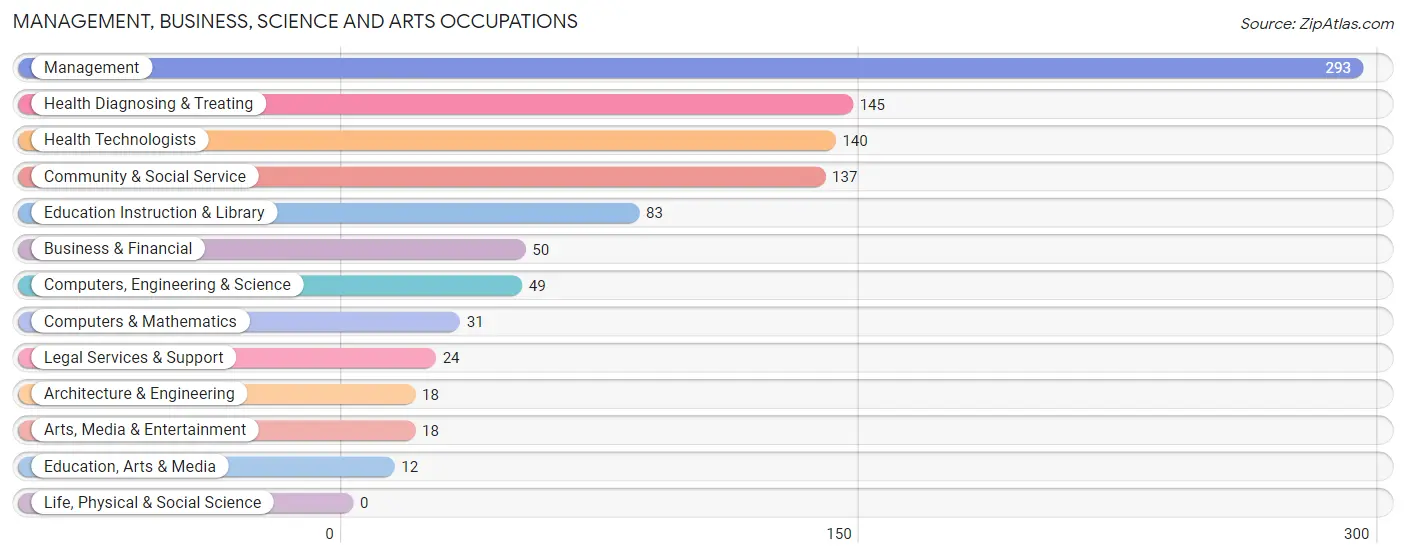
Management, Business, Science and Arts Occupations
The most common Management, Business, Science and Arts occupations in Goshen are Management (293 | 25.5%), Health Diagnosing & Treating (145 | 12.6%), Health Technologists (140 | 12.2%), Community & Social Service (137 | 11.9%), and Education Instruction & Library (83 | 7.2%).
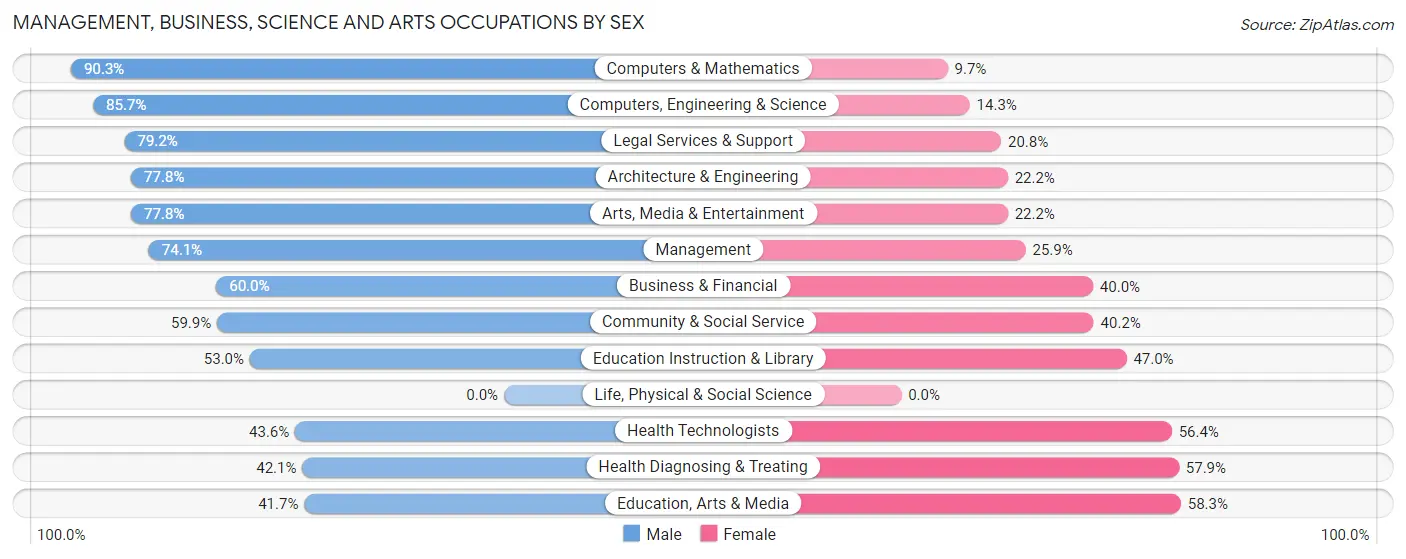
Management, Business, Science and Arts Occupations by Sex
Within the Management, Business, Science and Arts occupations in Goshen, the most male-oriented occupations are Computers & Mathematics (90.3%), Computers, Engineering & Science (85.7%), and Legal Services & Support (79.2%), while the most female-oriented occupations are Education, Arts & Media (58.3%), Health Diagnosing & Treating (57.9%), and Health Technologists (56.4%).
| Occupation | Male | Female |
| Management | 217 (74.1%) | 76 (25.9%) |
| Business & Financial | 30 (60.0%) | 20 (40.0%) |
| Computers, Engineering & Science | 42 (85.7%) | 7 (14.3%) |
| Computers & Mathematics | 28 (90.3%) | 3 (9.7%) |
| Architecture & Engineering | 14 (77.8%) | 4 (22.2%) |
| Life, Physical & Social Science | 0 (0.0%) | 0 (0.0%) |
| Community & Social Service | 82 (59.9%) | 55 (40.2%) |
| Education, Arts & Media | 5 (41.7%) | 7 (58.3%) |
| Legal Services & Support | 19 (79.2%) | 5 (20.8%) |
| Education Instruction & Library | 44 (53.0%) | 39 (47.0%) |
| Arts, Media & Entertainment | 14 (77.8%) | 4 (22.2%) |
| Health Diagnosing & Treating | 61 (42.1%) | 84 (57.9%) |
| Health Technologists | 61 (43.6%) | 79 (56.4%) |
| Total (Category) | 432 (64.1%) | 242 (35.9%) |
| Total (Overall) | 707 (61.5%) | 442 (38.5%) |
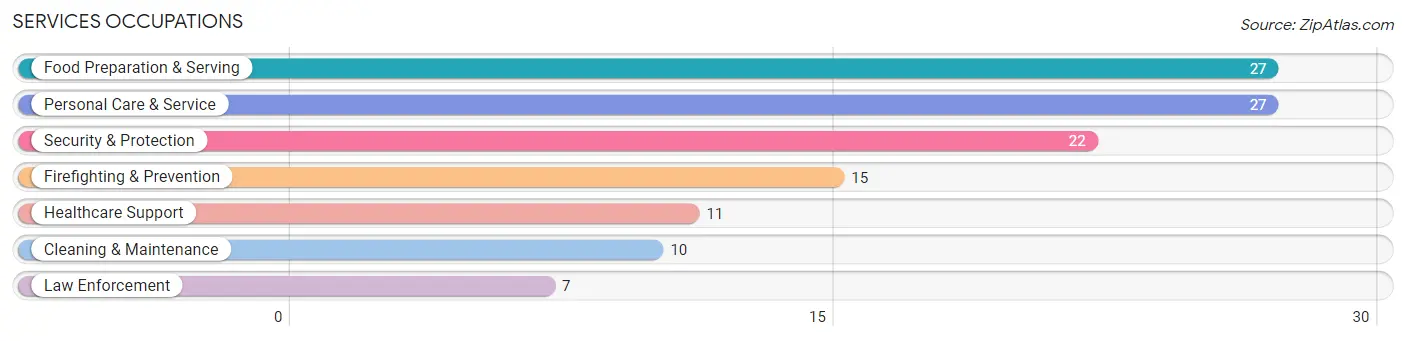
Services Occupations
The most common Services occupations in Goshen are Food Preparation & Serving (27 | 2.4%), Personal Care & Service (27 | 2.4%), Security & Protection (22 | 1.9%), Firefighting & Prevention (15 | 1.3%), and Healthcare Support (11 | 1.0%).
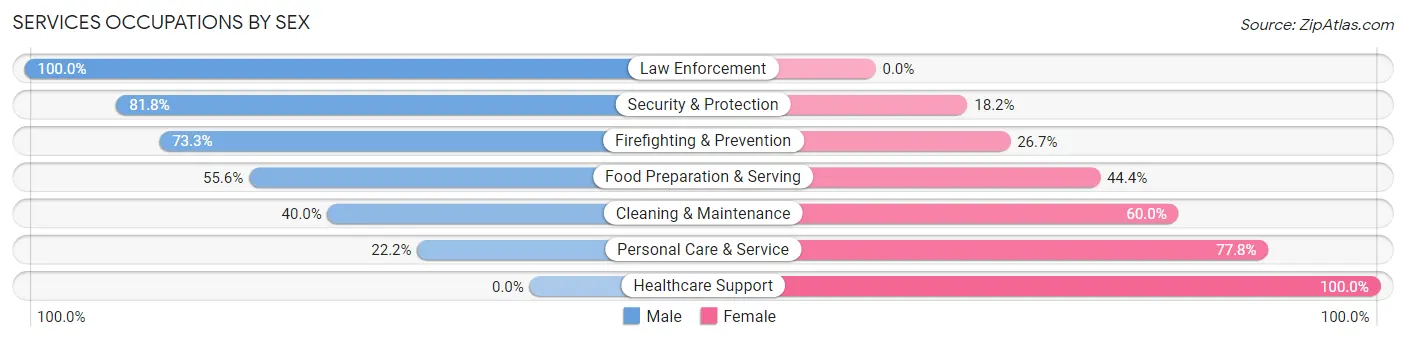
Services Occupations by Sex
Within the Services occupations in Goshen, the most male-oriented occupations are Law Enforcement (100.0%), Security & Protection (81.8%), and Firefighting & Prevention (73.3%), while the most female-oriented occupations are Healthcare Support (100.0%), Personal Care & Service (77.8%), and Cleaning & Maintenance (60.0%).
| Occupation | Male | Female |
| Healthcare Support | 0 (0.0%) | 11 (100.0%) |
| Security & Protection | 18 (81.8%) | 4 (18.2%) |
| Firefighting & Prevention | 11 (73.3%) | 4 (26.7%) |
| Law Enforcement | 7 (100.0%) | 0 (0.0%) |
| Food Preparation & Serving | 15 (55.6%) | 12 (44.4%) |
| Cleaning & Maintenance | 4 (40.0%) | 6 (60.0%) |
| Personal Care & Service | 6 (22.2%) | 21 (77.8%) |
| Total (Category) | 43 (44.3%) | 54 (55.7%) |
| Total (Overall) | 707 (61.5%) | 442 (38.5%) |
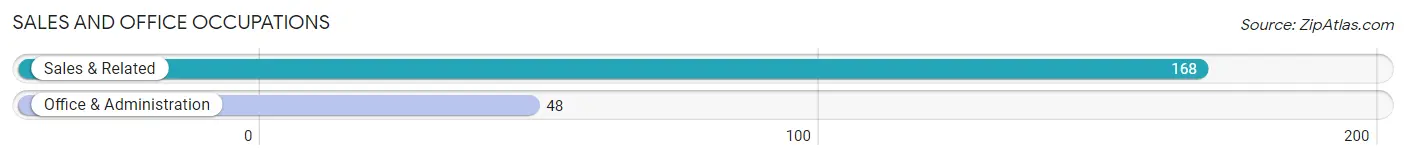
Sales and Office Occupations
The most common Sales and Office occupations in Goshen are Sales & Related (168 | 14.6%), and Office & Administration (48 | 4.2%).
Sales and Office Occupations by Sex
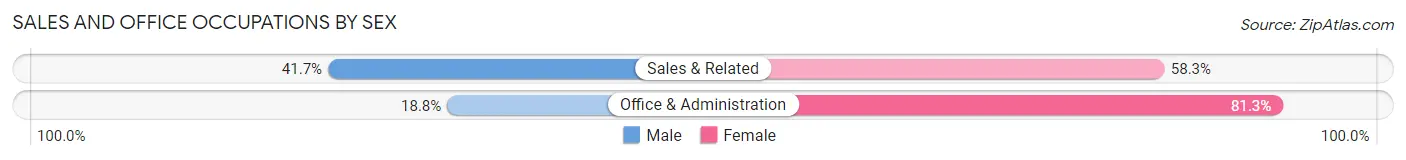
| Occupation | Male | Female |
| Sales & Related | 70 (41.7%) | 98 (58.3%) |
| Office & Administration | 9 (18.8%) | 39 (81.2%) |
| Total (Category) | 79 (36.6%) | 137 (63.4%) |
| Total (Overall) | 707 (61.5%) | 442 (38.5%) |
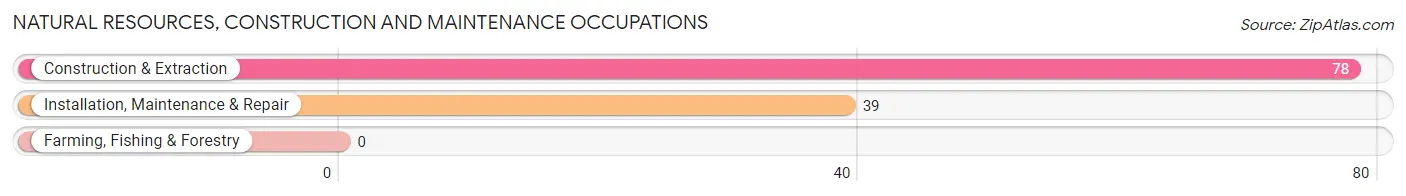
Natural Resources, Construction and Maintenance Occupations
The most common Natural Resources, Construction and Maintenance occupations in Goshen are Construction & Extraction (78 | 6.8%), and Installation, Maintenance & Repair (39 | 3.4%).
Natural Resources, Construction and Maintenance Occupations by Sex
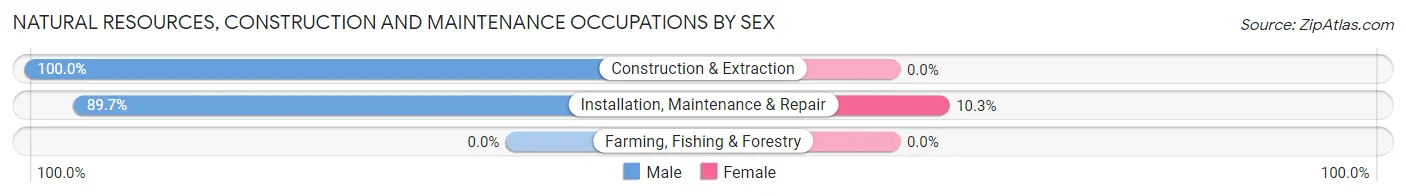
| Occupation | Male | Female |
| Farming, Fishing & Forestry | 0 (0.0%) | 0 (0.0%) |
| Construction & Extraction | 78 (100.0%) | 0 (0.0%) |
| Installation, Maintenance & Repair | 35 (89.7%) | 4 (10.3%) |
| Total (Category) | 113 (96.6%) | 4 (3.4%) |
| Total (Overall) | 707 (61.5%) | 442 (38.5%) |
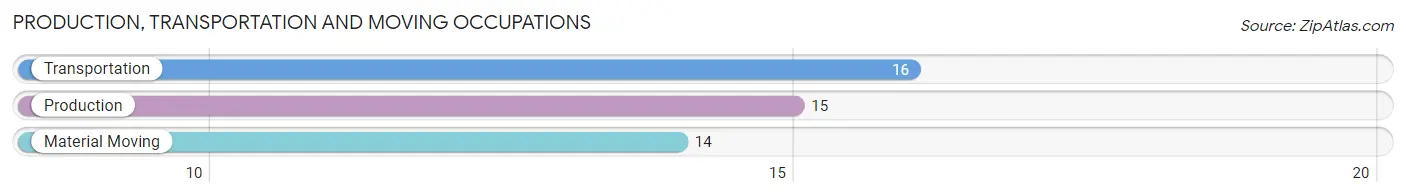
Production, Transportation and Moving Occupations
The most common Production, Transportation and Moving occupations in Goshen are Transportation (16 | 1.4%), Production (15 | 1.3%), and Material Moving (14 | 1.2%).
Production, Transportation and Moving Occupations by Sex
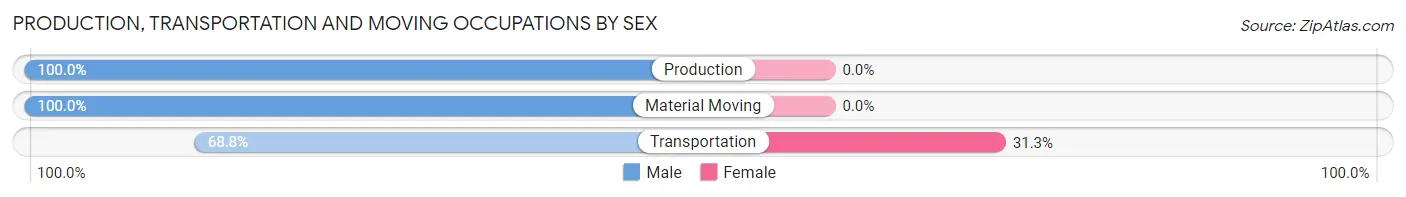
| Occupation | Male | Female |
| Production | 15 (100.0%) | 0 (0.0%) |
| Transportation | 11 (68.8%) | 5 (31.2%) |
| Material Moving | 14 (100.0%) | 0 (0.0%) |
| Total (Category) | 40 (88.9%) | 5 (11.1%) |
| Total (Overall) | 707 (61.5%) | 442 (38.5%) |
Employment Industries by Sex in Goshen
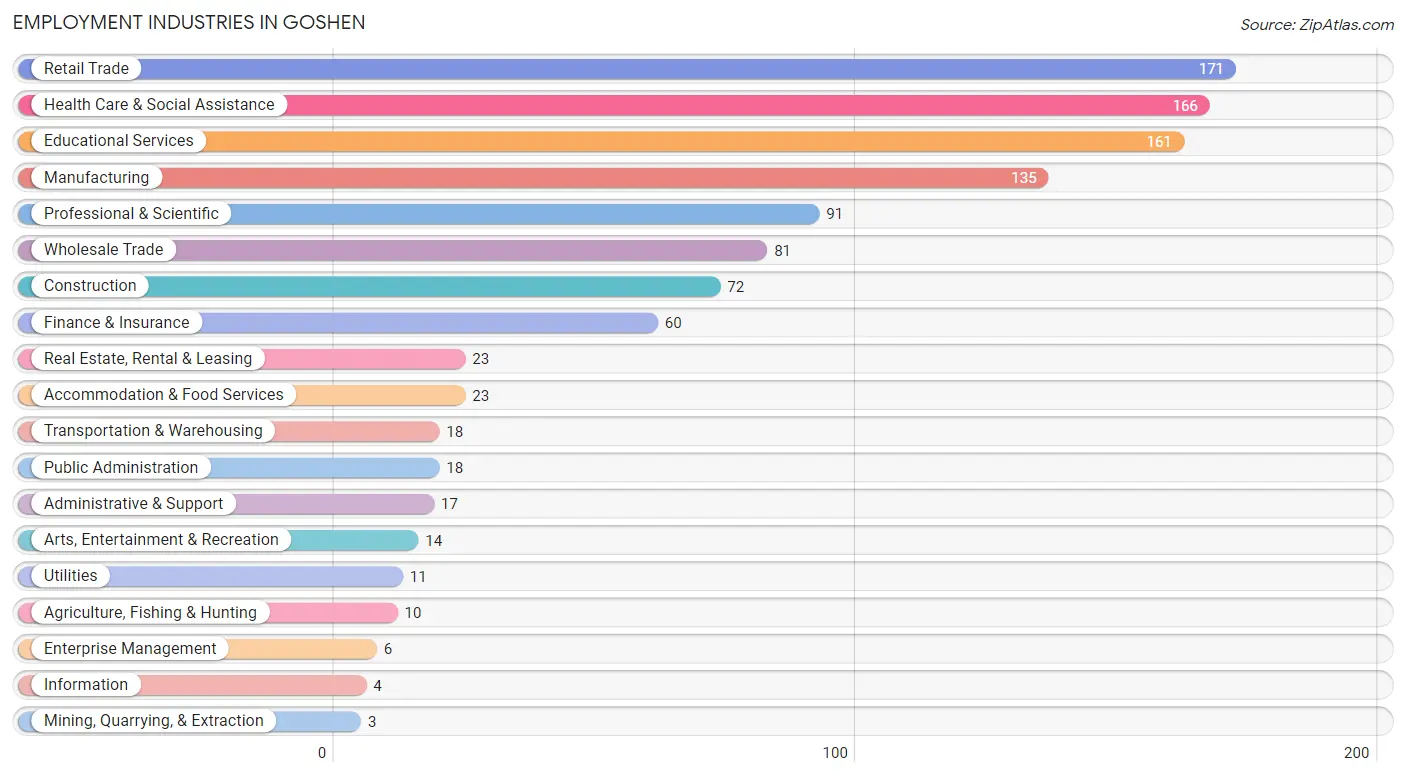
Employment Industries in Goshen
The major employment industries in Goshen include Retail Trade (171 | 14.9%), Health Care & Social Assistance (166 | 14.4%), Educational Services (161 | 14.0%), Manufacturing (135 | 11.7%), and Professional & Scientific (91 | 7.9%).
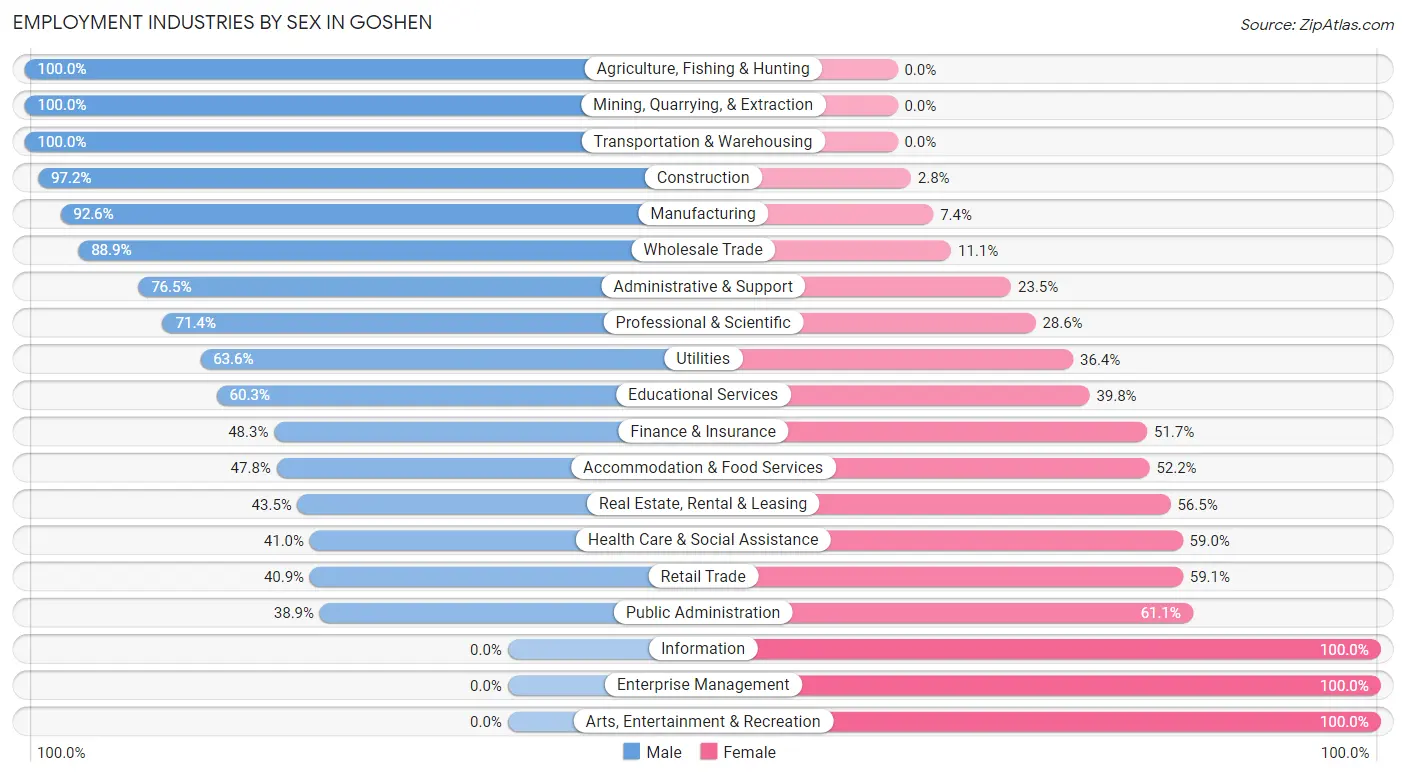
Employment Industries by Sex in Goshen
The Goshen industries that see more men than women are Agriculture, Fishing & Hunting (100.0%), Mining, Quarrying, & Extraction (100.0%), and Transportation & Warehousing (100.0%), whereas the industries that tend to have a higher number of women are Information (100.0%), Enterprise Management (100.0%), and Arts, Entertainment & Recreation (100.0%).
| Industry | Male | Female |
| Agriculture, Fishing & Hunting | 10 (100.0%) | 0 (0.0%) |
| Mining, Quarrying, & Extraction | 3 (100.0%) | 0 (0.0%) |
| Construction | 70 (97.2%) | 2 (2.8%) |
| Manufacturing | 125 (92.6%) | 10 (7.4%) |
| Wholesale Trade | 72 (88.9%) | 9 (11.1%) |
| Retail Trade | 70 (40.9%) | 101 (59.1%) |
| Transportation & Warehousing | 18 (100.0%) | 0 (0.0%) |
| Utilities | 7 (63.6%) | 4 (36.4%) |
| Information | 0 (0.0%) | 4 (100.0%) |
| Finance & Insurance | 29 (48.3%) | 31 (51.7%) |
| Real Estate, Rental & Leasing | 10 (43.5%) | 13 (56.5%) |
| Professional & Scientific | 65 (71.4%) | 26 (28.6%) |
| Enterprise Management | 0 (0.0%) | 6 (100.0%) |
| Administrative & Support | 13 (76.5%) | 4 (23.5%) |
| Educational Services | 97 (60.3%) | 64 (39.8%) |
| Health Care & Social Assistance | 68 (41.0%) | 98 (59.0%) |
| Arts, Entertainment & Recreation | 0 (0.0%) | 14 (100.0%) |
| Accommodation & Food Services | 11 (47.8%) | 12 (52.2%) |
| Public Administration | 7 (38.9%) | 11 (61.1%) |
| Total | 707 (61.5%) | 442 (38.5%) |
Education in Goshen
School Enrollment in Goshen
The most common levels of schooling among the 813 students in Goshen are elementary school (259 | 31.9%), high school (198 | 24.3%), and middle school (165 | 20.3%).
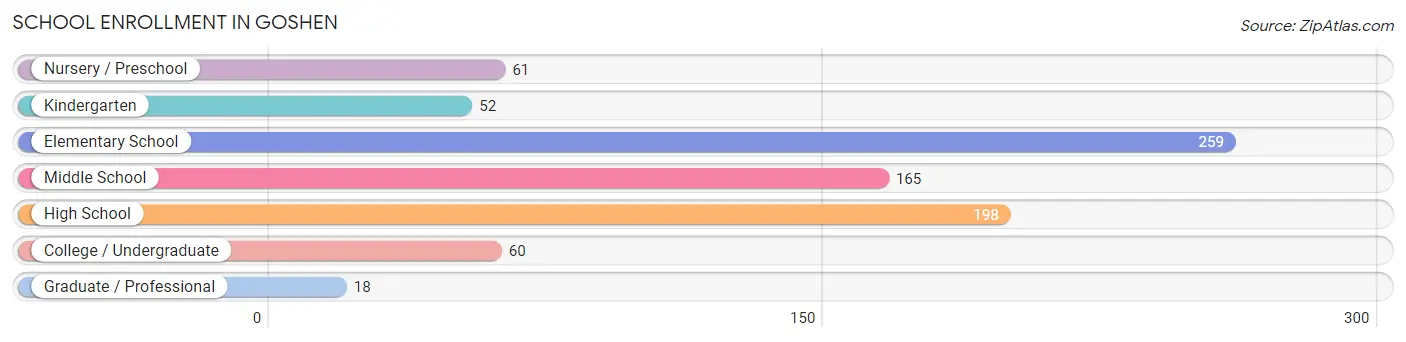
| School Level | # Students | % Students |
| Nursery / Preschool | 61 | 7.5% |
| Kindergarten | 52 | 6.4% |
| Elementary School | 259 | 31.9% |
| Middle School | 165 | 20.3% |
| High School | 198 | 24.3% |
| College / Undergraduate | 60 | 7.4% |
| Graduate / Professional | 18 | 2.2% |
| Total | 813 | 100.0% |
School Enrollment by Age by Funding Source in Goshen
Out of a total of 813 students who are enrolled in schools in Goshen, 101 (12.4%) attend a private institution, while the remaining 712 (87.6%) are enrolled in public schools. The age group of 3 to 4 year olds has the highest likelihood of being enrolled in private schools, with 39 (61.9% in the age bracket) enrolled. Conversely, the age group of 20 to 24 year olds has the lowest likelihood of being enrolled in a private school, with 27 (100.0% in the age bracket) attending a public institution.
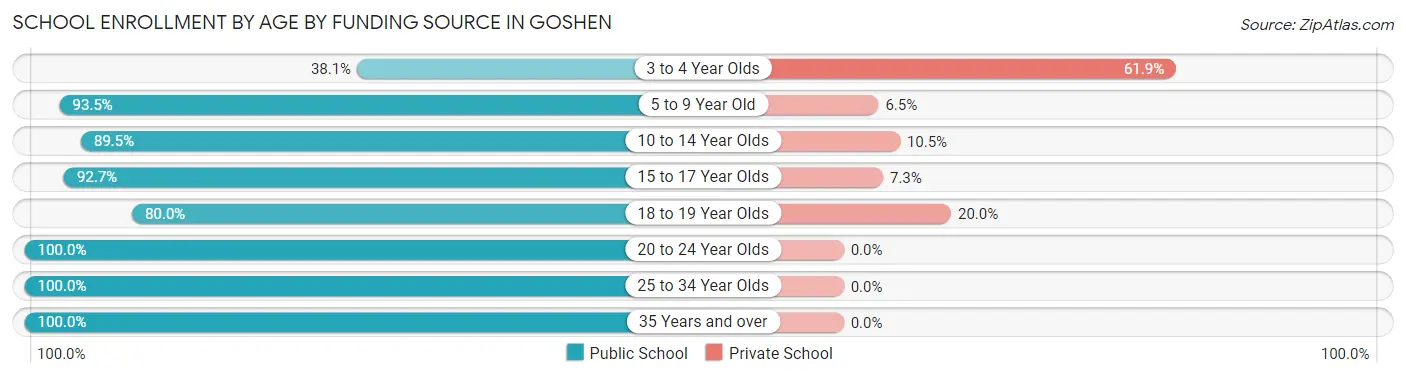
| Age Bracket | Public School | Private School |
| 3 to 4 Year Olds | 24 (38.1%) | 39 (61.9%) |
| 5 to 9 Year Old | 245 (93.5%) | 17 (6.5%) |
| 10 to 14 Year Olds | 205 (89.5%) | 24 (10.5%) |
| 15 to 17 Year Olds | 139 (92.7%) | 11 (7.3%) |
| 18 to 19 Year Olds | 40 (80.0%) | 10 (20.0%) |
| 20 to 24 Year Olds | 27 (100.0%) | 0 (0.0%) |
| 25 to 34 Year Olds | 19 (100.0%) | 0 (0.0%) |
| 35 Years and over | 13 (100.0%) | 0 (0.0%) |
| Total | 712 (87.6%) | 101 (12.4%) |
Educational Attainment by Field of Study in Goshen
Business (376 | 33.5%), education (122 | 10.9%), science & technology (117 | 10.4%), bio, nature & agricultural (106 | 9.5%), and social sciences (80 | 7.1%) are the most common fields of study among 1,122 individuals in Goshen who have obtained a bachelor's degree or higher.
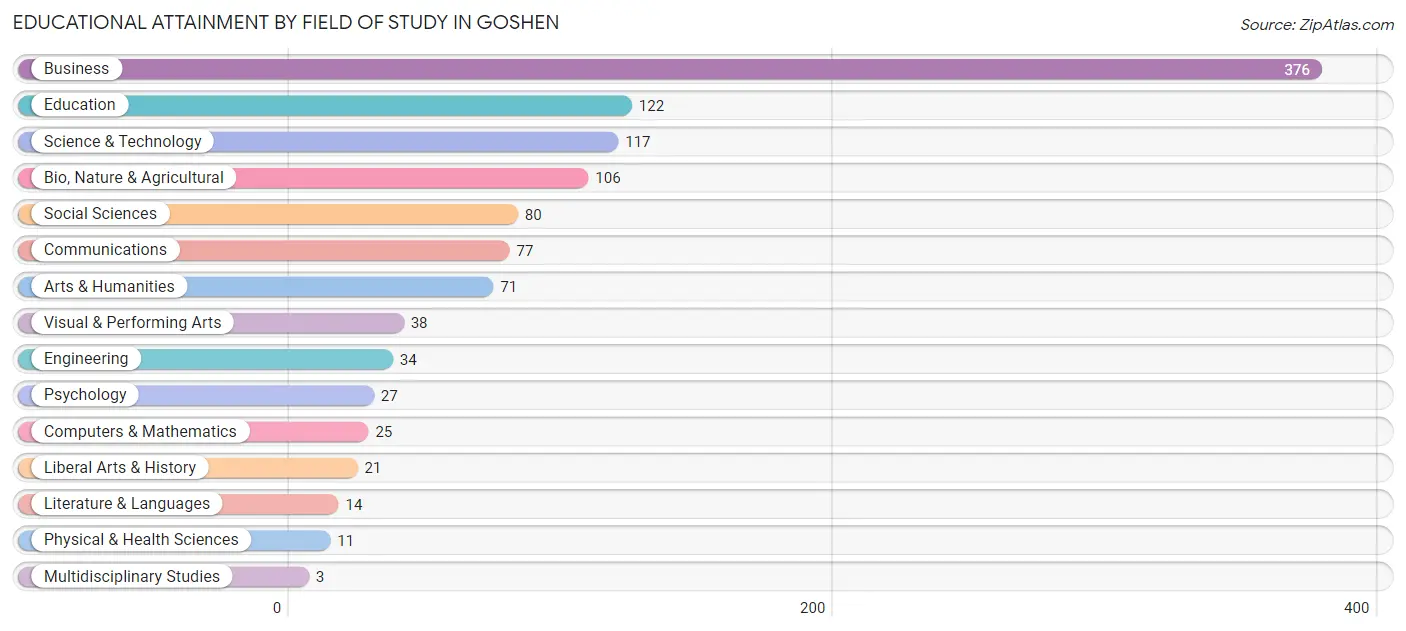
| Field of Study | # Graduates | % Graduates |
| Computers & Mathematics | 25 | 2.2% |
| Bio, Nature & Agricultural | 106 | 9.5% |
| Physical & Health Sciences | 11 | 1.0% |
| Psychology | 27 | 2.4% |
| Social Sciences | 80 | 7.1% |
| Engineering | 34 | 3.0% |
| Multidisciplinary Studies | 3 | 0.3% |
| Science & Technology | 117 | 10.4% |
| Business | 376 | 33.5% |
| Education | 122 | 10.9% |
| Literature & Languages | 14 | 1.3% |
| Liberal Arts & History | 21 | 1.9% |
| Visual & Performing Arts | 38 | 3.4% |
| Communications | 77 | 6.9% |
| Arts & Humanities | 71 | 6.3% |
| Total | 1,122 | 100.0% |
Transportation & Commute in Goshen
Vehicle Availability by Sex in Goshen
The most prevalent vehicle ownership categories in Goshen are males with 2 vehicles (323, accounting for 46.0%) and females with 2 vehicles (229, making up 73.7%).
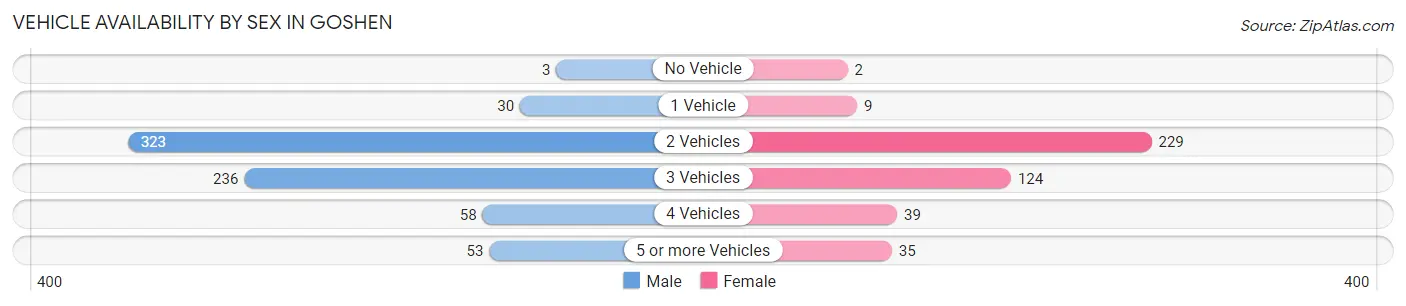
| Vehicles Available | Male | Female |
| No Vehicle | 3 (0.4%) | 2 (0.5%) |
| 1 Vehicle | 30 (4.3%) | 9 (2.1%) |
| 2 Vehicles | 323 (46.0%) | 229 (52.3%) |
| 3 Vehicles | 236 (33.6%) | 124 (28.3%) |
| 4 Vehicles | 58 (8.3%) | 39 (8.9%) |
| 5 or more Vehicles | 53 (7.5%) | 35 (8.0%) |
| Total | 703 (100.0%) | 438 (100.0%) |
Commute Time in Goshen
The most frequently occuring commute durations in Goshen are 20 to 24 minutes (325 commuters, 32.1%), 15 to 19 minutes (160 commuters, 15.8%), and 25 to 29 minutes (140 commuters, 13.8%).
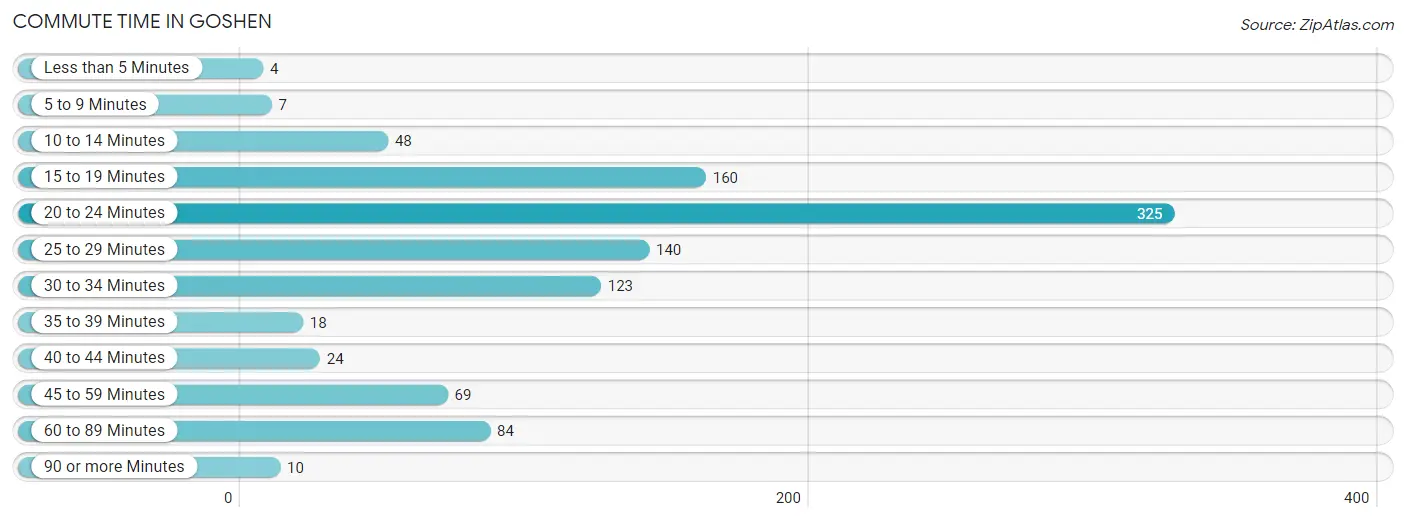
| Commute Time | # Commuters | % Commuters |
| Less than 5 Minutes | 4 | 0.4% |
| 5 to 9 Minutes | 7 | 0.7% |
| 10 to 14 Minutes | 48 | 4.7% |
| 15 to 19 Minutes | 160 | 15.8% |
| 20 to 24 Minutes | 325 | 32.1% |
| 25 to 29 Minutes | 140 | 13.8% |
| 30 to 34 Minutes | 123 | 12.1% |
| 35 to 39 Minutes | 18 | 1.8% |
| 40 to 44 Minutes | 24 | 2.4% |
| 45 to 59 Minutes | 69 | 6.8% |
| 60 to 89 Minutes | 84 | 8.3% |
| 90 or more Minutes | 10 | 1.0% |
Commute Time by Sex in Goshen
The most common commute times in Goshen are 20 to 24 minutes (189 commuters, 29.9%) for males and 20 to 24 minutes (136 commuters, 35.8%) for females.
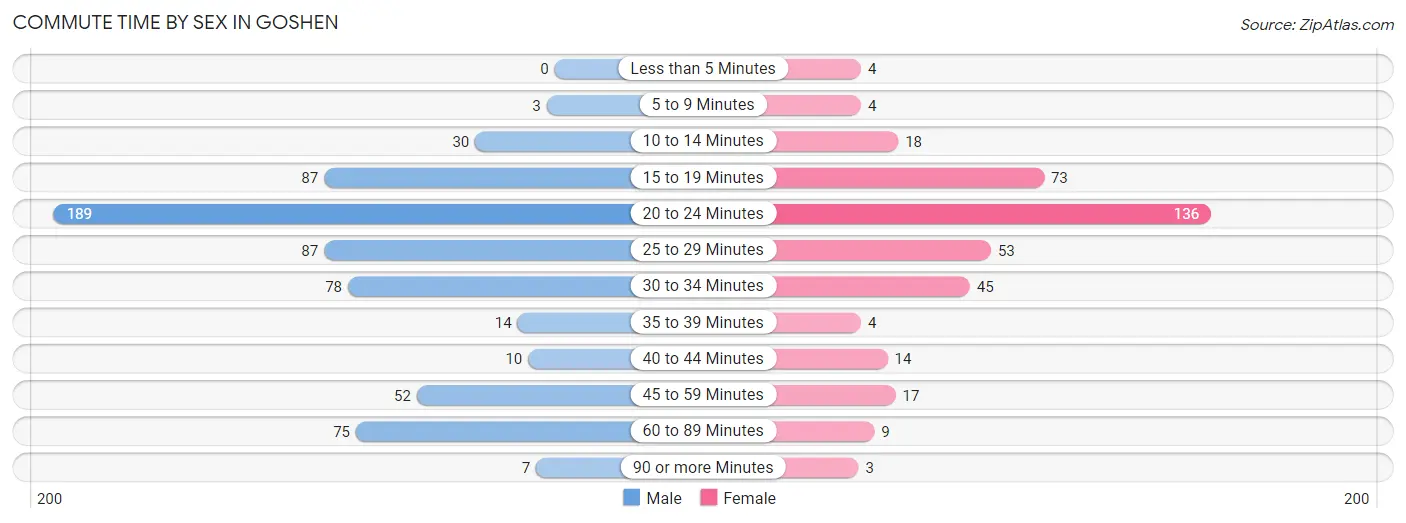
| Commute Time | Male | Female |
| Less than 5 Minutes | 0 (0.0%) | 4 (1.1%) |
| 5 to 9 Minutes | 3 (0.5%) | 4 (1.1%) |
| 10 to 14 Minutes | 30 (4.8%) | 18 (4.7%) |
| 15 to 19 Minutes | 87 (13.8%) | 73 (19.2%) |
| 20 to 24 Minutes | 189 (29.9%) | 136 (35.8%) |
| 25 to 29 Minutes | 87 (13.8%) | 53 (14.0%) |
| 30 to 34 Minutes | 78 (12.3%) | 45 (11.8%) |
| 35 to 39 Minutes | 14 (2.2%) | 4 (1.1%) |
| 40 to 44 Minutes | 10 (1.6%) | 14 (3.7%) |
| 45 to 59 Minutes | 52 (8.2%) | 17 (4.5%) |
| 60 to 89 Minutes | 75 (11.9%) | 9 (2.4%) |
| 90 or more Minutes | 7 (1.1%) | 3 (0.8%) |
Time of Departure to Work by Sex in Goshen
The most frequent times of departure to work in Goshen are 7:00 AM to 7:29 AM (191, 30.2%) for males and 7:00 AM to 7:29 AM (110, 28.9%) for females.
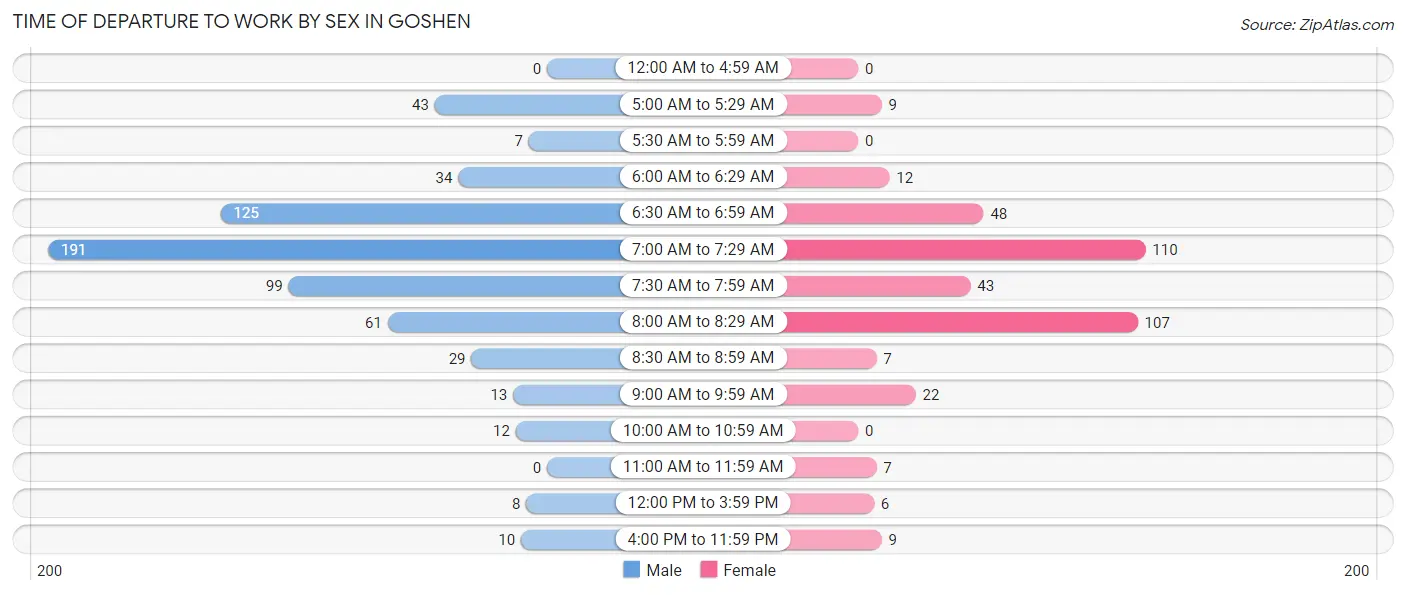
| Time of Departure | Male | Female |
| 12:00 AM to 4:59 AM | 0 (0.0%) | 0 (0.0%) |
| 5:00 AM to 5:29 AM | 43 (6.8%) | 9 (2.4%) |
| 5:30 AM to 5:59 AM | 7 (1.1%) | 0 (0.0%) |
| 6:00 AM to 6:29 AM | 34 (5.4%) | 12 (3.2%) |
| 6:30 AM to 6:59 AM | 125 (19.8%) | 48 (12.6%) |
| 7:00 AM to 7:29 AM | 191 (30.2%) | 110 (28.9%) |
| 7:30 AM to 7:59 AM | 99 (15.7%) | 43 (11.3%) |
| 8:00 AM to 8:29 AM | 61 (9.7%) | 107 (28.2%) |
| 8:30 AM to 8:59 AM | 29 (4.6%) | 7 (1.8%) |
| 9:00 AM to 9:59 AM | 13 (2.1%) | 22 (5.8%) |
| 10:00 AM to 10:59 AM | 12 (1.9%) | 0 (0.0%) |
| 11:00 AM to 11:59 AM | 0 (0.0%) | 7 (1.8%) |
| 12:00 PM to 3:59 PM | 8 (1.3%) | 6 (1.6%) |
| 4:00 PM to 11:59 PM | 10 (1.6%) | 9 (2.4%) |
| Total | 632 (100.0%) | 380 (100.0%) |
Housing Occupancy in Goshen
Occupancy by Ownership in Goshen
Of the total 807 dwellings in Goshen, owner-occupied units account for 769 (95.3%), while renter-occupied units make up 38 (4.7%).
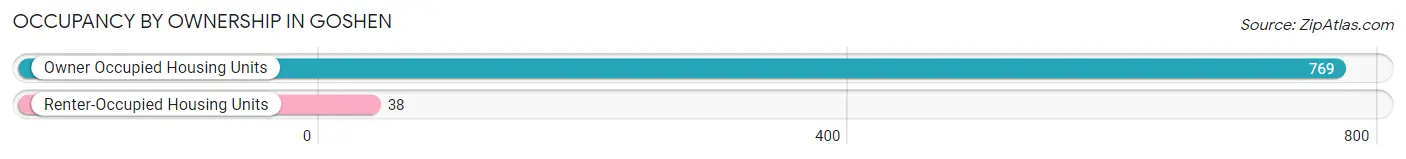
| Occupancy | # Housing Units | % Housing Units |
| Owner Occupied Housing Units | 769 | 95.3% |
| Renter-Occupied Housing Units | 38 | 4.7% |
| Total Occupied Housing Units | 807 | 100.0% |
Occupancy by Household Size in Goshen
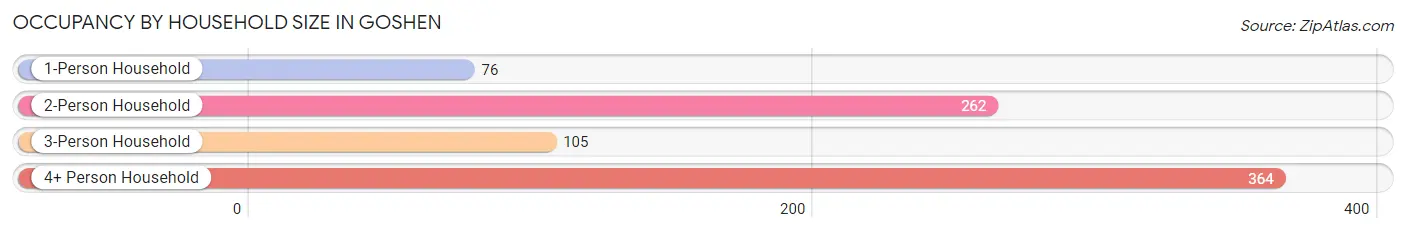
| Household Size | # Housing Units | % Housing Units |
| 1-Person Household | 76 | 9.4% |
| 2-Person Household | 262 | 32.5% |
| 3-Person Household | 105 | 13.0% |
| 4+ Person Household | 364 | 45.1% |
| Total Housing Units | 807 | 100.0% |
Occupancy by Ownership by Household Size in Goshen
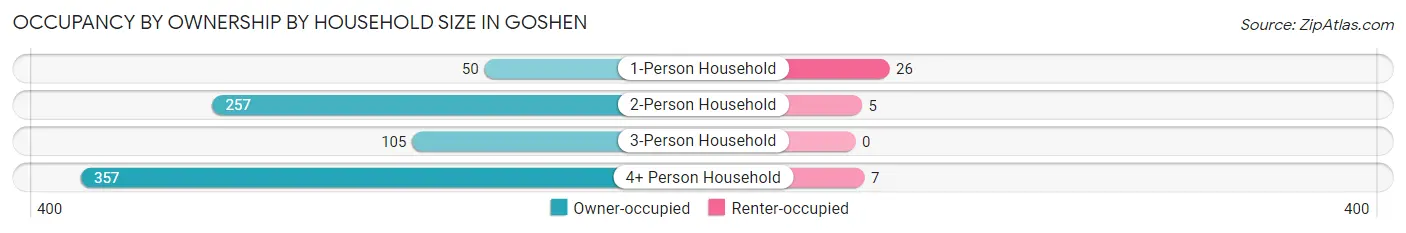
| Household Size | Owner-occupied | Renter-occupied |
| 1-Person Household | 50 (65.8%) | 26 (34.2%) |
| 2-Person Household | 257 (98.1%) | 5 (1.9%) |
| 3-Person Household | 105 (100.0%) | 0 (0.0%) |
| 4+ Person Household | 357 (98.1%) | 7 (1.9%) |
| Total Housing Units | 769 (95.3%) | 38 (4.7%) |
Occupancy by Educational Attainment in Goshen
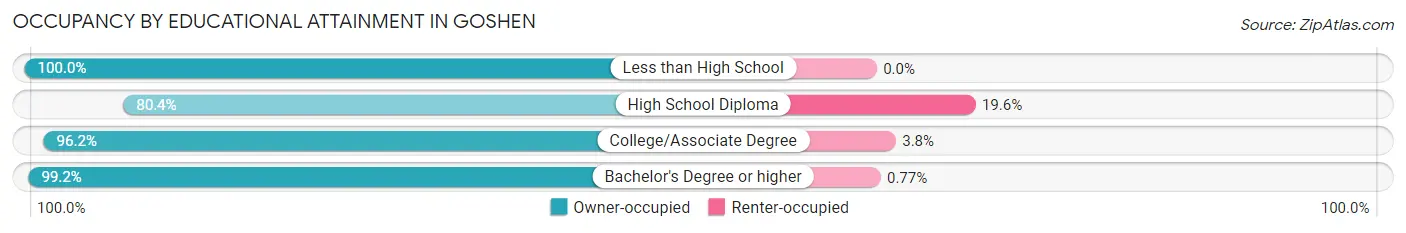
| Household Size | Owner-occupied | Renter-occupied |
| Less than High School | 7 (100.0%) | 0 (0.0%) |
| High School Diploma | 119 (80.4%) | 29 (19.6%) |
| College/Associate Degree | 127 (96.2%) | 5 (3.8%) |
| Bachelor's Degree or higher | 516 (99.2%) | 4 (0.8%) |
Occupancy by Age of Householder in Goshen
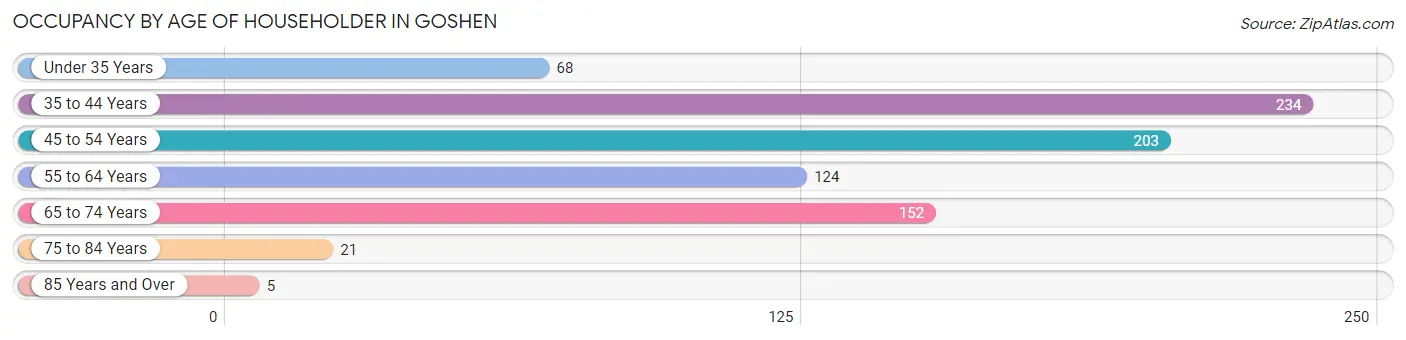
| Age Bracket | # Households | % Households |
| Under 35 Years | 68 | 8.4% |
| 35 to 44 Years | 234 | 29.0% |
| 45 to 54 Years | 203 | 25.2% |
| 55 to 64 Years | 124 | 15.4% |
| 65 to 74 Years | 152 | 18.8% |
| 75 to 84 Years | 21 | 2.6% |
| 85 Years and Over | 5 | 0.6% |
| Total | 807 | 100.0% |
Housing Finances in Goshen
Median Income by Occupancy in Goshen
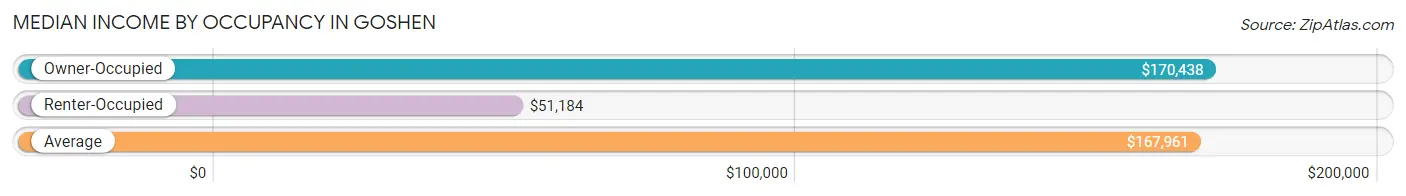
| Occupancy Type | # Households | Median Income |
| Owner-Occupied | 769 (95.3%) | $170,438 |
| Renter-Occupied | 38 (4.7%) | $51,184 |
| Average | 807 (100.0%) | $167,961 |
Occupancy by Householder Income Bracket in Goshen
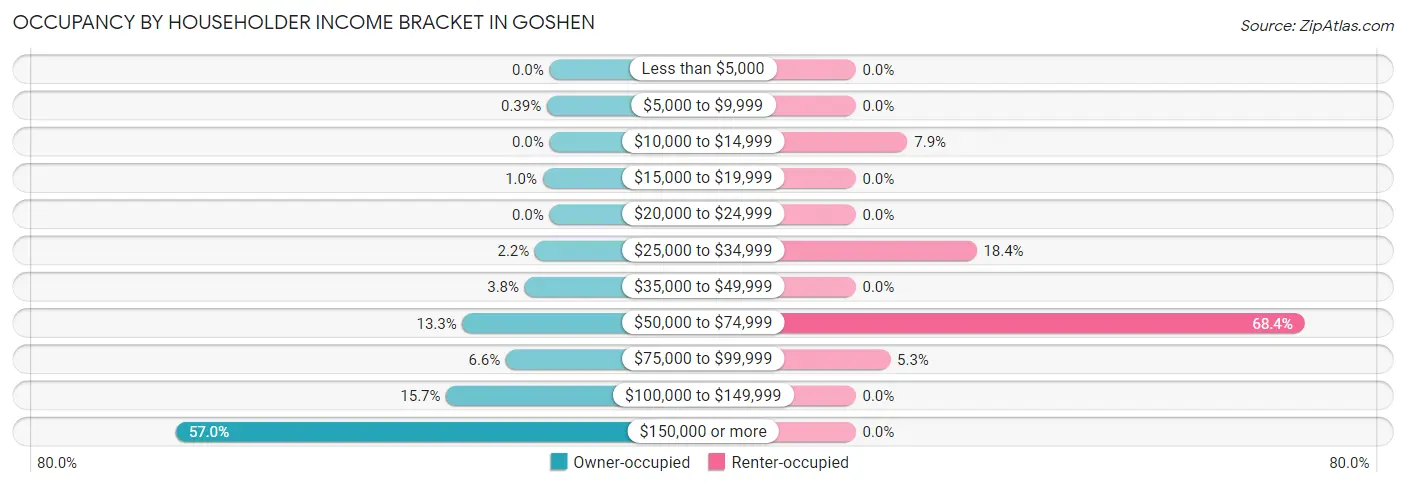
| Income Bracket | Owner-occupied | Renter-occupied |
| Less than $5,000 | 0 (0.0%) | 0 (0.0%) |
| $5,000 to $9,999 | 3 (0.4%) | 0 (0.0%) |
| $10,000 to $14,999 | 0 (0.0%) | 3 (7.9%) |
| $15,000 to $19,999 | 8 (1.0%) | 0 (0.0%) |
| $20,000 to $24,999 | 0 (0.0%) | 0 (0.0%) |
| $25,000 to $34,999 | 17 (2.2%) | 7 (18.4%) |
| $35,000 to $49,999 | 29 (3.8%) | 0 (0.0%) |
| $50,000 to $74,999 | 102 (13.3%) | 26 (68.4%) |
| $75,000 to $99,999 | 51 (6.6%) | 2 (5.3%) |
| $100,000 to $149,999 | 121 (15.7%) | 0 (0.0%) |
| $150,000 or more | 438 (57.0%) | 0 (0.0%) |
| Total | 769 (100.0%) | 38 (100.0%) |
Monthly Housing Cost Tiers in Goshen
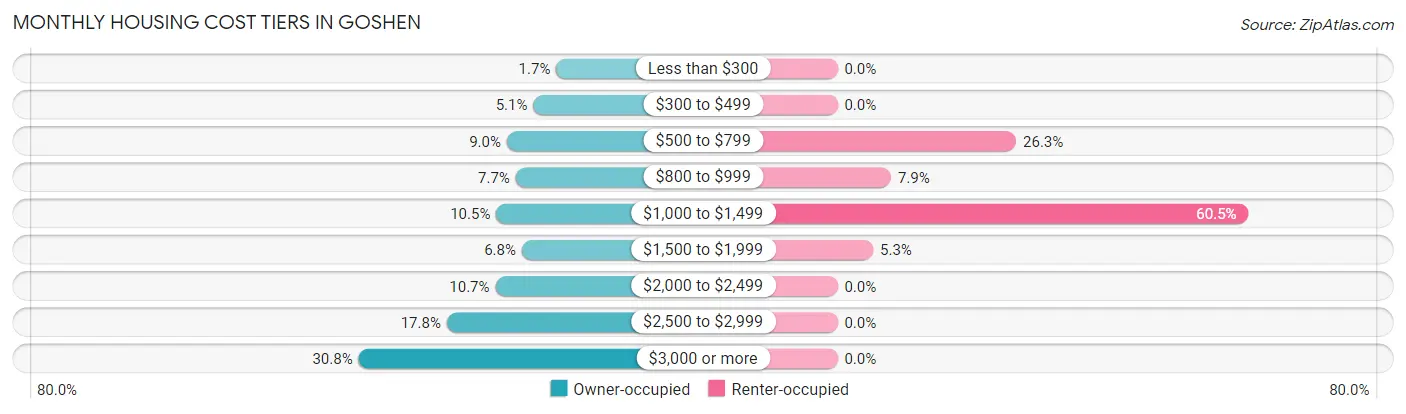
| Monthly Cost | Owner-occupied | Renter-occupied |
| Less than $300 | 13 (1.7%) | 0 (0.0%) |
| $300 to $499 | 39 (5.1%) | 0 (0.0%) |
| $500 to $799 | 69 (9.0%) | 10 (26.3%) |
| $800 to $999 | 59 (7.7%) | 3 (7.9%) |
| $1,000 to $1,499 | 81 (10.5%) | 23 (60.5%) |
| $1,500 to $1,999 | 52 (6.8%) | 2 (5.3%) |
| $2,000 to $2,499 | 82 (10.7%) | 0 (0.0%) |
| $2,500 to $2,999 | 137 (17.8%) | 0 (0.0%) |
| $3,000 or more | 237 (30.8%) | 0 (0.0%) |
| Total | 769 (100.0%) | 38 (100.0%) |
Physical Housing Characteristics in Goshen
Housing Structures in Goshen
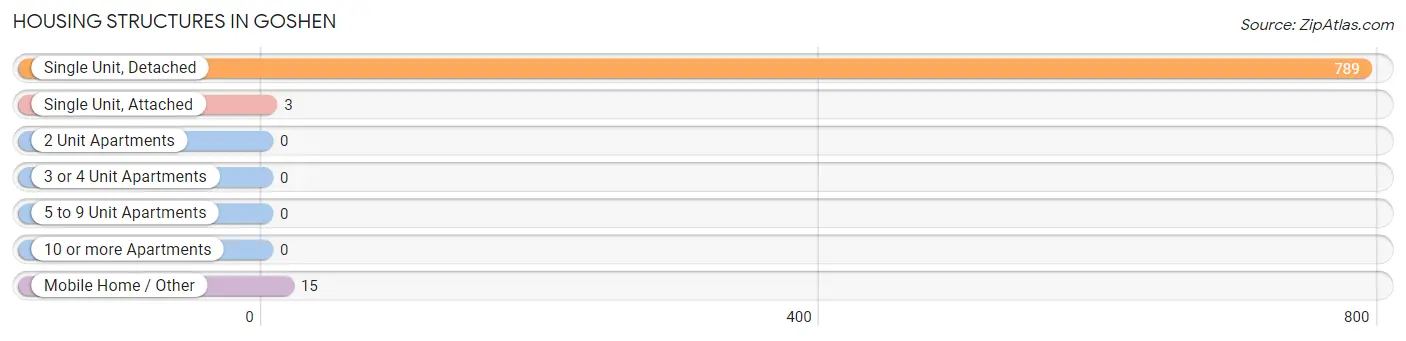
| Structure Type | # Housing Units | % Housing Units |
| Single Unit, Detached | 789 | 97.8% |
| Single Unit, Attached | 3 | 0.4% |
| 2 Unit Apartments | 0 | 0.0% |
| 3 or 4 Unit Apartments | 0 | 0.0% |
| 5 to 9 Unit Apartments | 0 | 0.0% |
| 10 or more Apartments | 0 | 0.0% |
| Mobile Home / Other | 15 | 1.9% |
| Total | 807 | 100.0% |
Housing Structures by Occupancy in Goshen
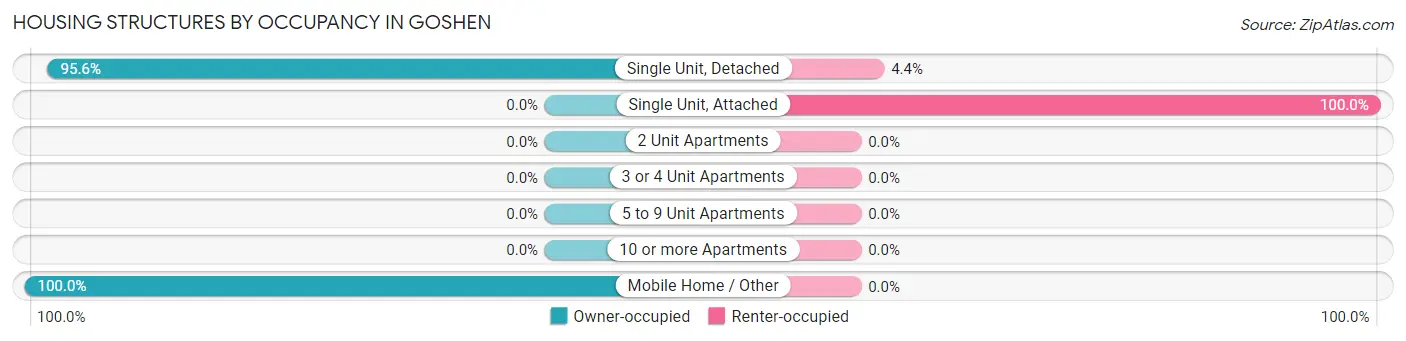
| Structure Type | Owner-occupied | Renter-occupied |
| Single Unit, Detached | 754 (95.6%) | 35 (4.4%) |
| Single Unit, Attached | 0 (0.0%) | 3 (100.0%) |
| 2 Unit Apartments | 0 (0.0%) | 0 (0.0%) |
| 3 or 4 Unit Apartments | 0 (0.0%) | 0 (0.0%) |
| 5 to 9 Unit Apartments | 0 (0.0%) | 0 (0.0%) |
| 10 or more Apartments | 0 (0.0%) | 0 (0.0%) |
| Mobile Home / Other | 15 (100.0%) | 0 (0.0%) |
| Total | 769 (95.3%) | 38 (4.7%) |
Housing Structures by Number of Rooms in Goshen
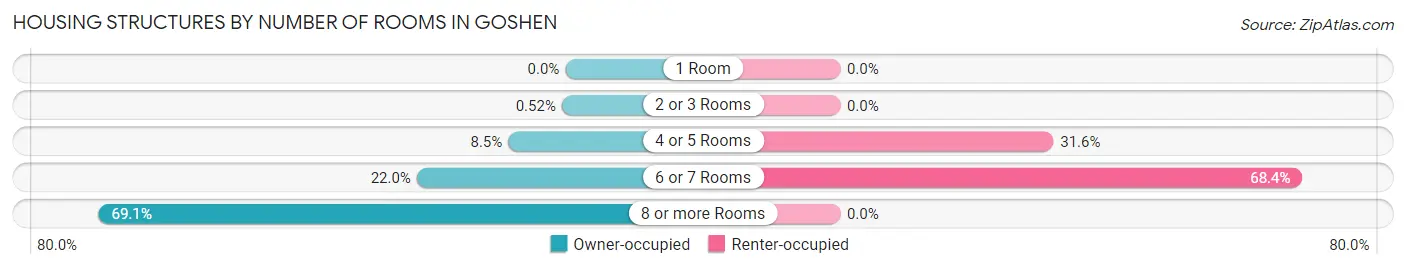
| Number of Rooms | Owner-occupied | Renter-occupied |
| 1 Room | 0 (0.0%) | 0 (0.0%) |
| 2 or 3 Rooms | 4 (0.5%) | 0 (0.0%) |
| 4 or 5 Rooms | 65 (8.5%) | 12 (31.6%) |
| 6 or 7 Rooms | 169 (22.0%) | 26 (68.4%) |
| 8 or more Rooms | 531 (69.1%) | 0 (0.0%) |
| Total | 769 (100.0%) | 38 (100.0%) |
Housing Structure by Heating Type in Goshen
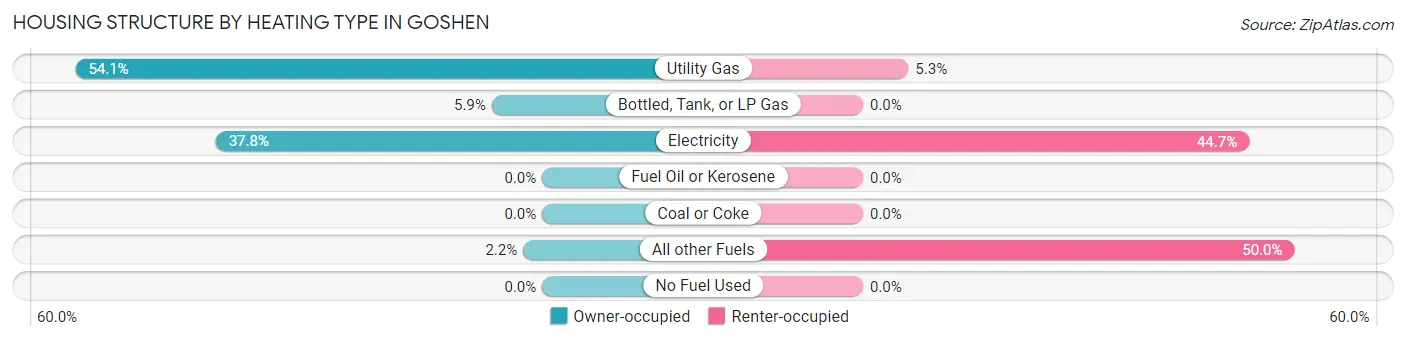
| Heating Type | Owner-occupied | Renter-occupied |
| Utility Gas | 416 (54.1%) | 2 (5.3%) |
| Bottled, Tank, or LP Gas | 45 (5.9%) | 0 (0.0%) |
| Electricity | 291 (37.8%) | 17 (44.7%) |
| Fuel Oil or Kerosene | 0 (0.0%) | 0 (0.0%) |
| Coal or Coke | 0 (0.0%) | 0 (0.0%) |
| All other Fuels | 17 (2.2%) | 19 (50.0%) |
| No Fuel Used | 0 (0.0%) | 0 (0.0%) |
| Total | 769 (100.0%) | 38 (100.0%) |
Household Vehicle Usage in Goshen
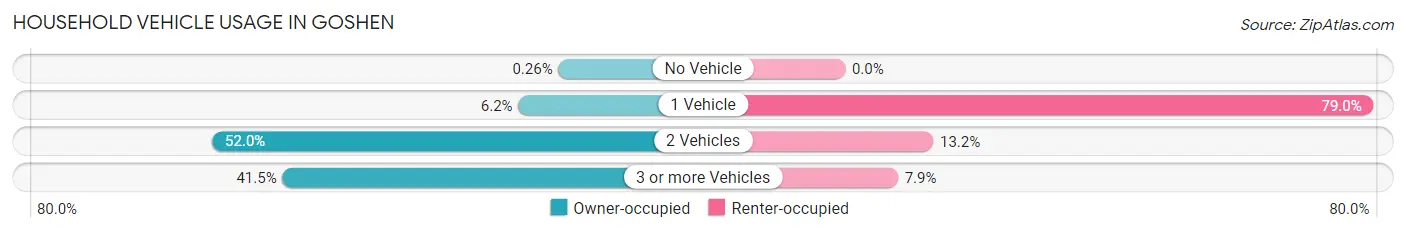
| Vehicles per Household | Owner-occupied | Renter-occupied |
| No Vehicle | 2 (0.3%) | 0 (0.0%) |
| 1 Vehicle | 48 (6.2%) | 30 (78.9%) |
| 2 Vehicles | 400 (52.0%) | 5 (13.2%) |
| 3 or more Vehicles | 319 (41.5%) | 3 (7.9%) |
| Total | 769 (100.0%) | 38 (100.0%) |
Real Estate & Mortgages in Goshen
Real Estate and Mortgage Overview in Goshen
| Characteristic | Without Mortgage | With Mortgage |
| Housing Units | 164 | 605 |
| Median Property Value | $373,700 | $620,400 |
| Median Household Income | $107,500 | $368 |
| Monthly Housing Costs | $617 | $237 |
| Real Estate Taxes | $1,942 | $12 |
Property Value by Mortgage Status in Goshen
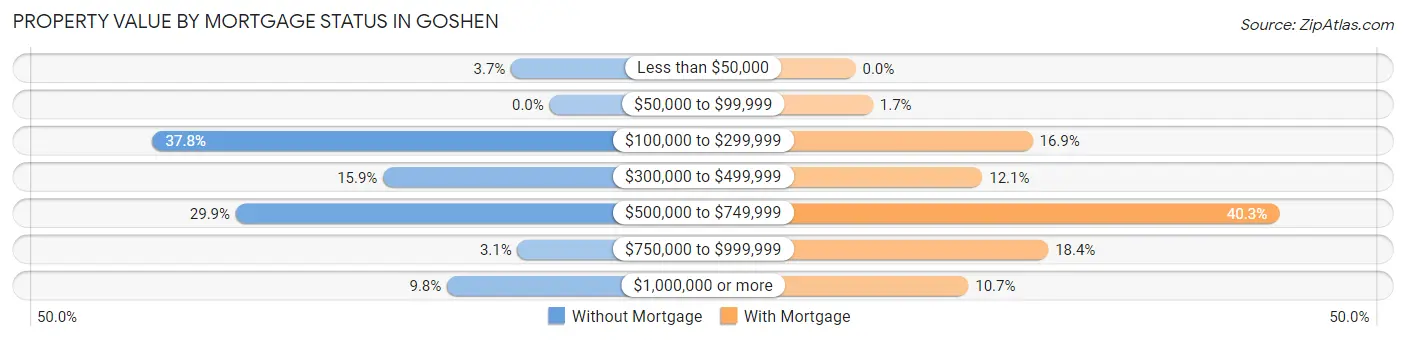
| Property Value | Without Mortgage | With Mortgage |
| Less than $50,000 | 6 (3.7%) | 0 (0.0%) |
| $50,000 to $99,999 | 0 (0.0%) | 10 (1.7%) |
| $100,000 to $299,999 | 62 (37.8%) | 102 (16.9%) |
| $300,000 to $499,999 | 26 (15.9%) | 73 (12.1%) |
| $500,000 to $749,999 | 49 (29.9%) | 244 (40.3%) |
| $750,000 to $999,999 | 5 (3.0%) | 111 (18.3%) |
| $1,000,000 or more | 16 (9.8%) | 65 (10.7%) |
| Total | 164 (100.0%) | 605 (100.0%) |
Household Income by Mortgage Status in Goshen
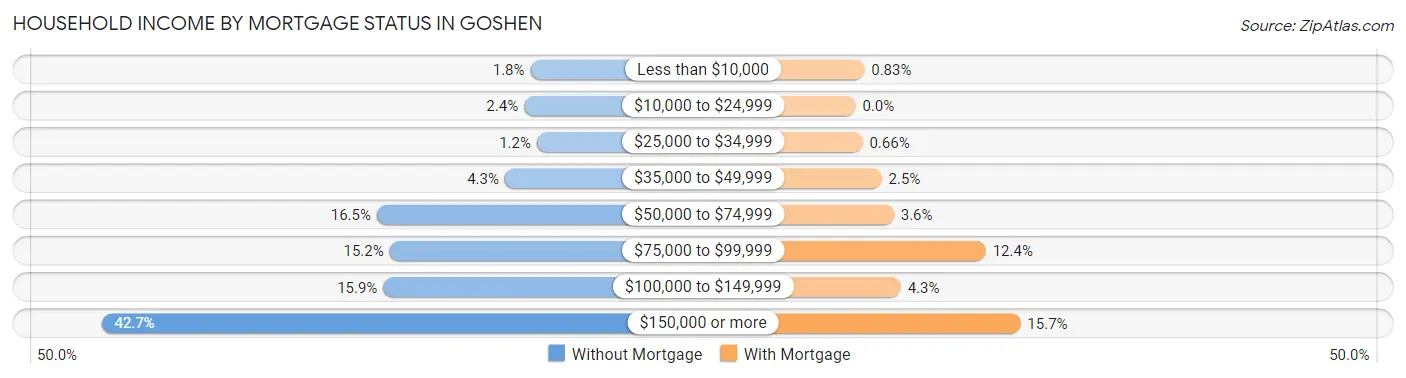
| Household Income | Without Mortgage | With Mortgage |
| Less than $10,000 | 3 (1.8%) | 5 (0.8%) |
| $10,000 to $24,999 | 4 (2.4%) | 0 (0.0%) |
| $25,000 to $34,999 | 2 (1.2%) | 4 (0.7%) |
| $35,000 to $49,999 | 7 (4.3%) | 15 (2.5%) |
| $50,000 to $74,999 | 27 (16.5%) | 22 (3.6%) |
| $75,000 to $99,999 | 25 (15.2%) | 75 (12.4%) |
| $100,000 to $149,999 | 26 (15.9%) | 26 (4.3%) |
| $150,000 or more | 70 (42.7%) | 95 (15.7%) |
| Total | 164 (100.0%) | 605 (100.0%) |
Property Value to Household Income Ratio in Goshen
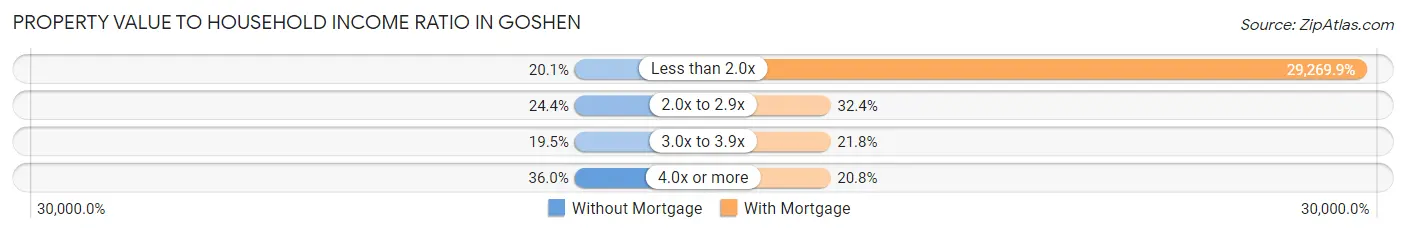
| Value-to-Income Ratio | Without Mortgage | With Mortgage |
| Less than 2.0x | 33 (20.1%) | 177,083 (29,269.9%) |
| 2.0x to 2.9x | 40 (24.4%) | 196 (32.4%) |
| 3.0x to 3.9x | 32 (19.5%) | 132 (21.8%) |
| 4.0x or more | 59 (36.0%) | 126 (20.8%) |
| Total | 164 (100.0%) | 605 (100.0%) |
Real Estate Taxes by Mortgage Status in Goshen
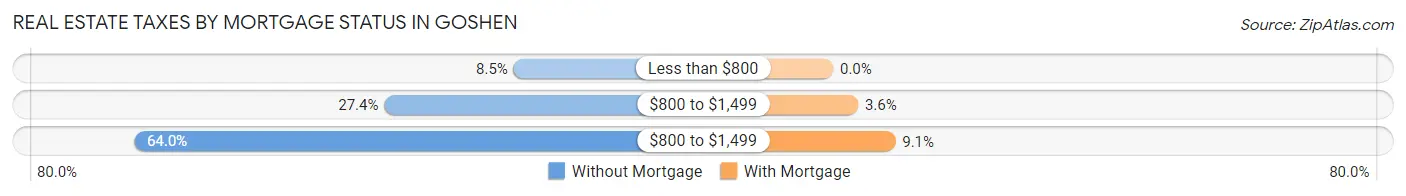
| Property Taxes | Without Mortgage | With Mortgage |
| Less than $800 | 14 (8.5%) | 0 (0.0%) |
| $800 to $1,499 | 45 (27.4%) | 22 (3.6%) |
| $800 to $1,499 | 105 (64.0%) | 55 (9.1%) |
| Total | 164 (100.0%) | 605 (100.0%) |
Health & Disability in Goshen
Health Insurance Coverage by Age in Goshen
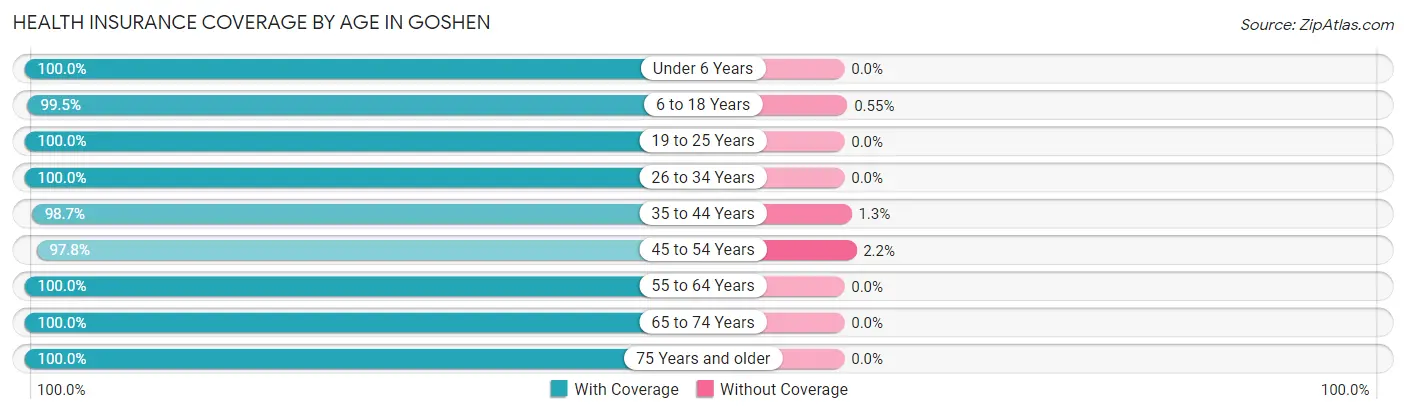
| Age Bracket | With Coverage | Without Coverage |
| Under 6 Years | 245 (100.0%) | 0 (0.0%) |
| 6 to 18 Years | 719 (99.5%) | 4 (0.5%) |
| 19 to 25 Years | 127 (100.0%) | 0 (0.0%) |
| 26 to 34 Years | 124 (100.0%) | 0 (0.0%) |
| 35 to 44 Years | 521 (98.7%) | 7 (1.3%) |
| 45 to 54 Years | 352 (97.8%) | 8 (2.2%) |
| 55 to 64 Years | 234 (100.0%) | 0 (0.0%) |
| 65 to 74 Years | 231 (100.0%) | 0 (0.0%) |
| 75 Years and older | 60 (100.0%) | 0 (0.0%) |
| Total | 2,613 (99.3%) | 19 (0.7%) |
Health Insurance Coverage by Citizenship Status in Goshen
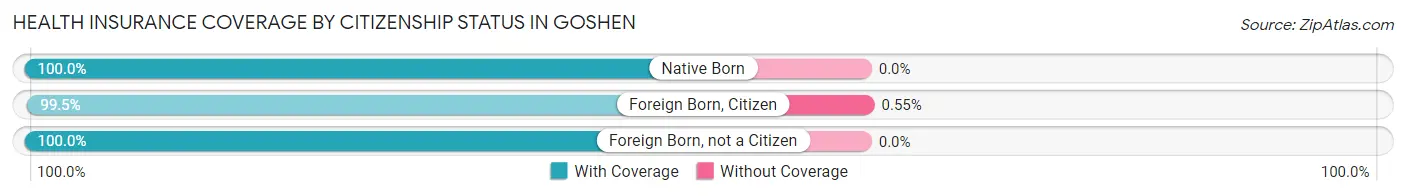
| Citizenship Status | With Coverage | Without Coverage |
| Native Born | 245 (100.0%) | 0 (0.0%) |
| Foreign Born, Citizen | 719 (99.5%) | 4 (0.5%) |
| Foreign Born, not a Citizen | 127 (100.0%) | 0 (0.0%) |
Health Insurance Coverage by Household Income in Goshen
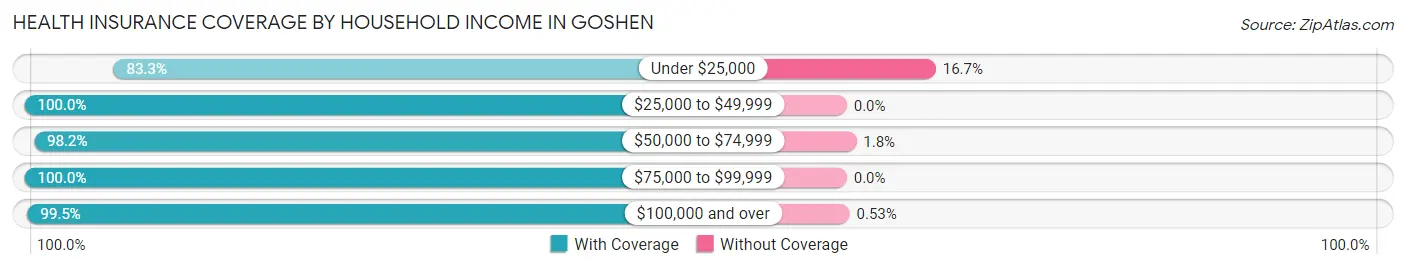
| Household Income | With Coverage | Without Coverage |
| Under $25,000 | 15 (83.3%) | 3 (16.7%) |
| $25,000 to $49,999 | 99 (100.0%) | 0 (0.0%) |
| $50,000 to $74,999 | 274 (98.2%) | 5 (1.8%) |
| $75,000 to $99,999 | 142 (100.0%) | 0 (0.0%) |
| $100,000 and over | 2,083 (99.5%) | 11 (0.5%) |
Public vs Private Health Insurance Coverage by Age in Goshen
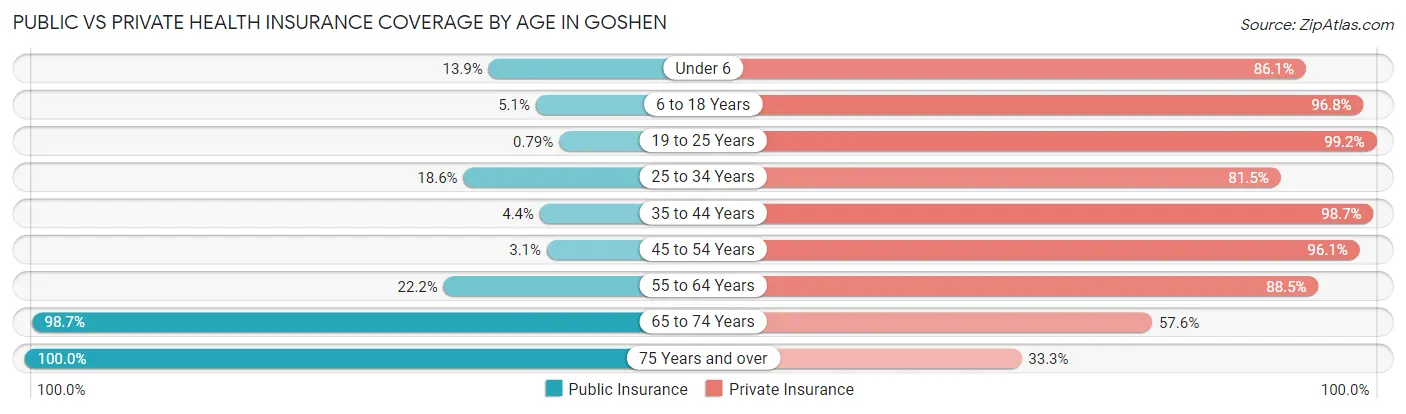
| Age Bracket | Public Insurance | Private Insurance |
| Under 6 | 34 (13.9%) | 211 (86.1%) |
| 6 to 18 Years | 37 (5.1%) | 700 (96.8%) |
| 19 to 25 Years | 1 (0.8%) | 126 (99.2%) |
| 25 to 34 Years | 23 (18.5%) | 101 (81.5%) |
| 35 to 44 Years | 23 (4.4%) | 521 (98.7%) |
| 45 to 54 Years | 11 (3.1%) | 346 (96.1%) |
| 55 to 64 Years | 52 (22.2%) | 207 (88.5%) |
| 65 to 74 Years | 228 (98.7%) | 133 (57.6%) |
| 75 Years and over | 60 (100.0%) | 20 (33.3%) |
| Total | 469 (17.8%) | 2,365 (89.9%) |
Disability Status by Sex by Age in Goshen
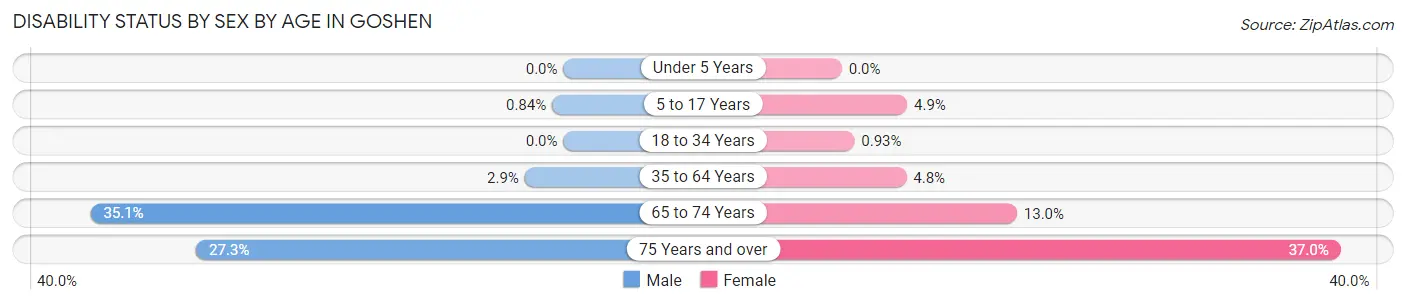
| Age Bracket | Male | Female |
| Under 5 Years | 0 (0.0%) | 0 (0.0%) |
| 5 to 17 Years | 3 (0.8%) | 18 (4.9%) |
| 18 to 34 Years | 0 (0.0%) | 1 (0.9%) |
| 35 to 64 Years | 16 (2.9%) | 27 (4.8%) |
| 65 to 74 Years | 46 (35.1%) | 13 (13.0%) |
| 75 Years and over | 9 (27.3%) | 10 (37.0%) |
Disability Class by Sex by Age in Goshen
Disability Class: Hearing Difficulty
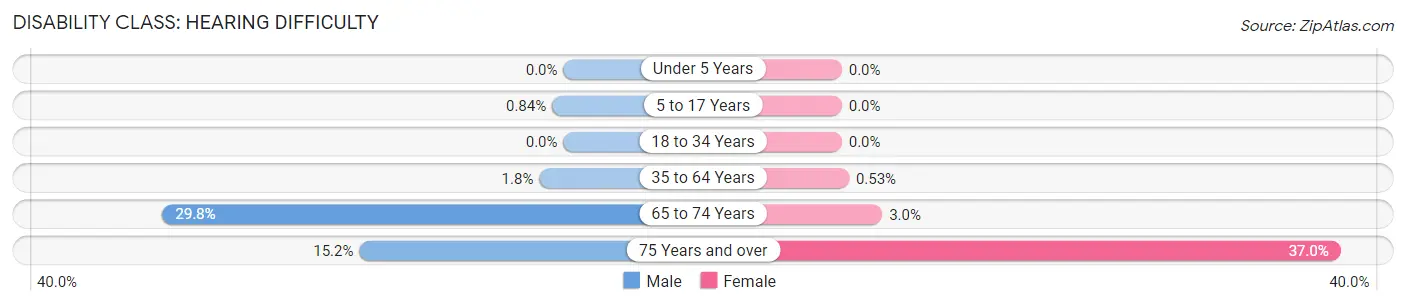
| Age Bracket | Male | Female |
| Under 5 Years | 0 (0.0%) | 0 (0.0%) |
| 5 to 17 Years | 3 (0.8%) | 0 (0.0%) |
| 18 to 34 Years | 0 (0.0%) | 0 (0.0%) |
| 35 to 64 Years | 10 (1.8%) | 3 (0.5%) |
| 65 to 74 Years | 39 (29.8%) | 3 (3.0%) |
| 75 Years and over | 5 (15.1%) | 10 (37.0%) |
Disability Class: Vision Difficulty
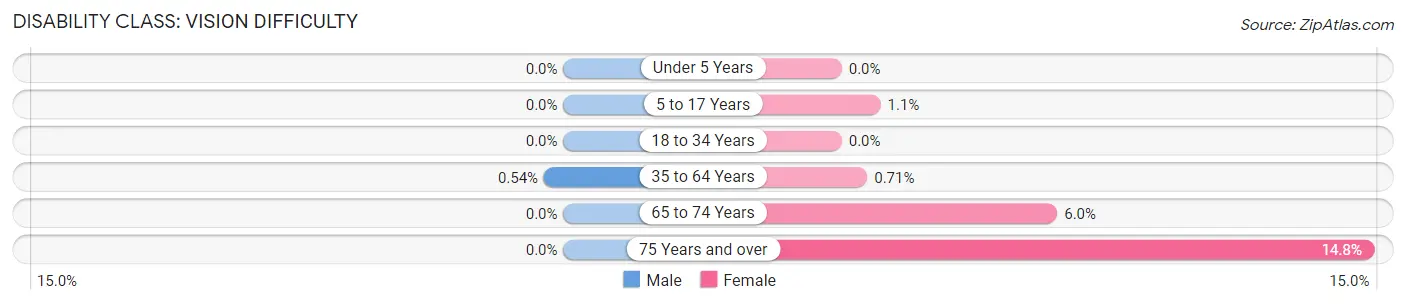
| Age Bracket | Male | Female |
| Under 5 Years | 0 (0.0%) | 0 (0.0%) |
| 5 to 17 Years | 0 (0.0%) | 4 (1.1%) |
| 18 to 34 Years | 0 (0.0%) | 0 (0.0%) |
| 35 to 64 Years | 3 (0.5%) | 4 (0.7%) |
| 65 to 74 Years | 0 (0.0%) | 6 (6.0%) |
| 75 Years and over | 0 (0.0%) | 4 (14.8%) |
Disability Class: Cognitive Difficulty
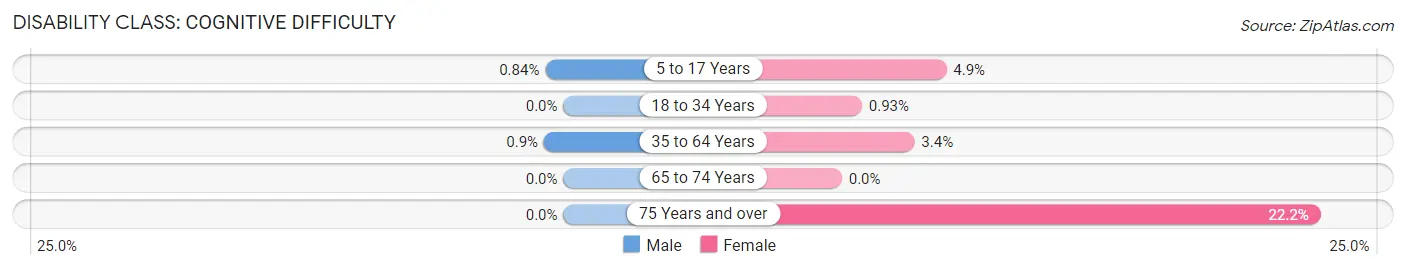
| Age Bracket | Male | Female |
| 5 to 17 Years | 3 (0.8%) | 18 (4.9%) |
| 18 to 34 Years | 0 (0.0%) | 1 (0.9%) |
| 35 to 64 Years | 5 (0.9%) | 19 (3.4%) |
| 65 to 74 Years | 0 (0.0%) | 0 (0.0%) |
| 75 Years and over | 0 (0.0%) | 6 (22.2%) |
Disability Class: Ambulatory Difficulty
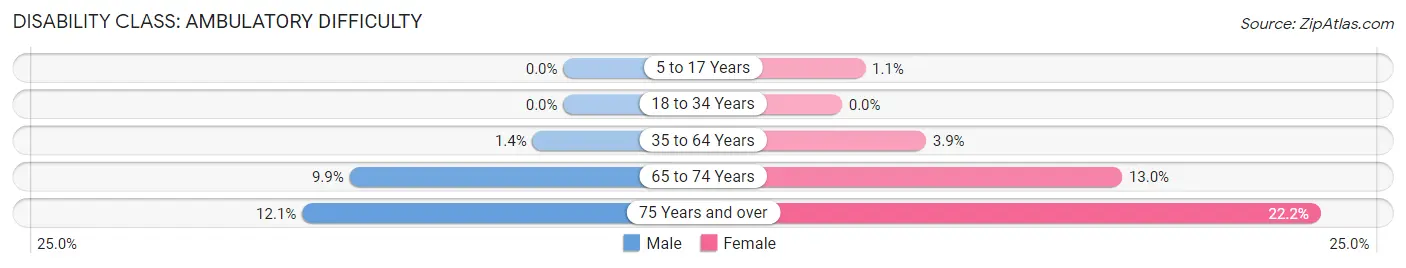
| Age Bracket | Male | Female |
| 5 to 17 Years | 0 (0.0%) | 4 (1.1%) |
| 18 to 34 Years | 0 (0.0%) | 0 (0.0%) |
| 35 to 64 Years | 8 (1.4%) | 22 (3.9%) |
| 65 to 74 Years | 13 (9.9%) | 13 (13.0%) |
| 75 Years and over | 4 (12.1%) | 6 (22.2%) |
Disability Class: Self-Care Difficulty
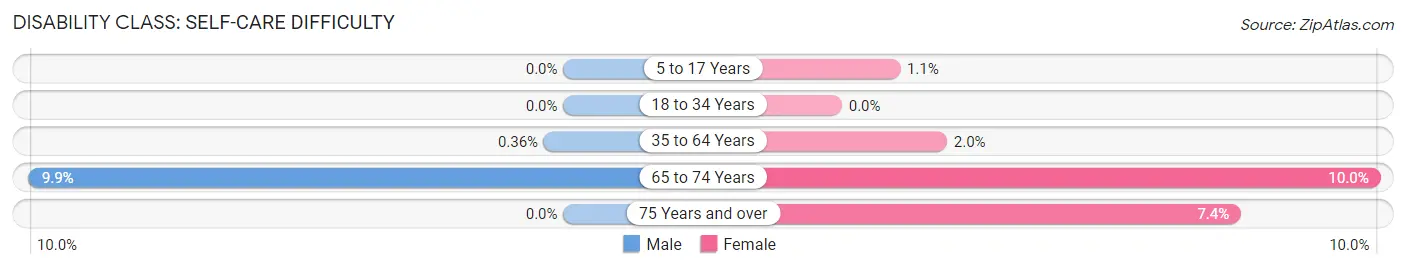
| Age Bracket | Male | Female |
| 5 to 17 Years | 0 (0.0%) | 4 (1.1%) |
| 18 to 34 Years | 0 (0.0%) | 0 (0.0%) |
| 35 to 64 Years | 2 (0.4%) | 11 (1.9%) |
| 65 to 74 Years | 13 (9.9%) | 10 (10.0%) |
| 75 Years and over | 0 (0.0%) | 2 (7.4%) |
Technology Access in Goshen
Computing Device Access in Goshen
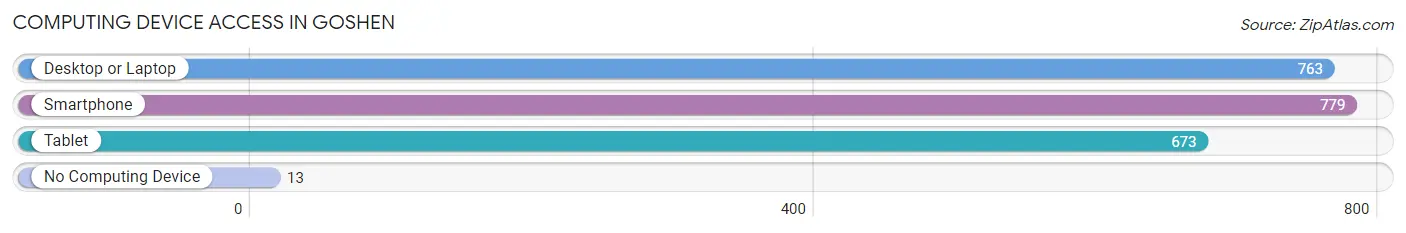
| Device Type | # Households | % Households |
| Desktop or Laptop | 763 | 94.6% |
| Smartphone | 779 | 96.5% |
| Tablet | 673 | 83.4% |
| No Computing Device | 13 | 1.6% |
| Total | 807 | 100.0% |
Internet Access in Goshen
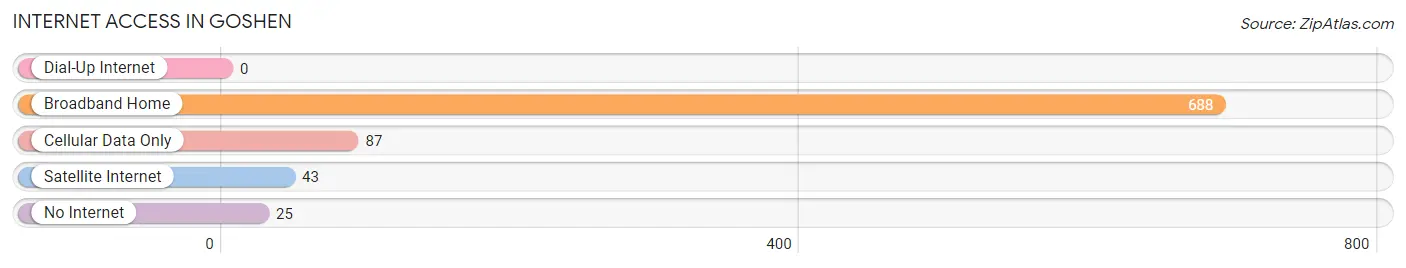
| Internet Type | # Households | % Households |
| Dial-Up Internet | 0 | 0.0% |
| Broadband Home | 688 | 85.3% |
| Cellular Data Only | 87 | 10.8% |
| Satellite Internet | 43 | 5.3% |
| No Internet | 25 | 3.1% |
| Total | 807 | 100.0% |
Goshen Summary
Goshen, Arkansas is a small town located in Washington County in the northwest corner of the state. It is situated on the banks of the White River, and is part of the Fayetteville-Springdale-Rogers Metropolitan Statistical Area. The town has a population of just over 1,000 people, and is known for its rural charm and friendly atmosphere.
History
Goshen was first settled in 1837 by a group of settlers from Tennessee. The town was named after the biblical city of Goshen, which was located in the land of Egypt. The town was incorporated in 1883, and the first post office was established in 1884.
Goshen was a thriving agricultural community in the late 19th and early 20th centuries. The town was home to several cotton gins, a grist mill, and a sawmill. The town also had a hotel, a bank, and several stores.
Geography
Goshen is located in the northwest corner of Arkansas, in Washington County. The town is situated on the banks of the White River, and is surrounded by rolling hills and forests. The town is located about 25 miles north of Fayetteville, and about 40 miles south of the Missouri border.
The climate in Goshen is mild and humid, with hot summers and cold winters. The average annual temperature is around 60 degrees Fahrenheit, and the average annual precipitation is around 45 inches.
Economy
Goshen’s economy is largely based on agriculture. The town is home to several farms, and the surrounding area is known for its production of cotton, soybeans, and other crops. The town also has several small businesses, including a grocery store, a hardware store, and a few restaurants.
Demographics
As of the 2010 census, the population of Goshen was 1,072. The racial makeup of the town was 95.3% White, 0.7% African American, 0.3% Native American, 0.2% Asian, and 3.5% from other races. The median household income was $35,625, and the median family income was $41,250.
Goshen is a small, rural town with a friendly atmosphere and a strong sense of community. The town is known for its agricultural heritage, and its residents take pride in their rural lifestyle. The town is a great place to live, work, and raise a family.
Common Questions
What is Per Capita Income in Goshen?
Per Capita income in Goshen is $67,199.
What is the Median Family Income in Goshen?
Median Family Income in Goshen is $177,083.
What is the Median Household income in Goshen?
Median Household Income in Goshen is $167,961.
What is Income or Wage Gap in Goshen?
Income or Wage Gap in Goshen is 47.4%.
Women in Goshen earn 52.6 cents for every dollar earned by a man.
What is Inequality or Gini Index in Goshen?
Inequality or Gini Index in Goshen is 0.43.
What is the Total Population of Goshen?
Total Population of Goshen is 2,632.
What is the Total Male Population of Goshen?
Total Male Population of Goshen is 1,363.
What is the Total Female Population of Goshen?
Total Female Population of Goshen is 1,269.
What is the Ratio of Males per 100 Females in Goshen?
There are 107.41 Males per 100 Females in Goshen.
What is the Ratio of Females per 100 Males in Goshen?
There are 93.10 Females per 100 Males in Goshen.
What is the Median Population Age in Goshen?
Median Population Age in Goshen is 36.7 Years.
What is the Average Family Size in Goshen
Average Family Size in Goshen is 3.5 People.
What is the Average Household Size in Goshen
Average Household Size in Goshen is 3.3 People.
How Large is the Labor Force in Goshen?
There are 1,166 People in the Labor Forcein in Goshen.
What is the Percentage of People in the Labor Force in Goshen?
65.2% of People are in the Labor Force in Goshen.
What is the Unemployment Rate in Goshen?
Unemployment Rate in Goshen is 1.5%.