Gibson, AR Map & Demographics
Gibson Map
Gibson Overview
$30,853
PER CAPITA INCOME
$75,938
AVG FAMILY INCOME
$65,833
AVG HOUSEHOLD INCOME
46.9%
WAGE / INCOME GAP [ % ]
53.1¢/ $1
WAGE / INCOME GAP [ $ ]
0.35
INEQUALITY / GINI INDEX
3,515
TOTAL POPULATION
1,669
MALE POPULATION
1,846
FEMALE POPULATION
90.41
MALES / 100 FEMALES
110.61
FEMALES / 100 MALES
41.4
MEDIAN AGE
3.1
AVG FAMILY SIZE
2.6
AVG HOUSEHOLD SIZE
1,748
LABOR FORCE [ PEOPLE ]
61.0%
PERCENT IN LABOR FORCE
8.2%
UNEMPLOYMENT RATE
Income in Gibson
Income Overview in Gibson
Per Capita Income in Gibson is $30,853, while median incomes of families and households are $75,938 and $65,833 respectively.
| Characteristic | Number | Measure |
| Per Capita Income | 3,515 | $30,853 |
| Median Family Income | 987 | $75,938 |
| Mean Family Income | 987 | $85,889 |
| Median Household Income | 1,372 | $65,833 |
| Mean Household Income | 1,372 | $74,378 |
| Income Deficit | 987 | $0 |
| Wage / Income Gap (%) | 3,515 | 46.92% |
| Wage / Income Gap ($) | 3,515 | 53.08¢ per $1 |
| Gini / Inequality Index | 3,515 | 0.35 |
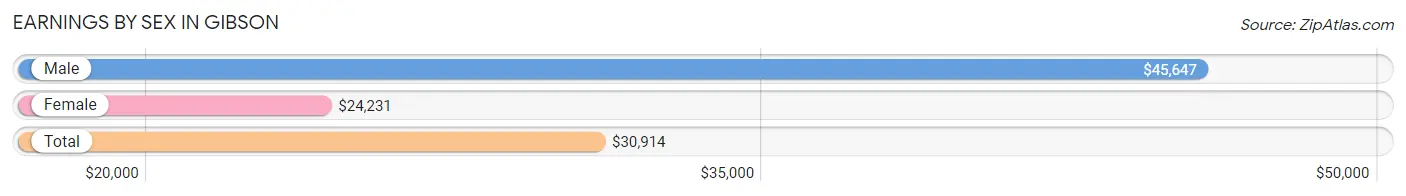
Earnings by Sex in Gibson
Average Earnings in Gibson are $30,914, $45,647 for men and $24,231 for women, a difference of 46.9%.
| Sex | Number | Average Earnings |
| Male | 1,001 (56.6%) | $45,647 |
| Female | 768 (43.4%) | $24,231 |
| Total | 1,769 (100.0%) | $30,914 |
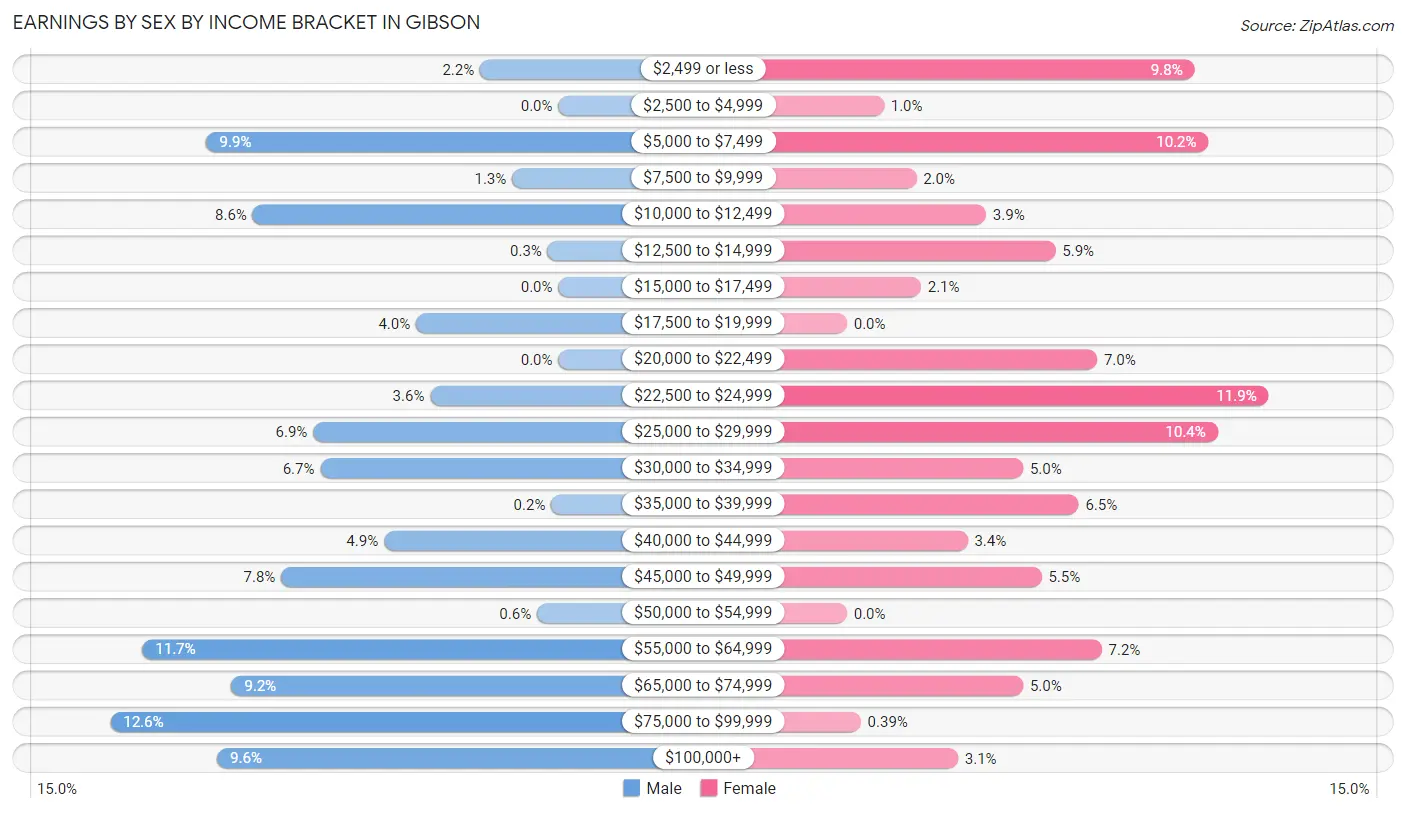
Earnings by Sex by Income Bracket in Gibson
The most common earnings brackets in Gibson are $75,000 to $99,999 for men (126 | 12.6%) and $22,500 to $24,999 for women (91 | 11.8%).
| Income | Male | Female |
| $2,499 or less | 22 (2.2%) | 75 (9.8%) |
| $2,500 to $4,999 | 0 (0.0%) | 8 (1.0%) |
| $5,000 to $7,499 | 99 (9.9%) | 78 (10.2%) |
| $7,500 to $9,999 | 13 (1.3%) | 15 (1.9%) |
| $10,000 to $12,499 | 86 (8.6%) | 30 (3.9%) |
| $12,500 to $14,999 | 3 (0.3%) | 45 (5.9%) |
| $15,000 to $17,499 | 0 (0.0%) | 16 (2.1%) |
| $17,500 to $19,999 | 40 (4.0%) | 0 (0.0%) |
| $20,000 to $22,499 | 0 (0.0%) | 54 (7.0%) |
| $22,500 to $24,999 | 36 (3.6%) | 91 (11.8%) |
| $25,000 to $29,999 | 69 (6.9%) | 80 (10.4%) |
| $30,000 to $34,999 | 67 (6.7%) | 38 (5.0%) |
| $35,000 to $39,999 | 2 (0.2%) | 50 (6.5%) |
| $40,000 to $44,999 | 49 (4.9%) | 26 (3.4%) |
| $45,000 to $49,999 | 78 (7.8%) | 42 (5.5%) |
| $50,000 to $54,999 | 6 (0.6%) | 0 (0.0%) |
| $55,000 to $64,999 | 117 (11.7%) | 55 (7.2%) |
| $65,000 to $74,999 | 92 (9.2%) | 38 (5.0%) |
| $75,000 to $99,999 | 126 (12.6%) | 3 (0.4%) |
| $100,000+ | 96 (9.6%) | 24 (3.1%) |
| Total | 1,001 (100.0%) | 768 (100.0%) |
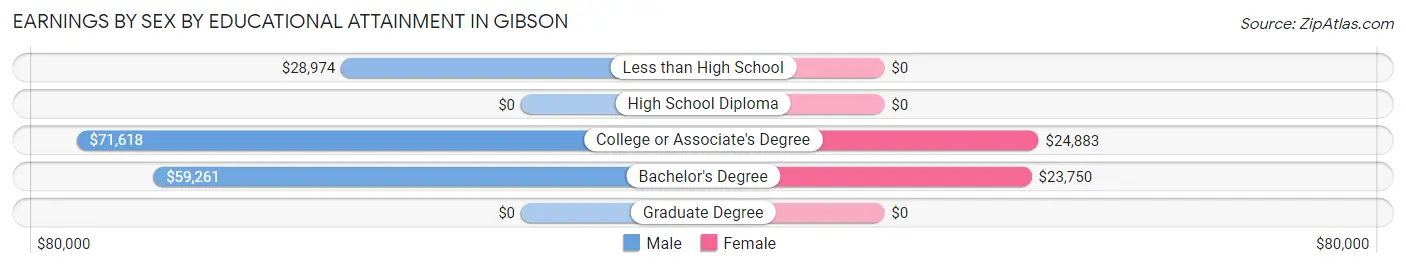
Earnings by Sex by Educational Attainment in Gibson
Average earnings in Gibson are $49,545 for men and $25,458 for women, a difference of 48.6%. Men with an educational attainment of college or associate's degree enjoy the highest average annual earnings of $71,618, while those with less than high school education earn the least with $28,974. Women with an educational attainment of college or associate's degree earn the most with the average annual earnings of $24,883, while those with bachelor's degree education have the smallest earnings of $23,750.
| Educational Attainment | Male Income | Female Income |
| Less than High School | $28,974 | $0 |
| High School Diploma | - | - |
| College or Associate's Degree | $71,618 | $24,883 |
| Bachelor's Degree | $59,261 | $23,750 |
| Graduate Degree | - | - |
| Total | $49,545 | $25,458 |
Family Income in Gibson
Family Income Brackets in Gibson
According to the Gibson family income data, there are 220 families falling into the $35,000 to $49,999 income range, which is the most common income bracket and makes up 22.3% of all families.
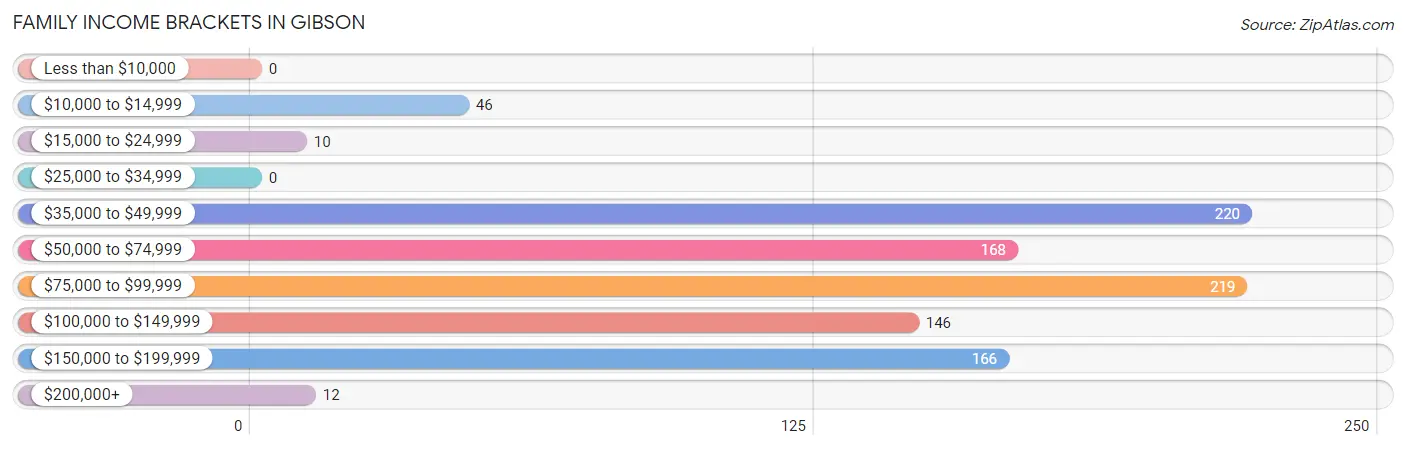
| Income Bracket | # Families | % Families |
| Less than $10,000 | 0 | 0.0% |
| $10,000 to $14,999 | 46 | 4.7% |
| $15,000 to $24,999 | 10 | 1.0% |
| $25,000 to $34,999 | 0 | 0.0% |
| $35,000 to $49,999 | 220 | 22.3% |
| $50,000 to $74,999 | 168 | 17.0% |
| $75,000 to $99,999 | 219 | 22.2% |
| $100,000 to $149,999 | 146 | 14.8% |
| $150,000 to $199,999 | 166 | 16.8% |
| $200,000+ | 12 | 1.2% |
Family Income by Famaliy Size in Gibson
4-person families (79 | 8.0%) account for the highest median family income in Gibson with $89,688 per family, while 2-person families (518 | 52.5%) have the highest median income of $31,125 per family member.
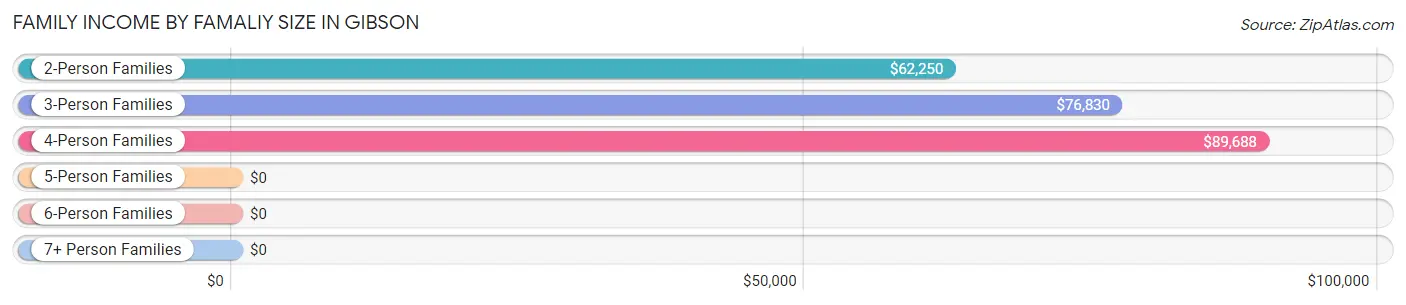
| Income Bracket | # Families | Median Income |
| 2-Person Families | 518 (52.5%) | $62,250 |
| 3-Person Families | 290 (29.4%) | $76,830 |
| 4-Person Families | 79 (8.0%) | $89,688 |
| 5-Person Families | 68 (6.9%) | $0 |
| 6-Person Families | 0 (0.0%) | $0 |
| 7+ Person Families | 32 (3.2%) | $0 |
| Total | 987 (100.0%) | $75,938 |
Family Income by Number of Earners in Gibson
The median family income in Gibson is $75,938, with families comprising 3+ earners (47) having the highest median family income of $119,180, while families with no earners (208) have the lowest median family income of $41,332, accounting for 4.8% and 21.1% of families, respectively.
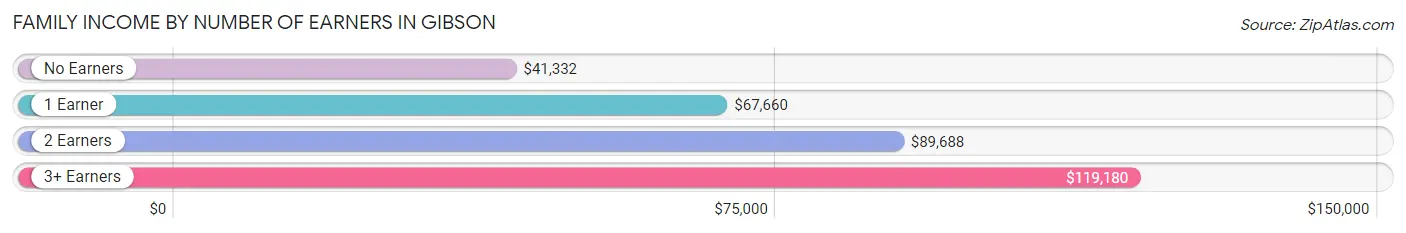
| Number of Earners | # Families | Median Income |
| No Earners | 208 (21.1%) | $41,332 |
| 1 Earner | 247 (25.0%) | $67,660 |
| 2 Earners | 485 (49.1%) | $89,688 |
| 3+ Earners | 47 (4.8%) | $119,180 |
| Total | 987 (100.0%) | $75,938 |
Household Income in Gibson
Household Income Brackets in Gibson
With 311 households falling in the category, the $35,000 to $49,999 income range is the most frequent in Gibson, accounting for 22.7% of all households. In contrast, only 12 households (0.9%) fall into the $200,000+ income bracket, making it the least populous group.
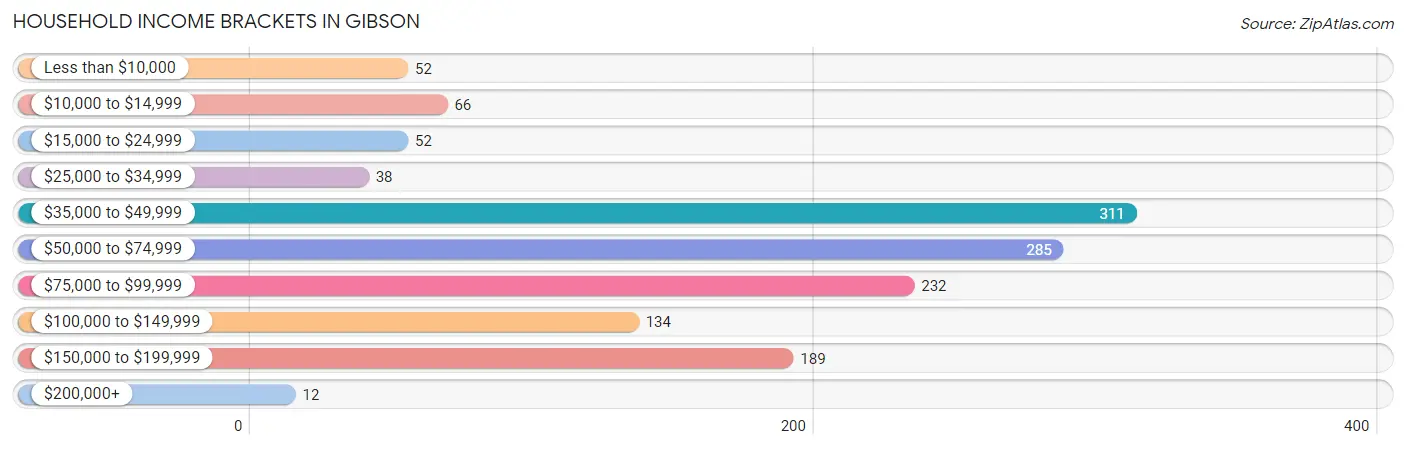
| Income Bracket | # Households | % Households |
| Less than $10,000 | 52 | 3.8% |
| $10,000 to $14,999 | 66 | 4.8% |
| $15,000 to $24,999 | 52 | 3.8% |
| $25,000 to $34,999 | 38 | 2.8% |
| $35,000 to $49,999 | 311 | 22.7% |
| $50,000 to $74,999 | 285 | 20.8% |
| $75,000 to $99,999 | 232 | 16.9% |
| $100,000 to $149,999 | 134 | 9.8% |
| $150,000 to $199,999 | 189 | 13.8% |
| $200,000+ | 12 | 0.9% |
Household Income by Householder Age in Gibson
The median household income in Gibson is $65,833, with the highest median household income of $96,042 found in the 45 to 64 years age bracket for the primary householder. A total of 527 households (38.4%) fall into this category. Meanwhile, the 15 to 24 years age bracket for the primary householder has the lowest median household income of $0, with 16 households (1.2%) in this group.
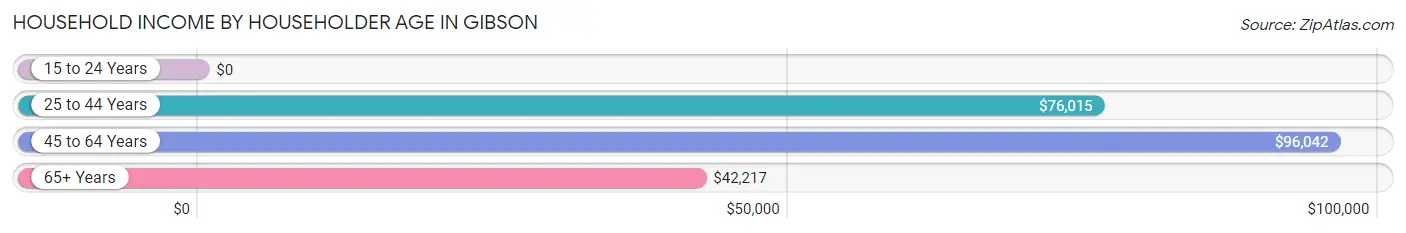
| Income Bracket | # Households | Median Income |
| 15 to 24 Years | 16 (1.2%) | $0 |
| 25 to 44 Years | 304 (22.2%) | $76,015 |
| 45 to 64 Years | 527 (38.4%) | $96,042 |
| 65+ Years | 525 (38.3%) | $42,217 |
| Total | 1,372 (100.0%) | $65,833 |
Poverty in Gibson
Income Below Poverty by Sex and Age in Gibson
With 5.8% poverty level for males and 8.0% for females among the residents of Gibson, 18 to 24 year old males and 18 to 24 year old females are the most vulnerable to poverty, with 49 males (36.8%) and 44 females (44.4%) in their respective age groups living below the poverty level.
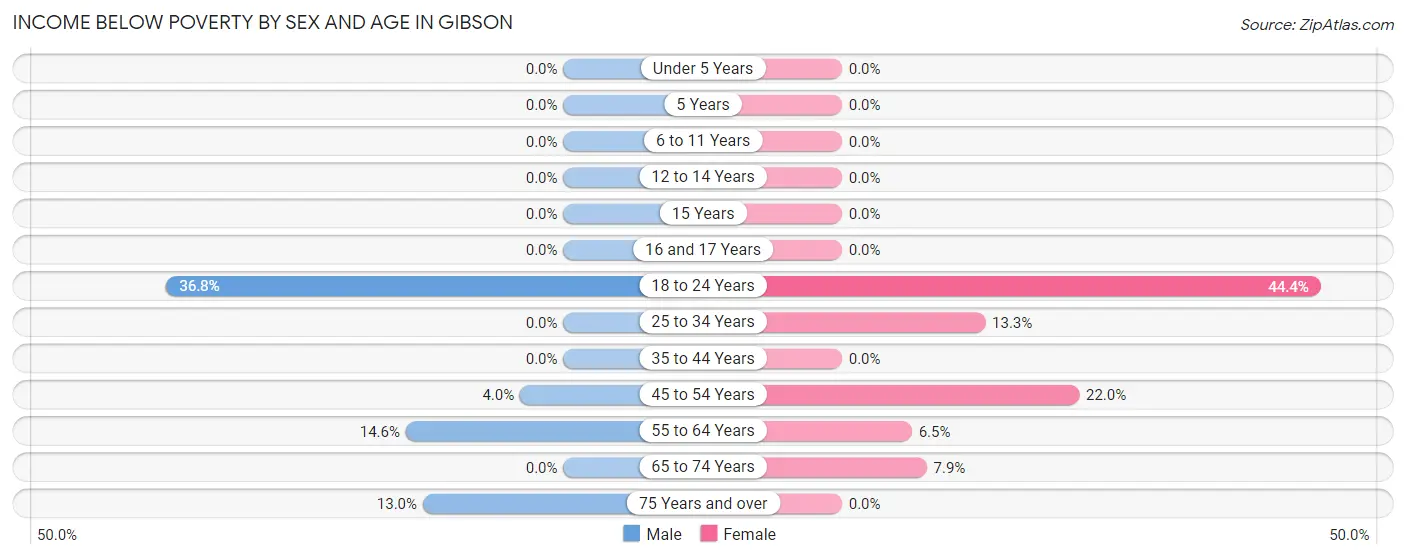
| Age Bracket | Male | Female |
| Under 5 Years | 0 (0.0%) | 0 (0.0%) |
| 5 Years | 0 (0.0%) | 0 (0.0%) |
| 6 to 11 Years | 0 (0.0%) | 0 (0.0%) |
| 12 to 14 Years | 0 (0.0%) | 0 (0.0%) |
| 15 Years | 0 (0.0%) | 0 (0.0%) |
| 16 and 17 Years | 0 (0.0%) | 0 (0.0%) |
| 18 to 24 Years | 49 (36.8%) | 44 (44.4%) |
| 25 to 34 Years | 0 (0.0%) | 27 (13.3%) |
| 35 to 44 Years | 0 (0.0%) | 0 (0.0%) |
| 45 to 54 Years | 13 (4.0%) | 37 (22.0%) |
| 55 to 64 Years | 25 (14.6%) | 12 (6.5%) |
| 65 to 74 Years | 0 (0.0%) | 28 (7.9%) |
| 75 Years and over | 9 (13.0%) | 0 (0.0%) |
| Total | 96 (5.8%) | 148 (8.0%) |
Income Above Poverty by Sex and Age in Gibson
According to the poverty statistics in Gibson, males aged under 5 years and females aged under 5 years are the age groups that are most secure financially, with 100.0% of males and 100.0% of females in these age groups living above the poverty line.
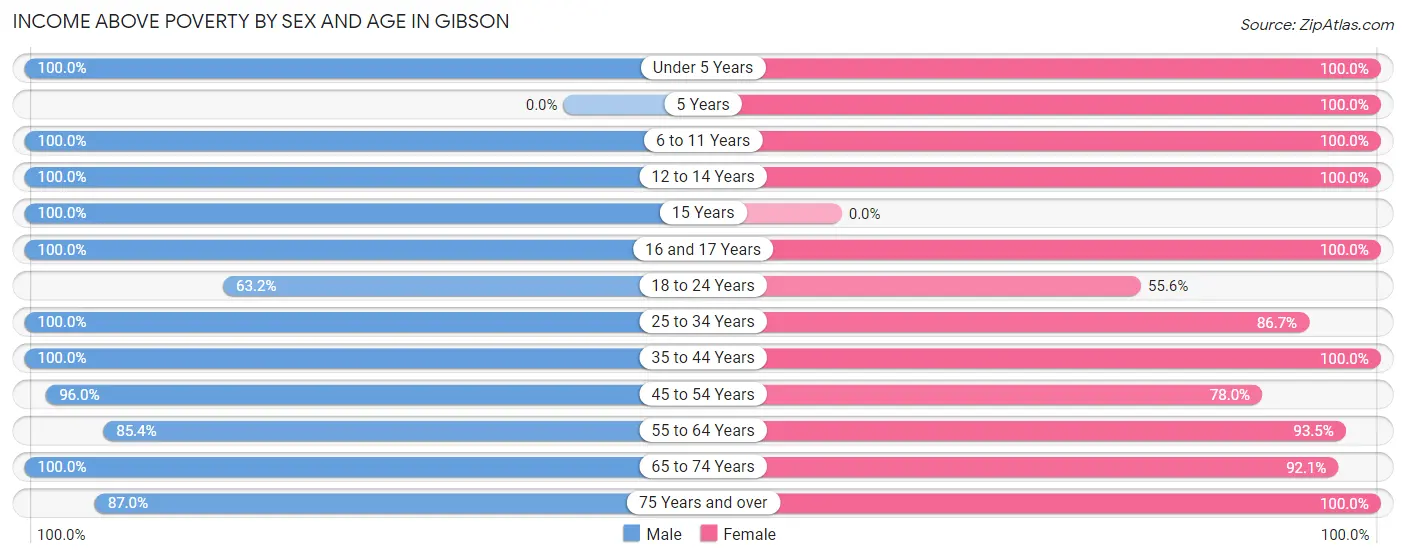
| Age Bracket | Male | Female |
| Under 5 Years | 93 (100.0%) | 78 (100.0%) |
| 5 Years | 0 (0.0%) | 25 (100.0%) |
| 6 to 11 Years | 132 (100.0%) | 125 (100.0%) |
| 12 to 14 Years | 79 (100.0%) | 81 (100.0%) |
| 15 Years | 37 (100.0%) | 0 (0.0%) |
| 16 and 17 Years | 35 (100.0%) | 93 (100.0%) |
| 18 to 24 Years | 84 (63.2%) | 55 (55.6%) |
| 25 to 34 Years | 178 (100.0%) | 176 (86.7%) |
| 35 to 44 Years | 208 (100.0%) | 259 (100.0%) |
| 45 to 54 Years | 310 (96.0%) | 131 (78.0%) |
| 55 to 64 Years | 146 (85.4%) | 173 (93.5%) |
| 65 to 74 Years | 211 (100.0%) | 328 (92.1%) |
| 75 Years and over | 60 (87.0%) | 174 (100.0%) |
| Total | 1,573 (94.3%) | 1,698 (92.0%) |
Income Below Poverty Among Married-Couple Families in Gibson
The poverty statistics for married-couple families in Gibson show that 1.1% or 9 of the total 784 families live below the poverty line. Families with no children have the highest poverty rate of 2.1%, comprising of 9 families. On the other hand, families with 1 or 2 children have the lowest poverty rate of 0.0%, which includes 0 families.
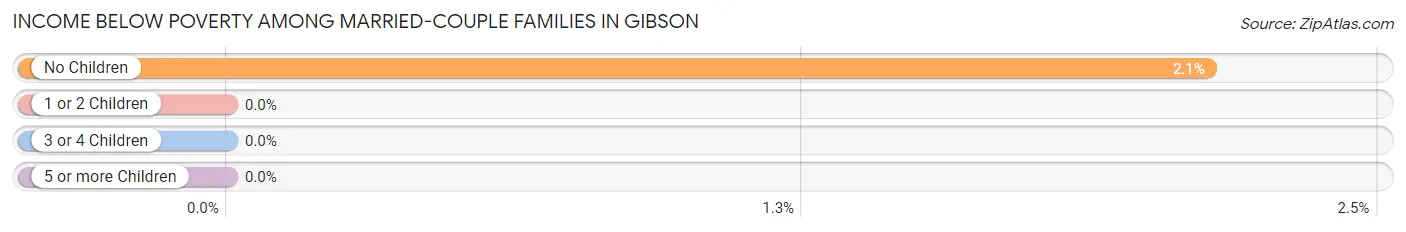
| Children | Above Poverty | Below Poverty |
| No Children | 414 (97.9%) | 9 (2.1%) |
| 1 or 2 Children | 298 (100.0%) | 0 (0.0%) |
| 3 or 4 Children | 63 (100.0%) | 0 (0.0%) |
| 5 or more Children | 0 (0.0%) | 0 (0.0%) |
| Total | 775 (98.9%) | 9 (1.1%) |
Income Below Poverty Among Single-Parent Households in Gibson
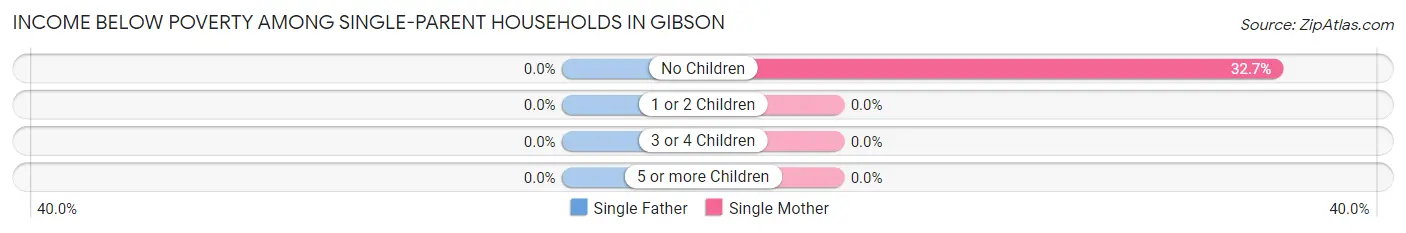
| Children | Single Father | Single Mother |
| No Children | 0 (0.0%) | 37 (32.7%) |
| 1 or 2 Children | 0 (0.0%) | 0 (0.0%) |
| 3 or 4 Children | 0 (0.0%) | 0 (0.0%) |
| 5 or more Children | 0 (0.0%) | 0 (0.0%) |
| Total | 0 (0.0%) | 37 (32.7%) |
Income Below Poverty Among Married-Couple vs Single-Parent Households in Gibson
The poverty data for Gibson shows that 9 of the married-couple family households (1.1%) and 37 of the single-parent households (18.2%) are living below the poverty level. Within the married-couple family households, those with no children have the highest poverty rate, with 9 households (2.1%) falling below the poverty line. Among the single-parent households, those with no children have the highest poverty rate, with 37 household (22.3%) living below poverty.
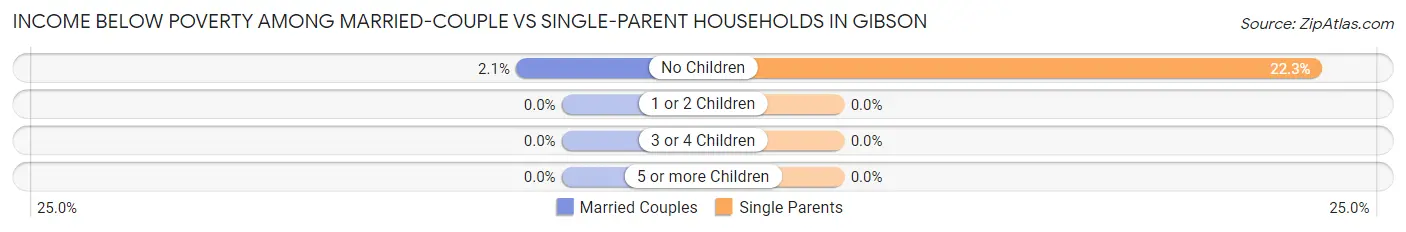
| Children | Married-Couple Families | Single-Parent Households |
| No Children | 9 (2.1%) | 37 (22.3%) |
| 1 or 2 Children | 0 (0.0%) | 0 (0.0%) |
| 3 or 4 Children | 0 (0.0%) | 0 (0.0%) |
| 5 or more Children | 0 (0.0%) | 0 (0.0%) |
| Total | 9 (1.1%) | 37 (18.2%) |
Race in Gibson
The most populous races in Gibson are White / Caucasian (2,545 | 72.4%), Black / African American (568 | 16.2%), and Two or more Races (311 | 8.8%).
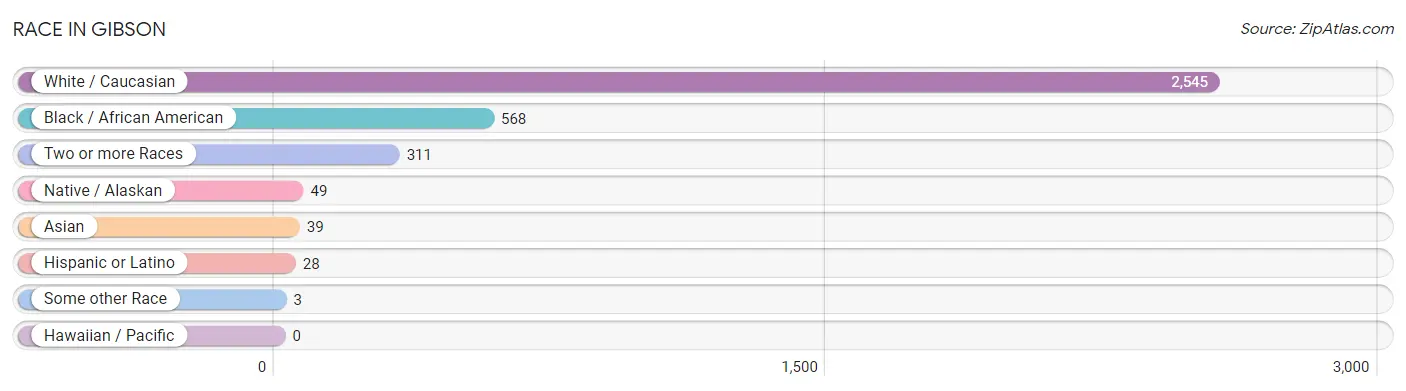
| Race | # Population | % Population |
| Asian | 39 | 1.1% |
| Black / African American | 568 | 16.2% |
| Hawaiian / Pacific | 0 | 0.0% |
| Hispanic or Latino | 28 | 0.8% |
| Native / Alaskan | 49 | 1.4% |
| White / Caucasian | 2,545 | 72.4% |
| Two or more Races | 311 | 8.8% |
| Some other Race | 3 | 0.1% |
| Total | 3,515 | 100.0% |
Ancestry in Gibson
The most populous ancestries reported in Gibson are German (865 | 24.6%), Irish (671 | 19.1%), American (388 | 11.0%), English (215 | 6.1%), and French (83 | 2.4%), together accounting for 63.2% of all Gibson residents.
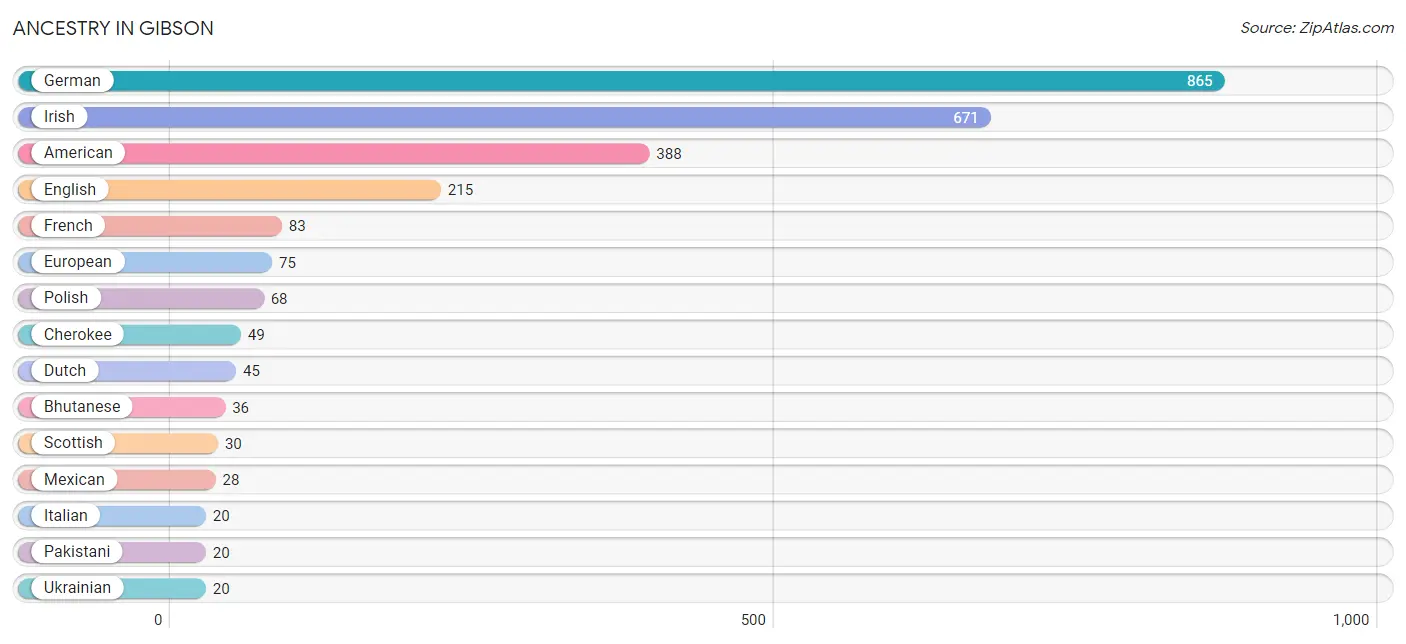
| Ancestry | # Population | % Population |
| American | 388 | 11.0% |
| Arab | 2 | 0.1% |
| Bhutanese | 36 | 1.0% |
| Burmese | 19 | 0.5% |
| Cherokee | 49 | 1.4% |
| Chinese | 3 | 0.1% |
| Dutch | 45 | 1.3% |
| English | 215 | 6.1% |
| European | 75 | 2.1% |
| French | 83 | 2.4% |
| German | 865 | 24.6% |
| Irish | 671 | 19.1% |
| Italian | 20 | 0.6% |
| Lebanese | 2 | 0.1% |
| Lithuanian | 12 | 0.3% |
| Mexican | 28 | 0.8% |
| Pakistani | 20 | 0.6% |
| Polish | 68 | 1.9% |
| Scottish | 30 | 0.9% |
| Swedish | 8 | 0.2% |
| Ukrainian | 20 | 0.6% | View All 21 Rows |
Immigrants in Gibson
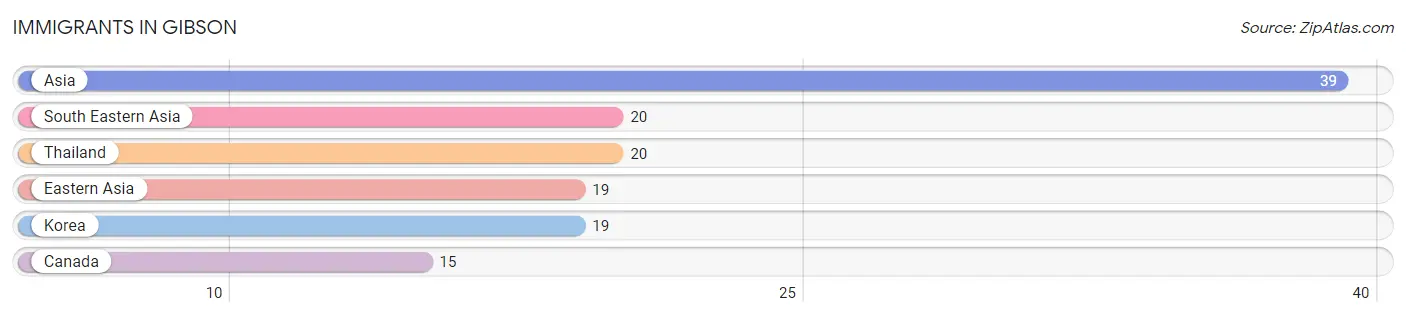
The most numerous immigrant groups reported in Gibson came from Asia (39 | 1.1%), South Eastern Asia (20 | 0.6%), Thailand (20 | 0.6%), Eastern Asia (19 | 0.5%), and Korea (19 | 0.5%), together accounting for 3.3% of all Gibson residents.
| Immigration Origin | # Population | % Population |
| Asia | 39 | 1.1% |
| Canada | 15 | 0.4% |
| Eastern Asia | 19 | 0.5% |
| Korea | 19 | 0.5% |
| South Eastern Asia | 20 | 0.6% |
| Thailand | 20 | 0.6% | View All 6 Rows |
Sex and Age in Gibson
Sex and Age in Gibson
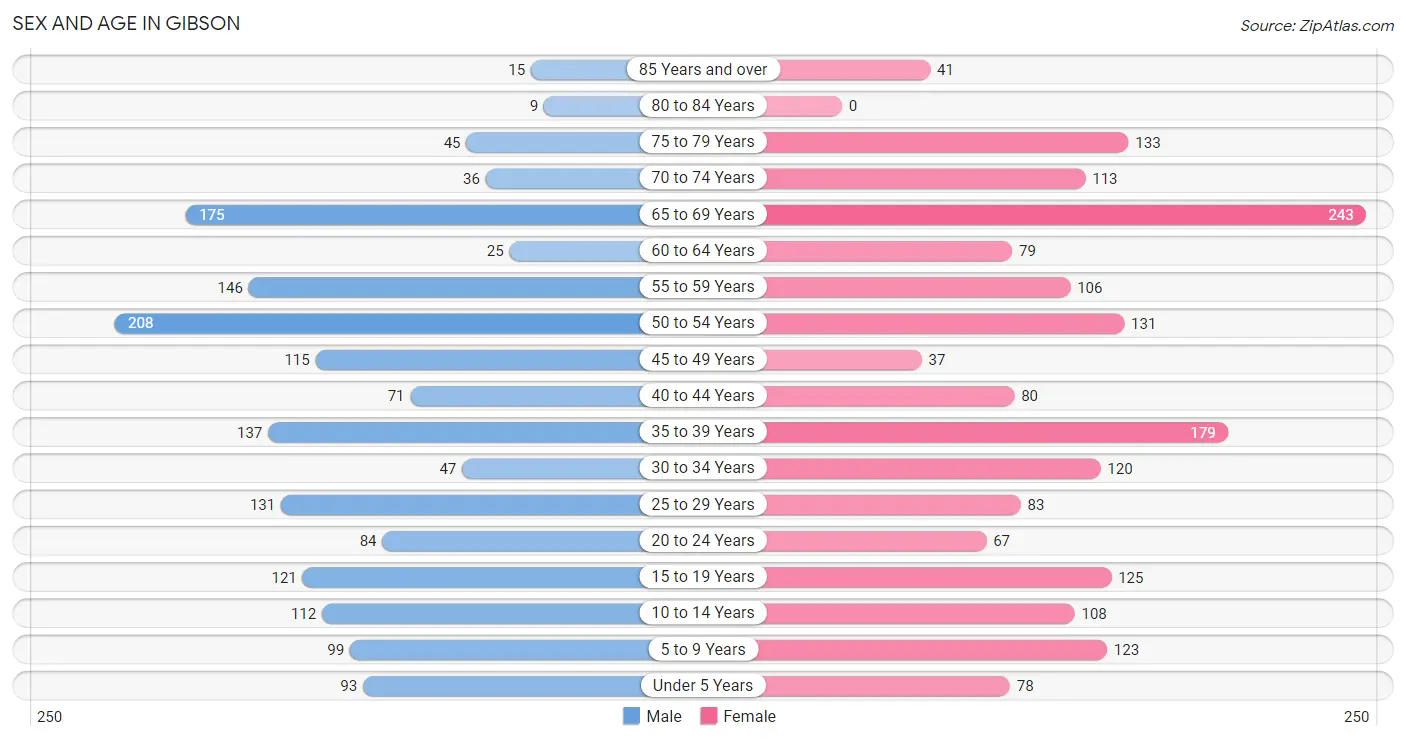
The most populous age groups in Gibson are 50 to 54 Years (208 | 12.5%) for men and 65 to 69 Years (243 | 13.2%) for women.
| Age Bracket | Male | Female |
| Under 5 Years | 93 (5.6%) | 78 (4.2%) |
| 5 to 9 Years | 99 (5.9%) | 123 (6.7%) |
| 10 to 14 Years | 112 (6.7%) | 108 (5.9%) |
| 15 to 19 Years | 121 (7.2%) | 125 (6.8%) |
| 20 to 24 Years | 84 (5.0%) | 67 (3.6%) |
| 25 to 29 Years | 131 (7.9%) | 83 (4.5%) |
| 30 to 34 Years | 47 (2.8%) | 120 (6.5%) |
| 35 to 39 Years | 137 (8.2%) | 179 (9.7%) |
| 40 to 44 Years | 71 (4.3%) | 80 (4.3%) |
| 45 to 49 Years | 115 (6.9%) | 37 (2.0%) |
| 50 to 54 Years | 208 (12.5%) | 131 (7.1%) |
| 55 to 59 Years | 146 (8.7%) | 106 (5.7%) |
| 60 to 64 Years | 25 (1.5%) | 79 (4.3%) |
| 65 to 69 Years | 175 (10.5%) | 243 (13.2%) |
| 70 to 74 Years | 36 (2.2%) | 113 (6.1%) |
| 75 to 79 Years | 45 (2.7%) | 133 (7.2%) |
| 80 to 84 Years | 9 (0.5%) | 0 (0.0%) |
| 85 Years and over | 15 (0.9%) | 41 (2.2%) |
| Total | 1,669 (100.0%) | 1,846 (100.0%) |
Families and Households in Gibson
Median Family Size in Gibson
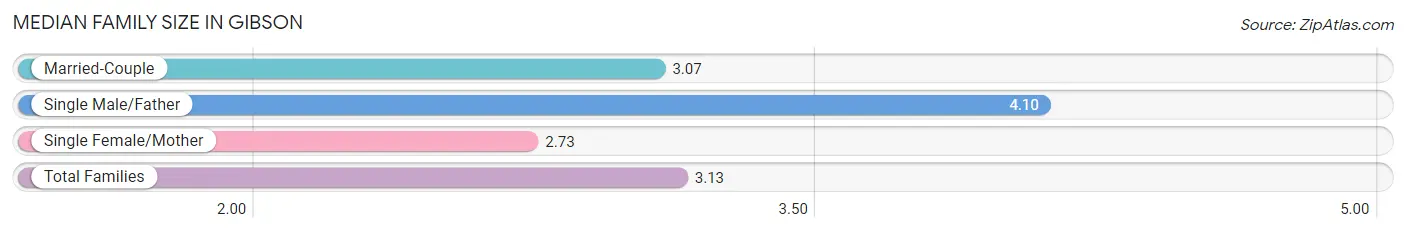
The median family size in Gibson is 3.13 persons per family, with single male/father families (90 | 9.1%) accounting for the largest median family size of 4.1 persons per family. On the other hand, single female/mother families (113 | 11.5%) represent the smallest median family size with 2.73 persons per family.
| Family Type | # Families | Family Size |
| Married-Couple | 784 (79.4%) | 3.07 |
| Single Male/Father | 90 (9.1%) | 4.10 |
| Single Female/Mother | 113 (11.5%) | 2.73 |
| Total Families | 987 (100.0%) | 3.13 |
Median Household Size in Gibson
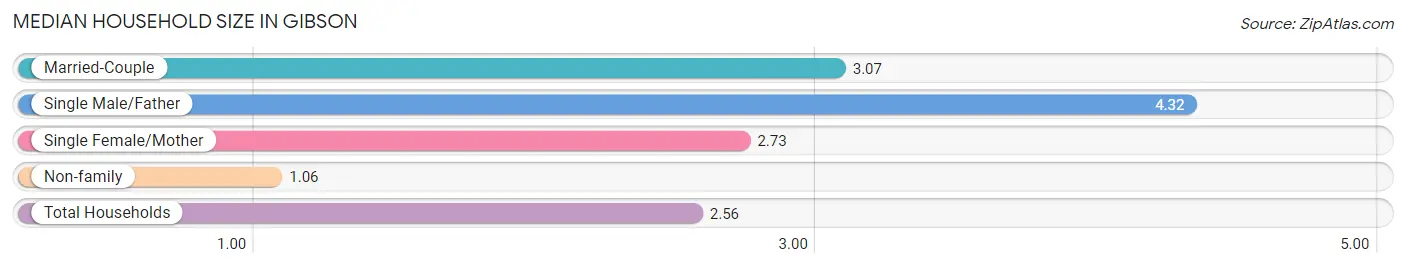
The median household size in Gibson is 2.56 persons per household, with single male/father households (90 | 6.6%) accounting for the largest median household size of 4.32 persons per household. non-family households (385 | 28.1%) represent the smallest median household size with 1.06 persons per household.
| Household Type | # Households | Household Size |
| Married-Couple | 784 (57.1%) | 3.07 |
| Single Male/Father | 90 (6.6%) | 4.32 |
| Single Female/Mother | 113 (8.2%) | 2.73 |
| Non-family | 385 (28.1%) | 1.06 |
| Total Households | 1,372 (100.0%) | 2.56 |
Household Size by Marriage Status in Gibson
Out of a total of 1,372 households in Gibson, 987 (71.9%) are family households, while 385 (28.1%) are nonfamily households. The most numerous type of family households are 2-person households, comprising 518, and the most common type of nonfamily households are 1-person households, comprising 374.
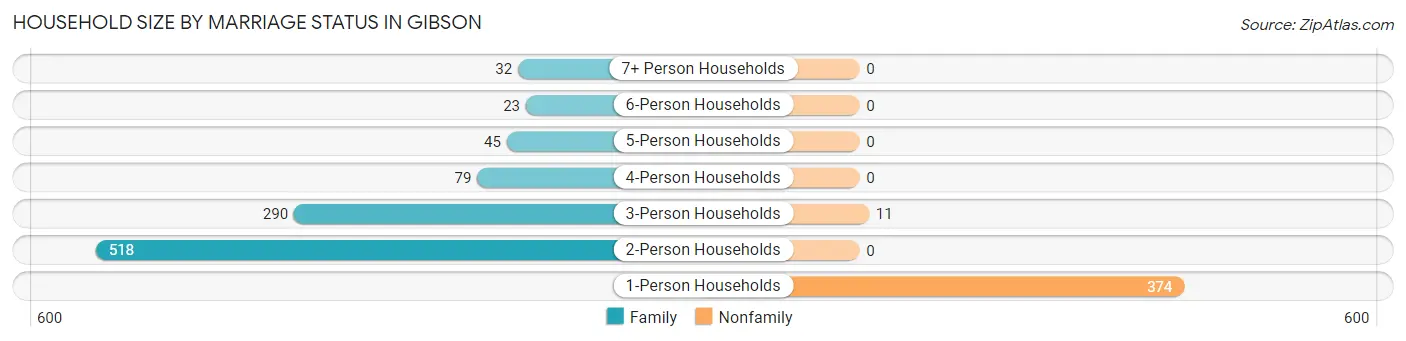
| Household Size | Family Households | Nonfamily Households |
| 1-Person Households | - | 374 (27.3%) |
| 2-Person Households | 518 (37.8%) | 0 (0.0%) |
| 3-Person Households | 290 (21.1%) | 11 (0.8%) |
| 4-Person Households | 79 (5.8%) | 0 (0.0%) |
| 5-Person Households | 45 (3.3%) | 0 (0.0%) |
| 6-Person Households | 23 (1.7%) | 0 (0.0%) |
| 7+ Person Households | 32 (2.3%) | 0 (0.0%) |
| Total | 987 (71.9%) | 385 (28.1%) |
Female Fertility in Gibson
Fertility by Age in Gibson
| Age Bracket | Women with Births | Births / 1,000 Women |
| 15 to 19 years | 0 (0.0%) | 0.0 |
| 20 to 34 years | 0 (0.0%) | 0.0 |
| 35 to 50 years | 0 (0.0%) | 0.0 |
| Total | 0 (0.0%) | 0.0 |
Fertility by Age by Marriage Status in Gibson
| Age Bracket | Married | Unmarried |
| 15 to 19 years | 0 (0.0%) | 0 (0.0%) |
| 20 to 34 years | 0 (0.0%) | 0 (0.0%) |
| 35 to 50 years | 0 (0.0%) | 0 (0.0%) |
| Total | 0 (0.0%) | 0 (0.0%) |
Fertility by Education in Gibson
| Educational Attainment | Women with Births | Births / 1,000 Women |
| Less than High School | 0 (0.0%) | 0.0 |
| High School Diploma | 0 (0.0%) | 0.0 |
| College or Associate's Degree | 0 (0.0%) | 0.0 |
| Bachelor's Degree | 0 (0.0%) | 0.0 |
| Graduate Degree | 0 (0.0%) | 0.0 |
| Total | 0 (0.0%) | 0.0 |
Fertility by Education by Marriage Status in Gibson
| Educational Attainment | Married | Unmarried |
| Less than High School | 0 (0.0%) | 0 (0.0%) |
| High School Diploma | 0 (0.0%) | 0 (0.0%) |
| College or Associate's Degree | 0 (0.0%) | 0 (0.0%) |
| Bachelor's Degree | 0 (0.0%) | 0 (0.0%) |
| Graduate Degree | 0 (0.0%) | 0 (0.0%) |
| Total | 0 (0.0%) | 0 (0.0%) |
Employment Characteristics in Gibson
Employment by Class of Employer in Gibson
Among the 1,607 employed individuals in Gibson, private company employees (1,132 | 70.4%), not-for-profit organizations (198 | 12.3%), and federal government employees (131 | 8.2%) make up the most common classes of employment.
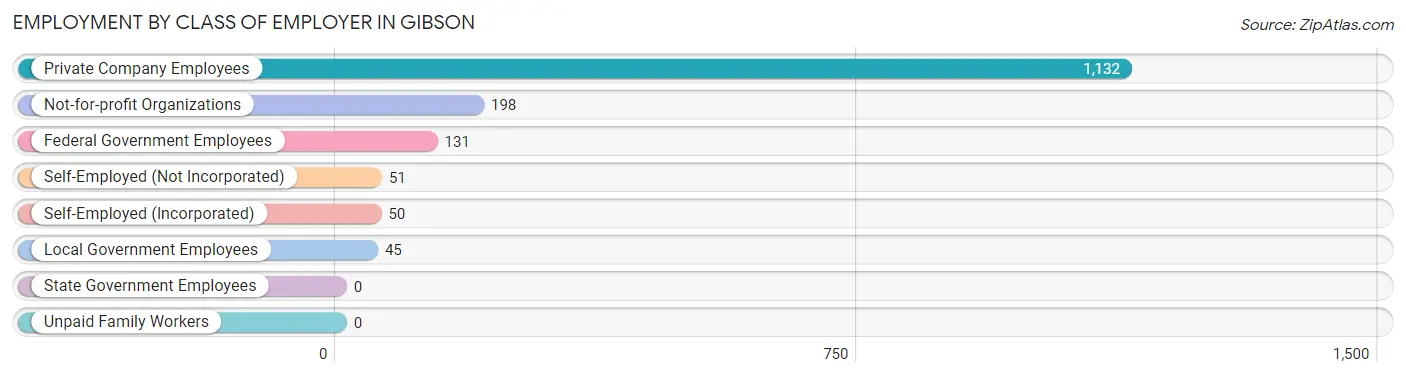
| Employer Class | # Employees | % Employees |
| Private Company Employees | 1,132 | 70.4% |
| Self-Employed (Incorporated) | 50 | 3.1% |
| Self-Employed (Not Incorporated) | 51 | 3.2% |
| Not-for-profit Organizations | 198 | 12.3% |
| Local Government Employees | 45 | 2.8% |
| State Government Employees | 0 | 0.0% |
| Federal Government Employees | 131 | 8.2% |
| Unpaid Family Workers | 0 | 0.0% |
| Total | 1,607 | 100.0% |
Employment Status by Age in Gibson
According to the labor force statistics for Gibson, out of the total population over 16 years of age (2,865), 61.0% or 1,748 individuals are in the labor force, with 8.2% or 143 of them unemployed. The age group with the highest labor force participation rate is 20 to 24 years, with 100.0% or 151 individuals in the labor force. Within the labor force, the 20 to 24 years age range has the highest percentage of unemployed individuals, with 29.1% or 44 of them being unemployed.
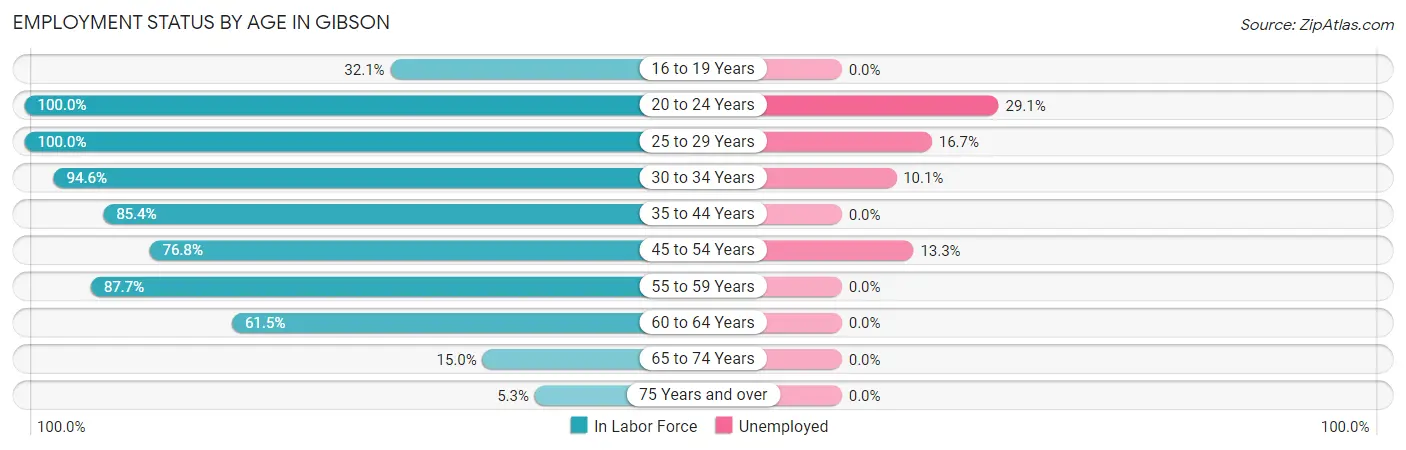
| Age Bracket | In Labor Force | Unemployed |
| 16 to 19 Years | 67 (32.1%) | 0 (0.0%) |
| 20 to 24 Years | 151 (100.0%) | 44 (29.1%) |
| 25 to 29 Years | 214 (100.0%) | 36 (16.7%) |
| 30 to 34 Years | 158 (94.6%) | 16 (10.1%) |
| 35 to 44 Years | 399 (85.4%) | 0 (0.0%) |
| 45 to 54 Years | 377 (76.8%) | 50 (13.3%) |
| 55 to 59 Years | 221 (87.7%) | 0 (0.0%) |
| 60 to 64 Years | 64 (61.5%) | 0 (0.0%) |
| 65 to 74 Years | 85 (15.0%) | 0 (0.0%) |
| 75 Years and over | 13 (5.3%) | 0 (0.0%) |
| Total | 1,748 (61.0%) | 143 (8.2%) |
Employment Status by Educational Attainment in Gibson
According to labor force statistics for Gibson, 84.5% of individuals (1,432) out of the total population between 25 and 64 years of age (1,695) are in the labor force, with 6.9% or 99 of them being unemployed. The group with the highest labor force participation rate are those with the educational attainment of bachelor's degree or higher, with 92.8% or 423 individuals in the labor force. Within the labor force, individuals with high school diploma education have the highest percentage of unemployment, with 10.6% or 48 of them being unemployed.
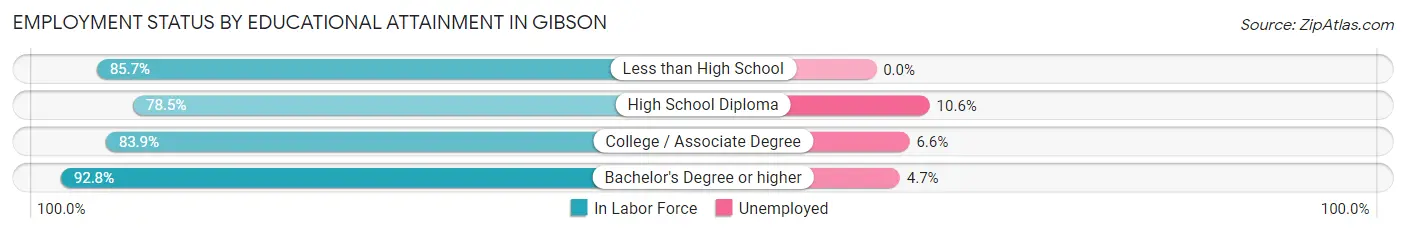
| Educational Attainment | In Labor Force | Unemployed |
| Less than High School | 78 (85.7%) | 0 (0.0%) |
| High School Diploma | 453 (78.5%) | 61 (10.6%) |
| College / Associate Degree | 479 (83.9%) | 38 (6.6%) |
| Bachelor's Degree or higher | 423 (92.8%) | 21 (4.7%) |
| Total | 1,432 (84.5%) | 117 (6.9%) |
Employment Occupations by Sex in Gibson
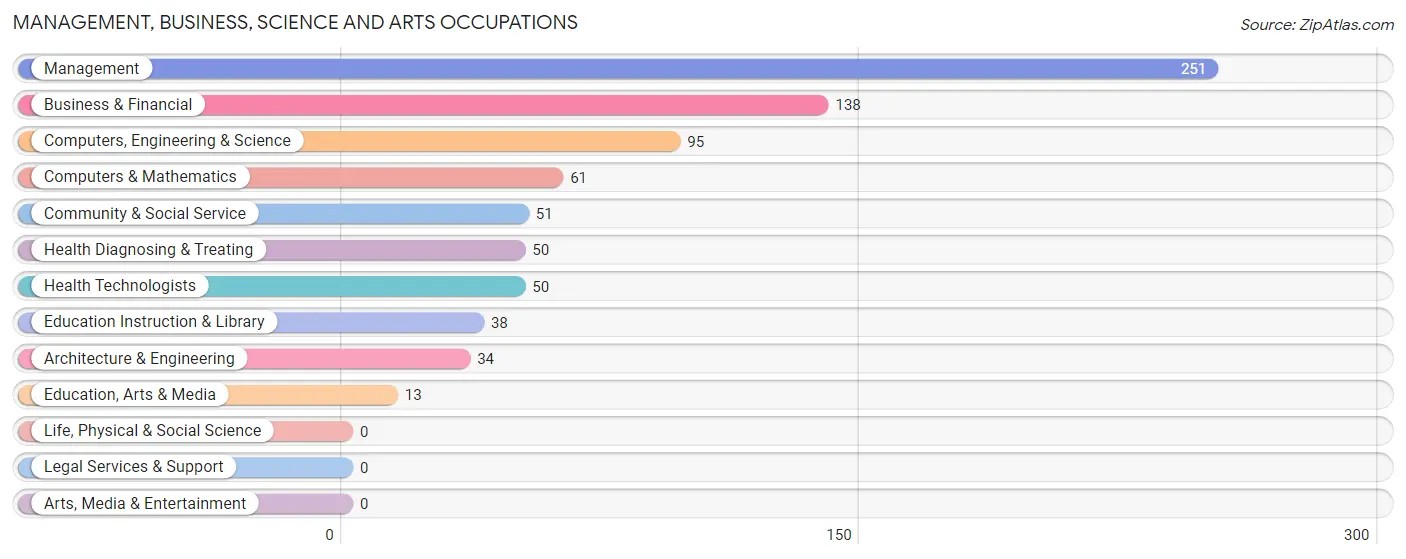
Management, Business, Science and Arts Occupations
The most common Management, Business, Science and Arts occupations in Gibson are Management (251 | 15.8%), Business & Financial (138 | 8.7%), Computers, Engineering & Science (95 | 6.0%), Computers & Mathematics (61 | 3.8%), and Community & Social Service (51 | 3.2%).
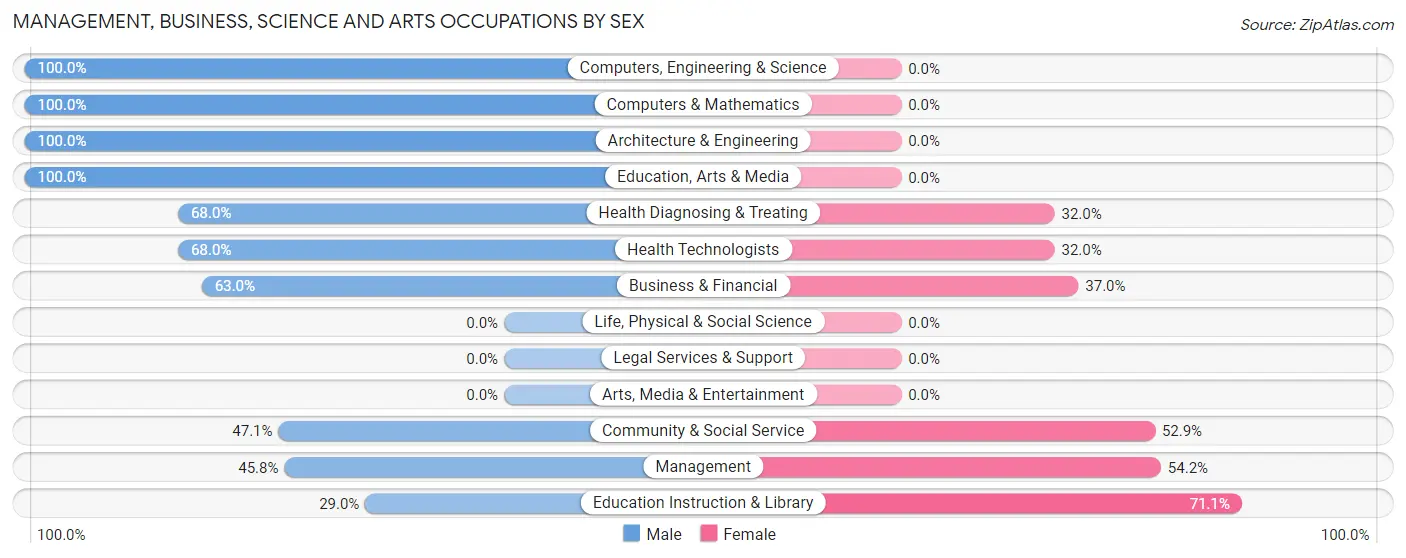
Management, Business, Science and Arts Occupations by Sex
Within the Management, Business, Science and Arts occupations in Gibson, the most male-oriented occupations are Computers, Engineering & Science (100.0%), Computers & Mathematics (100.0%), and Architecture & Engineering (100.0%), while the most female-oriented occupations are Education Instruction & Library (71.1%), Management (54.2%), and Community & Social Service (52.9%).
| Occupation | Male | Female |
| Management | 115 (45.8%) | 136 (54.2%) |
| Business & Financial | 87 (63.0%) | 51 (37.0%) |
| Computers, Engineering & Science | 95 (100.0%) | 0 (0.0%) |
| Computers & Mathematics | 61 (100.0%) | 0 (0.0%) |
| Architecture & Engineering | 34 (100.0%) | 0 (0.0%) |
| Life, Physical & Social Science | 0 (0.0%) | 0 (0.0%) |
| Community & Social Service | 24 (47.1%) | 27 (52.9%) |
| Education, Arts & Media | 13 (100.0%) | 0 (0.0%) |
| Legal Services & Support | 0 (0.0%) | 0 (0.0%) |
| Education Instruction & Library | 11 (28.9%) | 27 (71.1%) |
| Arts, Media & Entertainment | 0 (0.0%) | 0 (0.0%) |
| Health Diagnosing & Treating | 34 (68.0%) | 16 (32.0%) |
| Health Technologists | 34 (68.0%) | 16 (32.0%) |
| Total (Category) | 355 (60.7%) | 230 (39.3%) |
| Total (Overall) | 916 (57.8%) | 669 (42.2%) |
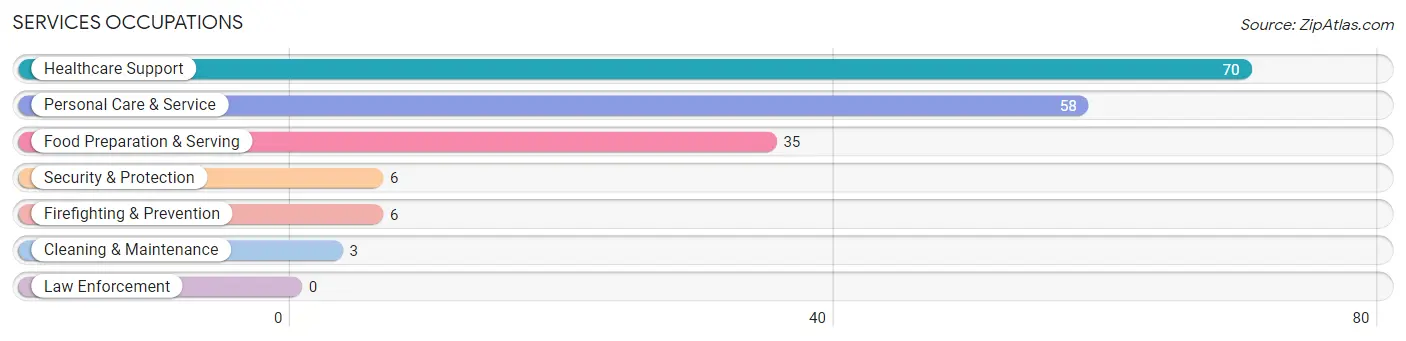
Services Occupations
The most common Services occupations in Gibson are Healthcare Support (70 | 4.4%), Personal Care & Service (58 | 3.7%), Food Preparation & Serving (35 | 2.2%), Security & Protection (6 | 0.4%), and Firefighting & Prevention (6 | 0.4%).
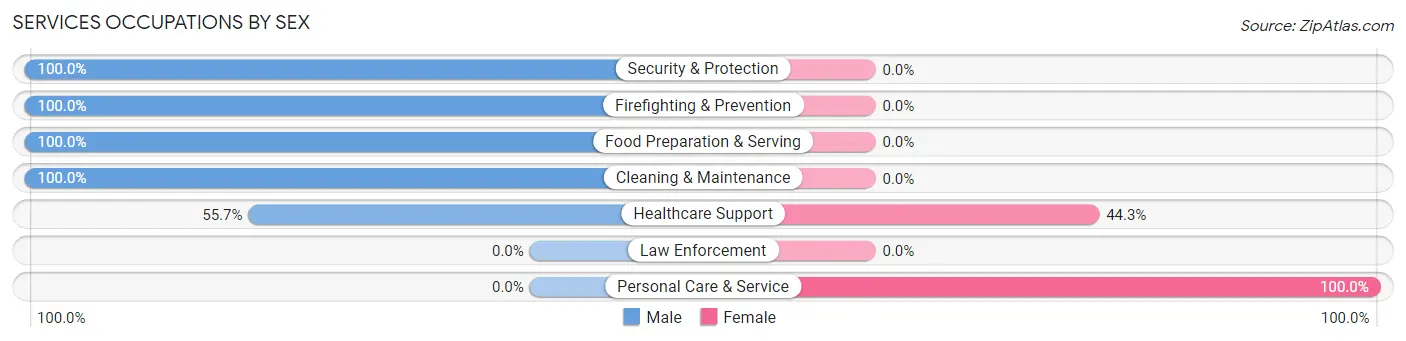
Services Occupations by Sex
Within the Services occupations in Gibson, the most male-oriented occupations are Security & Protection (100.0%), Firefighting & Prevention (100.0%), and Food Preparation & Serving (100.0%), while the most female-oriented occupations are Personal Care & Service (100.0%), and Healthcare Support (44.3%).
| Occupation | Male | Female |
| Healthcare Support | 39 (55.7%) | 31 (44.3%) |
| Security & Protection | 6 (100.0%) | 0 (0.0%) |
| Firefighting & Prevention | 6 (100.0%) | 0 (0.0%) |
| Law Enforcement | 0 (0.0%) | 0 (0.0%) |
| Food Preparation & Serving | 35 (100.0%) | 0 (0.0%) |
| Cleaning & Maintenance | 3 (100.0%) | 0 (0.0%) |
| Personal Care & Service | 0 (0.0%) | 58 (100.0%) |
| Total (Category) | 83 (48.3%) | 89 (51.7%) |
| Total (Overall) | 916 (57.8%) | 669 (42.2%) |
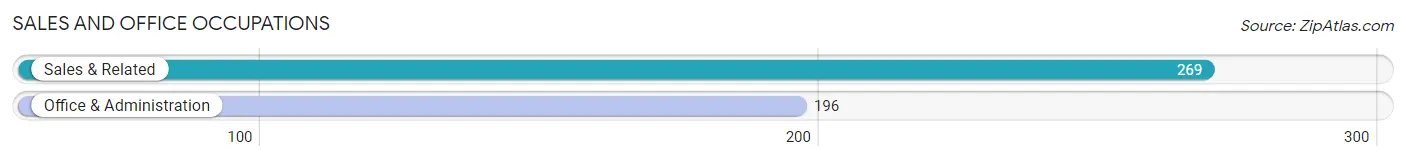
Sales and Office Occupations
The most common Sales and Office occupations in Gibson are Sales & Related (269 | 17.0%), and Office & Administration (196 | 12.4%).
Sales and Office Occupations by Sex
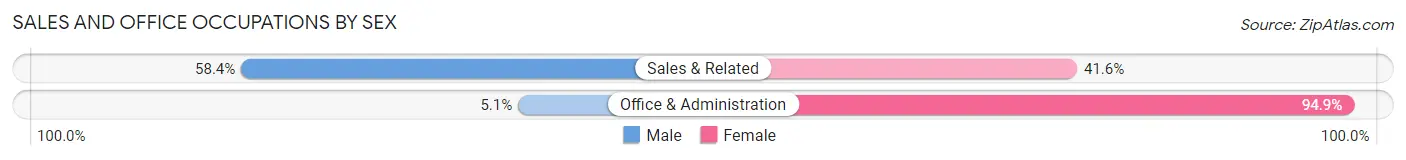
| Occupation | Male | Female |
| Sales & Related | 157 (58.4%) | 112 (41.6%) |
| Office & Administration | 10 (5.1%) | 186 (94.9%) |
| Total (Category) | 167 (35.9%) | 298 (64.1%) |
| Total (Overall) | 916 (57.8%) | 669 (42.2%) |
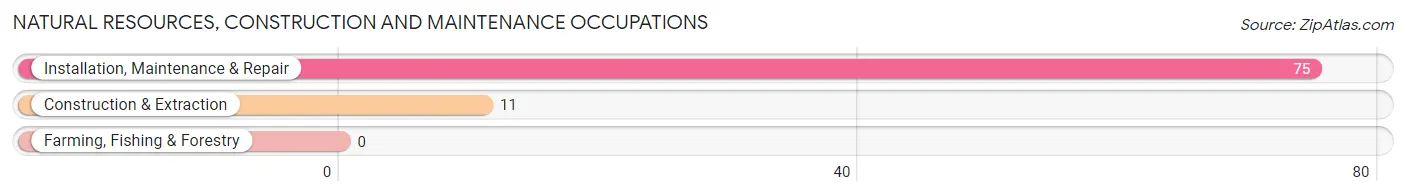
Natural Resources, Construction and Maintenance Occupations
The most common Natural Resources, Construction and Maintenance occupations in Gibson are Installation, Maintenance & Repair (75 | 4.7%), and Construction & Extraction (11 | 0.7%).
Natural Resources, Construction and Maintenance Occupations by Sex
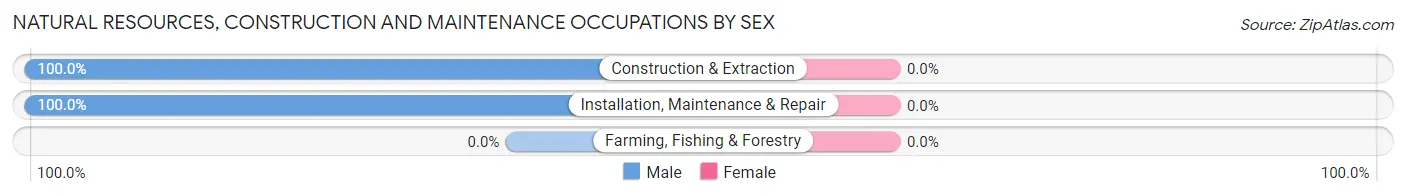
| Occupation | Male | Female |
| Farming, Fishing & Forestry | 0 (0.0%) | 0 (0.0%) |
| Construction & Extraction | 11 (100.0%) | 0 (0.0%) |
| Installation, Maintenance & Repair | 75 (100.0%) | 0 (0.0%) |
| Total (Category) | 86 (100.0%) | 0 (0.0%) |
| Total (Overall) | 916 (57.8%) | 669 (42.2%) |
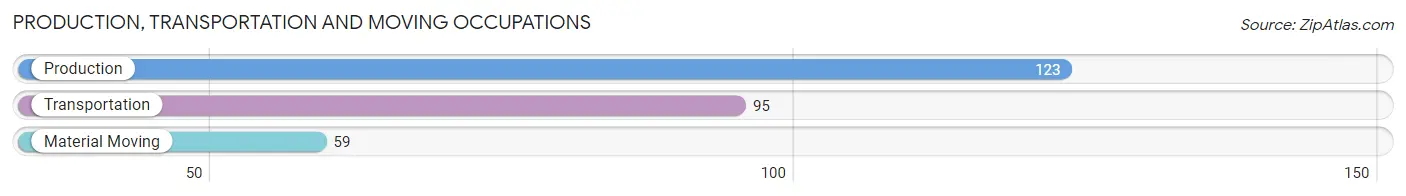
Production, Transportation and Moving Occupations
The most common Production, Transportation and Moving occupations in Gibson are Production (123 | 7.8%), Transportation (95 | 6.0%), and Material Moving (59 | 3.7%).
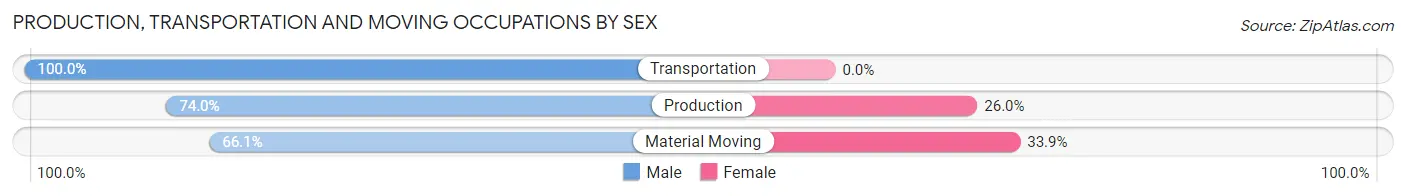
Production, Transportation and Moving Occupations by Sex
| Occupation | Male | Female |
| Production | 91 (74.0%) | 32 (26.0%) |
| Transportation | 95 (100.0%) | 0 (0.0%) |
| Material Moving | 39 (66.1%) | 20 (33.9%) |
| Total (Category) | 225 (81.2%) | 52 (18.8%) |
| Total (Overall) | 916 (57.8%) | 669 (42.2%) |
Employment Industries by Sex in Gibson
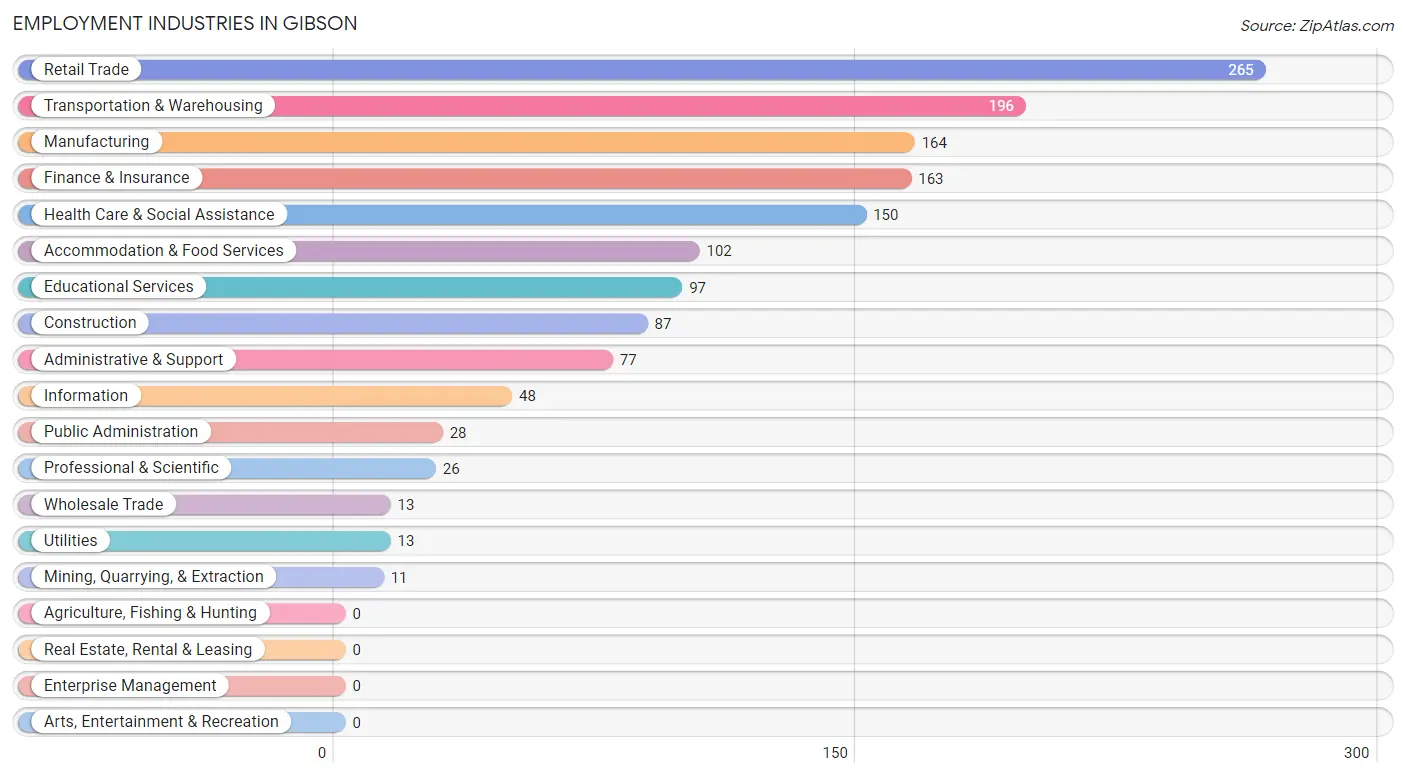
Employment Industries in Gibson
The major employment industries in Gibson include Retail Trade (265 | 16.7%), Transportation & Warehousing (196 | 12.4%), Manufacturing (164 | 10.3%), Finance & Insurance (163 | 10.3%), and Health Care & Social Assistance (150 | 9.5%).
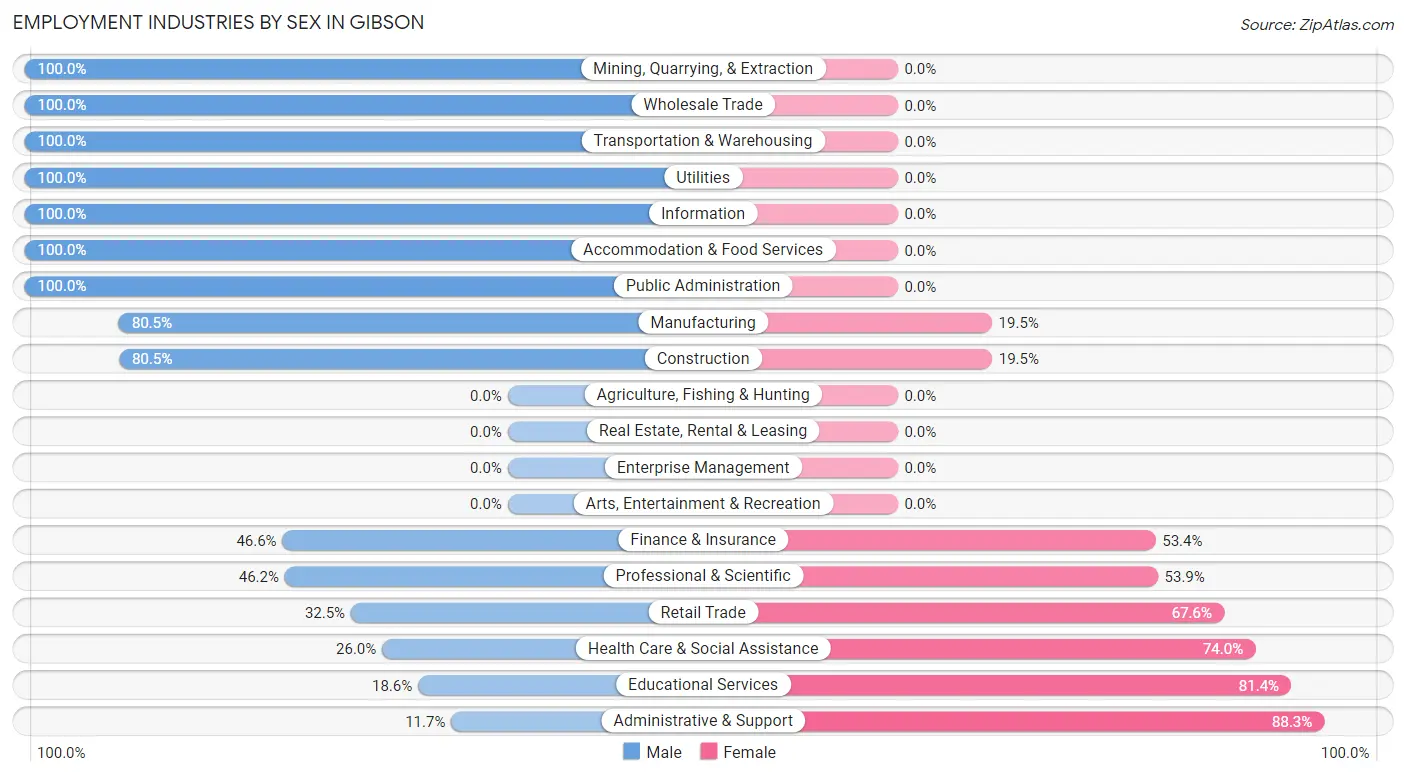
Employment Industries by Sex in Gibson
The Gibson industries that see more men than women are Mining, Quarrying, & Extraction (100.0%), Wholesale Trade (100.0%), and Transportation & Warehousing (100.0%), whereas the industries that tend to have a higher number of women are Administrative & Support (88.3%), Educational Services (81.4%), and Health Care & Social Assistance (74.0%).
| Industry | Male | Female |
| Agriculture, Fishing & Hunting | 0 (0.0%) | 0 (0.0%) |
| Mining, Quarrying, & Extraction | 11 (100.0%) | 0 (0.0%) |
| Construction | 70 (80.5%) | 17 (19.5%) |
| Manufacturing | 132 (80.5%) | 32 (19.5%) |
| Wholesale Trade | 13 (100.0%) | 0 (0.0%) |
| Retail Trade | 86 (32.5%) | 179 (67.5%) |
| Transportation & Warehousing | 196 (100.0%) | 0 (0.0%) |
| Utilities | 13 (100.0%) | 0 (0.0%) |
| Information | 48 (100.0%) | 0 (0.0%) |
| Finance & Insurance | 76 (46.6%) | 87 (53.4%) |
| Real Estate, Rental & Leasing | 0 (0.0%) | 0 (0.0%) |
| Professional & Scientific | 12 (46.2%) | 14 (53.8%) |
| Enterprise Management | 0 (0.0%) | 0 (0.0%) |
| Administrative & Support | 9 (11.7%) | 68 (88.3%) |
| Educational Services | 18 (18.6%) | 79 (81.4%) |
| Health Care & Social Assistance | 39 (26.0%) | 111 (74.0%) |
| Arts, Entertainment & Recreation | 0 (0.0%) | 0 (0.0%) |
| Accommodation & Food Services | 102 (100.0%) | 0 (0.0%) |
| Public Administration | 28 (100.0%) | 0 (0.0%) |
| Total | 916 (57.8%) | 669 (42.2%) |
Education in Gibson
School Enrollment in Gibson
The most common levels of schooling among the 745 students in Gibson are high school (239 | 32.1%), elementary school (220 | 29.5%), and middle school (172 | 23.1%).
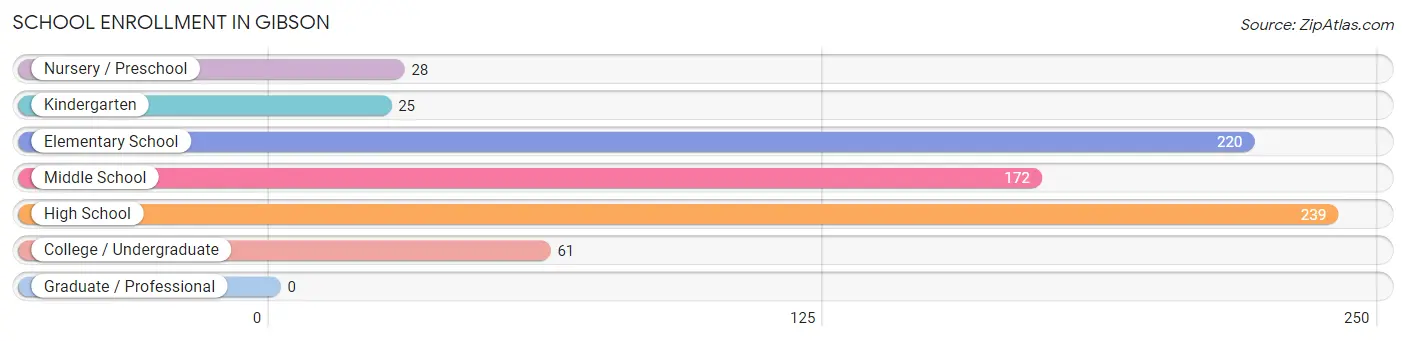
| School Level | # Students | % Students |
| Nursery / Preschool | 28 | 3.8% |
| Kindergarten | 25 | 3.4% |
| Elementary School | 220 | 29.5% |
| Middle School | 172 | 23.1% |
| High School | 239 | 32.1% |
| College / Undergraduate | 61 | 8.2% |
| Graduate / Professional | 0 | 0.0% |
| Total | 745 | 100.0% |
School Enrollment by Age by Funding Source in Gibson
Out of a total of 745 students who are enrolled in schools in Gibson, 75 (10.1%) attend a private institution, while the remaining 670 (89.9%) are enrolled in public schools. The age group of 25 to 34 year olds has the highest likelihood of being enrolled in private schools, with 22 (100.0% in the age bracket) enrolled. Conversely, the age group of 3 to 4 year olds has the lowest likelihood of being enrolled in a private school, with 28 (100.0% in the age bracket) attending a public institution.
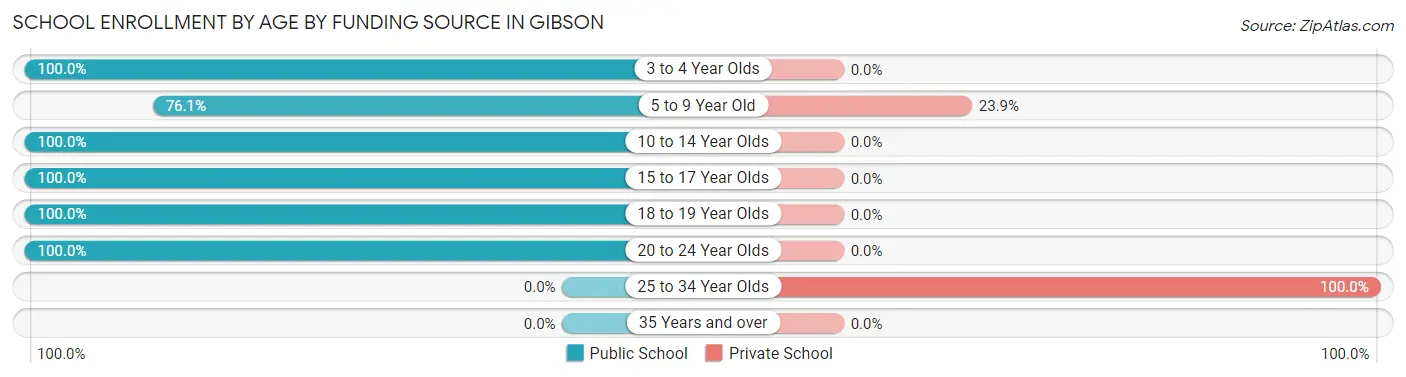
| Age Bracket | Public School | Private School |
| 3 to 4 Year Olds | 28 (100.0%) | 0 (0.0%) |
| 5 to 9 Year Old | 169 (76.1%) | 53 (23.9%) |
| 10 to 14 Year Olds | 220 (100.0%) | 0 (0.0%) |
| 15 to 17 Year Olds | 165 (100.0%) | 0 (0.0%) |
| 18 to 19 Year Olds | 49 (100.0%) | 0 (0.0%) |
| 20 to 24 Year Olds | 39 (100.0%) | 0 (0.0%) |
| 25 to 34 Year Olds | 0 (0.0%) | 22 (100.0%) |
| 35 Years and over | 0 (0.0%) | 0 (0.0%) |
| Total | 670 (89.9%) | 75 (10.1%) |
Educational Attainment by Field of Study in Gibson
Education (164 | 26.0%), business (110 | 17.4%), liberal arts & history (87 | 13.8%), literature & languages (55 | 8.7%), and engineering (49 | 7.8%) are the most common fields of study among 631 individuals in Gibson who have obtained a bachelor's degree or higher.
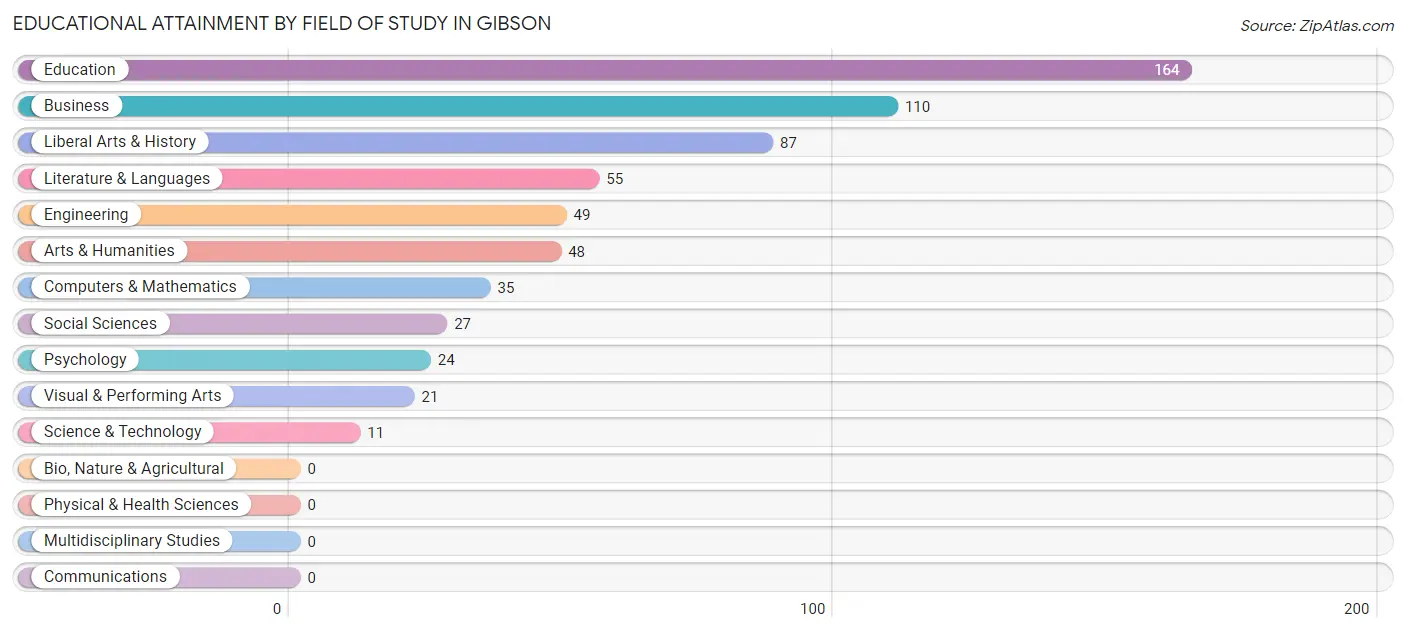
| Field of Study | # Graduates | % Graduates |
| Computers & Mathematics | 35 | 5.6% |
| Bio, Nature & Agricultural | 0 | 0.0% |
| Physical & Health Sciences | 0 | 0.0% |
| Psychology | 24 | 3.8% |
| Social Sciences | 27 | 4.3% |
| Engineering | 49 | 7.8% |
| Multidisciplinary Studies | 0 | 0.0% |
| Science & Technology | 11 | 1.7% |
| Business | 110 | 17.4% |
| Education | 164 | 26.0% |
| Literature & Languages | 55 | 8.7% |
| Liberal Arts & History | 87 | 13.8% |
| Visual & Performing Arts | 21 | 3.3% |
| Communications | 0 | 0.0% |
| Arts & Humanities | 48 | 7.6% |
| Total | 631 | 100.0% |
Transportation & Commute in Gibson
Vehicle Availability by Sex in Gibson
The most prevalent vehicle ownership categories in Gibson are males with 2 vehicles (459, accounting for 48.9%) and females with 2 vehicles (245, making up 68.6%).
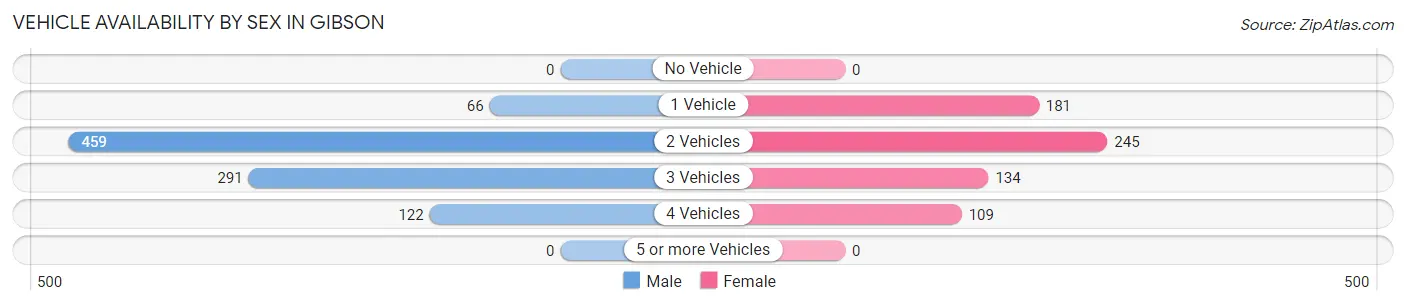
| Vehicles Available | Male | Female |
| No Vehicle | 0 (0.0%) | 0 (0.0%) |
| 1 Vehicle | 66 (7.0%) | 181 (27.1%) |
| 2 Vehicles | 459 (48.9%) | 245 (36.6%) |
| 3 Vehicles | 291 (31.0%) | 134 (20.0%) |
| 4 Vehicles | 122 (13.0%) | 109 (16.3%) |
| 5 or more Vehicles | 0 (0.0%) | 0 (0.0%) |
| Total | 938 (100.0%) | 669 (100.0%) |
Commute Time in Gibson
The most frequently occuring commute durations in Gibson are 20 to 24 minutes (315 commuters, 21.0%), 30 to 34 minutes (285 commuters, 19.0%), and 35 to 39 minutes (165 commuters, 11.0%).
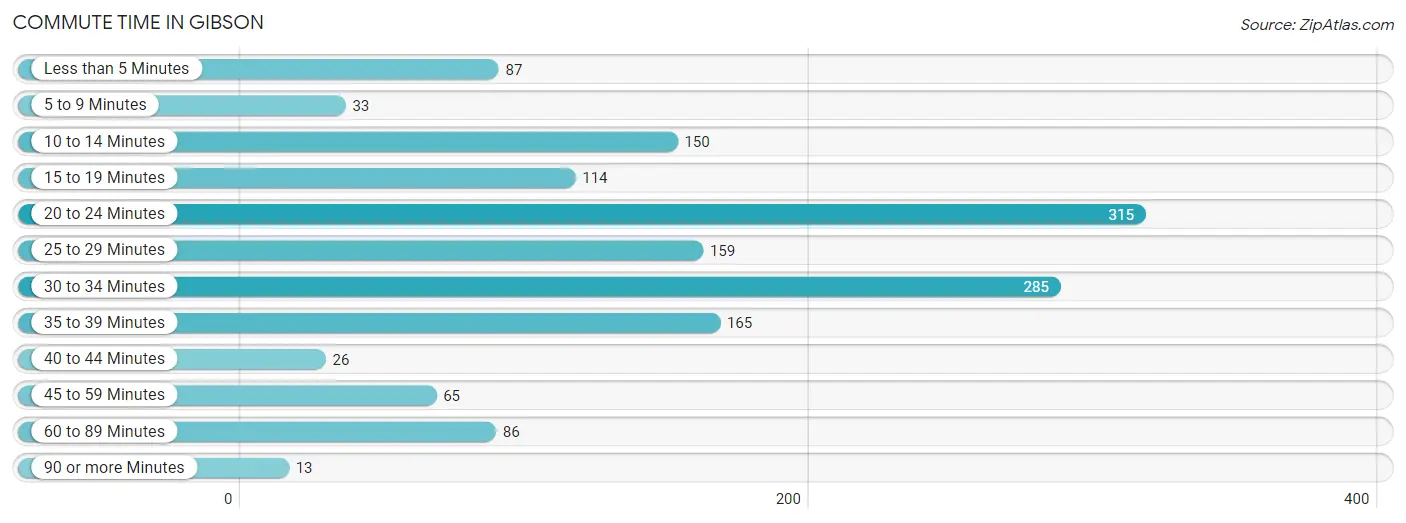
| Commute Time | # Commuters | % Commuters |
| Less than 5 Minutes | 87 | 5.8% |
| 5 to 9 Minutes | 33 | 2.2% |
| 10 to 14 Minutes | 150 | 10.0% |
| 15 to 19 Minutes | 114 | 7.6% |
| 20 to 24 Minutes | 315 | 21.0% |
| 25 to 29 Minutes | 159 | 10.6% |
| 30 to 34 Minutes | 285 | 19.0% |
| 35 to 39 Minutes | 165 | 11.0% |
| 40 to 44 Minutes | 26 | 1.7% |
| 45 to 59 Minutes | 65 | 4.3% |
| 60 to 89 Minutes | 86 | 5.7% |
| 90 or more Minutes | 13 | 0.9% |
Commute Time by Sex in Gibson
The most common commute times in Gibson are 30 to 34 minutes (218 commuters, 23.3%) for males and 20 to 24 minutes (166 commuters, 29.5%) for females.
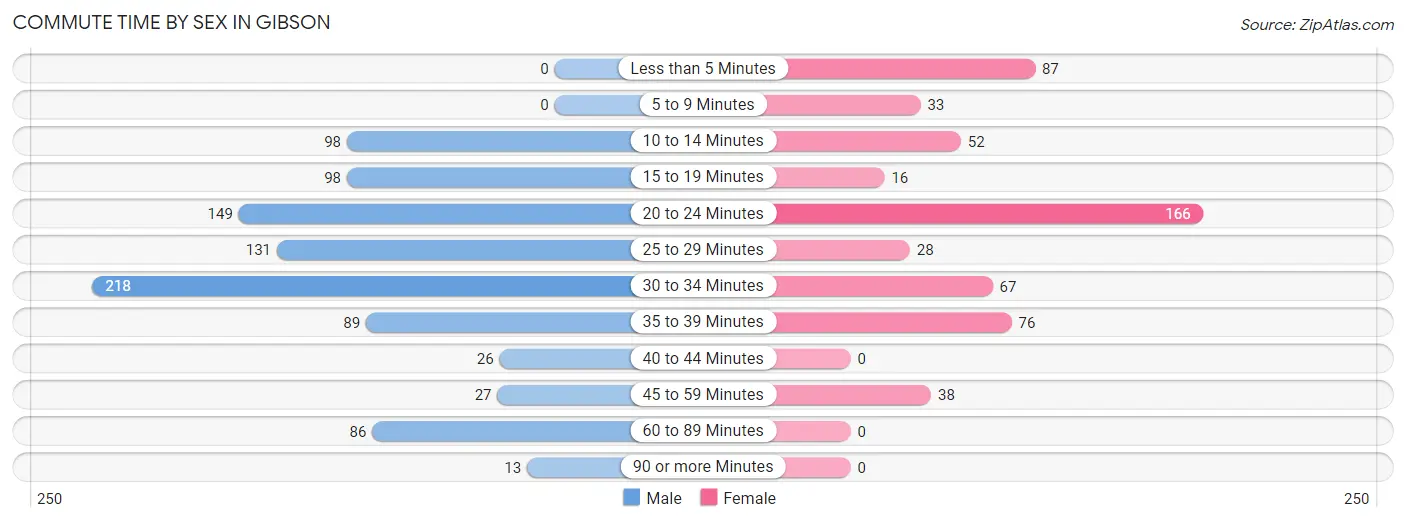
| Commute Time | Male | Female |
| Less than 5 Minutes | 0 (0.0%) | 87 (15.4%) |
| 5 to 9 Minutes | 0 (0.0%) | 33 (5.9%) |
| 10 to 14 Minutes | 98 (10.5%) | 52 (9.2%) |
| 15 to 19 Minutes | 98 (10.5%) | 16 (2.8%) |
| 20 to 24 Minutes | 149 (15.9%) | 166 (29.5%) |
| 25 to 29 Minutes | 131 (14.0%) | 28 (5.0%) |
| 30 to 34 Minutes | 218 (23.3%) | 67 (11.9%) |
| 35 to 39 Minutes | 89 (9.5%) | 76 (13.5%) |
| 40 to 44 Minutes | 26 (2.8%) | 0 (0.0%) |
| 45 to 59 Minutes | 27 (2.9%) | 38 (6.8%) |
| 60 to 89 Minutes | 86 (9.2%) | 0 (0.0%) |
| 90 or more Minutes | 13 (1.4%) | 0 (0.0%) |
Time of Departure to Work by Sex in Gibson
The most frequent times of departure to work in Gibson are 4:00 PM to 11:59 PM (169, 18.1%) for males and 7:00 AM to 7:29 AM (97, 17.2%) for females.
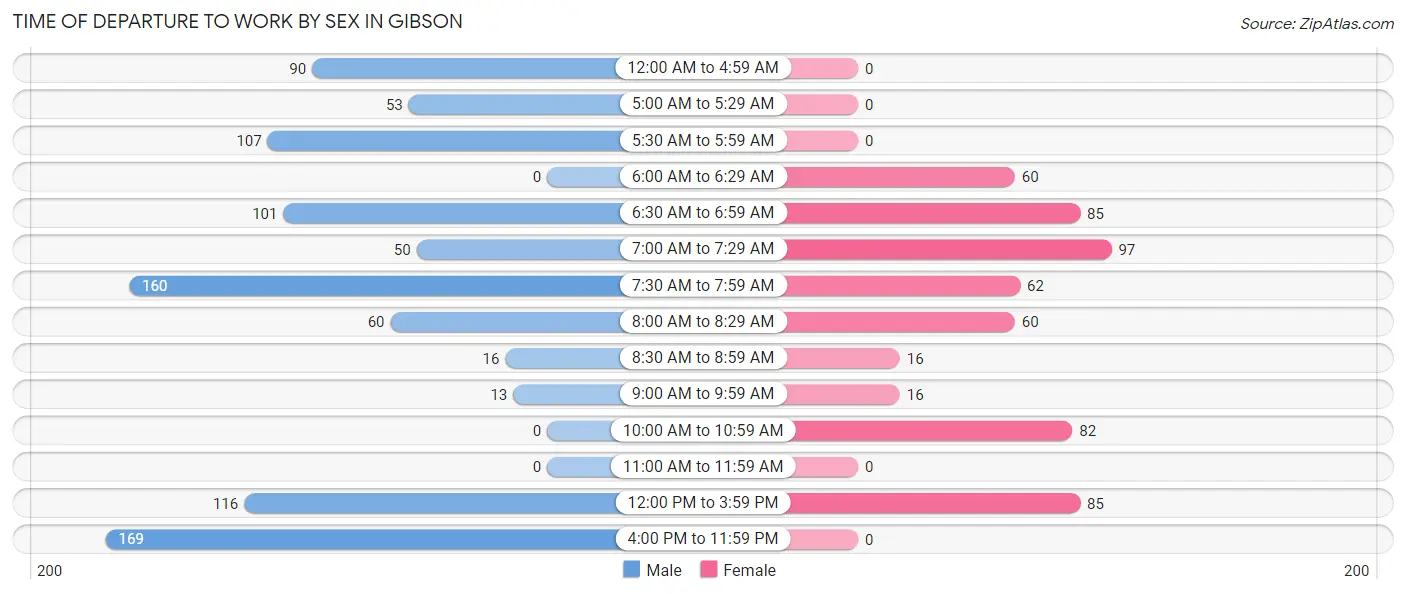
| Time of Departure | Male | Female |
| 12:00 AM to 4:59 AM | 90 (9.6%) | 0 (0.0%) |
| 5:00 AM to 5:29 AM | 53 (5.7%) | 0 (0.0%) |
| 5:30 AM to 5:59 AM | 107 (11.4%) | 0 (0.0%) |
| 6:00 AM to 6:29 AM | 0 (0.0%) | 60 (10.7%) |
| 6:30 AM to 6:59 AM | 101 (10.8%) | 85 (15.1%) |
| 7:00 AM to 7:29 AM | 50 (5.3%) | 97 (17.2%) |
| 7:30 AM to 7:59 AM | 160 (17.1%) | 62 (11.0%) |
| 8:00 AM to 8:29 AM | 60 (6.4%) | 60 (10.7%) |
| 8:30 AM to 8:59 AM | 16 (1.7%) | 16 (2.8%) |
| 9:00 AM to 9:59 AM | 13 (1.4%) | 16 (2.8%) |
| 10:00 AM to 10:59 AM | 0 (0.0%) | 82 (14.6%) |
| 11:00 AM to 11:59 AM | 0 (0.0%) | 0 (0.0%) |
| 12:00 PM to 3:59 PM | 116 (12.4%) | 85 (15.1%) |
| 4:00 PM to 11:59 PM | 169 (18.1%) | 0 (0.0%) |
| Total | 935 (100.0%) | 563 (100.0%) |
Housing Occupancy in Gibson
Occupancy by Ownership in Gibson
Of the total 1,372 dwellings in Gibson, owner-occupied units account for 1,068 (77.8%), while renter-occupied units make up 304 (22.2%).
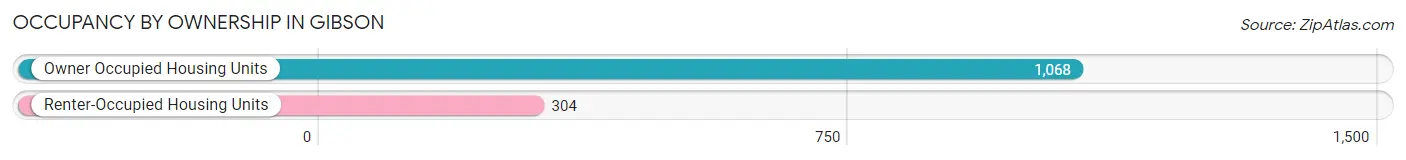
| Occupancy | # Housing Units | % Housing Units |
| Owner Occupied Housing Units | 1,068 | 77.8% |
| Renter-Occupied Housing Units | 304 | 22.2% |
| Total Occupied Housing Units | 1,372 | 100.0% |
Occupancy by Household Size in Gibson
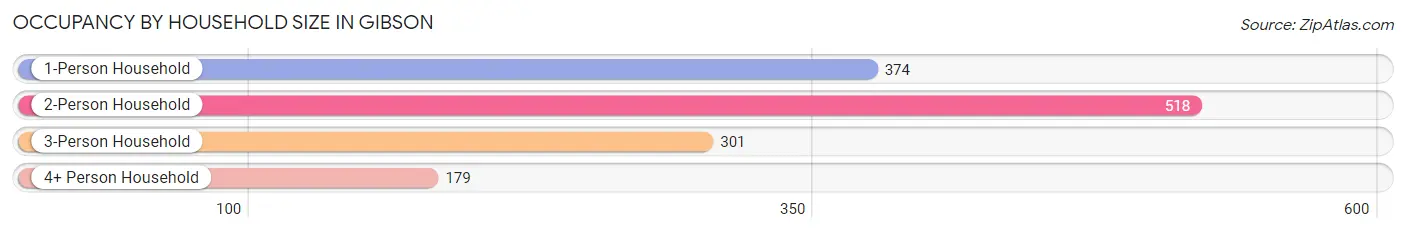
| Household Size | # Housing Units | % Housing Units |
| 1-Person Household | 374 | 27.3% |
| 2-Person Household | 518 | 37.8% |
| 3-Person Household | 301 | 21.9% |
| 4+ Person Household | 179 | 13.1% |
| Total Housing Units | 1,372 | 100.0% |
Occupancy by Ownership by Household Size in Gibson
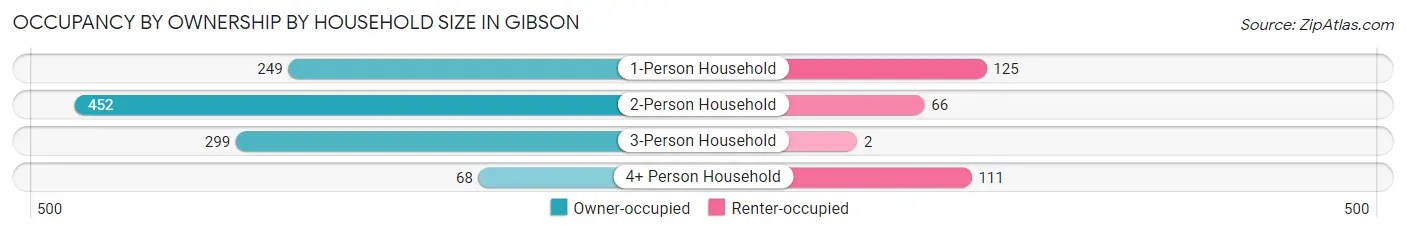
| Household Size | Owner-occupied | Renter-occupied |
| 1-Person Household | 249 (66.6%) | 125 (33.4%) |
| 2-Person Household | 452 (87.3%) | 66 (12.7%) |
| 3-Person Household | 299 (99.3%) | 2 (0.7%) |
| 4+ Person Household | 68 (38.0%) | 111 (62.0%) |
| Total Housing Units | 1,068 (77.8%) | 304 (22.2%) |
Occupancy by Educational Attainment in Gibson
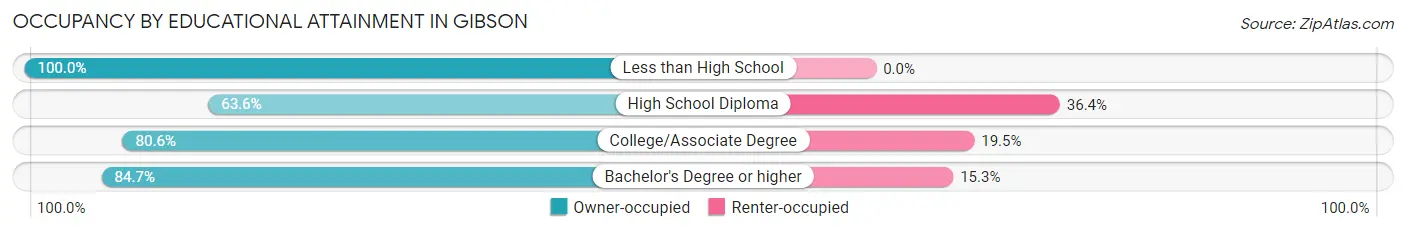
| Household Size | Owner-occupied | Renter-occupied |
| Less than High School | 24 (100.0%) | 0 (0.0%) |
| High School Diploma | 213 (63.6%) | 122 (36.4%) |
| College/Associate Degree | 526 (80.5%) | 127 (19.5%) |
| Bachelor's Degree or higher | 305 (84.7%) | 55 (15.3%) |
Occupancy by Age of Householder in Gibson
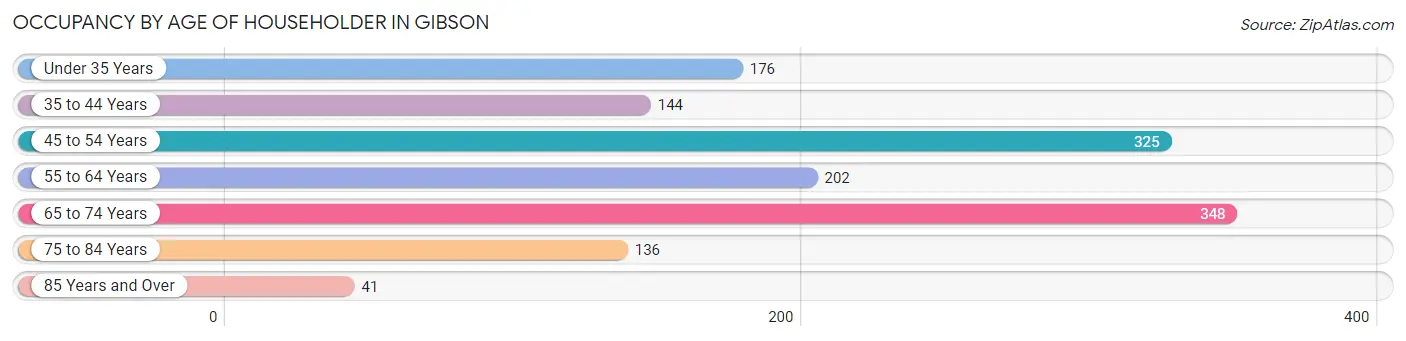
| Age Bracket | # Households | % Households |
| Under 35 Years | 176 | 12.8% |
| 35 to 44 Years | 144 | 10.5% |
| 45 to 54 Years | 325 | 23.7% |
| 55 to 64 Years | 202 | 14.7% |
| 65 to 74 Years | 348 | 25.4% |
| 75 to 84 Years | 136 | 9.9% |
| 85 Years and Over | 41 | 3.0% |
| Total | 1,372 | 100.0% |
Housing Finances in Gibson
Median Income by Occupancy in Gibson
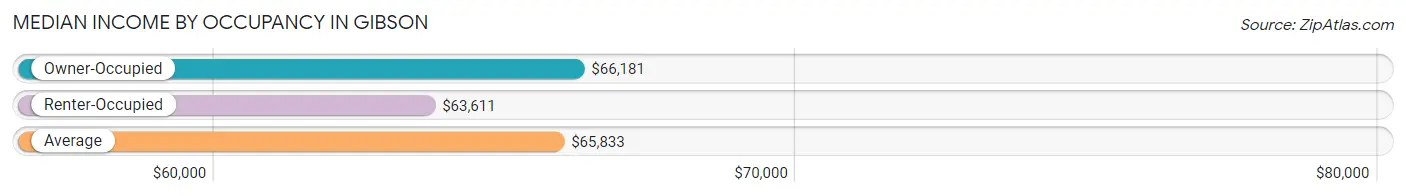
| Occupancy Type | # Households | Median Income |
| Owner-Occupied | 1,068 (77.8%) | $66,181 |
| Renter-Occupied | 304 (22.2%) | $63,611 |
| Average | 1,372 (100.0%) | $65,833 |
Occupancy by Householder Income Bracket in Gibson
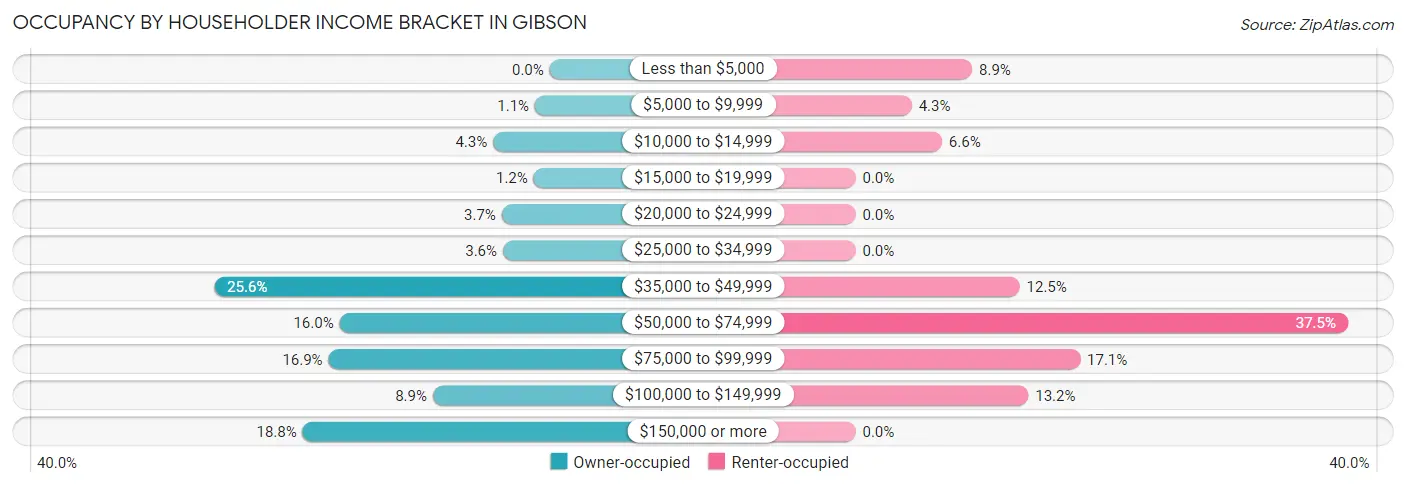
| Income Bracket | Owner-occupied | Renter-occupied |
| Less than $5,000 | 0 (0.0%) | 27 (8.9%) |
| $5,000 to $9,999 | 12 (1.1%) | 13 (4.3%) |
| $10,000 to $14,999 | 46 (4.3%) | 20 (6.6%) |
| $15,000 to $19,999 | 13 (1.2%) | 0 (0.0%) |
| $20,000 to $24,999 | 39 (3.6%) | 0 (0.0%) |
| $25,000 to $34,999 | 38 (3.6%) | 0 (0.0%) |
| $35,000 to $49,999 | 273 (25.6%) | 38 (12.5%) |
| $50,000 to $74,999 | 171 (16.0%) | 114 (37.5%) |
| $75,000 to $99,999 | 180 (16.9%) | 52 (17.1%) |
| $100,000 to $149,999 | 95 (8.9%) | 40 (13.2%) |
| $150,000 or more | 201 (18.8%) | 0 (0.0%) |
| Total | 1,068 (100.0%) | 304 (100.0%) |
Monthly Housing Cost Tiers in Gibson
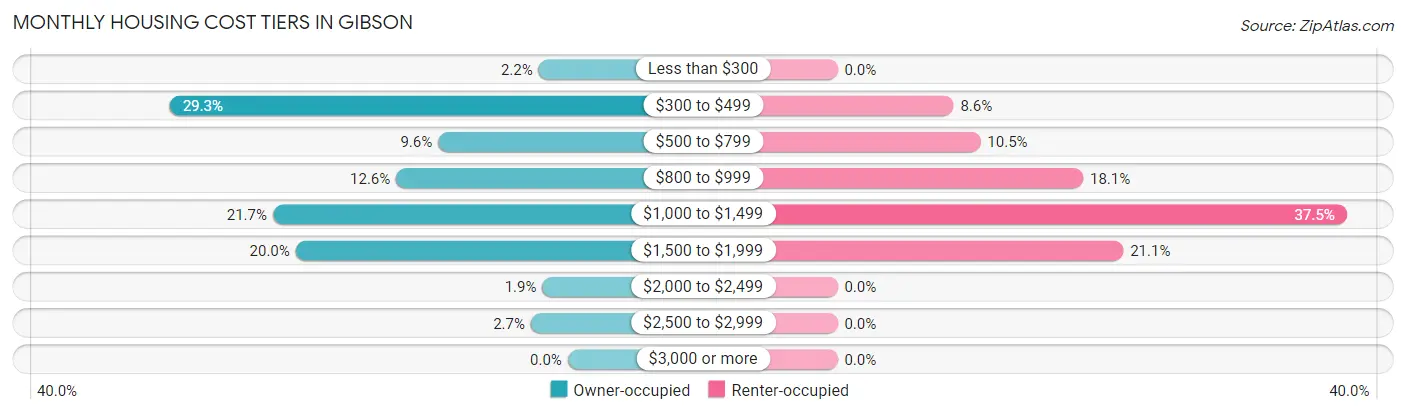
| Monthly Cost | Owner-occupied | Renter-occupied |
| Less than $300 | 23 (2.1%) | 0 (0.0%) |
| $300 to $499 | 313 (29.3%) | 26 (8.6%) |
| $500 to $799 | 102 (9.6%) | 32 (10.5%) |
| $800 to $999 | 135 (12.6%) | 55 (18.1%) |
| $1,000 to $1,499 | 232 (21.7%) | 114 (37.5%) |
| $1,500 to $1,999 | 214 (20.0%) | 64 (21.0%) |
| $2,000 to $2,499 | 20 (1.9%) | 0 (0.0%) |
| $2,500 to $2,999 | 29 (2.7%) | 0 (0.0%) |
| $3,000 or more | 0 (0.0%) | 0 (0.0%) |
| Total | 1,068 (100.0%) | 304 (100.0%) |
Physical Housing Characteristics in Gibson
Housing Structures in Gibson
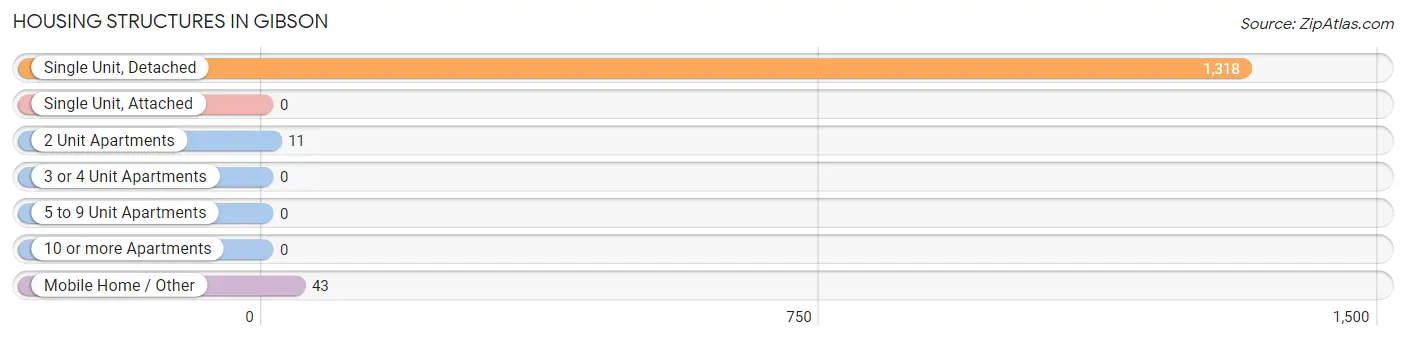
| Structure Type | # Housing Units | % Housing Units |
| Single Unit, Detached | 1,318 | 96.1% |
| Single Unit, Attached | 0 | 0.0% |
| 2 Unit Apartments | 11 | 0.8% |
| 3 or 4 Unit Apartments | 0 | 0.0% |
| 5 to 9 Unit Apartments | 0 | 0.0% |
| 10 or more Apartments | 0 | 0.0% |
| Mobile Home / Other | 43 | 3.1% |
| Total | 1,372 | 100.0% |
Housing Structures by Occupancy in Gibson
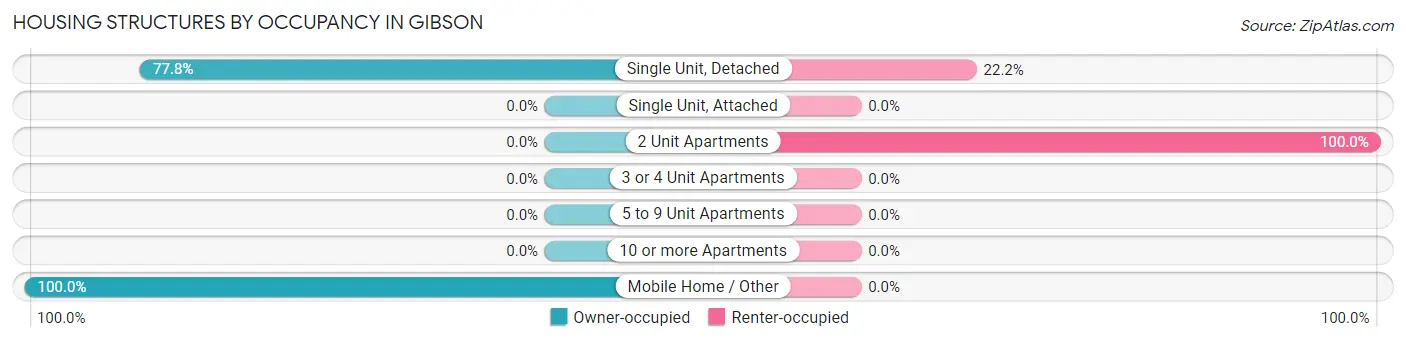
| Structure Type | Owner-occupied | Renter-occupied |
| Single Unit, Detached | 1,025 (77.8%) | 293 (22.2%) |
| Single Unit, Attached | 0 (0.0%) | 0 (0.0%) |
| 2 Unit Apartments | 0 (0.0%) | 11 (100.0%) |
| 3 or 4 Unit Apartments | 0 (0.0%) | 0 (0.0%) |
| 5 to 9 Unit Apartments | 0 (0.0%) | 0 (0.0%) |
| 10 or more Apartments | 0 (0.0%) | 0 (0.0%) |
| Mobile Home / Other | 43 (100.0%) | 0 (0.0%) |
| Total | 1,068 (77.8%) | 304 (22.2%) |
Housing Structures by Number of Rooms in Gibson
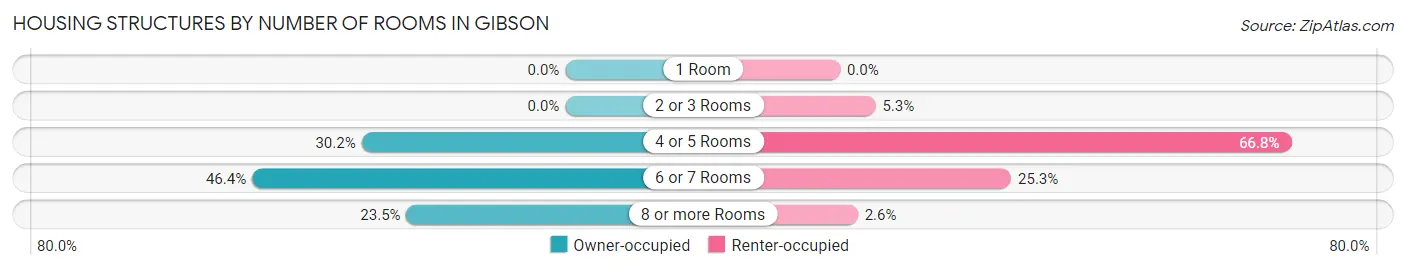
| Number of Rooms | Owner-occupied | Renter-occupied |
| 1 Room | 0 (0.0%) | 0 (0.0%) |
| 2 or 3 Rooms | 0 (0.0%) | 16 (5.3%) |
| 4 or 5 Rooms | 322 (30.1%) | 203 (66.8%) |
| 6 or 7 Rooms | 495 (46.4%) | 77 (25.3%) |
| 8 or more Rooms | 251 (23.5%) | 8 (2.6%) |
| Total | 1,068 (100.0%) | 304 (100.0%) |
Housing Structure by Heating Type in Gibson
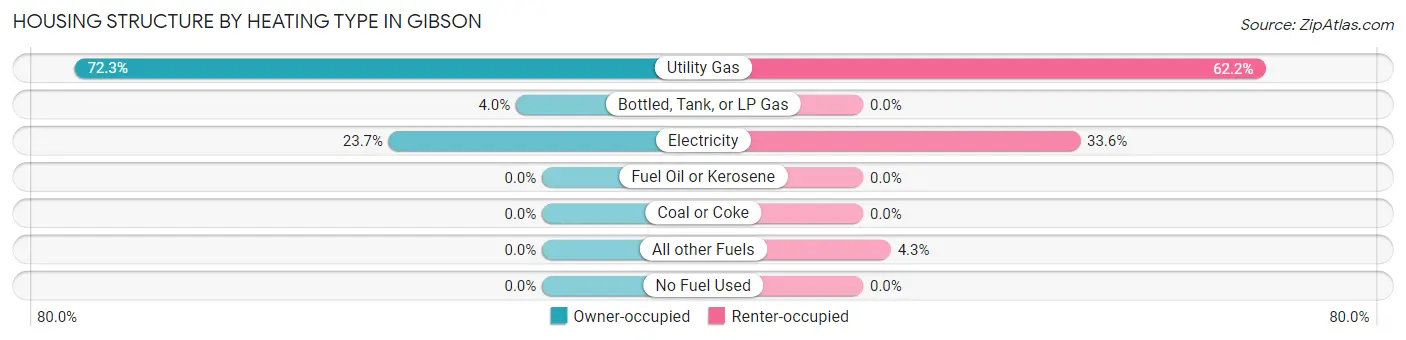
| Heating Type | Owner-occupied | Renter-occupied |
| Utility Gas | 772 (72.3%) | 189 (62.2%) |
| Bottled, Tank, or LP Gas | 43 (4.0%) | 0 (0.0%) |
| Electricity | 253 (23.7%) | 102 (33.6%) |
| Fuel Oil or Kerosene | 0 (0.0%) | 0 (0.0%) |
| Coal or Coke | 0 (0.0%) | 0 (0.0%) |
| All other Fuels | 0 (0.0%) | 13 (4.3%) |
| No Fuel Used | 0 (0.0%) | 0 (0.0%) |
| Total | 1,068 (100.0%) | 304 (100.0%) |
Household Vehicle Usage in Gibson
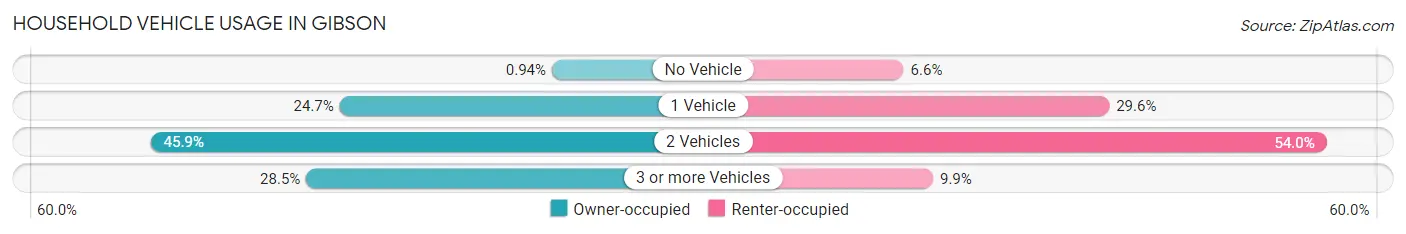
| Vehicles per Household | Owner-occupied | Renter-occupied |
| No Vehicle | 10 (0.9%) | 20 (6.6%) |
| 1 Vehicle | 264 (24.7%) | 90 (29.6%) |
| 2 Vehicles | 490 (45.9%) | 164 (53.9%) |
| 3 or more Vehicles | 304 (28.5%) | 30 (9.9%) |
| Total | 1,068 (100.0%) | 304 (100.0%) |
Real Estate & Mortgages in Gibson
Real Estate and Mortgage Overview in Gibson
| Characteristic | Without Mortgage | With Mortgage |
| Housing Units | 411 | 657 |
| Median Property Value | $140,300 | $159,500 |
| Median Household Income | $41,722 | $188 |
| Monthly Housing Costs | $391 | $0 |
| Real Estate Taxes | $556 | $18 |
Property Value by Mortgage Status in Gibson
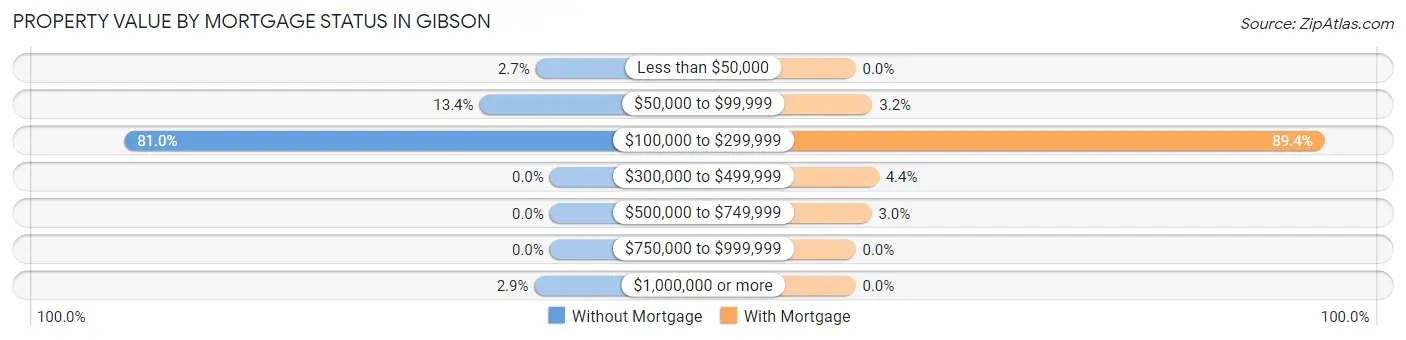
| Property Value | Without Mortgage | With Mortgage |
| Less than $50,000 | 11 (2.7%) | 0 (0.0%) |
| $50,000 to $99,999 | 55 (13.4%) | 21 (3.2%) |
| $100,000 to $299,999 | 333 (81.0%) | 587 (89.3%) |
| $300,000 to $499,999 | 0 (0.0%) | 29 (4.4%) |
| $500,000 to $749,999 | 0 (0.0%) | 20 (3.0%) |
| $750,000 to $999,999 | 0 (0.0%) | 0 (0.0%) |
| $1,000,000 or more | 12 (2.9%) | 0 (0.0%) |
| Total | 411 (100.0%) | 657 (100.0%) |
Household Income by Mortgage Status in Gibson
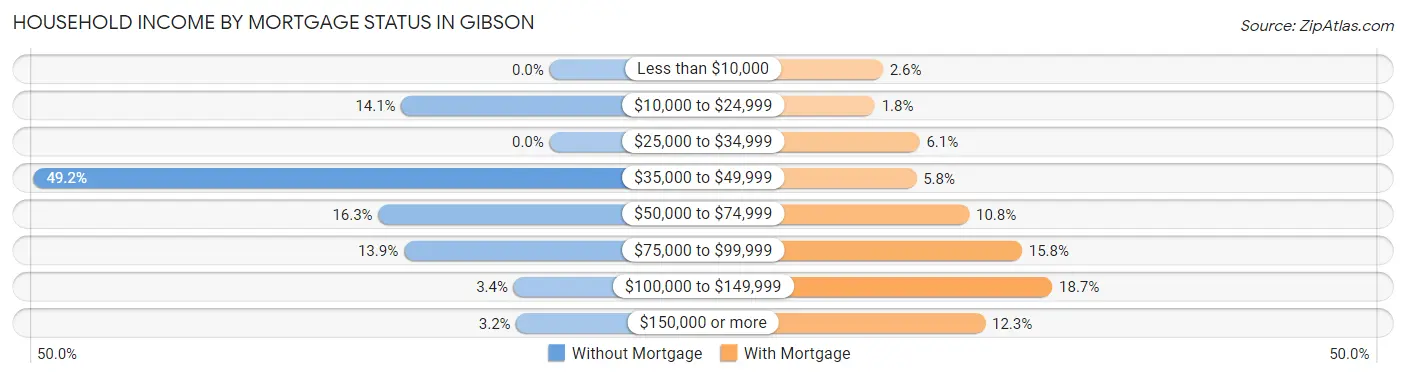
| Household Income | Without Mortgage | With Mortgage |
| Less than $10,000 | 0 (0.0%) | 17 (2.6%) |
| $10,000 to $24,999 | 58 (14.1%) | 12 (1.8%) |
| $25,000 to $34,999 | 0 (0.0%) | 40 (6.1%) |
| $35,000 to $49,999 | 202 (49.1%) | 38 (5.8%) |
| $50,000 to $74,999 | 67 (16.3%) | 71 (10.8%) |
| $75,000 to $99,999 | 57 (13.9%) | 104 (15.8%) |
| $100,000 to $149,999 | 14 (3.4%) | 123 (18.7%) |
| $150,000 or more | 13 (3.2%) | 81 (12.3%) |
| Total | 411 (100.0%) | 657 (100.0%) |
Property Value to Household Income Ratio in Gibson
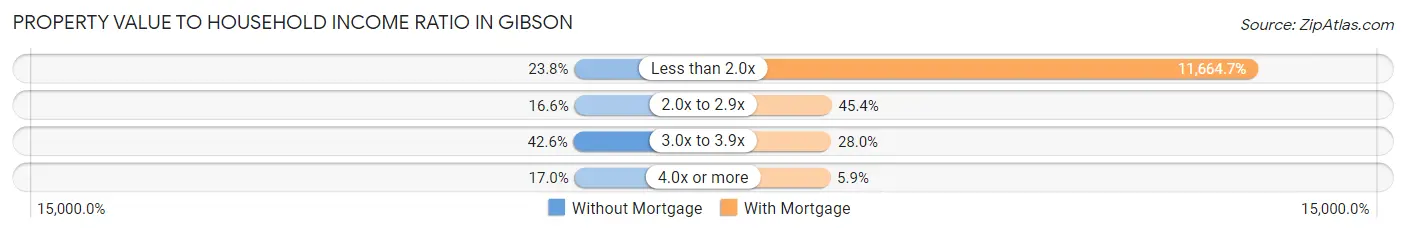
| Value-to-Income Ratio | Without Mortgage | With Mortgage |
| Less than 2.0x | 98 (23.8%) | 76,637 (11,664.7%) |
| 2.0x to 2.9x | 68 (16.6%) | 298 (45.4%) |
| 3.0x to 3.9x | 175 (42.6%) | 184 (28.0%) |
| 4.0x or more | 70 (17.0%) | 39 (5.9%) |
| Total | 411 (100.0%) | 657 (100.0%) |
Real Estate Taxes by Mortgage Status in Gibson
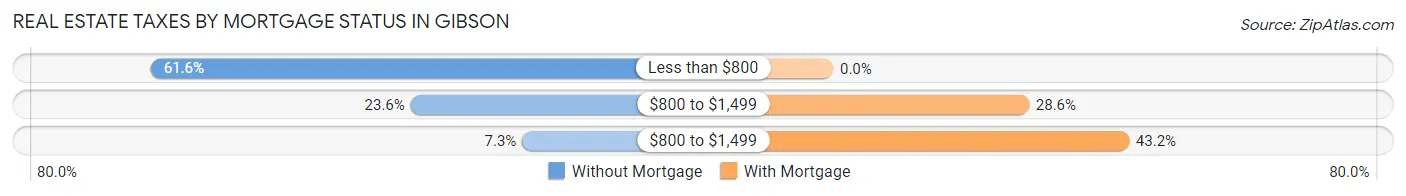
| Property Taxes | Without Mortgage | With Mortgage |
| Less than $800 | 253 (61.6%) | 0 (0.0%) |
| $800 to $1,499 | 97 (23.6%) | 188 (28.6%) |
| $800 to $1,499 | 30 (7.3%) | 284 (43.2%) |
| Total | 411 (100.0%) | 657 (100.0%) |
Health & Disability in Gibson
Health Insurance Coverage by Age in Gibson
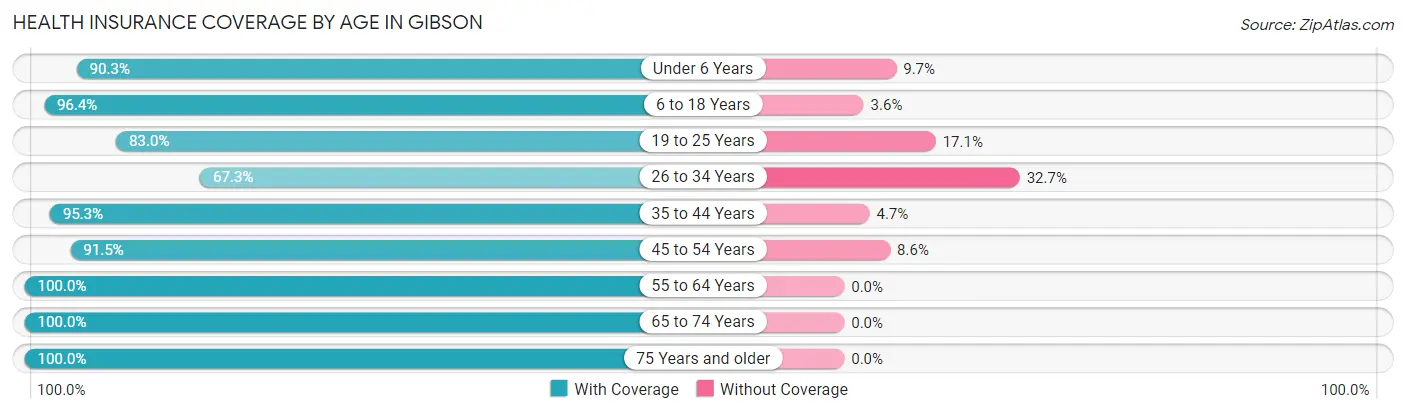
| Age Bracket | With Coverage | Without Coverage |
| Under 6 Years | 177 (90.3%) | 19 (9.7%) |
| 6 to 18 Years | 561 (96.4%) | 21 (3.6%) |
| 19 to 25 Years | 219 (83.0%) | 45 (17.1%) |
| 26 to 34 Years | 220 (67.3%) | 107 (32.7%) |
| 35 to 44 Years | 445 (95.3%) | 22 (4.7%) |
| 45 to 54 Years | 449 (91.4%) | 42 (8.6%) |
| 55 to 64 Years | 356 (100.0%) | 0 (0.0%) |
| 65 to 74 Years | 567 (100.0%) | 0 (0.0%) |
| 75 Years and older | 243 (100.0%) | 0 (0.0%) |
| Total | 3,237 (92.7%) | 256 (7.3%) |
Health Insurance Coverage by Citizenship Status in Gibson
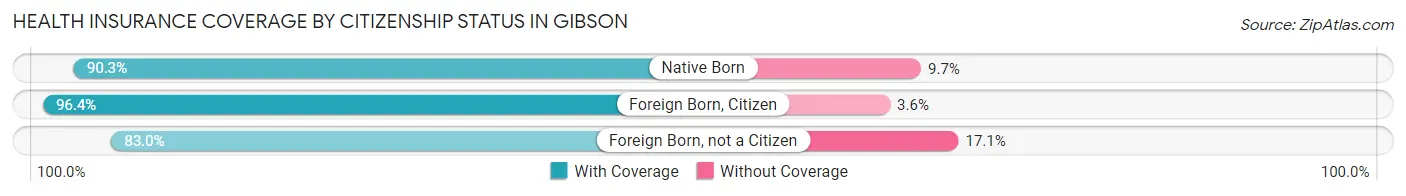
| Citizenship Status | With Coverage | Without Coverage |
| Native Born | 177 (90.3%) | 19 (9.7%) |
| Foreign Born, Citizen | 561 (96.4%) | 21 (3.6%) |
| Foreign Born, not a Citizen | 219 (83.0%) | 45 (17.1%) |
Health Insurance Coverage by Household Income in Gibson
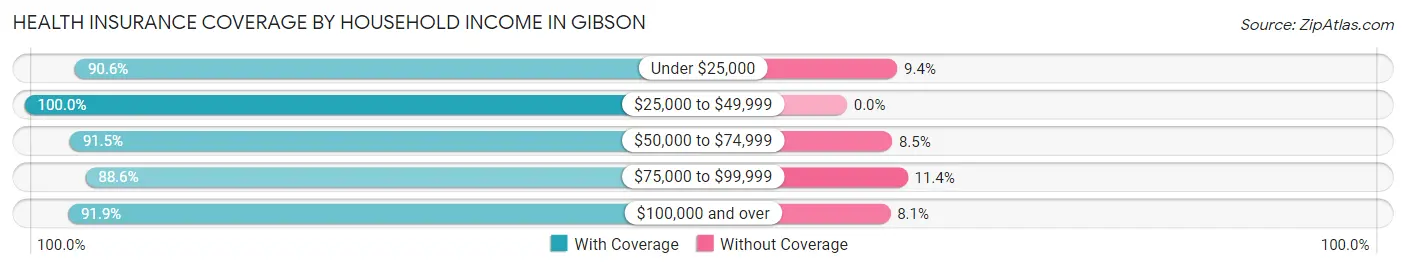
| Household Income | With Coverage | Without Coverage |
| Under $25,000 | 259 (90.6%) | 27 (9.4%) |
| $25,000 to $49,999 | 693 (100.0%) | 0 (0.0%) |
| $50,000 to $74,999 | 476 (91.5%) | 44 (8.5%) |
| $75,000 to $99,999 | 623 (88.6%) | 80 (11.4%) |
| $100,000 and over | 1,186 (91.9%) | 105 (8.1%) |
Public vs Private Health Insurance Coverage by Age in Gibson
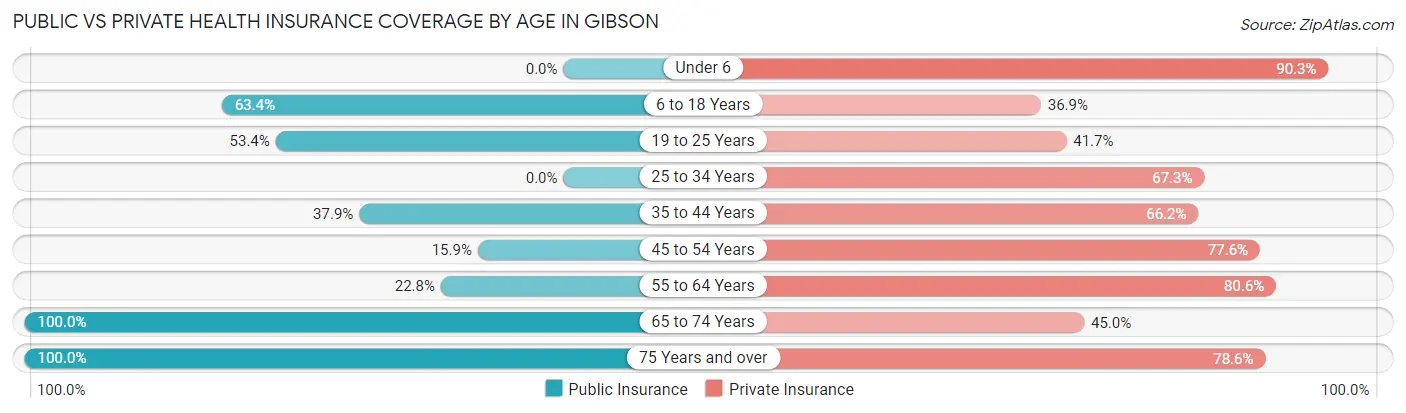
| Age Bracket | Public Insurance | Private Insurance |
| Under 6 | 0 (0.0%) | 177 (90.3%) |
| 6 to 18 Years | 369 (63.4%) | 215 (36.9%) |
| 19 to 25 Years | 141 (53.4%) | 110 (41.7%) |
| 25 to 34 Years | 0 (0.0%) | 220 (67.3%) |
| 35 to 44 Years | 177 (37.9%) | 309 (66.2%) |
| 45 to 54 Years | 78 (15.9%) | 381 (77.6%) |
| 55 to 64 Years | 81 (22.8%) | 287 (80.6%) |
| 65 to 74 Years | 567 (100.0%) | 255 (45.0%) |
| 75 Years and over | 243 (100.0%) | 191 (78.6%) |
| Total | 1,656 (47.4%) | 2,145 (61.4%) |
Disability Status by Sex by Age in Gibson
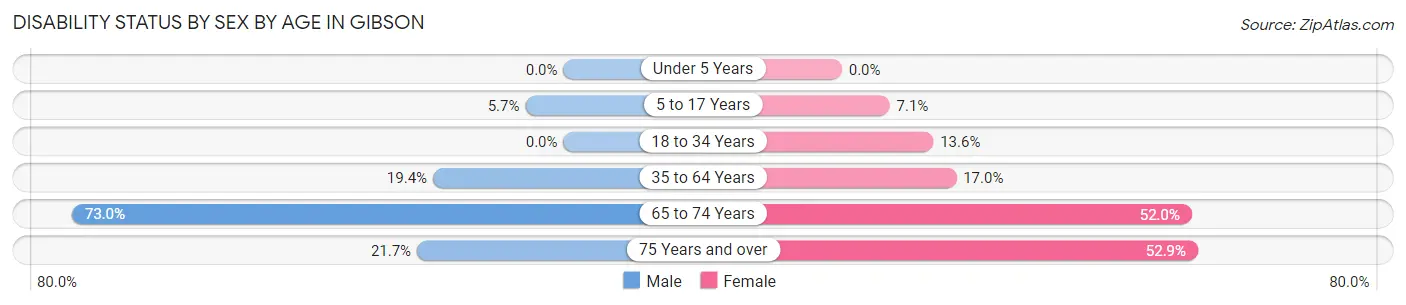
| Age Bracket | Male | Female |
| Under 5 Years | 0 (0.0%) | 0 (0.0%) |
| 5 to 17 Years | 16 (5.7%) | 23 (7.1%) |
| 18 to 34 Years | 0 (0.0%) | 41 (13.6%) |
| 35 to 64 Years | 136 (19.4%) | 104 (17.0%) |
| 65 to 74 Years | 154 (73.0%) | 185 (52.0%) |
| 75 Years and over | 15 (21.7%) | 92 (52.9%) |
Disability Class by Sex by Age in Gibson
Disability Class: Hearing Difficulty
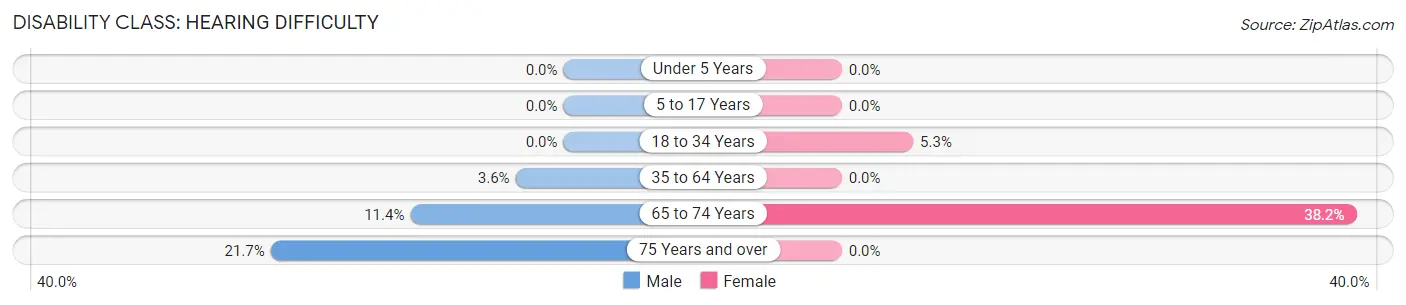
| Age Bracket | Male | Female |
| Under 5 Years | 0 (0.0%) | 0 (0.0%) |
| 5 to 17 Years | 0 (0.0%) | 0 (0.0%) |
| 18 to 34 Years | 0 (0.0%) | 16 (5.3%) |
| 35 to 64 Years | 25 (3.6%) | 0 (0.0%) |
| 65 to 74 Years | 24 (11.4%) | 136 (38.2%) |
| 75 Years and over | 15 (21.7%) | 0 (0.0%) |
Disability Class: Vision Difficulty
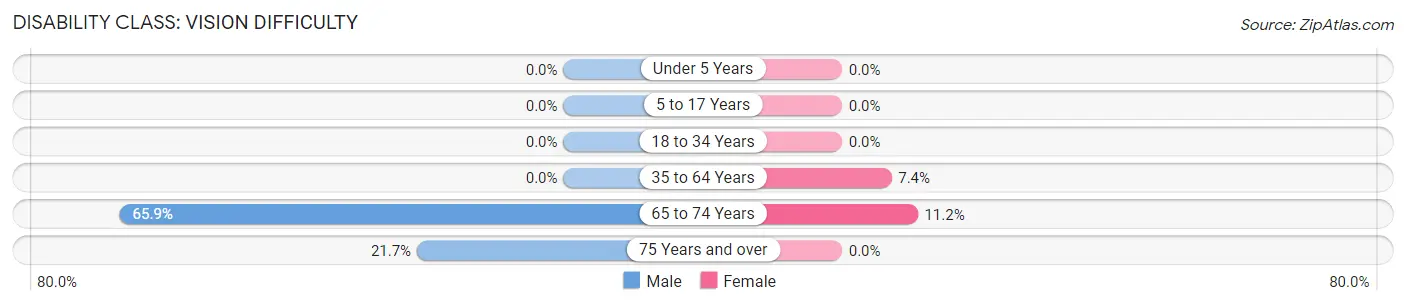
| Age Bracket | Male | Female |
| Under 5 Years | 0 (0.0%) | 0 (0.0%) |
| 5 to 17 Years | 0 (0.0%) | 0 (0.0%) |
| 18 to 34 Years | 0 (0.0%) | 0 (0.0%) |
| 35 to 64 Years | 0 (0.0%) | 45 (7.3%) |
| 65 to 74 Years | 139 (65.9%) | 40 (11.2%) |
| 75 Years and over | 15 (21.7%) | 0 (0.0%) |
Disability Class: Cognitive Difficulty
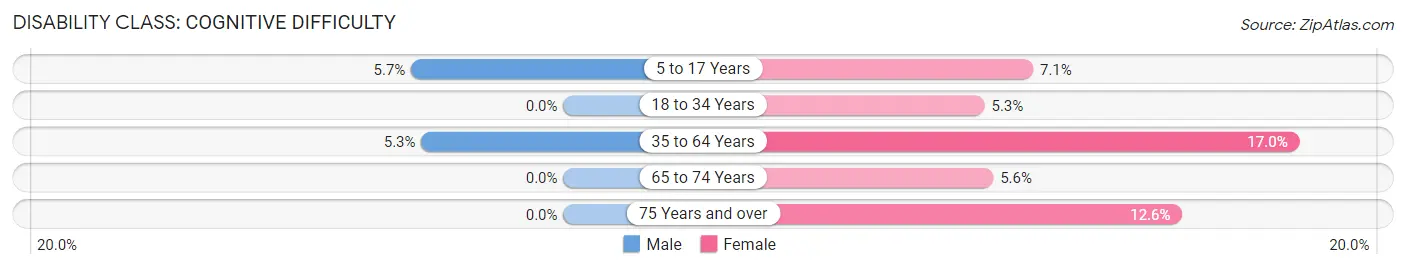
| Age Bracket | Male | Female |
| 5 to 17 Years | 16 (5.7%) | 23 (7.1%) |
| 18 to 34 Years | 0 (0.0%) | 16 (5.3%) |
| 35 to 64 Years | 37 (5.3%) | 104 (17.0%) |
| 65 to 74 Years | 0 (0.0%) | 20 (5.6%) |
| 75 Years and over | 0 (0.0%) | 22 (12.6%) |
Disability Class: Ambulatory Difficulty
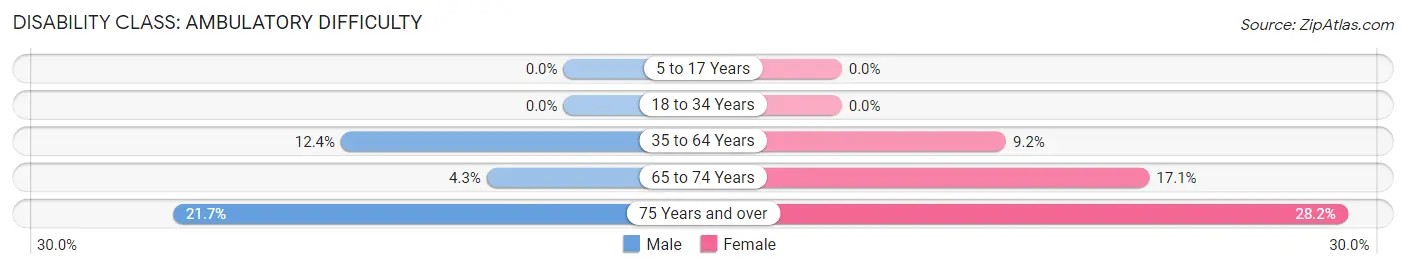
| Age Bracket | Male | Female |
| 5 to 17 Years | 0 (0.0%) | 0 (0.0%) |
| 18 to 34 Years | 0 (0.0%) | 0 (0.0%) |
| 35 to 64 Years | 87 (12.4%) | 56 (9.1%) |
| 65 to 74 Years | 9 (4.3%) | 61 (17.1%) |
| 75 Years and over | 15 (21.7%) | 49 (28.2%) |
Disability Class: Self-Care Difficulty
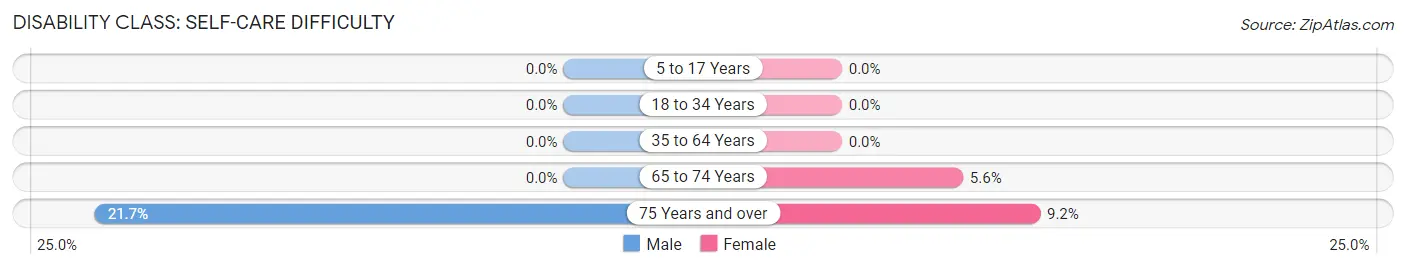
| Age Bracket | Male | Female |
| 5 to 17 Years | 0 (0.0%) | 0 (0.0%) |
| 18 to 34 Years | 0 (0.0%) | 0 (0.0%) |
| 35 to 64 Years | 0 (0.0%) | 0 (0.0%) |
| 65 to 74 Years | 0 (0.0%) | 20 (5.6%) |
| 75 Years and over | 15 (21.7%) | 16 (9.2%) |
Technology Access in Gibson
Computing Device Access in Gibson
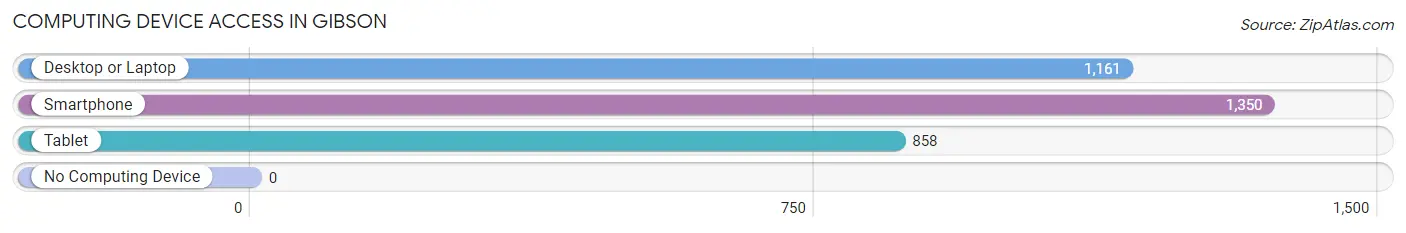
| Device Type | # Households | % Households |
| Desktop or Laptop | 1,161 | 84.6% |
| Smartphone | 1,350 | 98.4% |
| Tablet | 858 | 62.5% |
| No Computing Device | 0 | 0.0% |
| Total | 1,372 | 100.0% |
Internet Access in Gibson
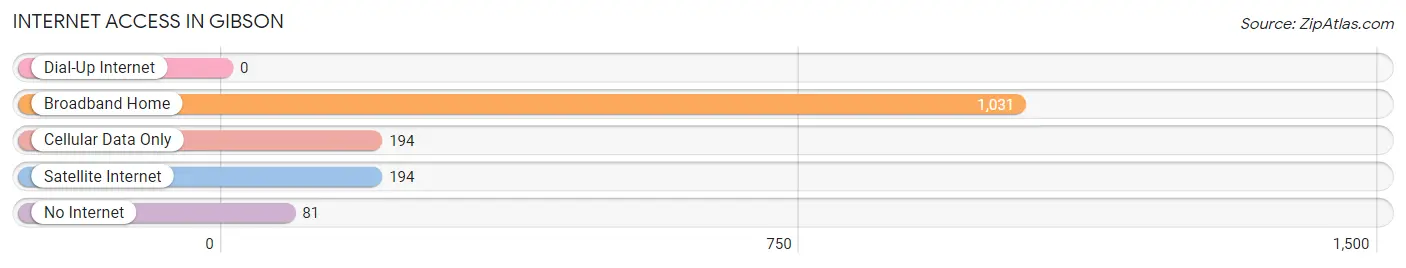
| Internet Type | # Households | % Households |
| Dial-Up Internet | 0 | 0.0% |
| Broadband Home | 1,031 | 75.1% |
| Cellular Data Only | 194 | 14.1% |
| Satellite Internet | 194 | 14.1% |
| No Internet | 81 | 5.9% |
| Total | 1,372 | 100.0% |
Gibson Summary
Gibson is a small town located in the northeast corner of Arkansas, in the foothills of the Ozark Mountains. It is situated in the Arkansas Delta region, which is known for its rich agricultural heritage. The town was founded in 1883 and has a population of approximately 1,000 people.
Geography
Gibson is located in the northeast corner of Arkansas, in the foothills of the Ozark Mountains. It is situated in the Arkansas Delta region, which is known for its rich agricultural heritage. The town is located on the banks of the White River, which is a major tributary of the Mississippi River. The town is surrounded by rolling hills and lush forests, making it a popular destination for outdoor recreation.
Economy
Gibson’s economy is largely based on agriculture. The town is home to several large farms, which produce a variety of crops, including cotton, soybeans, corn, and wheat. The town also has a thriving timber industry, with several sawmills located in the area. In addition, Gibson is home to several small businesses, including restaurants, retail stores, and service providers.
Demographics
Gibson is a predominantly white town, with a population of approximately 1,000 people. The median household income is $35,000, and the median age is 37. The town has a low unemployment rate, and the majority of the population is employed in the agricultural and timber industries.
Education
Gibson is served by the Cross County School District, which includes two elementary schools, one middle school, and one high school. The town also has a public library, which offers a variety of books, magazines, and other resources.
Conclusion
Gibson is a small town located in the northeast corner of Arkansas, in the foothills of the Ozark Mountains. It is situated in the Arkansas Delta region, which is known for its rich agricultural heritage. The town has a population of approximately 1,000 people, and its economy is largely based on agriculture and timber. Gibson is served by the Cross County School District, and it has a public library. The town is a popular destination for outdoor recreation, and it is a great place to live and work.
Common Questions
What is Per Capita Income in Gibson?
Per Capita income in Gibson is $30,853.
What is the Median Family Income in Gibson?
Median Family Income in Gibson is $75,938.
What is the Median Household income in Gibson?
Median Household Income in Gibson is $65,833.
What is Income or Wage Gap in Gibson?
Income or Wage Gap in Gibson is 46.9%.
Women in Gibson earn 53.1 cents for every dollar earned by a man.
What is Inequality or Gini Index in Gibson?
Inequality or Gini Index in Gibson is 0.35.
What is the Total Population of Gibson?
Total Population of Gibson is 3,515.
What is the Total Male Population of Gibson?
Total Male Population of Gibson is 1,669.
What is the Total Female Population of Gibson?
Total Female Population of Gibson is 1,846.
What is the Ratio of Males per 100 Females in Gibson?
There are 90.41 Males per 100 Females in Gibson.
What is the Ratio of Females per 100 Males in Gibson?
There are 110.61 Females per 100 Males in Gibson.
What is the Median Population Age in Gibson?
Median Population Age in Gibson is 41.4 Years.
What is the Average Family Size in Gibson
Average Family Size in Gibson is 3.1 People.
What is the Average Household Size in Gibson
Average Household Size in Gibson is 2.6 People.
How Large is the Labor Force in Gibson?
There are 1,748 People in the Labor Forcein in Gibson.
What is the Percentage of People in the Labor Force in Gibson?
61.0% of People are in the Labor Force in Gibson.
What is the Unemployment Rate in Gibson?
Unemployment Rate in Gibson is 8.2%.