Highfill, AR Map & Demographics
Highfill Map
Highfill Overview
$41,192
PER CAPITA INCOME
$95,114
AVG FAMILY INCOME
$96,989
AVG HOUSEHOLD INCOME
46.2%
WAGE / INCOME GAP [ % ]
53.8¢/ $1
WAGE / INCOME GAP [ $ ]
0.36
INEQUALITY / GINI INDEX
1,679
TOTAL POPULATION
949
MALE POPULATION
730
FEMALE POPULATION
130.00
MALES / 100 FEMALES
76.92
FEMALES / 100 MALES
32.1
MEDIAN AGE
3.2
AVG FAMILY SIZE
2.5
AVG HOUSEHOLD SIZE
990
LABOR FORCE [ PEOPLE ]
75.1%
PERCENT IN LABOR FORCE
0.7%
UNEMPLOYMENT RATE
Income in Highfill
Income Overview in Highfill
Per Capita Income in Highfill is $41,192, while median incomes of families and households are $95,114 and $96,989 respectively.
| Characteristic | Number | Measure |
| Per Capita Income | 1,679 | $41,192 |
| Median Family Income | 424 | $95,114 |
| Mean Family Income | 424 | $116,609 |
| Median Household Income | 655 | $96,989 |
| Mean Household Income | 655 | $107,145 |
| Income Deficit | 424 | $0 |
| Wage / Income Gap (%) | 1,679 | 46.24% |
| Wage / Income Gap ($) | 1,679 | 53.76¢ per $1 |
| Gini / Inequality Index | 1,679 | 0.36 |
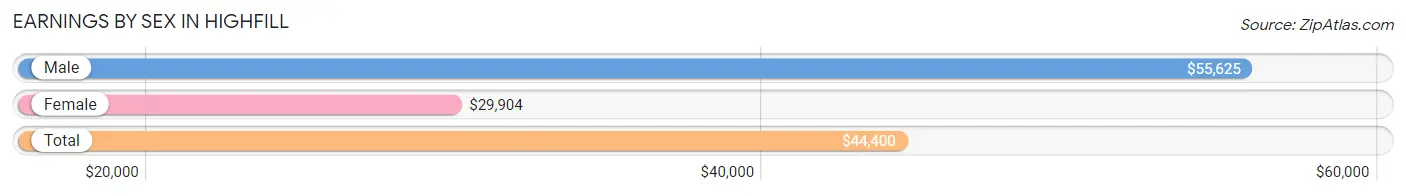
Earnings by Sex in Highfill
Average Earnings in Highfill are $44,400, $55,625 for men and $29,904 for women, a difference of 46.2%.
| Sex | Number | Average Earnings |
| Male | 637 (61.8%) | $55,625 |
| Female | 393 (38.2%) | $29,904 |
| Total | 1,030 (100.0%) | $44,400 |
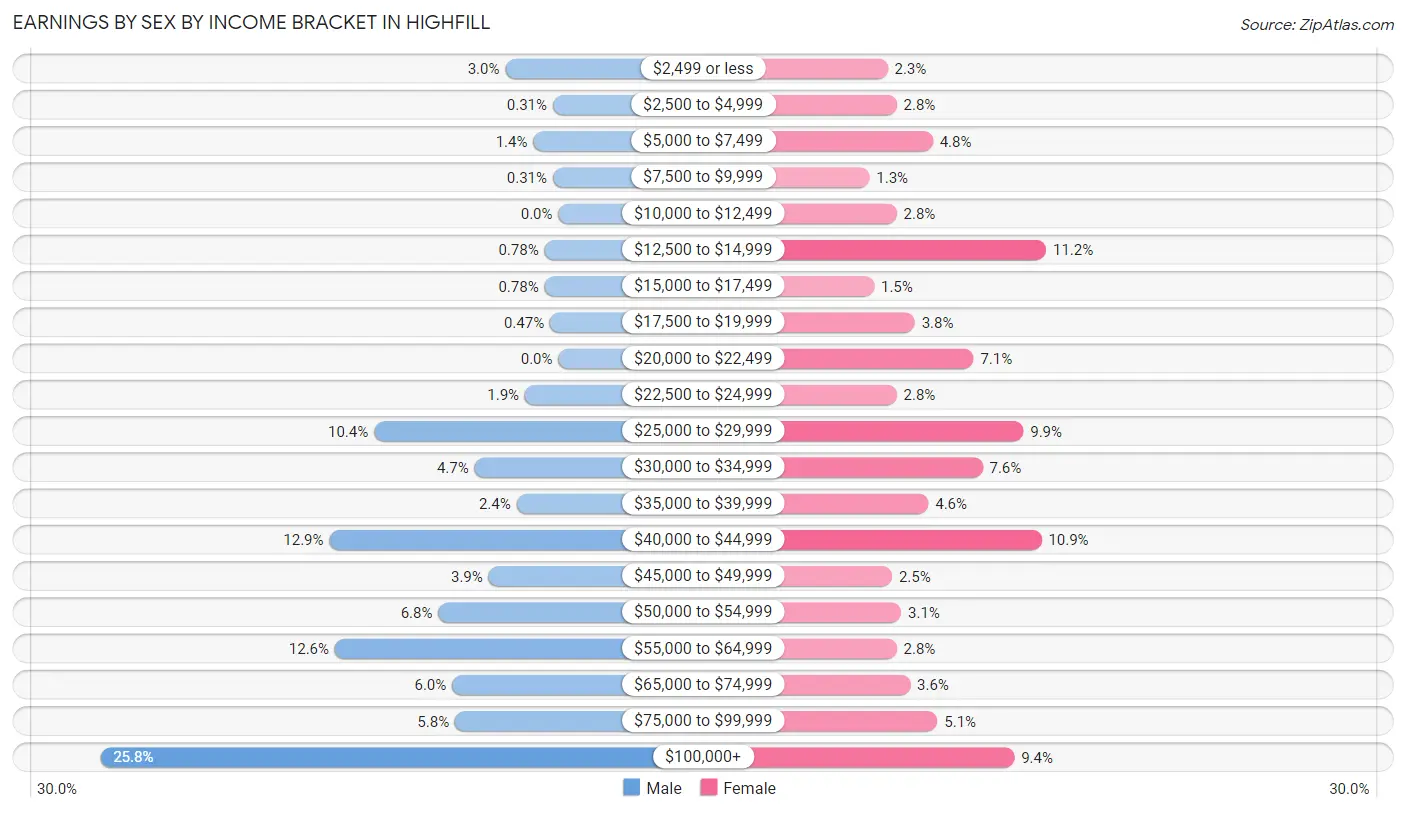
Earnings by Sex by Income Bracket in Highfill
The most common earnings brackets in Highfill are $100,000+ for men (164 | 25.8%) and $12,500 to $14,999 for women (44 | 11.2%).
| Income | Male | Female |
| $2,499 or less | 19 (3.0%) | 9 (2.3%) |
| $2,500 to $4,999 | 2 (0.3%) | 11 (2.8%) |
| $5,000 to $7,499 | 9 (1.4%) | 19 (4.8%) |
| $7,500 to $9,999 | 2 (0.3%) | 5 (1.3%) |
| $10,000 to $12,499 | 0 (0.0%) | 11 (2.8%) |
| $12,500 to $14,999 | 5 (0.8%) | 44 (11.2%) |
| $15,000 to $17,499 | 5 (0.8%) | 6 (1.5%) |
| $17,500 to $19,999 | 3 (0.5%) | 15 (3.8%) |
| $20,000 to $22,499 | 0 (0.0%) | 28 (7.1%) |
| $22,500 to $24,999 | 12 (1.9%) | 11 (2.8%) |
| $25,000 to $29,999 | 66 (10.4%) | 39 (9.9%) |
| $30,000 to $34,999 | 30 (4.7%) | 30 (7.6%) |
| $35,000 to $39,999 | 15 (2.4%) | 18 (4.6%) |
| $40,000 to $44,999 | 82 (12.9%) | 43 (10.9%) |
| $45,000 to $49,999 | 25 (3.9%) | 10 (2.5%) |
| $50,000 to $54,999 | 43 (6.8%) | 12 (3.0%) |
| $55,000 to $64,999 | 80 (12.6%) | 11 (2.8%) |
| $65,000 to $74,999 | 38 (6.0%) | 14 (3.6%) |
| $75,000 to $99,999 | 37 (5.8%) | 20 (5.1%) |
| $100,000+ | 164 (25.8%) | 37 (9.4%) |
| Total | 637 (100.0%) | 393 (100.0%) |
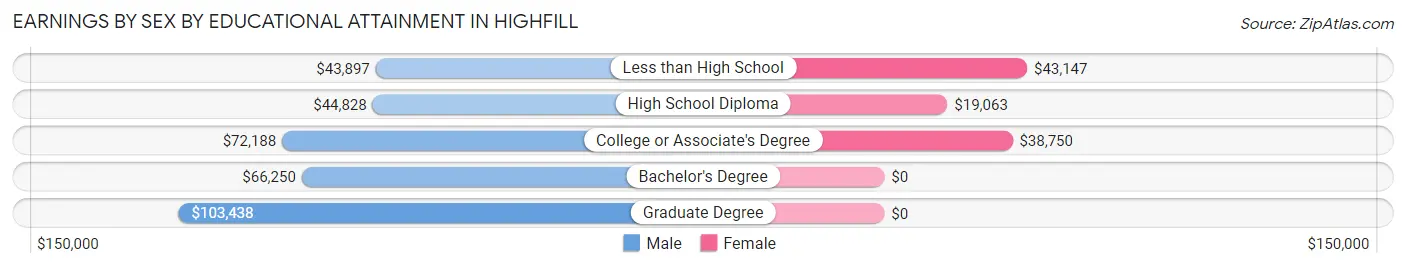
Earnings by Sex by Educational Attainment in Highfill
Average earnings in Highfill are $58,214 for men and $33,750 for women, a difference of 42.0%. Men with an educational attainment of graduate degree enjoy the highest average annual earnings of $103,438, while those with less than high school education earn the least with $43,897. Women with an educational attainment of less than high school earn the most with the average annual earnings of $43,147, while those with high school diploma education have the smallest earnings of $19,063.
| Educational Attainment | Male Income | Female Income |
| Less than High School | $43,897 | $43,147 |
| High School Diploma | $44,828 | $19,063 |
| College or Associate's Degree | $72,188 | $38,750 |
| Bachelor's Degree | $66,250 | $0 |
| Graduate Degree | $103,438 | $0 |
| Total | $58,214 | $33,750 |
Family Income in Highfill
Family Income Brackets in Highfill
According to the Highfill family income data, there are 109 families falling into the $100,000 to $149,999 income range, which is the most common income bracket and makes up 25.7% of all families. Conversely, the $10,000 to $14,999 income bracket is the least frequent group with only 3 families (0.7%) belonging to this category.
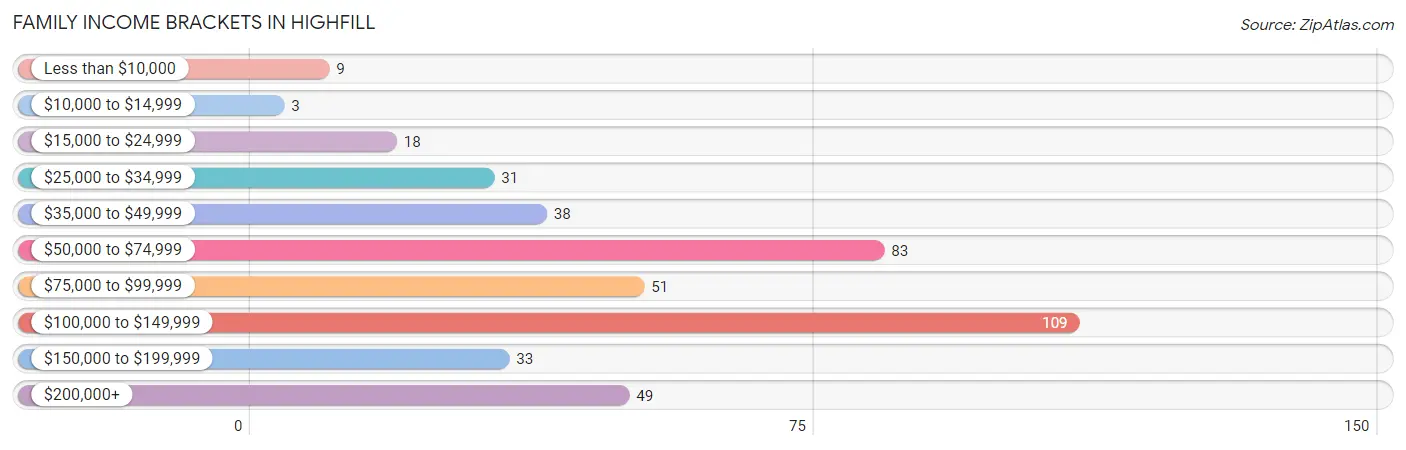
| Income Bracket | # Families | % Families |
| Less than $10,000 | 9 | 2.1% |
| $10,000 to $14,999 | 3 | 0.7% |
| $15,000 to $24,999 | 18 | 4.2% |
| $25,000 to $34,999 | 31 | 7.3% |
| $35,000 to $49,999 | 38 | 9.0% |
| $50,000 to $74,999 | 83 | 19.6% |
| $75,000 to $99,999 | 51 | 12.0% |
| $100,000 to $149,999 | 109 | 25.7% |
| $150,000 to $199,999 | 33 | 7.8% |
| $200,000+ | 49 | 11.6% |
Family Income by Famaliy Size in Highfill
4-person families (117 | 27.6%) account for the highest median family income in Highfill with $114,750 per family, while 2-person families (189 | 44.6%) have the highest median income of $36,736 per family member.
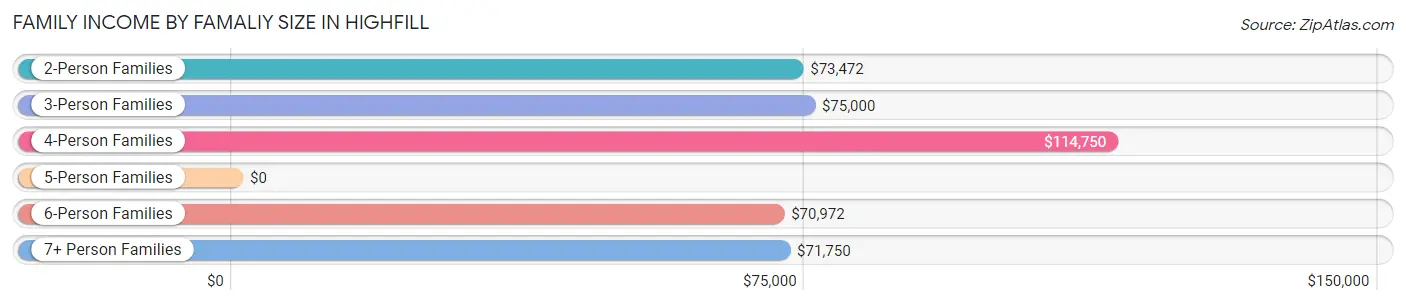
| Income Bracket | # Families | Median Income |
| 2-Person Families | 189 (44.6%) | $73,472 |
| 3-Person Families | 50 (11.8%) | $75,000 |
| 4-Person Families | 117 (27.6%) | $114,750 |
| 5-Person Families | 23 (5.4%) | $0 |
| 6-Person Families | 17 (4.0%) | $70,972 |
| 7+ Person Families | 28 (6.6%) | $71,750 |
| Total | 424 (100.0%) | $95,114 |
Family Income by Number of Earners in Highfill
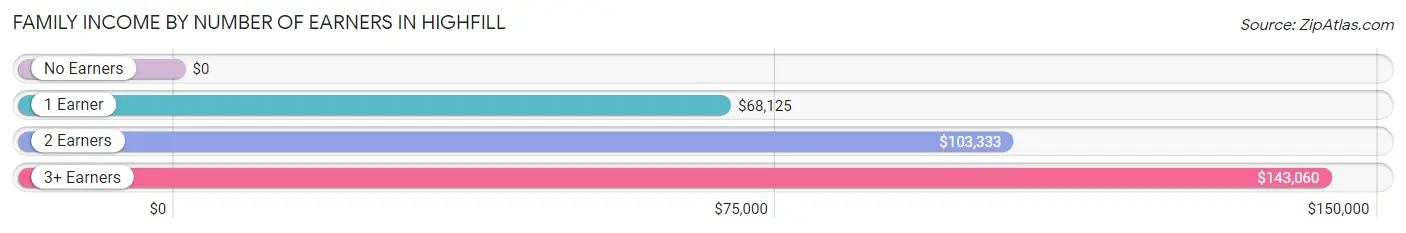
| Number of Earners | # Families | Median Income |
| No Earners | 33 (7.8%) | $0 |
| 1 Earner | 146 (34.4%) | $68,125 |
| 2 Earners | 196 (46.2%) | $103,333 |
| 3+ Earners | 49 (11.6%) | $143,060 |
| Total | 424 (100.0%) | $95,114 |
Household Income in Highfill
Household Income Brackets in Highfill
With 230 households falling in the category, the $100,000 to $149,999 income range is the most frequent in Highfill, accounting for 35.1% of all households. In contrast, only 3 households (0.5%) fall into the $10,000 to $14,999 income bracket, making it the least populous group.
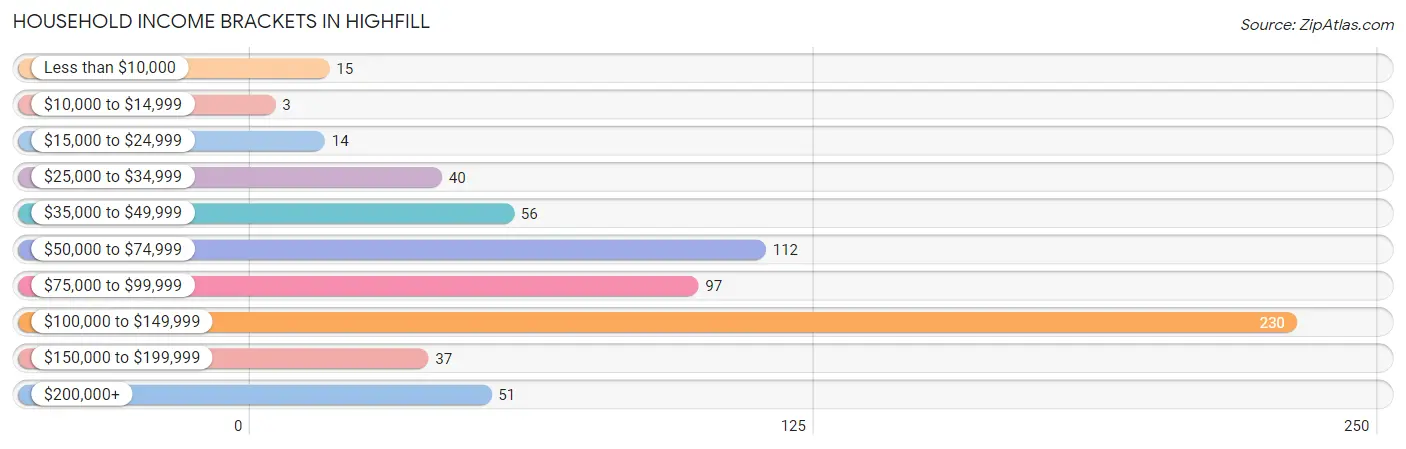
| Income Bracket | # Households | % Households |
| Less than $10,000 | 15 | 2.3% |
| $10,000 to $14,999 | 3 | 0.5% |
| $15,000 to $24,999 | 14 | 2.1% |
| $25,000 to $34,999 | 40 | 6.1% |
| $35,000 to $49,999 | 56 | 8.5% |
| $50,000 to $74,999 | 112 | 17.1% |
| $75,000 to $99,999 | 97 | 14.8% |
| $100,000 to $149,999 | 230 | 35.1% |
| $150,000 to $199,999 | 37 | 5.6% |
| $200,000+ | 51 | 7.8% |
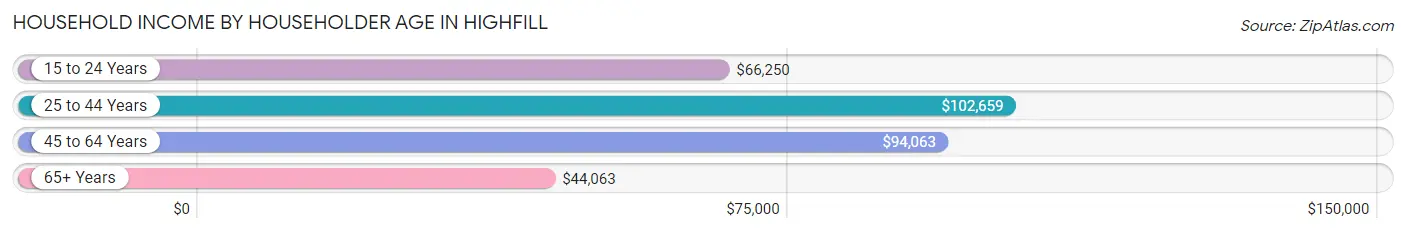
Household Income by Householder Age in Highfill
The median household income in Highfill is $96,989, with the highest median household income of $102,659 found in the 25 to 44 years age bracket for the primary householder. A total of 352 households (53.7%) fall into this category. Meanwhile, the 65+ years age bracket for the primary householder has the lowest median household income of $44,063, with 83 households (12.7%) in this group.
| Income Bracket | # Households | Median Income |
| 15 to 24 Years | 13 (2.0%) | $66,250 |
| 25 to 44 Years | 352 (53.7%) | $102,659 |
| 45 to 64 Years | 207 (31.6%) | $94,063 |
| 65+ Years | 83 (12.7%) | $44,063 |
| Total | 655 (100.0%) | $96,989 |
Poverty in Highfill
Income Below Poverty by Sex and Age in Highfill
With 5.0% poverty level for males and 8.2% for females among the residents of Highfill, 12 to 14 year old males and 12 to 14 year old females are the most vulnerable to poverty, with 11 males (20.7%) and 7 females (46.7%) in their respective age groups living below the poverty level.
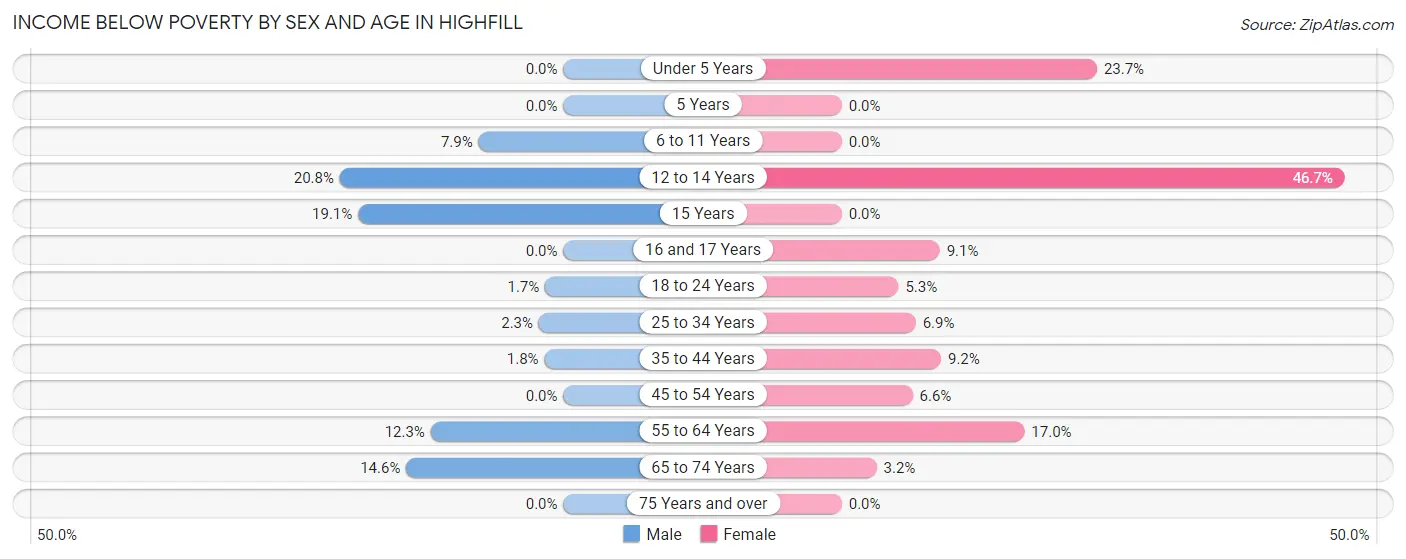
| Age Bracket | Male | Female |
| Under 5 Years | 0 (0.0%) | 9 (23.7%) |
| 5 Years | 0 (0.0%) | 0 (0.0%) |
| 6 to 11 Years | 7 (7.9%) | 0 (0.0%) |
| 12 to 14 Years | 11 (20.7%) | 7 (46.7%) |
| 15 Years | 4 (19.1%) | 0 (0.0%) |
| 16 and 17 Years | 0 (0.0%) | 2 (9.1%) |
| 18 to 24 Years | 1 (1.7%) | 2 (5.3%) |
| 25 to 34 Years | 6 (2.3%) | 12 (6.9%) |
| 35 to 44 Years | 3 (1.8%) | 7 (9.2%) |
| 45 to 54 Years | 0 (0.0%) | 9 (6.6%) |
| 55 to 64 Years | 8 (12.3%) | 10 (17.0%) |
| 65 to 74 Years | 7 (14.6%) | 2 (3.2%) |
| 75 Years and over | 0 (0.0%) | 0 (0.0%) |
| Total | 47 (5.0%) | 60 (8.2%) |
Income Above Poverty by Sex and Age in Highfill
According to the poverty statistics in Highfill, males aged under 5 years and females aged 5 years are the age groups that are most secure financially, with 100.0% of males and 100.0% of females in these age groups living above the poverty line.
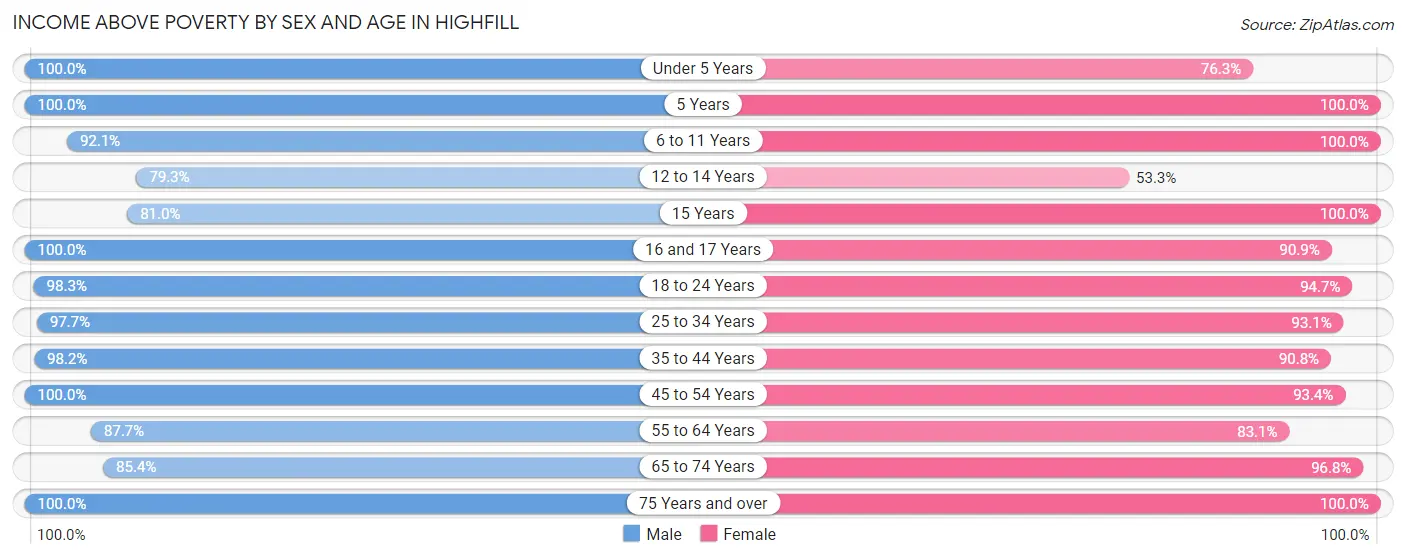
| Age Bracket | Male | Female |
| Under 5 Years | 41 (100.0%) | 29 (76.3%) |
| 5 Years | 2 (100.0%) | 7 (100.0%) |
| 6 to 11 Years | 82 (92.1%) | 90 (100.0%) |
| 12 to 14 Years | 42 (79.2%) | 8 (53.3%) |
| 15 Years | 17 (80.9%) | 4 (100.0%) |
| 16 and 17 Years | 16 (100.0%) | 20 (90.9%) |
| 18 to 24 Years | 58 (98.3%) | 36 (94.7%) |
| 25 to 34 Years | 258 (97.7%) | 163 (93.1%) |
| 35 to 44 Years | 167 (98.2%) | 69 (90.8%) |
| 45 to 54 Years | 98 (100.0%) | 128 (93.4%) |
| 55 to 64 Years | 57 (87.7%) | 49 (83.1%) |
| 65 to 74 Years | 41 (85.4%) | 60 (96.8%) |
| 75 Years and over | 21 (100.0%) | 6 (100.0%) |
| Total | 900 (95.0%) | 669 (91.8%) |
Income Below Poverty Among Married-Couple Families in Highfill
The poverty statistics for married-couple families in Highfill show that 4.6% or 16 of the total 345 families live below the poverty line. Families with 3 or 4 children have the highest poverty rate of 7.0%, comprising of 3 families. On the other hand, families with no children have the lowest poverty rate of 3.7%, which includes 7 families.
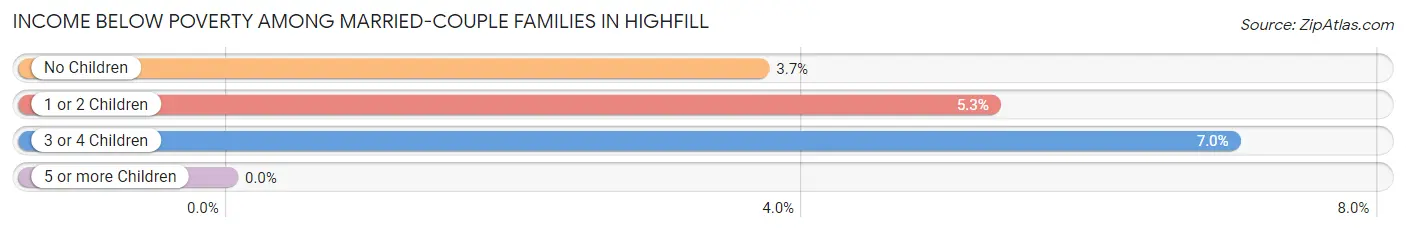
| Children | Above Poverty | Below Poverty |
| No Children | 182 (96.3%) | 7 (3.7%) |
| 1 or 2 Children | 107 (94.7%) | 6 (5.3%) |
| 3 or 4 Children | 40 (93.0%) | 3 (7.0%) |
| 5 or more Children | 0 (0.0%) | 0 (0.0%) |
| Total | 329 (95.4%) | 16 (4.6%) |
Income Below Poverty Among Single-Parent Households in Highfill
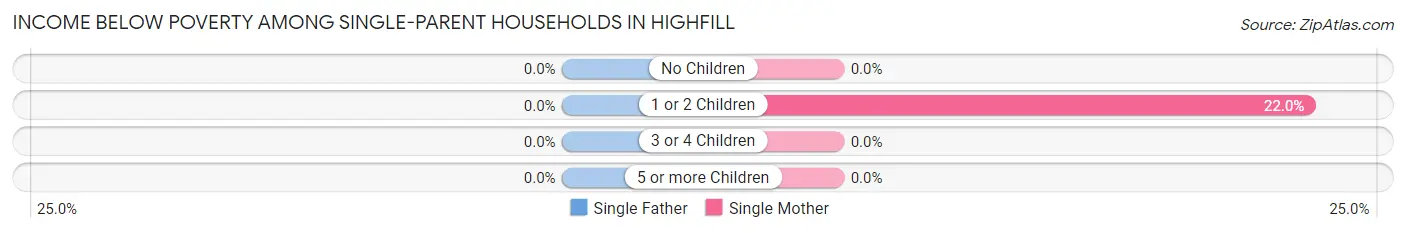
| Children | Single Father | Single Mother |
| No Children | 0 (0.0%) | 0 (0.0%) |
| 1 or 2 Children | 0 (0.0%) | 11 (22.0%) |
| 3 or 4 Children | 0 (0.0%) | 0 (0.0%) |
| 5 or more Children | 0 (0.0%) | 0 (0.0%) |
| Total | 0 (0.0%) | 11 (19.3%) |
Income Below Poverty Among Married-Couple vs Single-Parent Households in Highfill
The poverty data for Highfill shows that 16 of the married-couple family households (4.6%) and 11 of the single-parent households (13.9%) are living below the poverty level. Within the married-couple family households, those with 3 or 4 children have the highest poverty rate, with 3 households (7.0%) falling below the poverty line. Among the single-parent households, those with 1 or 2 children have the highest poverty rate, with 11 household (18.6%) living below poverty.
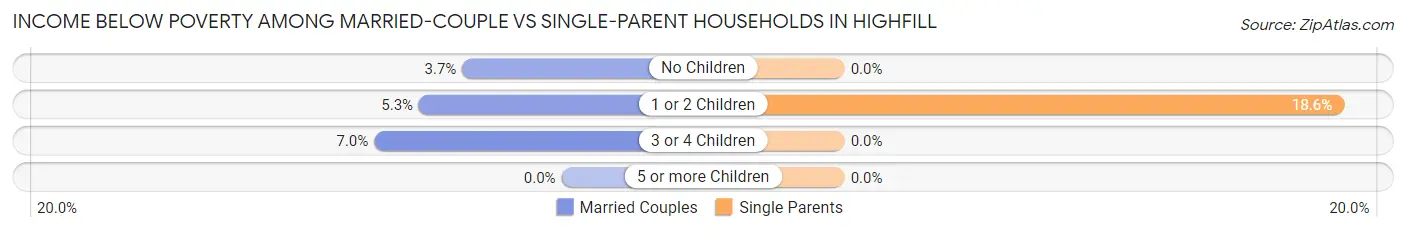
| Children | Married-Couple Families | Single-Parent Households |
| No Children | 7 (3.7%) | 0 (0.0%) |
| 1 or 2 Children | 6 (5.3%) | 11 (18.6%) |
| 3 or 4 Children | 3 (7.0%) | 0 (0.0%) |
| 5 or more Children | 0 (0.0%) | 0 (0.0%) |
| Total | 16 (4.6%) | 11 (13.9%) |
Race in Highfill
The most populous races in Highfill are White / Caucasian (1,406 | 83.7%), Two or more Races (157 | 9.3%), and Hispanic or Latino (107 | 6.4%).
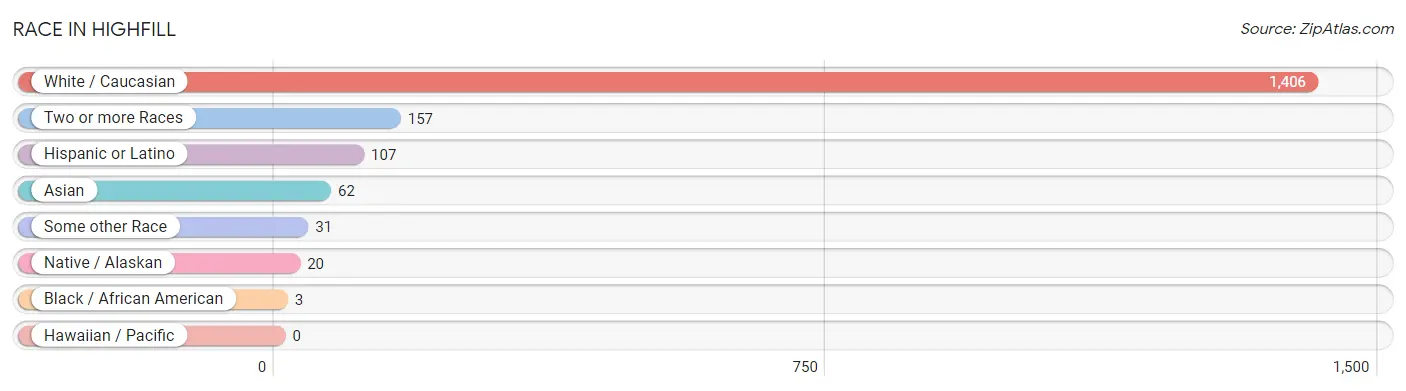
| Race | # Population | % Population |
| Asian | 62 | 3.7% |
| Black / African American | 3 | 0.2% |
| Hawaiian / Pacific | 0 | 0.0% |
| Hispanic or Latino | 107 | 6.4% |
| Native / Alaskan | 20 | 1.2% |
| White / Caucasian | 1,406 | 83.7% |
| Two or more Races | 157 | 9.3% |
| Some other Race | 31 | 1.8% |
| Total | 1,679 | 100.0% |
Ancestry in Highfill
The most populous ancestries reported in Highfill are German (341 | 20.3%), English (241 | 14.3%), Irish (222 | 13.2%), American (82 | 4.9%), and Central American (64 | 3.8%), together accounting for 56.6% of all Highfill residents.
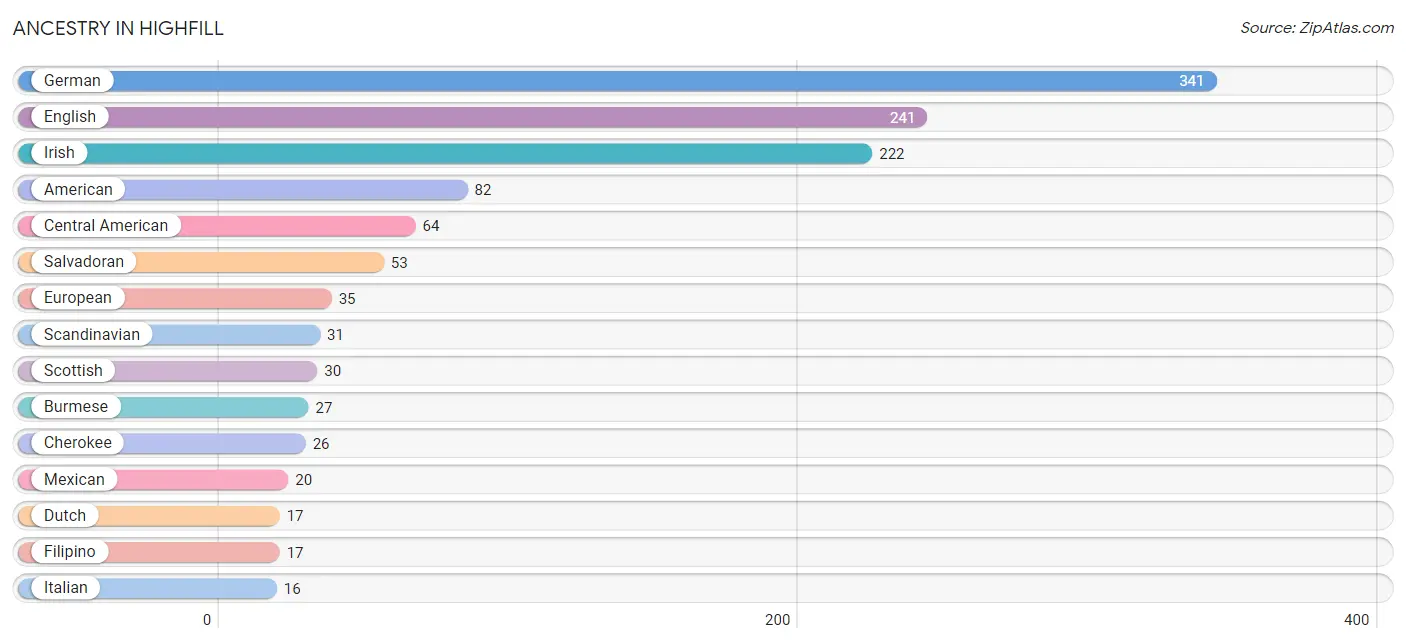
| Ancestry | # Population | % Population |
| American | 82 | 4.9% |
| Bhutanese | 4 | 0.2% |
| British | 1 | 0.1% |
| Burmese | 27 | 1.6% |
| Central American | 64 | 3.8% |
| Cherokee | 26 | 1.5% |
| Choctaw | 15 | 0.9% |
| Creek | 12 | 0.7% |
| Cuban | 3 | 0.2% |
| Danish | 7 | 0.4% |
| Dutch | 17 | 1.0% |
| Ecuadorian | 10 | 0.6% |
| English | 241 | 14.3% |
| European | 35 | 2.1% |
| Filipino | 17 | 1.0% |
| French | 12 | 0.7% |
| German | 341 | 20.3% |
| Guamanian / Chamorro | 1 | 0.1% |
| Guatemalan | 11 | 0.7% |
| Hungarian | 2 | 0.1% |
| Indonesian | 12 | 0.7% |
| Irish | 222 | 13.2% |
| Italian | 16 | 0.9% |
| Korean | 10 | 0.6% |
| Malaysian | 5 | 0.3% |
| Mexican | 20 | 1.2% |
| Northern European | 2 | 0.1% |
| Norwegian | 9 | 0.5% |
| Polish | 6 | 0.4% |
| Salvadoran | 53 | 3.2% |
| Scandinavian | 31 | 1.8% |
| Scotch-Irish | 5 | 0.3% |
| Scottish | 30 | 1.8% |
| Slavic | 4 | 0.2% |
| South American | 10 | 0.6% |
| Spaniard | 3 | 0.2% |
| Spanish | 7 | 0.4% |
| Swedish | 3 | 0.2% |
| Welsh | 12 | 0.7% | View All 39 Rows |
Immigrants in Highfill
The most numerous immigrant groups reported in Highfill came from Asia (47 | 2.8%), Latin America (35 | 2.1%), Central America (32 | 1.9%), Eastern Asia (26 | 1.5%), and El Salvador (21 | 1.3%), together accounting for 9.6% of all Highfill residents.
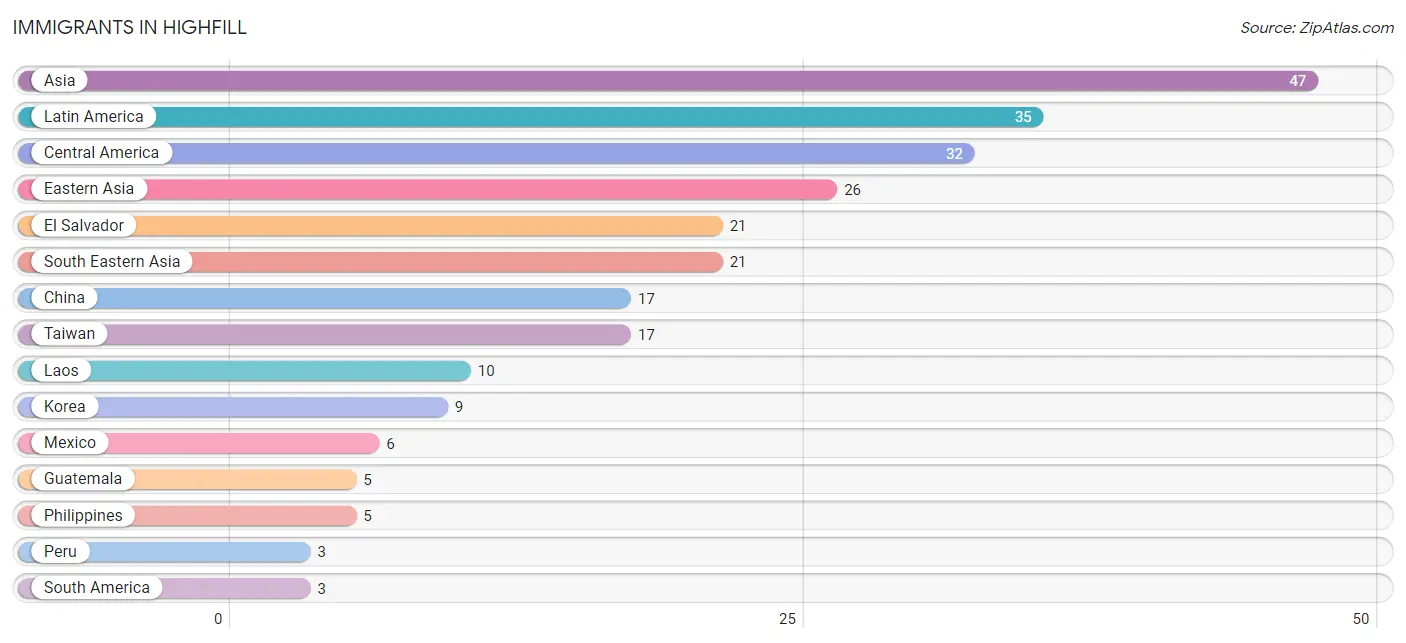
| Immigration Origin | # Population | % Population |
| Asia | 47 | 2.8% |
| Central America | 32 | 1.9% |
| China | 17 | 1.0% |
| Eastern Asia | 26 | 1.5% |
| El Salvador | 21 | 1.3% |
| Guatemala | 5 | 0.3% |
| Korea | 9 | 0.5% |
| Laos | 10 | 0.6% |
| Latin America | 35 | 2.1% |
| Mexico | 6 | 0.4% |
| Peru | 3 | 0.2% |
| Philippines | 5 | 0.3% |
| South America | 3 | 0.2% |
| South Eastern Asia | 21 | 1.3% |
| Taiwan | 17 | 1.0% | View All 15 Rows |
Sex and Age in Highfill
Sex and Age in Highfill
The most populous age groups in Highfill are 30 to 34 Years (164 | 17.3%) for men and 25 to 29 Years (112 | 15.3%) for women.
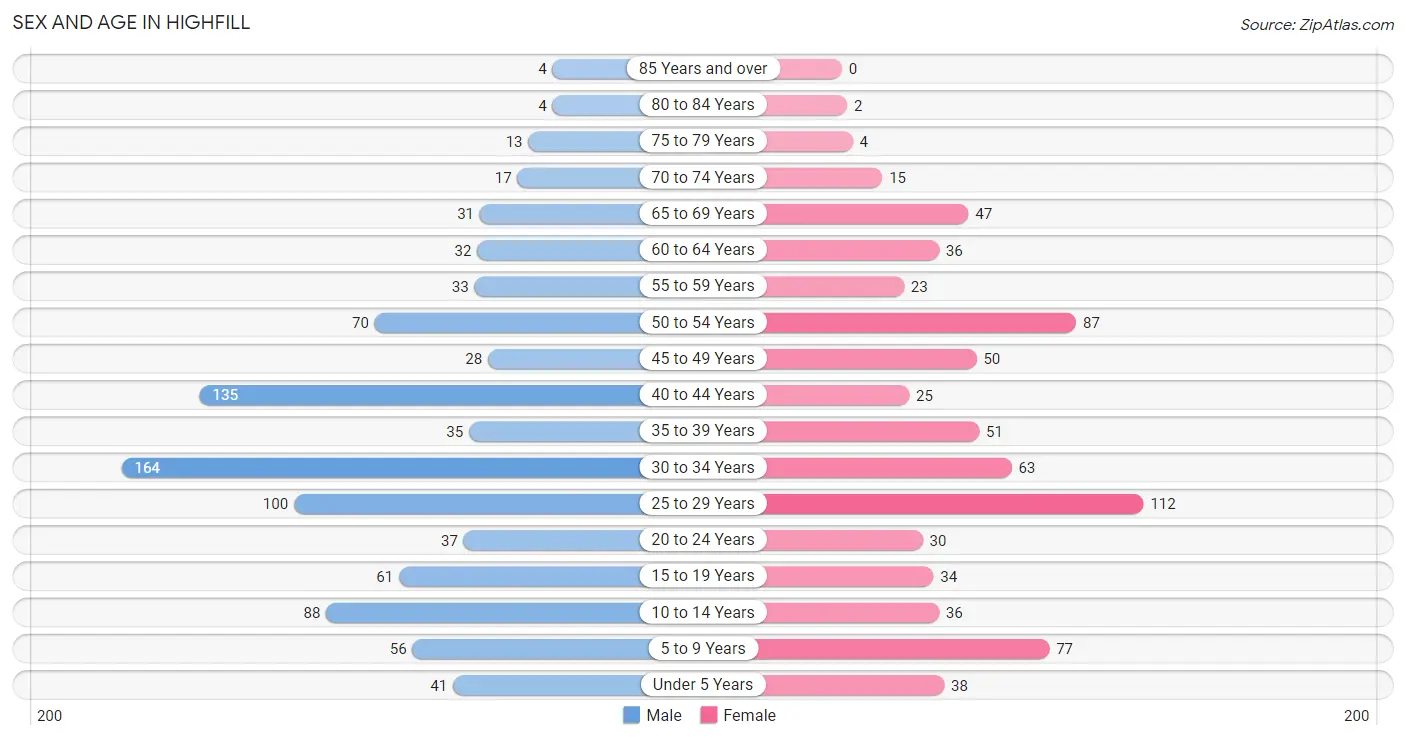
| Age Bracket | Male | Female |
| Under 5 Years | 41 (4.3%) | 38 (5.2%) |
| 5 to 9 Years | 56 (5.9%) | 77 (10.5%) |
| 10 to 14 Years | 88 (9.3%) | 36 (4.9%) |
| 15 to 19 Years | 61 (6.4%) | 34 (4.7%) |
| 20 to 24 Years | 37 (3.9%) | 30 (4.1%) |
| 25 to 29 Years | 100 (10.5%) | 112 (15.3%) |
| 30 to 34 Years | 164 (17.3%) | 63 (8.6%) |
| 35 to 39 Years | 35 (3.7%) | 51 (7.0%) |
| 40 to 44 Years | 135 (14.2%) | 25 (3.4%) |
| 45 to 49 Years | 28 (2.9%) | 50 (6.9%) |
| 50 to 54 Years | 70 (7.4%) | 87 (11.9%) |
| 55 to 59 Years | 33 (3.5%) | 23 (3.2%) |
| 60 to 64 Years | 32 (3.4%) | 36 (4.9%) |
| 65 to 69 Years | 31 (3.3%) | 47 (6.4%) |
| 70 to 74 Years | 17 (1.8%) | 15 (2.1%) |
| 75 to 79 Years | 13 (1.4%) | 4 (0.5%) |
| 80 to 84 Years | 4 (0.4%) | 2 (0.3%) |
| 85 Years and over | 4 (0.4%) | 0 (0.0%) |
| Total | 949 (100.0%) | 730 (100.0%) |
Families and Households in Highfill
Median Family Size in Highfill
The median family size in Highfill is 3.22 persons per family, with single male/father families (22 | 5.2%) accounting for the largest median family size of 3.27 persons per family. On the other hand, single female/mother families (57 | 13.4%) represent the smallest median family size with 3.00 persons per family.
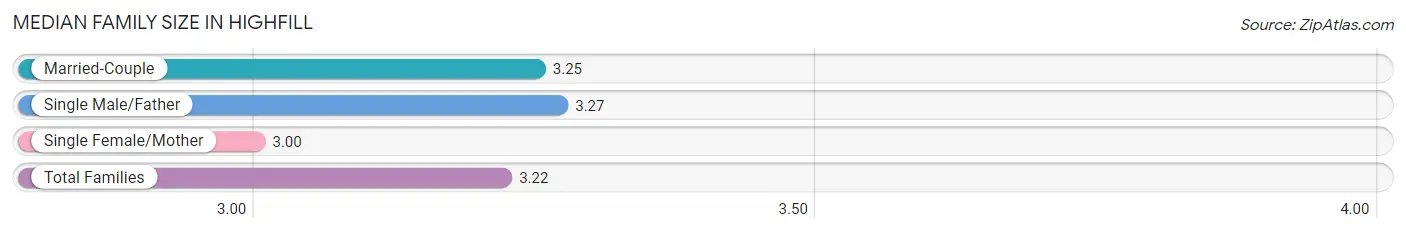
| Family Type | # Families | Family Size |
| Married-Couple | 345 (81.4%) | 3.25 |
| Single Male/Father | 22 (5.2%) | 3.27 |
| Single Female/Mother | 57 (13.4%) | 3.00 |
| Total Families | 424 (100.0%) | 3.22 |
Median Household Size in Highfill
The median household size in Highfill is 2.55 persons per household, with single male/father households (22 | 3.4%) accounting for the largest median household size of 3.45 persons per household. non-family households (231 | 35.3%) represent the smallest median household size with 1.21 persons per household.
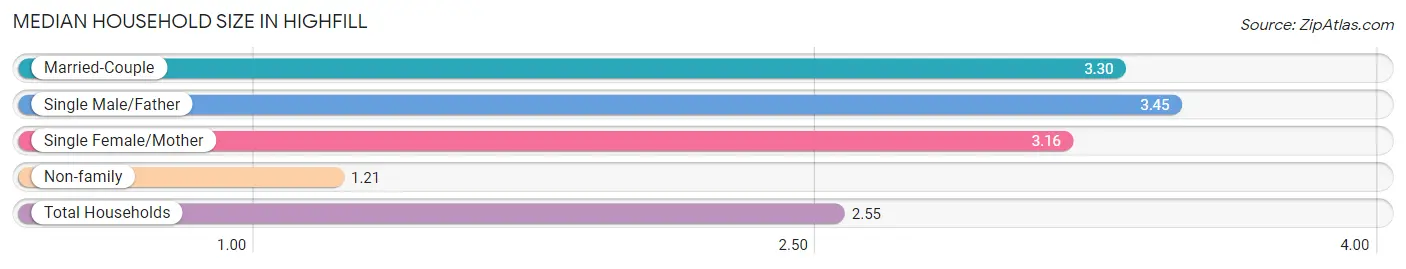
| Household Type | # Households | Household Size |
| Married-Couple | 345 (52.7%) | 3.30 |
| Single Male/Father | 22 (3.4%) | 3.45 |
| Single Female/Mother | 57 (8.7%) | 3.16 |
| Non-family | 231 (35.3%) | 1.21 |
| Total Households | 655 (100.0%) | 2.55 |
Household Size by Marriage Status in Highfill
Out of a total of 655 households in Highfill, 424 (64.7%) are family households, while 231 (35.3%) are nonfamily households. The most numerous type of family households are 2-person households, comprising 180, and the most common type of nonfamily households are 1-person households, comprising 193.
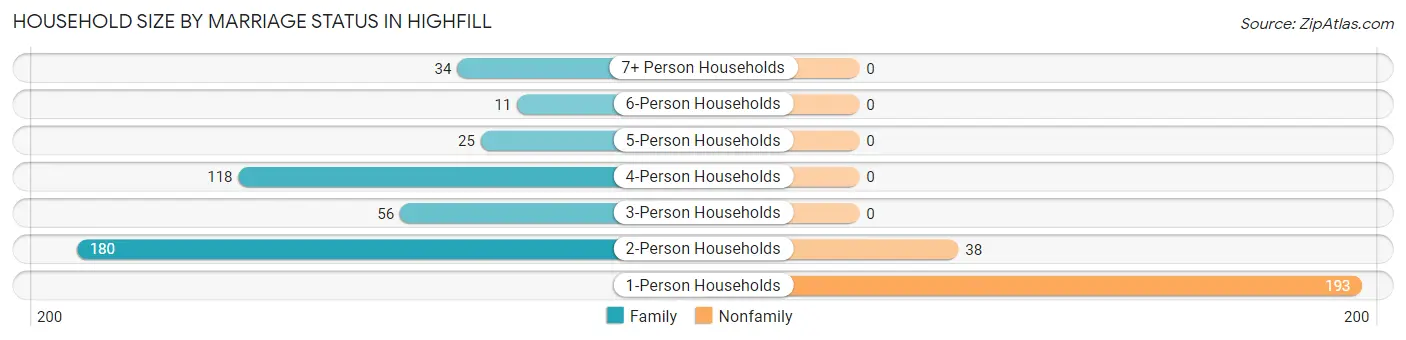
| Household Size | Family Households | Nonfamily Households |
| 1-Person Households | - | 193 (29.5%) |
| 2-Person Households | 180 (27.5%) | 38 (5.8%) |
| 3-Person Households | 56 (8.6%) | 0 (0.0%) |
| 4-Person Households | 118 (18.0%) | 0 (0.0%) |
| 5-Person Households | 25 (3.8%) | 0 (0.0%) |
| 6-Person Households | 11 (1.7%) | 0 (0.0%) |
| 7+ Person Households | 34 (5.2%) | 0 (0.0%) |
| Total | 424 (64.7%) | 231 (35.3%) |
Female Fertility in Highfill
Fertility by Age in Highfill
Average fertility rate in Highfill is 19.0 births per 1,000 women. Women in the age bracket of 20 to 34 years have the highest fertility rate with 34.0 births per 1,000 women. Women in the age bracket of 20 to 34 years acount for 100.0% of all women with births.
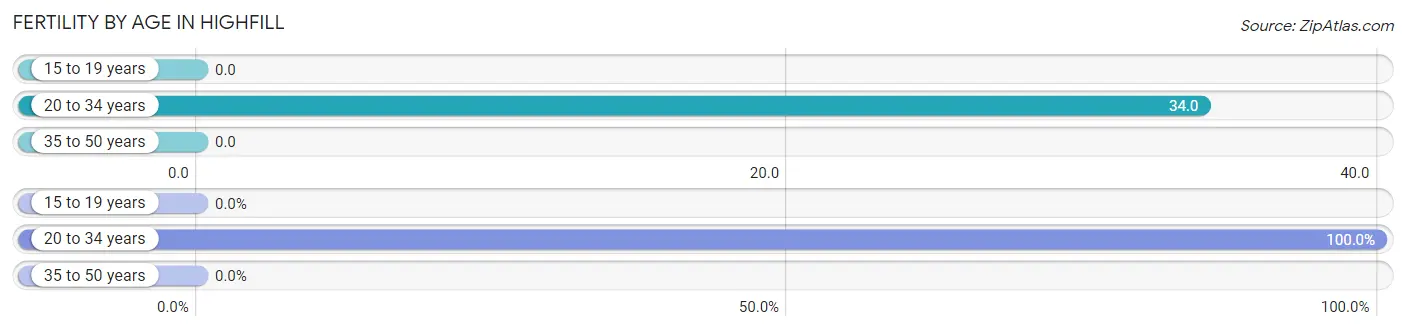
| Age Bracket | Women with Births | Births / 1,000 Women |
| 15 to 19 years | 0 (0.0%) | 0.0 |
| 20 to 34 years | 7 (100.0%) | 34.0 |
| 35 to 50 years | 0 (0.0%) | 0.0 |
| Total | 7 (100.0%) | 19.0 |
Fertility by Age by Marriage Status in Highfill
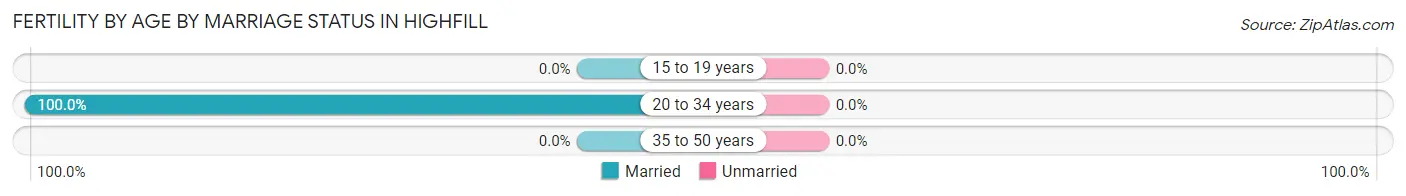
| Age Bracket | Married | Unmarried |
| 15 to 19 years | 0 (0.0%) | 0 (0.0%) |
| 20 to 34 years | 7 (100.0%) | 0 (0.0%) |
| 35 to 50 years | 0 (0.0%) | 0 (0.0%) |
| Total | 7 (100.0%) | 0 (0.0%) |
Fertility by Education in Highfill
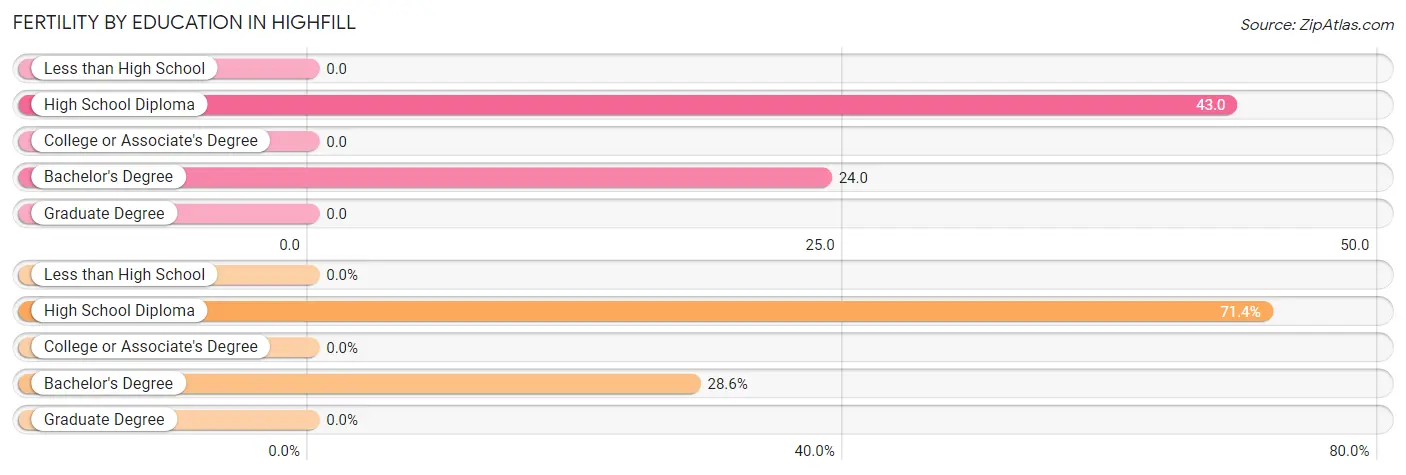
| Educational Attainment | Women with Births | Births / 1,000 Women |
| Less than High School | 0 (0.0%) | 0.0 |
| High School Diploma | 5 (71.4%) | 43.0 |
| College or Associate's Degree | 0 (0.0%) | 0.0 |
| Bachelor's Degree | 2 (28.6%) | 24.0 |
| Graduate Degree | 0 (0.0%) | 0.0 |
| Total | 7 (100.0%) | 19.0 |
Fertility by Education by Marriage Status in Highfill
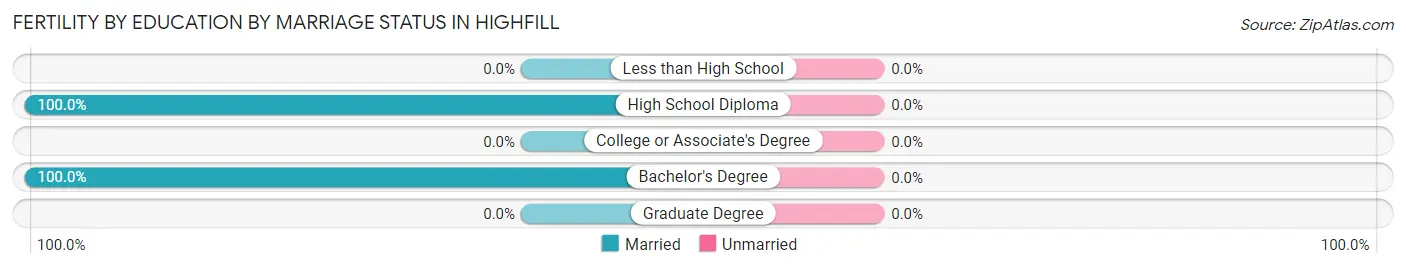
| Educational Attainment | Married | Unmarried |
| Less than High School | 0 (0.0%) | 0 (0.0%) |
| High School Diploma | 5 (100.0%) | 0 (0.0%) |
| College or Associate's Degree | 0 (0.0%) | 0 (0.0%) |
| Bachelor's Degree | 2 (100.0%) | 0 (0.0%) |
| Graduate Degree | 0 (0.0%) | 0 (0.0%) |
| Total | 7 (100.0%) | 0 (0.0%) |
Employment Characteristics in Highfill
Employment by Class of Employer in Highfill
Among the 970 employed individuals in Highfill, private company employees (709 | 73.1%), self-employed (incorporated) (115 | 11.9%), and self-employed (not incorporated) (51 | 5.3%) make up the most common classes of employment.
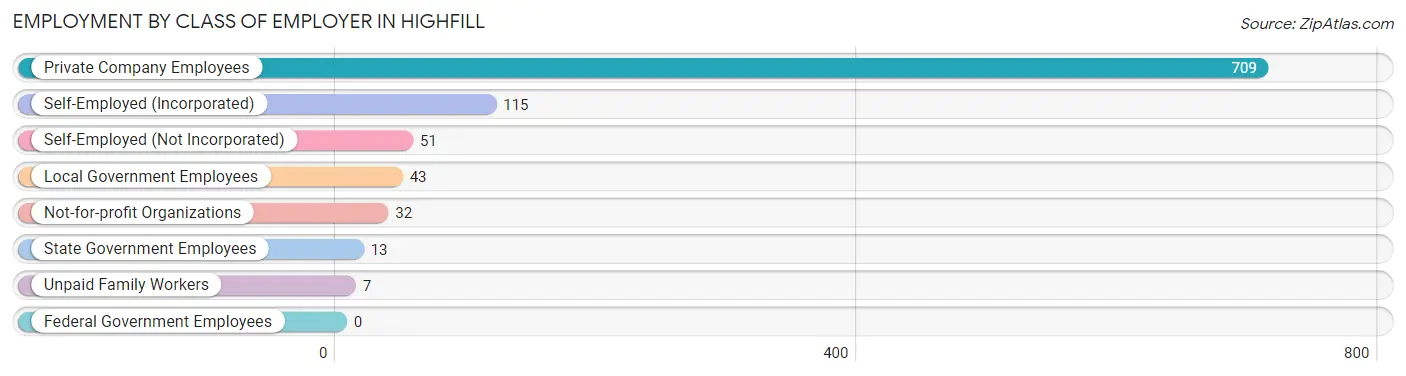
| Employer Class | # Employees | % Employees |
| Private Company Employees | 709 | 73.1% |
| Self-Employed (Incorporated) | 115 | 11.9% |
| Self-Employed (Not Incorporated) | 51 | 5.3% |
| Not-for-profit Organizations | 32 | 3.3% |
| Local Government Employees | 43 | 4.4% |
| State Government Employees | 13 | 1.3% |
| Federal Government Employees | 0 | 0.0% |
| Unpaid Family Workers | 7 | 0.7% |
| Total | 970 | 100.0% |
Employment Status by Age in Highfill
According to the labor force statistics for Highfill, out of the total population over 16 years of age (1,318), 75.1% or 990 individuals are in the labor force, with 0.7% or 7 of them unemployed. The age group with the highest labor force participation rate is 25 to 29 years, with 92.9% or 197 individuals in the labor force. Within the labor force, the 20 to 24 years age range has the highest percentage of unemployed individuals, with 11.6% or 5 of them being unemployed.
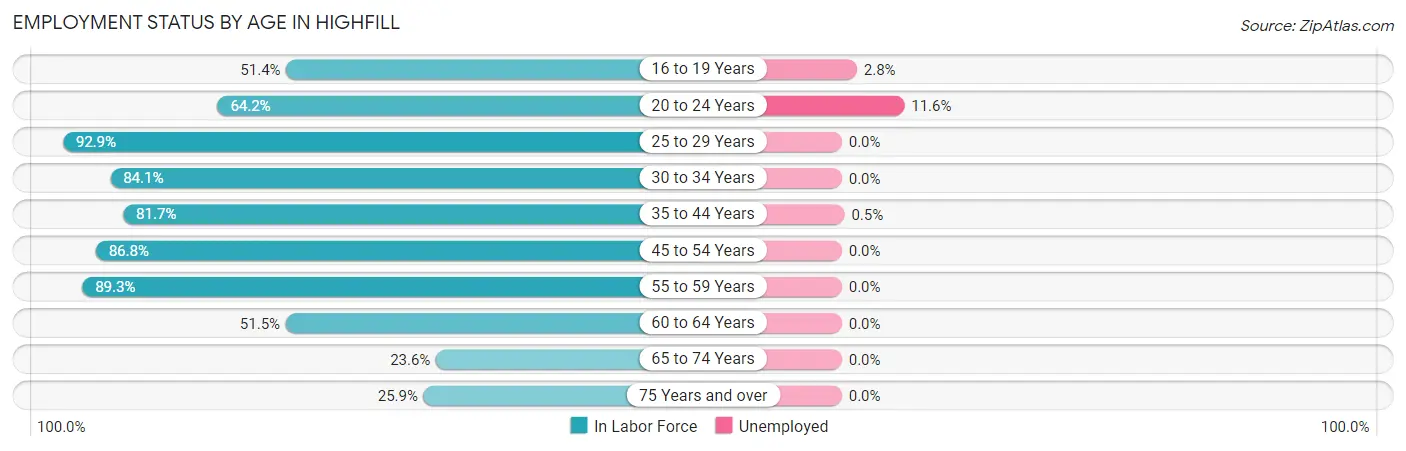
| Age Bracket | In Labor Force | Unemployed |
| 16 to 19 Years | 36 (51.4%) | 1 (2.8%) |
| 20 to 24 Years | 43 (64.2%) | 5 (11.6%) |
| 25 to 29 Years | 197 (92.9%) | 0 (0.0%) |
| 30 to 34 Years | 191 (84.1%) | 0 (0.0%) |
| 35 to 44 Years | 201 (81.7%) | 1 (0.5%) |
| 45 to 54 Years | 204 (86.8%) | 0 (0.0%) |
| 55 to 59 Years | 50 (89.3%) | 0 (0.0%) |
| 60 to 64 Years | 35 (51.5%) | 0 (0.0%) |
| 65 to 74 Years | 26 (23.6%) | 0 (0.0%) |
| 75 Years and over | 7 (25.9%) | 0 (0.0%) |
| Total | 990 (75.1%) | 7 (0.7%) |
Employment Status by Educational Attainment in Highfill
According to labor force statistics for Highfill, 84.1% of individuals (878) out of the total population between 25 and 64 years of age (1,044) are in the labor force, with 0.1% or 1 of them being unemployed. The group with the highest labor force participation rate are those with the educational attainment of less than high school, with 89.7% or 105 individuals in the labor force. Within the labor force, individuals with bachelor's degree or higher education have the highest percentage of unemployment, with 0.5% or 1 of them being unemployed.
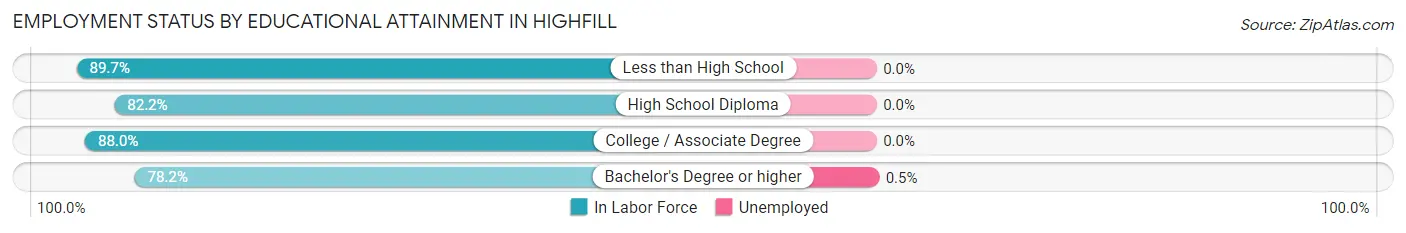
| Educational Attainment | In Labor Force | Unemployed |
| Less than High School | 105 (89.7%) | 0 (0.0%) |
| High School Diploma | 267 (82.2%) | 0 (0.0%) |
| College / Associate Degree | 316 (88.0%) | 0 (0.0%) |
| Bachelor's Degree or higher | 190 (78.2%) | 1 (0.5%) |
| Total | 878 (84.1%) | 1 (0.1%) |
Employment Occupations by Sex in Highfill
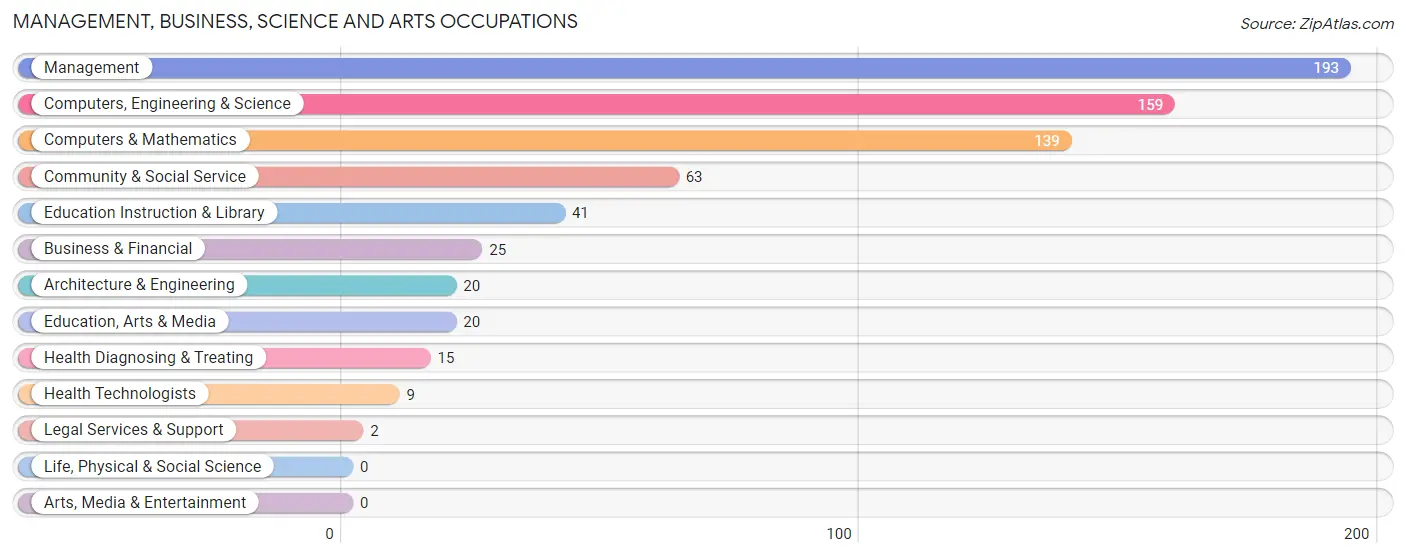
Management, Business, Science and Arts Occupations
The most common Management, Business, Science and Arts occupations in Highfill are Management (193 | 19.6%), Computers, Engineering & Science (159 | 16.2%), Computers & Mathematics (139 | 14.1%), Community & Social Service (63 | 6.4%), and Education Instruction & Library (41 | 4.2%).
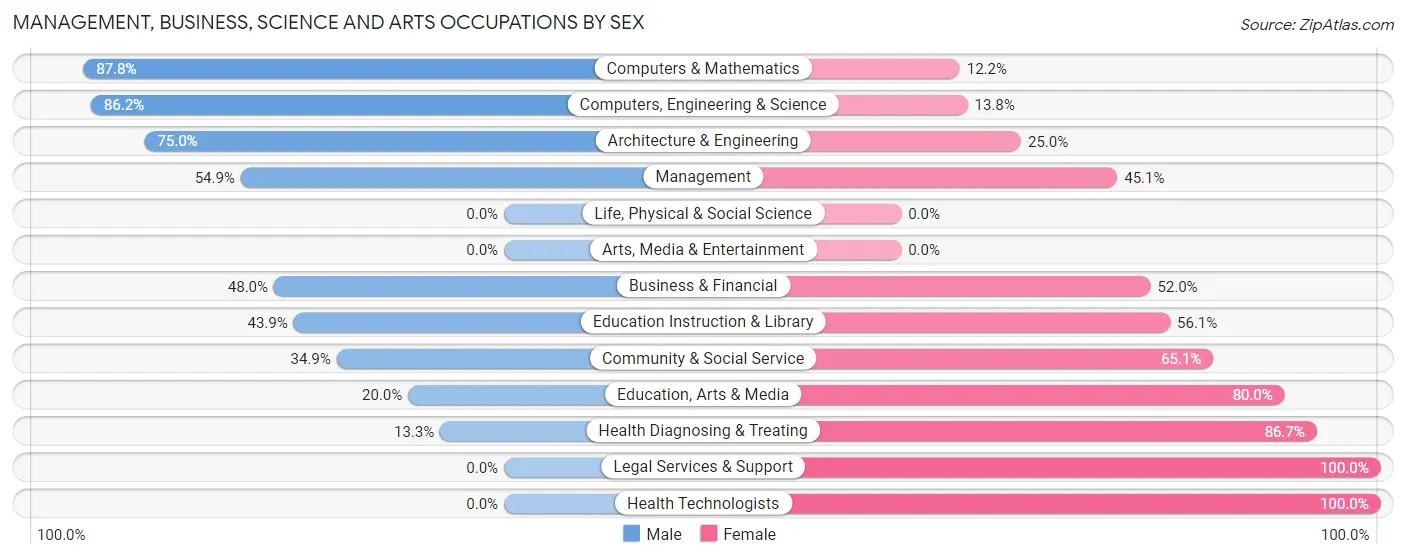
Management, Business, Science and Arts Occupations by Sex
Within the Management, Business, Science and Arts occupations in Highfill, the most male-oriented occupations are Computers & Mathematics (87.8%), Computers, Engineering & Science (86.2%), and Architecture & Engineering (75.0%), while the most female-oriented occupations are Legal Services & Support (100.0%), Health Technologists (100.0%), and Health Diagnosing & Treating (86.7%).
| Occupation | Male | Female |
| Management | 106 (54.9%) | 87 (45.1%) |
| Business & Financial | 12 (48.0%) | 13 (52.0%) |
| Computers, Engineering & Science | 137 (86.2%) | 22 (13.8%) |
| Computers & Mathematics | 122 (87.8%) | 17 (12.2%) |
| Architecture & Engineering | 15 (75.0%) | 5 (25.0%) |
| Life, Physical & Social Science | 0 (0.0%) | 0 (0.0%) |
| Community & Social Service | 22 (34.9%) | 41 (65.1%) |
| Education, Arts & Media | 4 (20.0%) | 16 (80.0%) |
| Legal Services & Support | 0 (0.0%) | 2 (100.0%) |
| Education Instruction & Library | 18 (43.9%) | 23 (56.1%) |
| Arts, Media & Entertainment | 0 (0.0%) | 0 (0.0%) |
| Health Diagnosing & Treating | 2 (13.3%) | 13 (86.7%) |
| Health Technologists | 0 (0.0%) | 9 (100.0%) |
| Total (Category) | 279 (61.3%) | 176 (38.7%) |
| Total (Overall) | 622 (63.3%) | 361 (36.7%) |
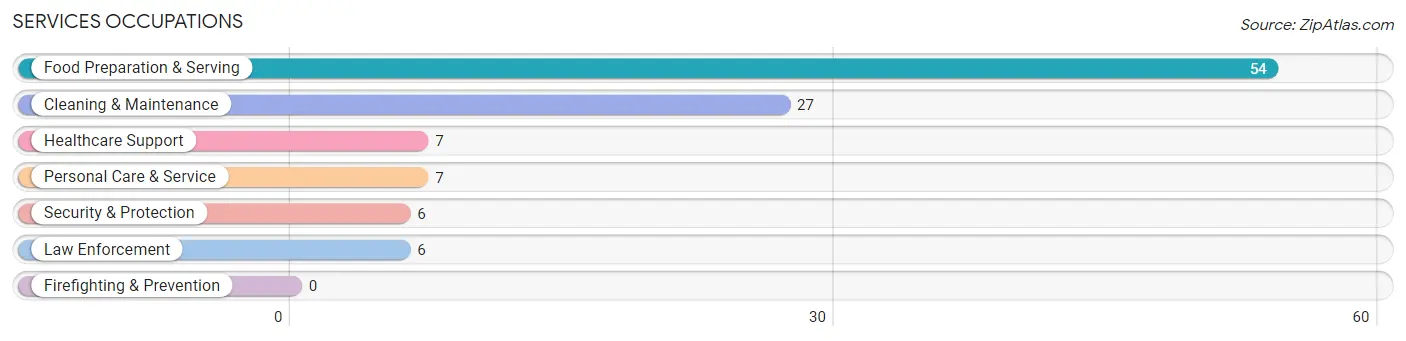
Services Occupations
The most common Services occupations in Highfill are Food Preparation & Serving (54 | 5.5%), Cleaning & Maintenance (27 | 2.8%), Healthcare Support (7 | 0.7%), Personal Care & Service (7 | 0.7%), and Security & Protection (6 | 0.6%).
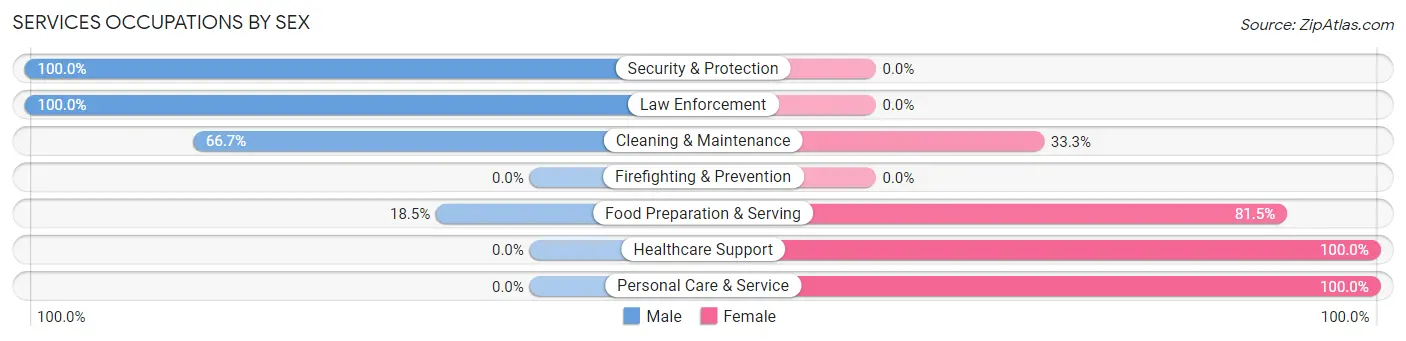
Services Occupations by Sex
Within the Services occupations in Highfill, the most male-oriented occupations are Security & Protection (100.0%), Law Enforcement (100.0%), and Cleaning & Maintenance (66.7%), while the most female-oriented occupations are Healthcare Support (100.0%), Personal Care & Service (100.0%), and Food Preparation & Serving (81.5%).
| Occupation | Male | Female |
| Healthcare Support | 0 (0.0%) | 7 (100.0%) |
| Security & Protection | 6 (100.0%) | 0 (0.0%) |
| Firefighting & Prevention | 0 (0.0%) | 0 (0.0%) |
| Law Enforcement | 6 (100.0%) | 0 (0.0%) |
| Food Preparation & Serving | 10 (18.5%) | 44 (81.5%) |
| Cleaning & Maintenance | 18 (66.7%) | 9 (33.3%) |
| Personal Care & Service | 0 (0.0%) | 7 (100.0%) |
| Total (Category) | 34 (33.7%) | 67 (66.3%) |
| Total (Overall) | 622 (63.3%) | 361 (36.7%) |
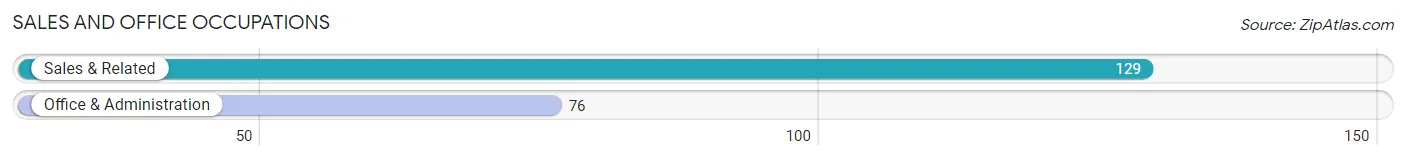
Sales and Office Occupations
The most common Sales and Office occupations in Highfill are Sales & Related (129 | 13.1%), and Office & Administration (76 | 7.7%).
Sales and Office Occupations by Sex
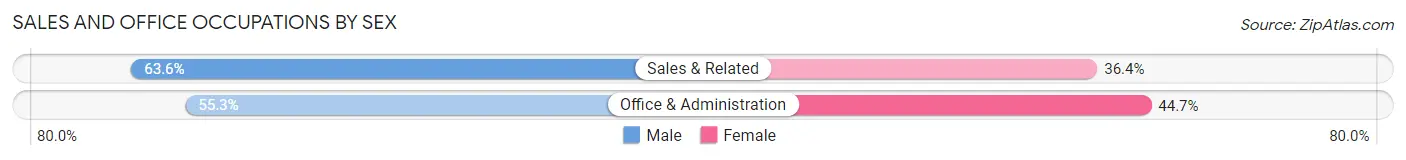
| Occupation | Male | Female |
| Sales & Related | 82 (63.6%) | 47 (36.4%) |
| Office & Administration | 42 (55.3%) | 34 (44.7%) |
| Total (Category) | 124 (60.5%) | 81 (39.5%) |
| Total (Overall) | 622 (63.3%) | 361 (36.7%) |
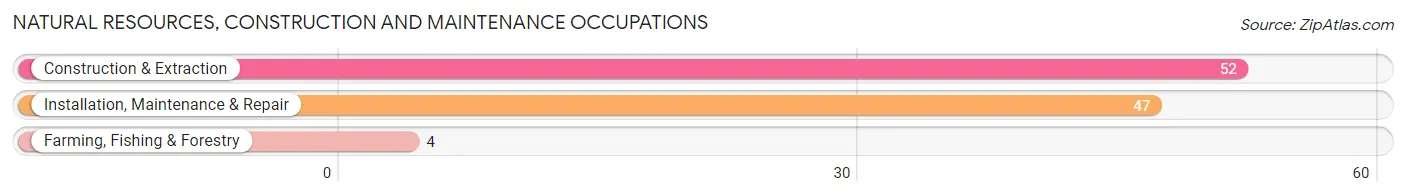
Natural Resources, Construction and Maintenance Occupations
The most common Natural Resources, Construction and Maintenance occupations in Highfill are Construction & Extraction (52 | 5.3%), Installation, Maintenance & Repair (47 | 4.8%), and Farming, Fishing & Forestry (4 | 0.4%).
Natural Resources, Construction and Maintenance Occupations by Sex
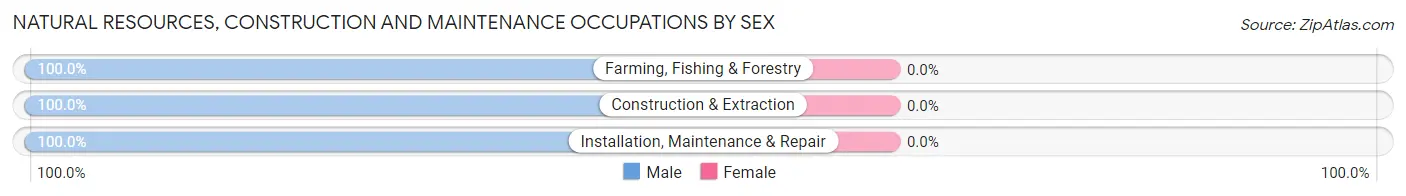
| Occupation | Male | Female |
| Farming, Fishing & Forestry | 4 (100.0%) | 0 (0.0%) |
| Construction & Extraction | 52 (100.0%) | 0 (0.0%) |
| Installation, Maintenance & Repair | 47 (100.0%) | 0 (0.0%) |
| Total (Category) | 103 (100.0%) | 0 (0.0%) |
| Total (Overall) | 622 (63.3%) | 361 (36.7%) |
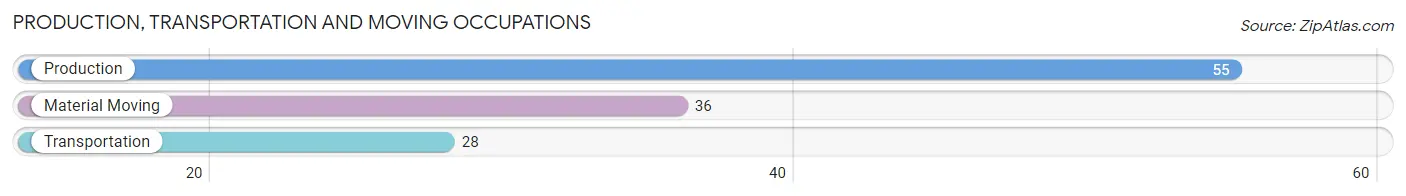
Production, Transportation and Moving Occupations
The most common Production, Transportation and Moving occupations in Highfill are Production (55 | 5.6%), Material Moving (36 | 3.7%), and Transportation (28 | 2.9%).
Production, Transportation and Moving Occupations by Sex
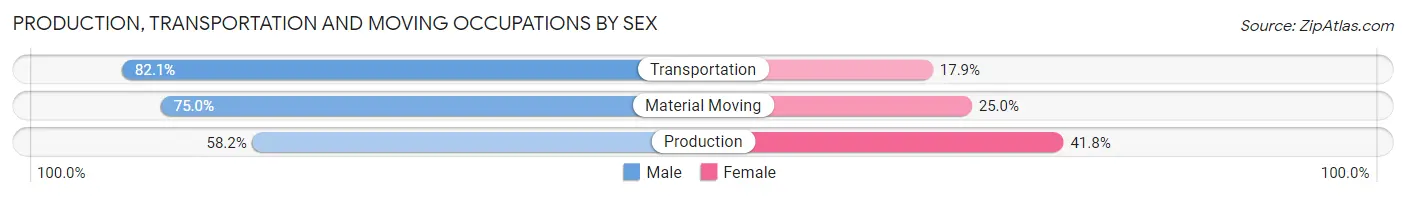
| Occupation | Male | Female |
| Production | 32 (58.2%) | 23 (41.8%) |
| Transportation | 23 (82.1%) | 5 (17.9%) |
| Material Moving | 27 (75.0%) | 9 (25.0%) |
| Total (Category) | 82 (68.9%) | 37 (31.1%) |
| Total (Overall) | 622 (63.3%) | 361 (36.7%) |
Employment Industries by Sex in Highfill
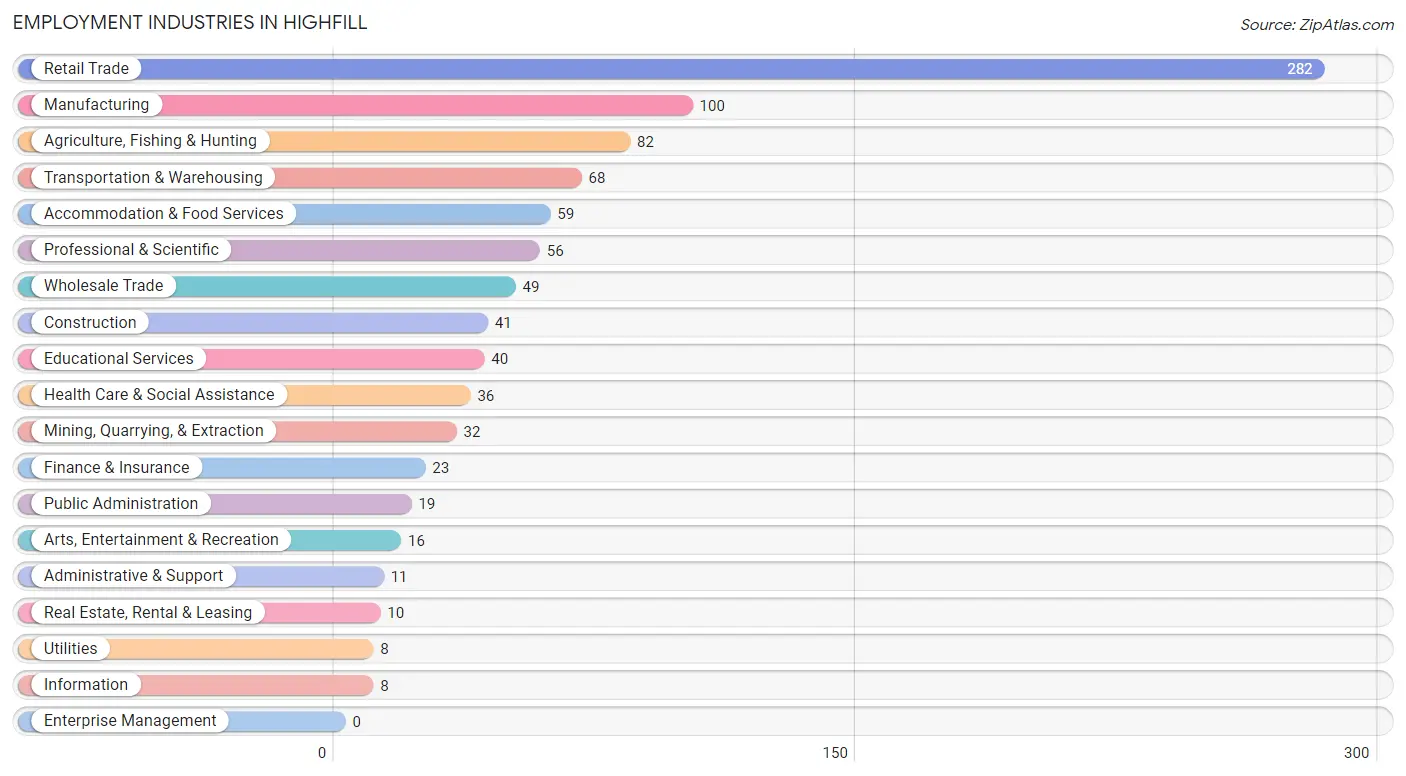
Employment Industries in Highfill
The major employment industries in Highfill include Retail Trade (282 | 28.7%), Manufacturing (100 | 10.2%), Agriculture, Fishing & Hunting (82 | 8.3%), Transportation & Warehousing (68 | 6.9%), and Accommodation & Food Services (59 | 6.0%).
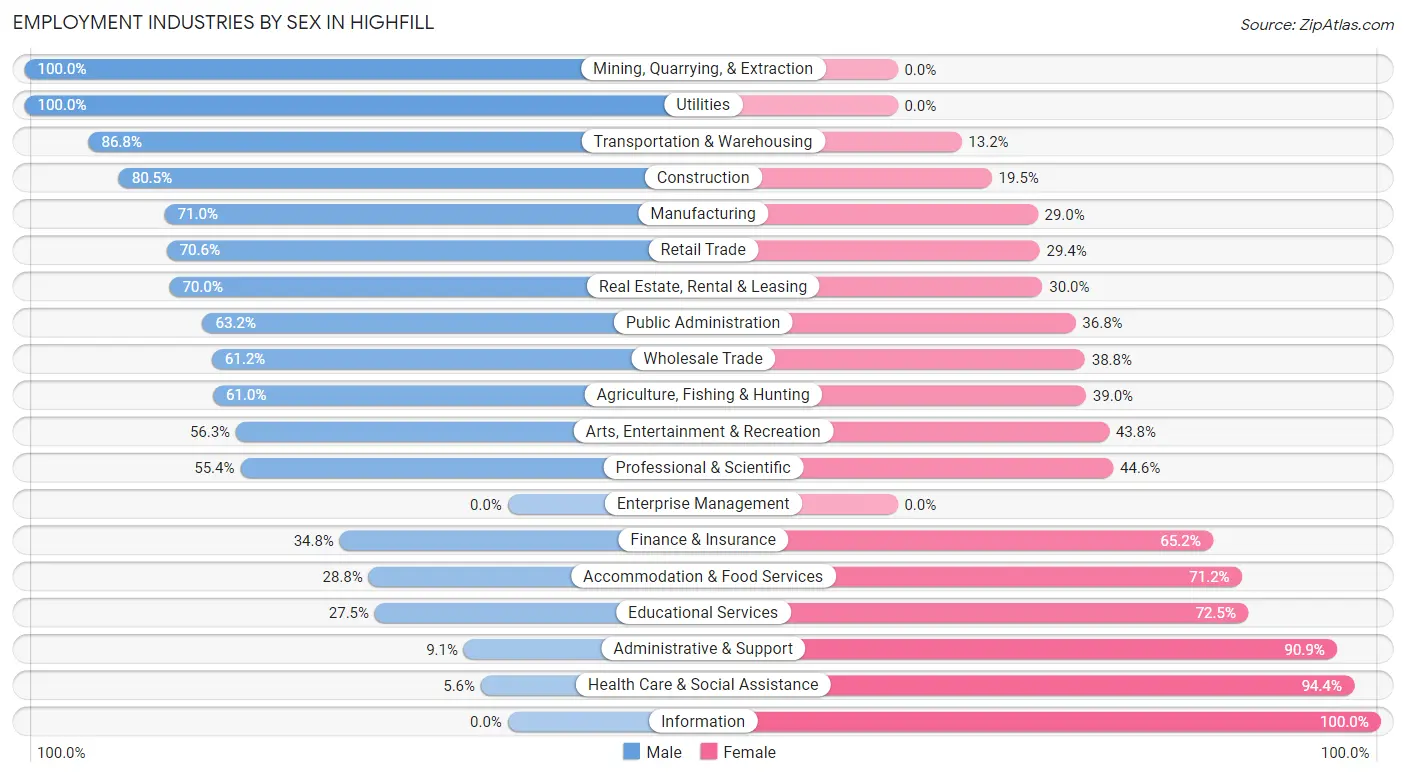
Employment Industries by Sex in Highfill
The Highfill industries that see more men than women are Mining, Quarrying, & Extraction (100.0%), Utilities (100.0%), and Transportation & Warehousing (86.8%), whereas the industries that tend to have a higher number of women are Information (100.0%), Health Care & Social Assistance (94.4%), and Administrative & Support (90.9%).
| Industry | Male | Female |
| Agriculture, Fishing & Hunting | 50 (61.0%) | 32 (39.0%) |
| Mining, Quarrying, & Extraction | 32 (100.0%) | 0 (0.0%) |
| Construction | 33 (80.5%) | 8 (19.5%) |
| Manufacturing | 71 (71.0%) | 29 (29.0%) |
| Wholesale Trade | 30 (61.2%) | 19 (38.8%) |
| Retail Trade | 199 (70.6%) | 83 (29.4%) |
| Transportation & Warehousing | 59 (86.8%) | 9 (13.2%) |
| Utilities | 8 (100.0%) | 0 (0.0%) |
| Information | 0 (0.0%) | 8 (100.0%) |
| Finance & Insurance | 8 (34.8%) | 15 (65.2%) |
| Real Estate, Rental & Leasing | 7 (70.0%) | 3 (30.0%) |
| Professional & Scientific | 31 (55.4%) | 25 (44.6%) |
| Enterprise Management | 0 (0.0%) | 0 (0.0%) |
| Administrative & Support | 1 (9.1%) | 10 (90.9%) |
| Educational Services | 11 (27.5%) | 29 (72.5%) |
| Health Care & Social Assistance | 2 (5.6%) | 34 (94.4%) |
| Arts, Entertainment & Recreation | 9 (56.2%) | 7 (43.8%) |
| Accommodation & Food Services | 17 (28.8%) | 42 (71.2%) |
| Public Administration | 12 (63.2%) | 7 (36.8%) |
| Total | 622 (63.3%) | 361 (36.7%) |
Education in Highfill
School Enrollment in Highfill
The most common levels of schooling among the 382 students in Highfill are high school (102 | 26.7%), middle school (101 | 26.4%), and elementary school (92 | 24.1%).
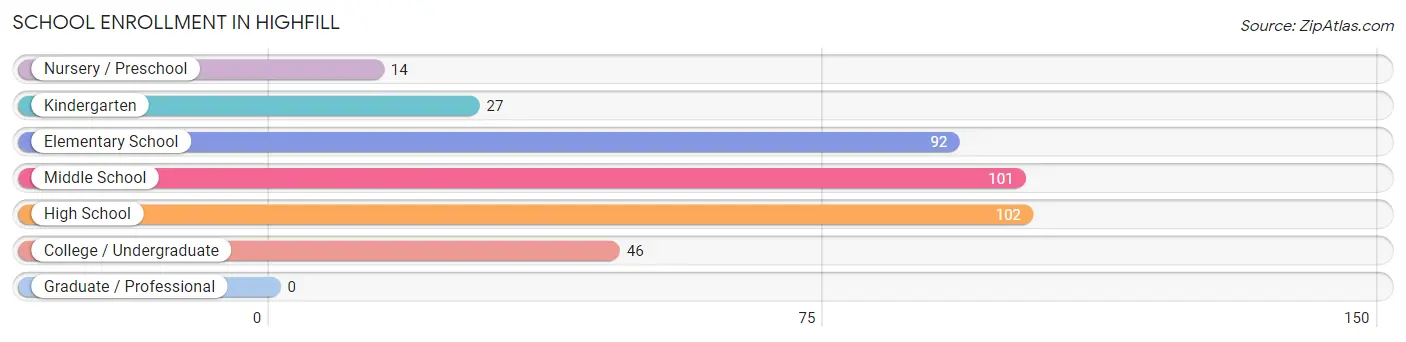
| School Level | # Students | % Students |
| Nursery / Preschool | 14 | 3.7% |
| Kindergarten | 27 | 7.1% |
| Elementary School | 92 | 24.1% |
| Middle School | 101 | 26.4% |
| High School | 102 | 26.7% |
| College / Undergraduate | 46 | 12.0% |
| Graduate / Professional | 0 | 0.0% |
| Total | 382 | 100.0% |
School Enrollment by Age by Funding Source in Highfill
Out of a total of 382 students who are enrolled in schools in Highfill, 103 (27.0%) attend a private institution, while the remaining 279 (73.0%) are enrolled in public schools. The age group of 18 to 19 year olds has the highest likelihood of being enrolled in private schools, with 16 (66.7% in the age bracket) enrolled. Conversely, the age group of 25 to 34 year olds has the lowest likelihood of being enrolled in a private school, with 1 (100.0% in the age bracket) attending a public institution.
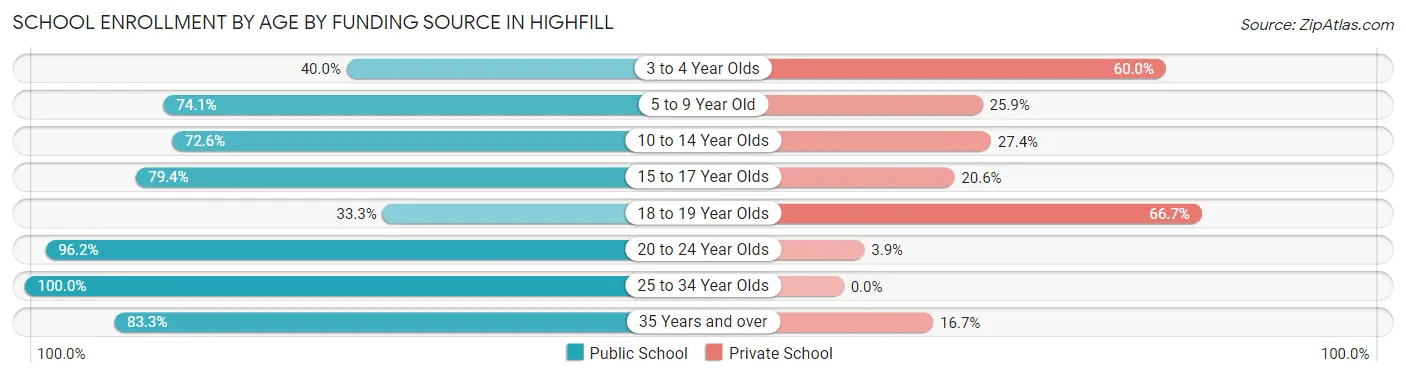
| Age Bracket | Public School | Private School |
| 3 to 4 Year Olds | 4 (40.0%) | 6 (60.0%) |
| 5 to 9 Year Old | 86 (74.1%) | 30 (25.9%) |
| 10 to 14 Year Olds | 90 (72.6%) | 34 (27.4%) |
| 15 to 17 Year Olds | 50 (79.4%) | 13 (20.6%) |
| 18 to 19 Year Olds | 8 (33.3%) | 16 (66.7%) |
| 20 to 24 Year Olds | 25 (96.2%) | 1 (3.8%) |
| 25 to 34 Year Olds | 1 (100.0%) | 0 (0.0%) |
| 35 Years and over | 15 (83.3%) | 3 (16.7%) |
| Total | 279 (73.0%) | 103 (27.0%) |
Educational Attainment by Field of Study in Highfill
Business (88 | 29.0%), education (36 | 11.9%), social sciences (34 | 11.2%), communications (32 | 10.6%), and engineering (23 | 7.6%) are the most common fields of study among 303 individuals in Highfill who have obtained a bachelor's degree or higher.
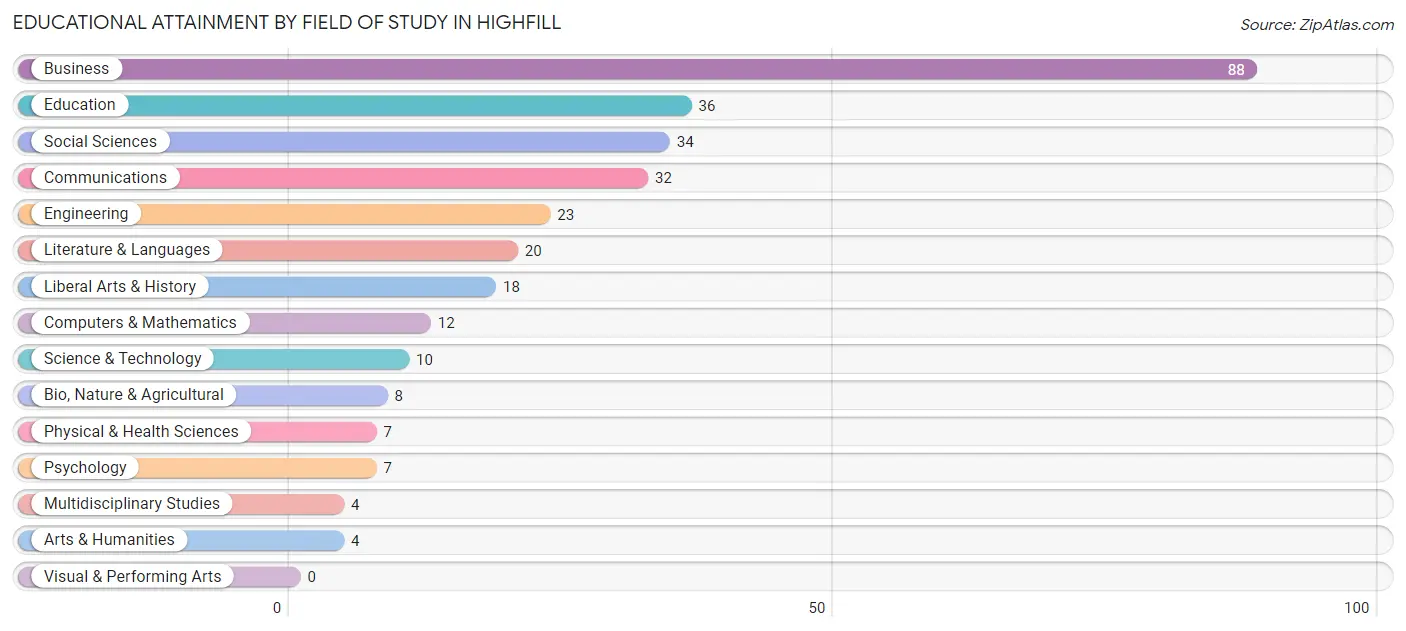
| Field of Study | # Graduates | % Graduates |
| Computers & Mathematics | 12 | 4.0% |
| Bio, Nature & Agricultural | 8 | 2.6% |
| Physical & Health Sciences | 7 | 2.3% |
| Psychology | 7 | 2.3% |
| Social Sciences | 34 | 11.2% |
| Engineering | 23 | 7.6% |
| Multidisciplinary Studies | 4 | 1.3% |
| Science & Technology | 10 | 3.3% |
| Business | 88 | 29.0% |
| Education | 36 | 11.9% |
| Literature & Languages | 20 | 6.6% |
| Liberal Arts & History | 18 | 5.9% |
| Visual & Performing Arts | 0 | 0.0% |
| Communications | 32 | 10.6% |
| Arts & Humanities | 4 | 1.3% |
| Total | 303 | 100.0% |
Transportation & Commute in Highfill
Vehicle Availability by Sex in Highfill
The most prevalent vehicle ownership categories in Highfill are males with 2 vehicles (212, accounting for 34.8%) and females with 2 vehicles (140, making up 59.2%).
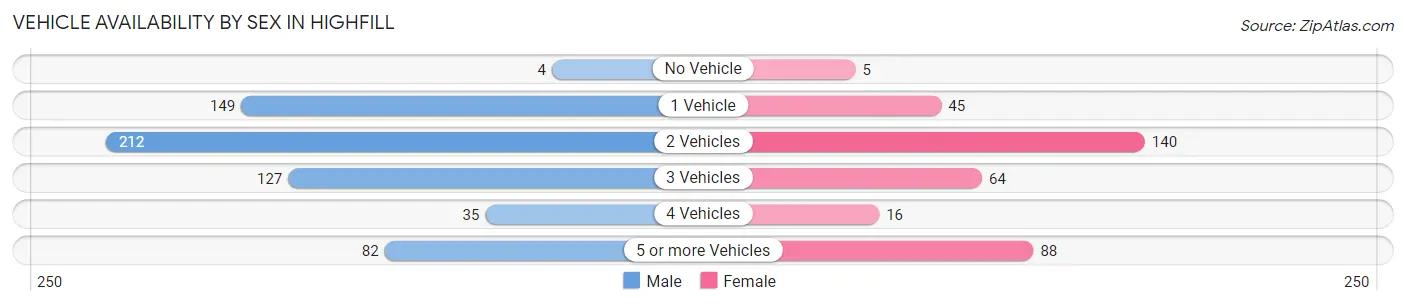
| Vehicles Available | Male | Female |
| No Vehicle | 4 (0.7%) | 5 (1.4%) |
| 1 Vehicle | 149 (24.5%) | 45 (12.6%) |
| 2 Vehicles | 212 (34.8%) | 140 (39.1%) |
| 3 Vehicles | 127 (20.8%) | 64 (17.9%) |
| 4 Vehicles | 35 (5.8%) | 16 (4.5%) |
| 5 or more Vehicles | 82 (13.5%) | 88 (24.6%) |
| Total | 609 (100.0%) | 358 (100.0%) |
Commute Time in Highfill
The most frequently occuring commute durations in Highfill are 30 to 34 minutes (196 commuters, 25.8%), 10 to 14 minutes (146 commuters, 19.2%), and 15 to 19 minutes (135 commuters, 17.8%).
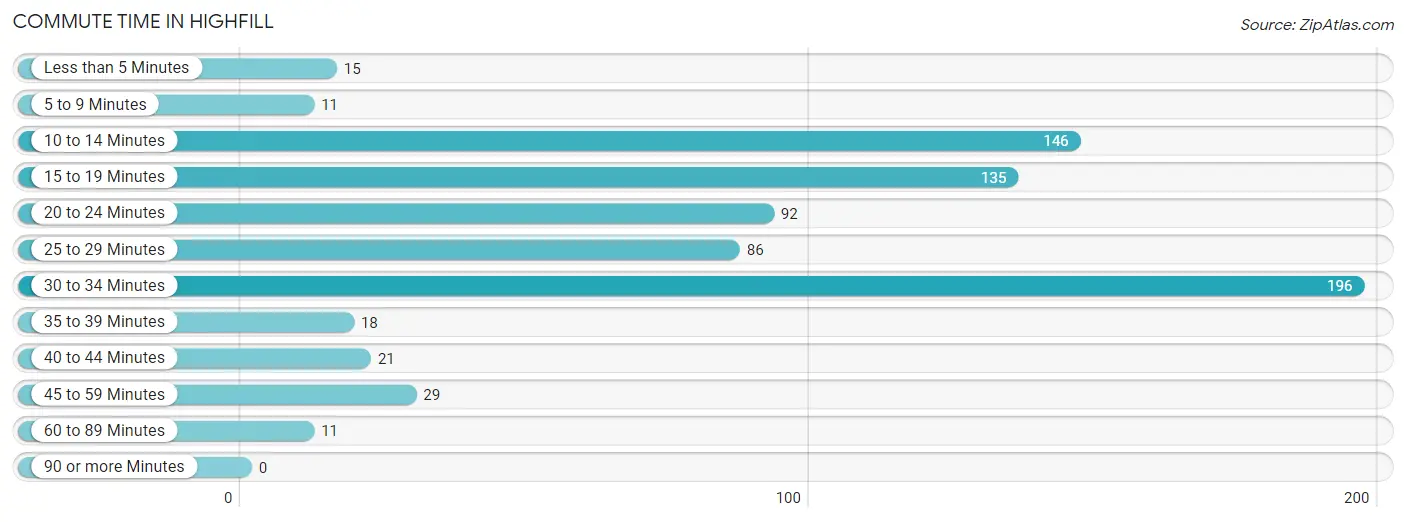
| Commute Time | # Commuters | % Commuters |
| Less than 5 Minutes | 15 | 2.0% |
| 5 to 9 Minutes | 11 | 1.5% |
| 10 to 14 Minutes | 146 | 19.2% |
| 15 to 19 Minutes | 135 | 17.8% |
| 20 to 24 Minutes | 92 | 12.1% |
| 25 to 29 Minutes | 86 | 11.3% |
| 30 to 34 Minutes | 196 | 25.8% |
| 35 to 39 Minutes | 18 | 2.4% |
| 40 to 44 Minutes | 21 | 2.8% |
| 45 to 59 Minutes | 29 | 3.8% |
| 60 to 89 Minutes | 11 | 1.5% |
| 90 or more Minutes | 0 | 0.0% |
Commute Time by Sex in Highfill
The most common commute times in Highfill are 10 to 14 minutes (126 commuters, 25.1%) for males and 30 to 34 minutes (85 commuters, 33.1%) for females.
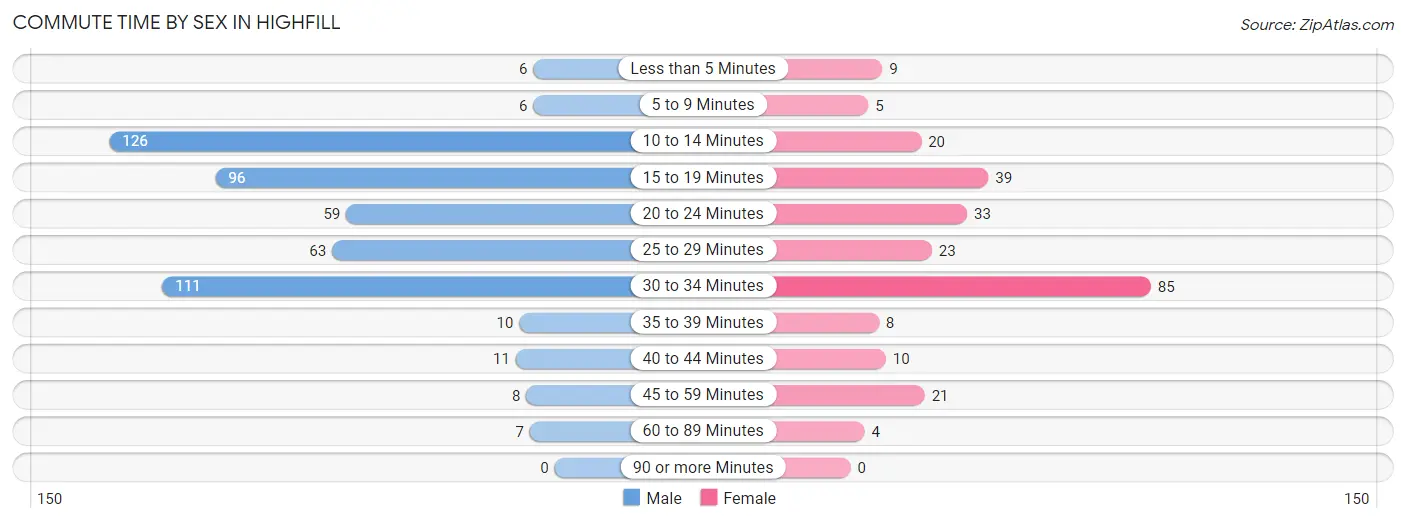
| Commute Time | Male | Female |
| Less than 5 Minutes | 6 (1.2%) | 9 (3.5%) |
| 5 to 9 Minutes | 6 (1.2%) | 5 (1.9%) |
| 10 to 14 Minutes | 126 (25.1%) | 20 (7.8%) |
| 15 to 19 Minutes | 96 (19.1%) | 39 (15.2%) |
| 20 to 24 Minutes | 59 (11.7%) | 33 (12.8%) |
| 25 to 29 Minutes | 63 (12.5%) | 23 (8.9%) |
| 30 to 34 Minutes | 111 (22.1%) | 85 (33.1%) |
| 35 to 39 Minutes | 10 (2.0%) | 8 (3.1%) |
| 40 to 44 Minutes | 11 (2.2%) | 10 (3.9%) |
| 45 to 59 Minutes | 8 (1.6%) | 21 (8.2%) |
| 60 to 89 Minutes | 7 (1.4%) | 4 (1.6%) |
| 90 or more Minutes | 0 (0.0%) | 0 (0.0%) |
Time of Departure to Work by Sex in Highfill
The most frequent times of departure to work in Highfill are 7:00 AM to 7:29 AM (140, 27.8%) for males and 12:00 AM to 4:59 AM (59, 23.0%) for females.
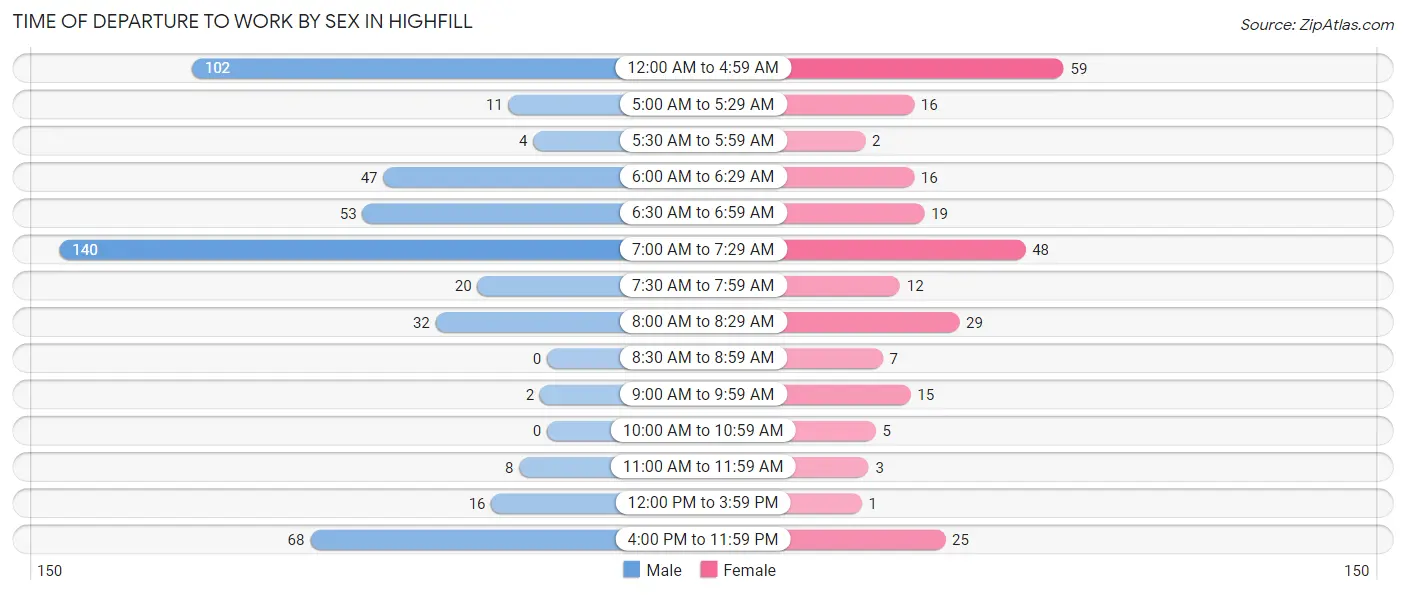
| Time of Departure | Male | Female |
| 12:00 AM to 4:59 AM | 102 (20.3%) | 59 (23.0%) |
| 5:00 AM to 5:29 AM | 11 (2.2%) | 16 (6.2%) |
| 5:30 AM to 5:59 AM | 4 (0.8%) | 2 (0.8%) |
| 6:00 AM to 6:29 AM | 47 (9.3%) | 16 (6.2%) |
| 6:30 AM to 6:59 AM | 53 (10.5%) | 19 (7.4%) |
| 7:00 AM to 7:29 AM | 140 (27.8%) | 48 (18.7%) |
| 7:30 AM to 7:59 AM | 20 (4.0%) | 12 (4.7%) |
| 8:00 AM to 8:29 AM | 32 (6.4%) | 29 (11.3%) |
| 8:30 AM to 8:59 AM | 0 (0.0%) | 7 (2.7%) |
| 9:00 AM to 9:59 AM | 2 (0.4%) | 15 (5.8%) |
| 10:00 AM to 10:59 AM | 0 (0.0%) | 5 (1.9%) |
| 11:00 AM to 11:59 AM | 8 (1.6%) | 3 (1.2%) |
| 12:00 PM to 3:59 PM | 16 (3.2%) | 1 (0.4%) |
| 4:00 PM to 11:59 PM | 68 (13.5%) | 25 (9.7%) |
| Total | 503 (100.0%) | 257 (100.0%) |
Housing Occupancy in Highfill
Occupancy by Ownership in Highfill
Of the total 655 dwellings in Highfill, owner-occupied units account for 556 (84.9%), while renter-occupied units make up 99 (15.1%).
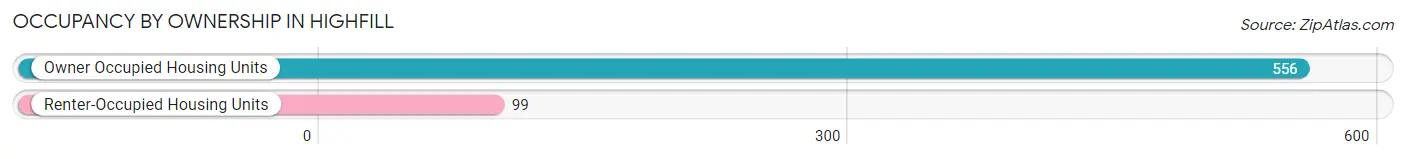
| Occupancy | # Housing Units | % Housing Units |
| Owner Occupied Housing Units | 556 | 84.9% |
| Renter-Occupied Housing Units | 99 | 15.1% |
| Total Occupied Housing Units | 655 | 100.0% |
Occupancy by Household Size in Highfill
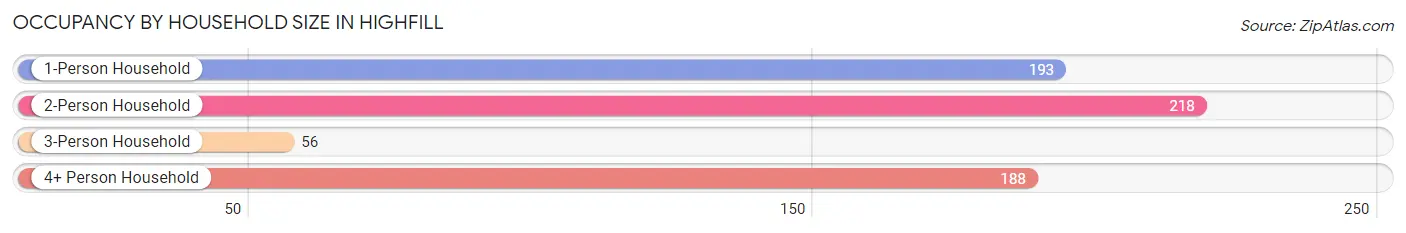
| Household Size | # Housing Units | % Housing Units |
| 1-Person Household | 193 | 29.5% |
| 2-Person Household | 218 | 33.3% |
| 3-Person Household | 56 | 8.6% |
| 4+ Person Household | 188 | 28.7% |
| Total Housing Units | 655 | 100.0% |
Occupancy by Ownership by Household Size in Highfill
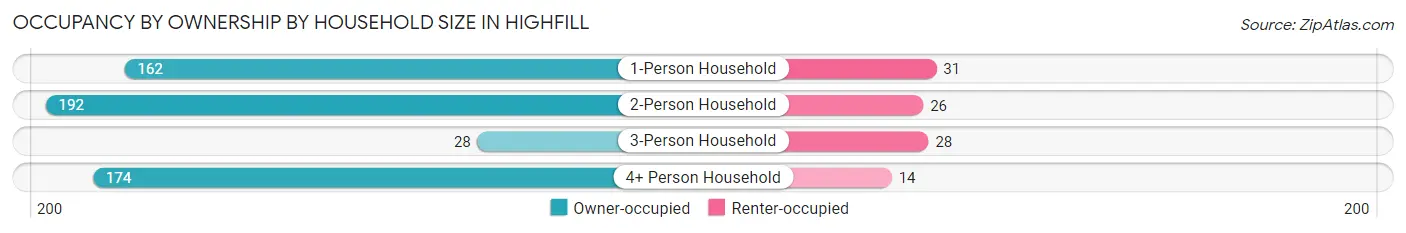
| Household Size | Owner-occupied | Renter-occupied |
| 1-Person Household | 162 (83.9%) | 31 (16.1%) |
| 2-Person Household | 192 (88.1%) | 26 (11.9%) |
| 3-Person Household | 28 (50.0%) | 28 (50.0%) |
| 4+ Person Household | 174 (92.5%) | 14 (7.4%) |
| Total Housing Units | 556 (84.9%) | 99 (15.1%) |
Occupancy by Educational Attainment in Highfill
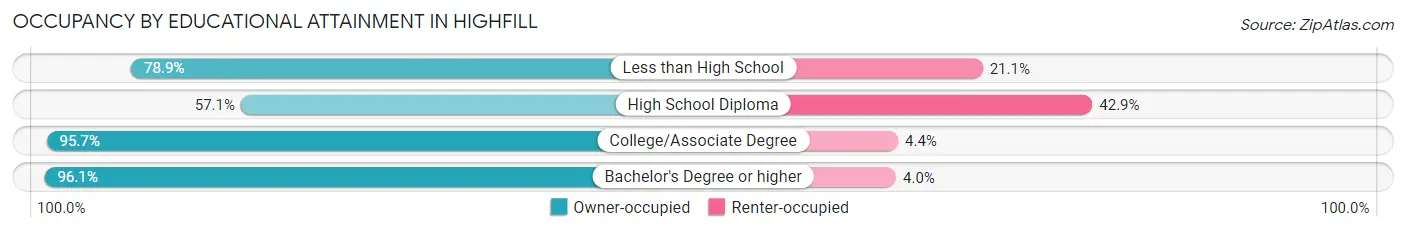
| Household Size | Owner-occupied | Renter-occupied |
| Less than High School | 56 (78.9%) | 15 (21.1%) |
| High School Diploma | 88 (57.1%) | 66 (42.9%) |
| College/Associate Degree | 242 (95.7%) | 11 (4.3%) |
| Bachelor's Degree or higher | 170 (96.1%) | 7 (4.0%) |
Occupancy by Age of Householder in Highfill
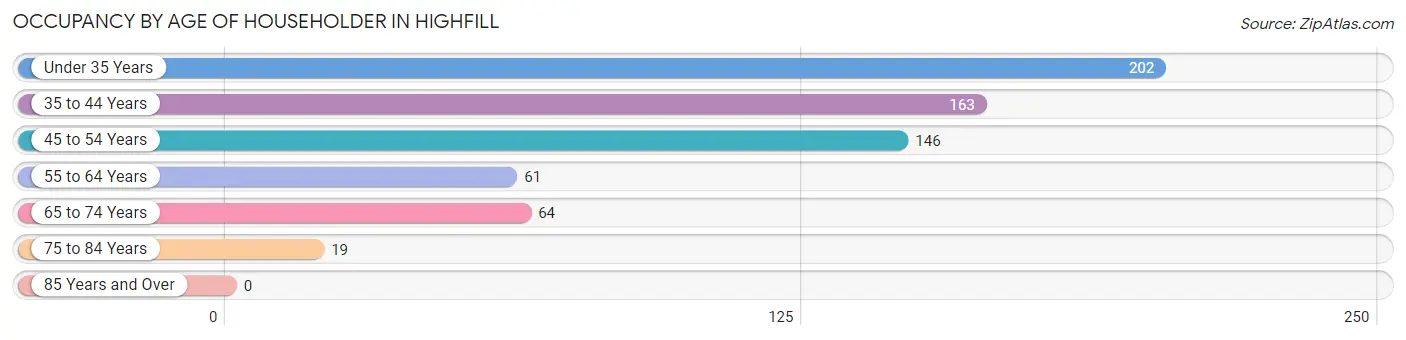
| Age Bracket | # Households | % Households |
| Under 35 Years | 202 | 30.8% |
| 35 to 44 Years | 163 | 24.9% |
| 45 to 54 Years | 146 | 22.3% |
| 55 to 64 Years | 61 | 9.3% |
| 65 to 74 Years | 64 | 9.8% |
| 75 to 84 Years | 19 | 2.9% |
| 85 Years and Over | 0 | 0.0% |
| Total | 655 | 100.0% |
Housing Finances in Highfill
Median Income by Occupancy in Highfill
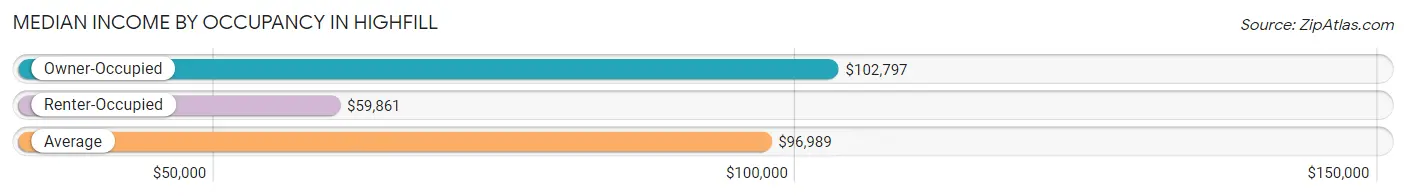
| Occupancy Type | # Households | Median Income |
| Owner-Occupied | 556 (84.9%) | $102,797 |
| Renter-Occupied | 99 (15.1%) | $59,861 |
| Average | 655 (100.0%) | $96,989 |
Occupancy by Householder Income Bracket in Highfill
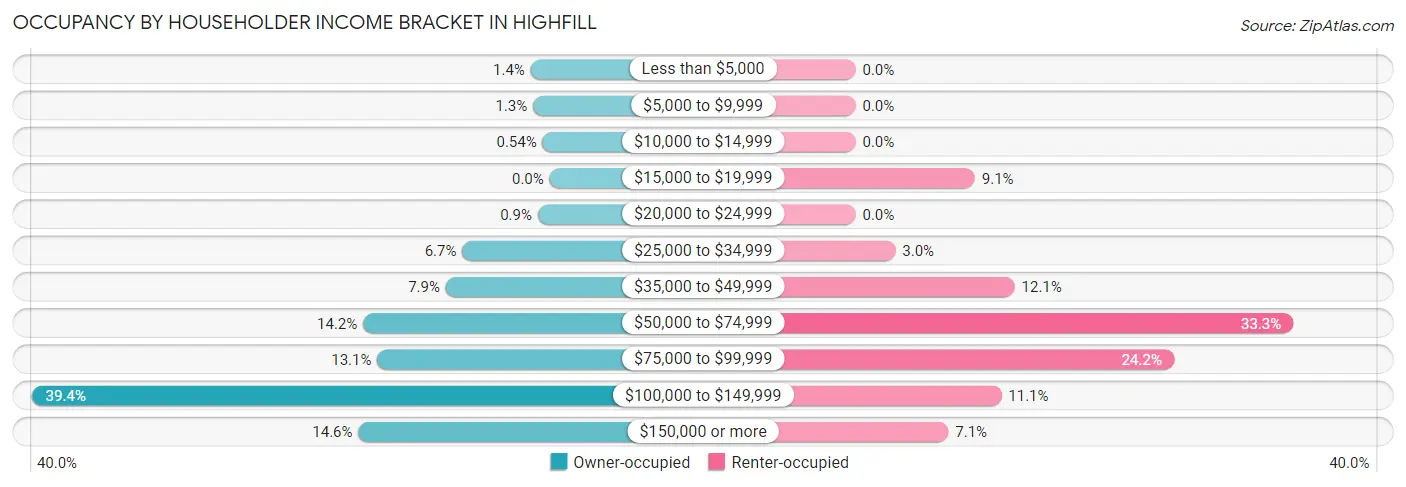
| Income Bracket | Owner-occupied | Renter-occupied |
| Less than $5,000 | 8 (1.4%) | 0 (0.0%) |
| $5,000 to $9,999 | 7 (1.3%) | 0 (0.0%) |
| $10,000 to $14,999 | 3 (0.5%) | 0 (0.0%) |
| $15,000 to $19,999 | 0 (0.0%) | 9 (9.1%) |
| $20,000 to $24,999 | 5 (0.9%) | 0 (0.0%) |
| $25,000 to $34,999 | 37 (6.7%) | 3 (3.0%) |
| $35,000 to $49,999 | 44 (7.9%) | 12 (12.1%) |
| $50,000 to $74,999 | 79 (14.2%) | 33 (33.3%) |
| $75,000 to $99,999 | 73 (13.1%) | 24 (24.2%) |
| $100,000 to $149,999 | 219 (39.4%) | 11 (11.1%) |
| $150,000 or more | 81 (14.6%) | 7 (7.1%) |
| Total | 556 (100.0%) | 99 (100.0%) |
Monthly Housing Cost Tiers in Highfill
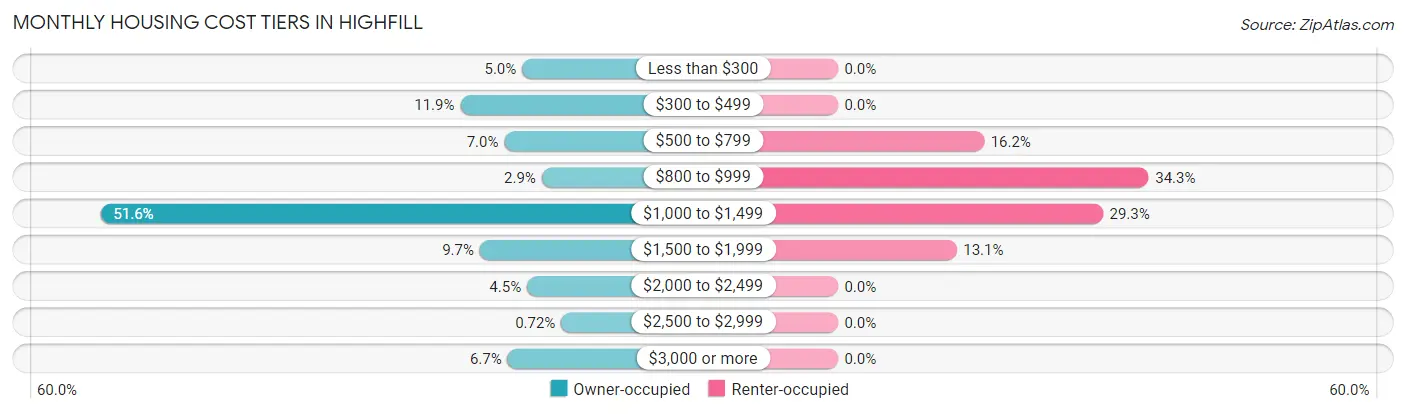
| Monthly Cost | Owner-occupied | Renter-occupied |
| Less than $300 | 28 (5.0%) | 0 (0.0%) |
| $300 to $499 | 66 (11.9%) | 0 (0.0%) |
| $500 to $799 | 39 (7.0%) | 16 (16.2%) |
| $800 to $999 | 16 (2.9%) | 34 (34.3%) |
| $1,000 to $1,499 | 287 (51.6%) | 29 (29.3%) |
| $1,500 to $1,999 | 54 (9.7%) | 13 (13.1%) |
| $2,000 to $2,499 | 25 (4.5%) | 0 (0.0%) |
| $2,500 to $2,999 | 4 (0.7%) | 0 (0.0%) |
| $3,000 or more | 37 (6.7%) | 0 (0.0%) |
| Total | 556 (100.0%) | 99 (100.0%) |
Physical Housing Characteristics in Highfill
Housing Structures in Highfill
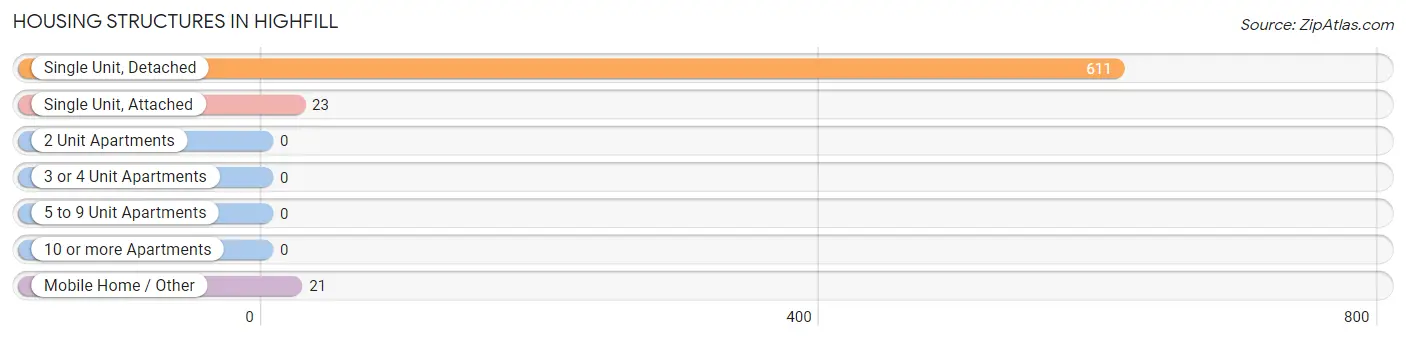
| Structure Type | # Housing Units | % Housing Units |
| Single Unit, Detached | 611 | 93.3% |
| Single Unit, Attached | 23 | 3.5% |
| 2 Unit Apartments | 0 | 0.0% |
| 3 or 4 Unit Apartments | 0 | 0.0% |
| 5 to 9 Unit Apartments | 0 | 0.0% |
| 10 or more Apartments | 0 | 0.0% |
| Mobile Home / Other | 21 | 3.2% |
| Total | 655 | 100.0% |
Housing Structures by Occupancy in Highfill
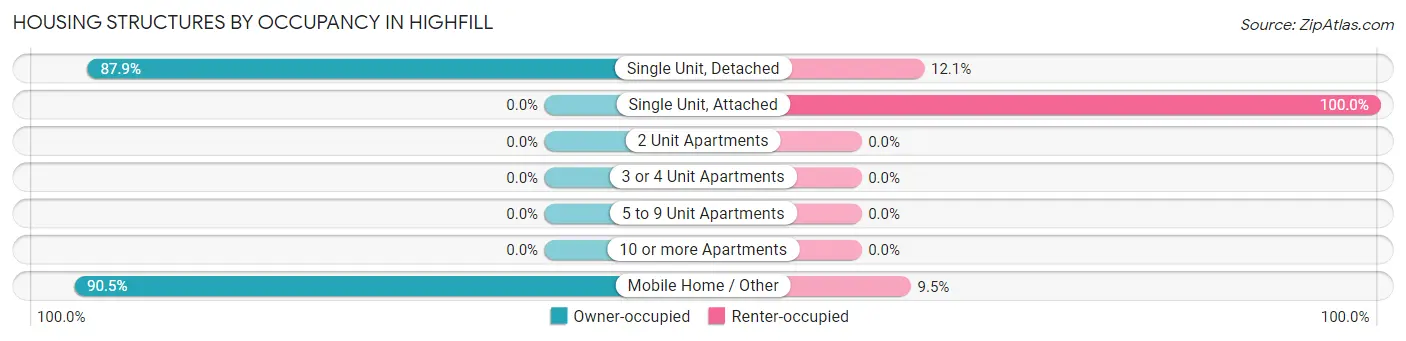
| Structure Type | Owner-occupied | Renter-occupied |
| Single Unit, Detached | 537 (87.9%) | 74 (12.1%) |
| Single Unit, Attached | 0 (0.0%) | 23 (100.0%) |
| 2 Unit Apartments | 0 (0.0%) | 0 (0.0%) |
| 3 or 4 Unit Apartments | 0 (0.0%) | 0 (0.0%) |
| 5 to 9 Unit Apartments | 0 (0.0%) | 0 (0.0%) |
| 10 or more Apartments | 0 (0.0%) | 0 (0.0%) |
| Mobile Home / Other | 19 (90.5%) | 2 (9.5%) |
| Total | 556 (84.9%) | 99 (15.1%) |
Housing Structures by Number of Rooms in Highfill
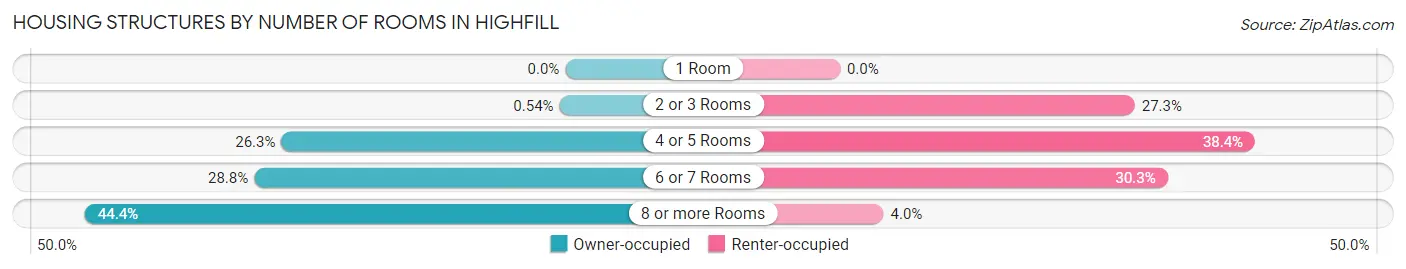
| Number of Rooms | Owner-occupied | Renter-occupied |
| 1 Room | 0 (0.0%) | 0 (0.0%) |
| 2 or 3 Rooms | 3 (0.5%) | 27 (27.3%) |
| 4 or 5 Rooms | 146 (26.3%) | 38 (38.4%) |
| 6 or 7 Rooms | 160 (28.8%) | 30 (30.3%) |
| 8 or more Rooms | 247 (44.4%) | 4 (4.0%) |
| Total | 556 (100.0%) | 99 (100.0%) |
Housing Structure by Heating Type in Highfill
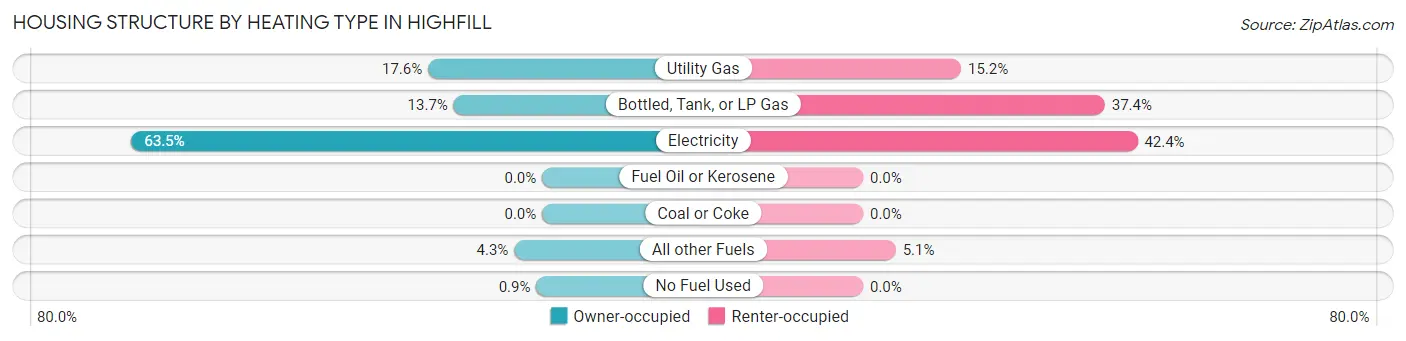
| Heating Type | Owner-occupied | Renter-occupied |
| Utility Gas | 98 (17.6%) | 15 (15.1%) |
| Bottled, Tank, or LP Gas | 76 (13.7%) | 37 (37.4%) |
| Electricity | 353 (63.5%) | 42 (42.4%) |
| Fuel Oil or Kerosene | 0 (0.0%) | 0 (0.0%) |
| Coal or Coke | 0 (0.0%) | 0 (0.0%) |
| All other Fuels | 24 (4.3%) | 5 (5.1%) |
| No Fuel Used | 5 (0.9%) | 0 (0.0%) |
| Total | 556 (100.0%) | 99 (100.0%) |
Household Vehicle Usage in Highfill
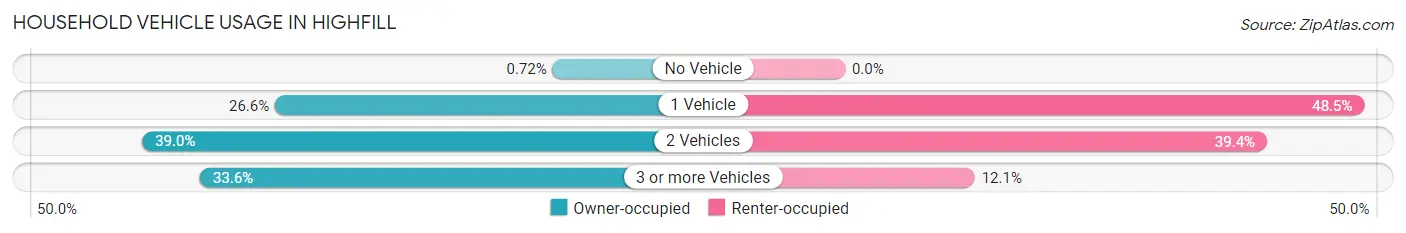
| Vehicles per Household | Owner-occupied | Renter-occupied |
| No Vehicle | 4 (0.7%) | 0 (0.0%) |
| 1 Vehicle | 148 (26.6%) | 48 (48.5%) |
| 2 Vehicles | 217 (39.0%) | 39 (39.4%) |
| 3 or more Vehicles | 187 (33.6%) | 12 (12.1%) |
| Total | 556 (100.0%) | 99 (100.0%) |
Real Estate & Mortgages in Highfill
Real Estate and Mortgage Overview in Highfill
| Characteristic | Without Mortgage | With Mortgage |
| Housing Units | 97 | 459 |
| Median Property Value | $231,900 | $199,900 |
| Median Household Income | $85,417 | $68 |
| Monthly Housing Costs | $408 | $37 |
| Real Estate Taxes | $1,125 | $25 |
Property Value by Mortgage Status in Highfill
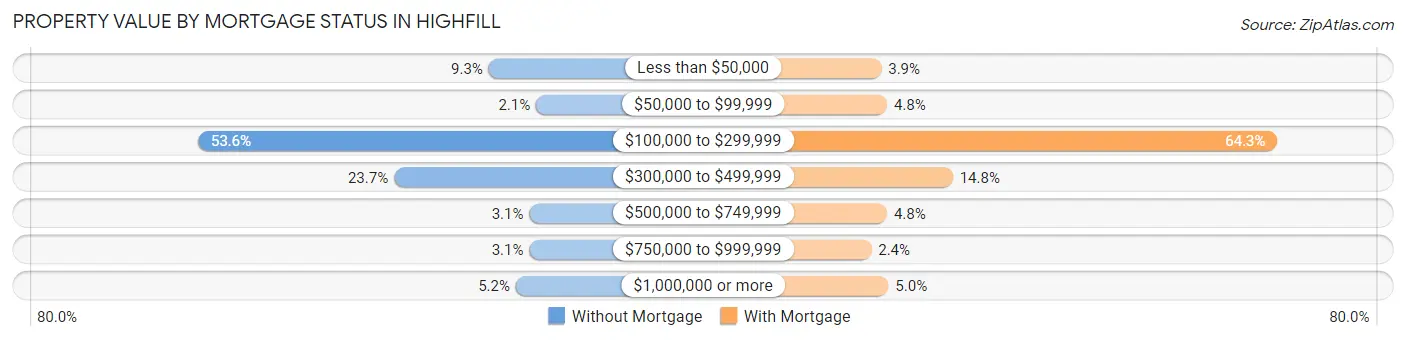
| Property Value | Without Mortgage | With Mortgage |
| Less than $50,000 | 9 (9.3%) | 18 (3.9%) |
| $50,000 to $99,999 | 2 (2.1%) | 22 (4.8%) |
| $100,000 to $299,999 | 52 (53.6%) | 295 (64.3%) |
| $300,000 to $499,999 | 23 (23.7%) | 68 (14.8%) |
| $500,000 to $749,999 | 3 (3.1%) | 22 (4.8%) |
| $750,000 to $999,999 | 3 (3.1%) | 11 (2.4%) |
| $1,000,000 or more | 5 (5.1%) | 23 (5.0%) |
| Total | 97 (100.0%) | 459 (100.0%) |
Household Income by Mortgage Status in Highfill
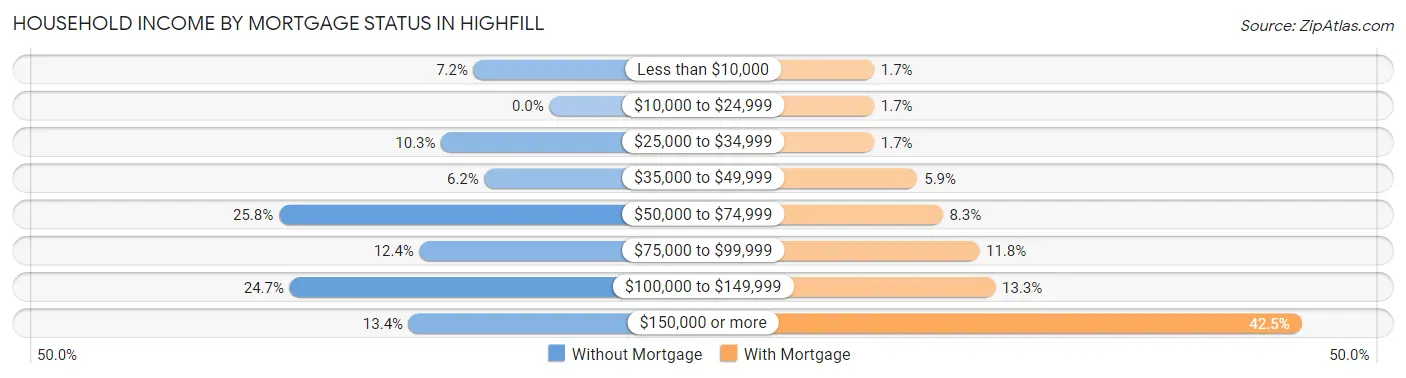
| Household Income | Without Mortgage | With Mortgage |
| Less than $10,000 | 7 (7.2%) | 8 (1.7%) |
| $10,000 to $24,999 | 0 (0.0%) | 8 (1.7%) |
| $25,000 to $34,999 | 10 (10.3%) | 8 (1.7%) |
| $35,000 to $49,999 | 6 (6.2%) | 27 (5.9%) |
| $50,000 to $74,999 | 25 (25.8%) | 38 (8.3%) |
| $75,000 to $99,999 | 12 (12.4%) | 54 (11.8%) |
| $100,000 to $149,999 | 24 (24.7%) | 61 (13.3%) |
| $150,000 or more | 13 (13.4%) | 195 (42.5%) |
| Total | 97 (100.0%) | 459 (100.0%) |
Property Value to Household Income Ratio in Highfill
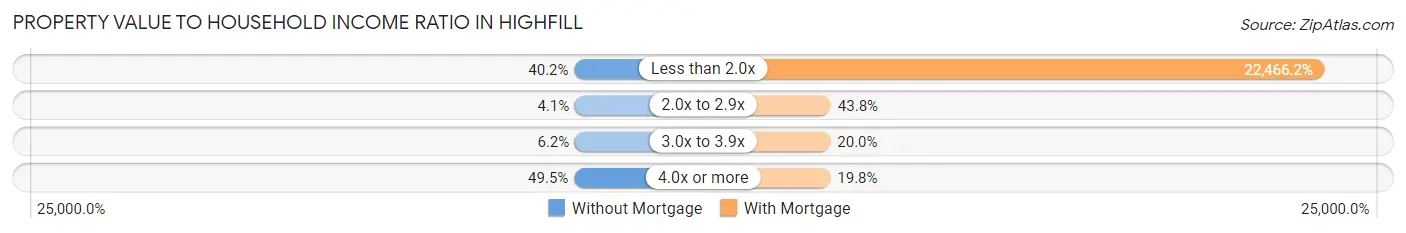
| Value-to-Income Ratio | Without Mortgage | With Mortgage |
| Less than 2.0x | 39 (40.2%) | 103,120 (22,466.2%) |
| 2.0x to 2.9x | 4 (4.1%) | 201 (43.8%) |
| 3.0x to 3.9x | 6 (6.2%) | 92 (20.0%) |
| 4.0x or more | 48 (49.5%) | 91 (19.8%) |
| Total | 97 (100.0%) | 459 (100.0%) |
Real Estate Taxes by Mortgage Status in Highfill
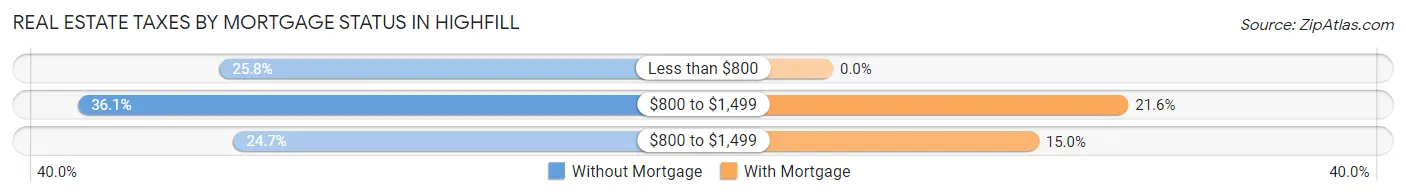
| Property Taxes | Without Mortgage | With Mortgage |
| Less than $800 | 25 (25.8%) | 0 (0.0%) |
| $800 to $1,499 | 35 (36.1%) | 99 (21.6%) |
| $800 to $1,499 | 24 (24.7%) | 69 (15.0%) |
| Total | 97 (100.0%) | 459 (100.0%) |
Health & Disability in Highfill
Health Insurance Coverage by Age in Highfill
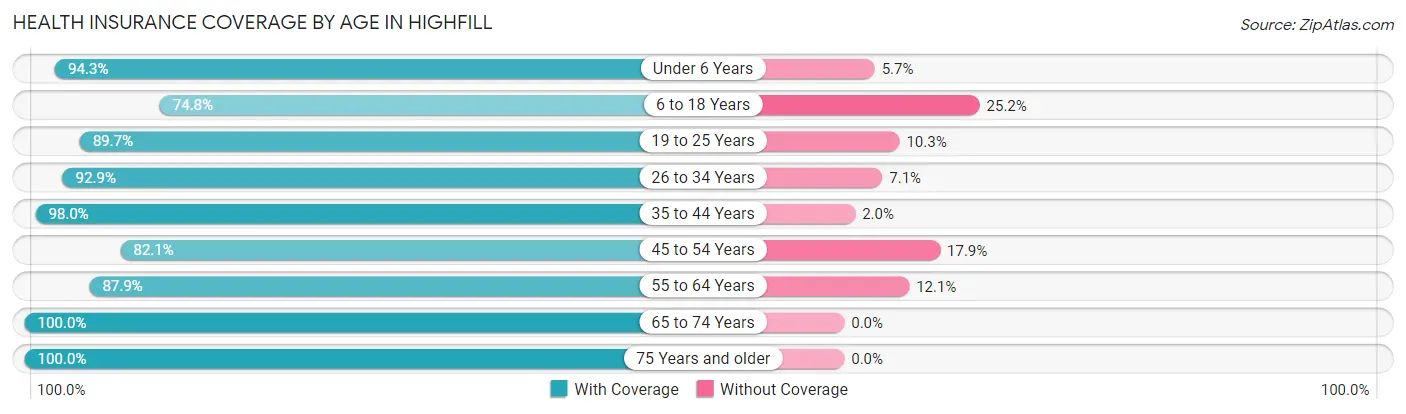
| Age Bracket | With Coverage | Without Coverage |
| Under 6 Years | 83 (94.3%) | 5 (5.7%) |
| 6 to 18 Years | 246 (74.8%) | 83 (25.2%) |
| 19 to 25 Years | 122 (89.7%) | 14 (10.3%) |
| 26 to 34 Years | 354 (92.9%) | 27 (7.1%) |
| 35 to 44 Years | 241 (98.0%) | 5 (2.0%) |
| 45 to 54 Years | 193 (82.1%) | 42 (17.9%) |
| 55 to 64 Years | 109 (87.9%) | 15 (12.1%) |
| 65 to 74 Years | 110 (100.0%) | 0 (0.0%) |
| 75 Years and older | 27 (100.0%) | 0 (0.0%) |
| Total | 1,485 (88.6%) | 191 (11.4%) |
Health Insurance Coverage by Citizenship Status in Highfill
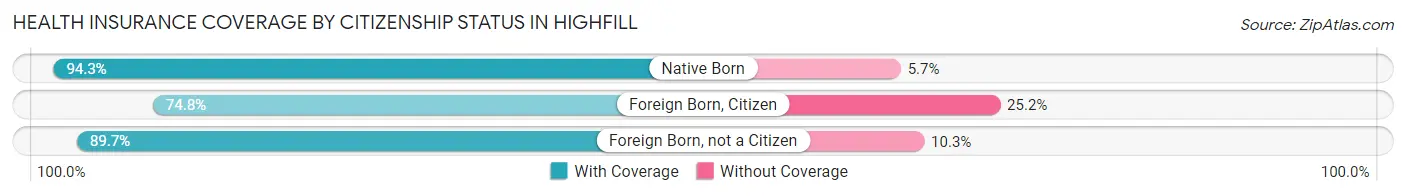
| Citizenship Status | With Coverage | Without Coverage |
| Native Born | 83 (94.3%) | 5 (5.7%) |
| Foreign Born, Citizen | 246 (74.8%) | 83 (25.2%) |
| Foreign Born, not a Citizen | 122 (89.7%) | 14 (10.3%) |
Health Insurance Coverage by Household Income in Highfill
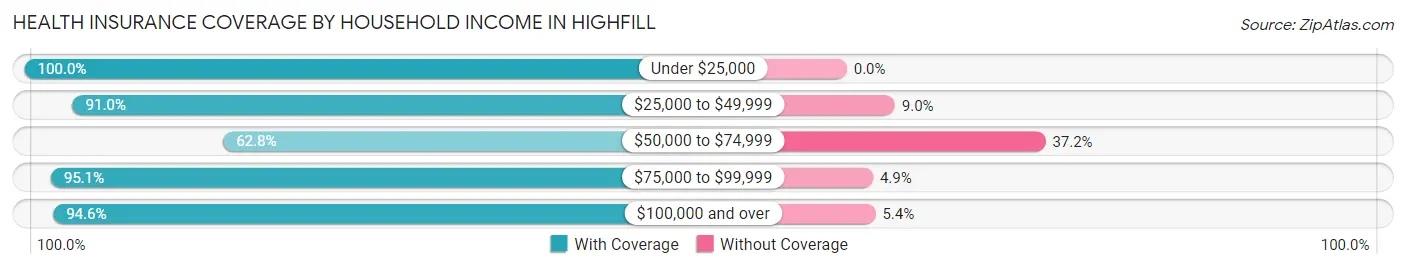
| Household Income | With Coverage | Without Coverage |
| Under $25,000 | 64 (100.0%) | 0 (0.0%) |
| $25,000 to $49,999 | 192 (91.0%) | 19 (9.0%) |
| $50,000 to $74,999 | 194 (62.8%) | 115 (37.2%) |
| $75,000 to $99,999 | 310 (95.1%) | 16 (4.9%) |
| $100,000 and over | 722 (94.6%) | 41 (5.4%) |
Public vs Private Health Insurance Coverage by Age in Highfill
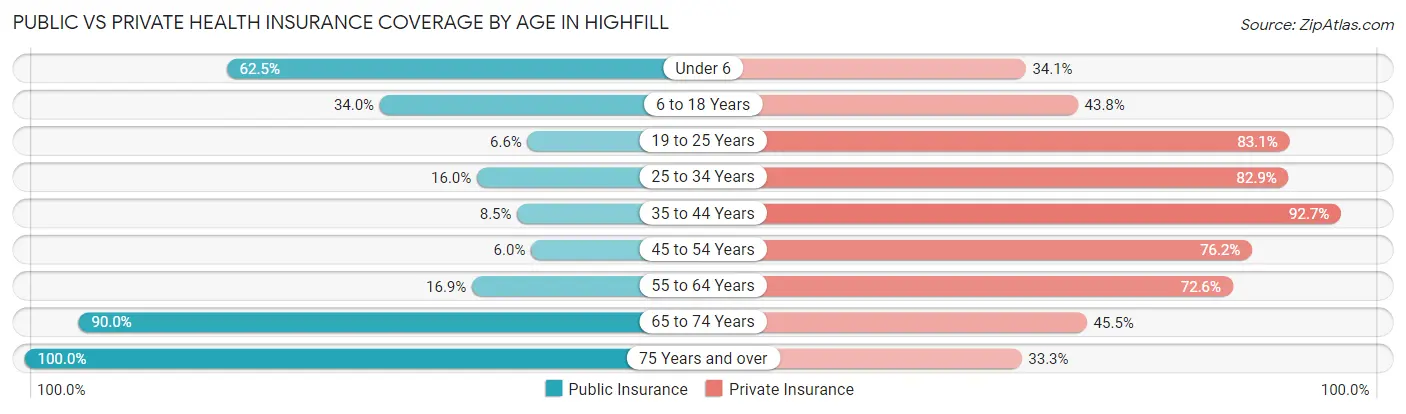
| Age Bracket | Public Insurance | Private Insurance |
| Under 6 | 55 (62.5%) | 30 (34.1%) |
| 6 to 18 Years | 112 (34.0%) | 144 (43.8%) |
| 19 to 25 Years | 9 (6.6%) | 113 (83.1%) |
| 25 to 34 Years | 61 (16.0%) | 316 (82.9%) |
| 35 to 44 Years | 21 (8.5%) | 228 (92.7%) |
| 45 to 54 Years | 14 (6.0%) | 179 (76.2%) |
| 55 to 64 Years | 21 (16.9%) | 90 (72.6%) |
| 65 to 74 Years | 99 (90.0%) | 50 (45.5%) |
| 75 Years and over | 27 (100.0%) | 9 (33.3%) |
| Total | 419 (25.0%) | 1,159 (69.2%) |
Disability Status by Sex by Age in Highfill
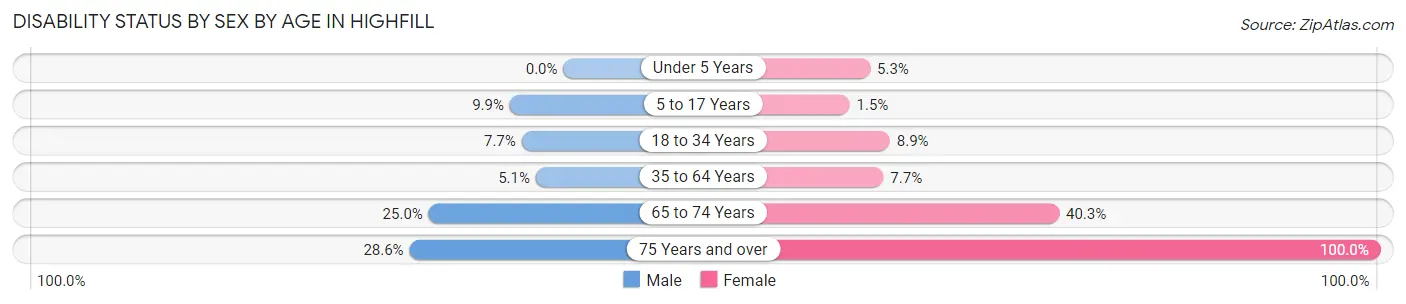
| Age Bracket | Male | Female |
| Under 5 Years | 0 (0.0%) | 2 (5.3%) |
| 5 to 17 Years | 18 (9.9%) | 2 (1.5%) |
| 18 to 34 Years | 25 (7.7%) | 19 (8.9%) |
| 35 to 64 Years | 17 (5.1%) | 21 (7.7%) |
| 65 to 74 Years | 12 (25.0%) | 25 (40.3%) |
| 75 Years and over | 6 (28.6%) | 6 (100.0%) |
Disability Class by Sex by Age in Highfill
Disability Class: Hearing Difficulty
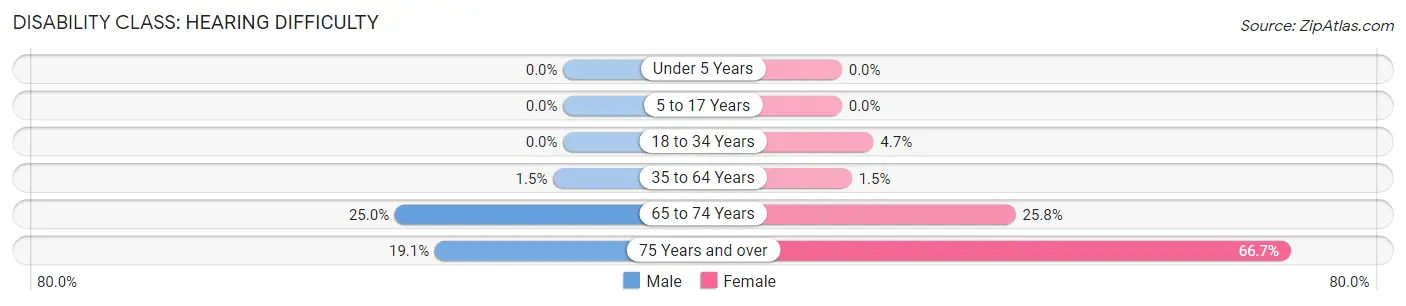
| Age Bracket | Male | Female |
| Under 5 Years | 0 (0.0%) | 0 (0.0%) |
| 5 to 17 Years | 0 (0.0%) | 0 (0.0%) |
| 18 to 34 Years | 0 (0.0%) | 10 (4.7%) |
| 35 to 64 Years | 5 (1.5%) | 4 (1.5%) |
| 65 to 74 Years | 12 (25.0%) | 16 (25.8%) |
| 75 Years and over | 4 (19.1%) | 4 (66.7%) |
Disability Class: Vision Difficulty
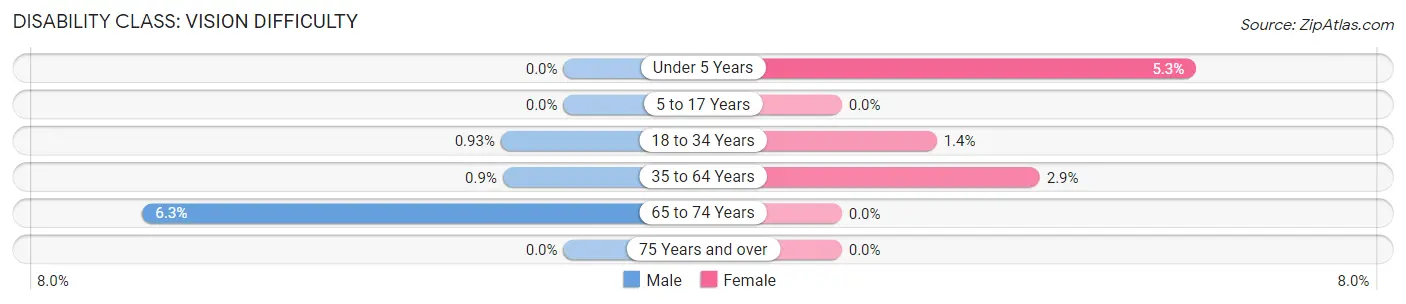
| Age Bracket | Male | Female |
| Under 5 Years | 0 (0.0%) | 2 (5.3%) |
| 5 to 17 Years | 0 (0.0%) | 0 (0.0%) |
| 18 to 34 Years | 3 (0.9%) | 3 (1.4%) |
| 35 to 64 Years | 3 (0.9%) | 8 (2.9%) |
| 65 to 74 Years | 3 (6.2%) | 0 (0.0%) |
| 75 Years and over | 0 (0.0%) | 0 (0.0%) |
Disability Class: Cognitive Difficulty
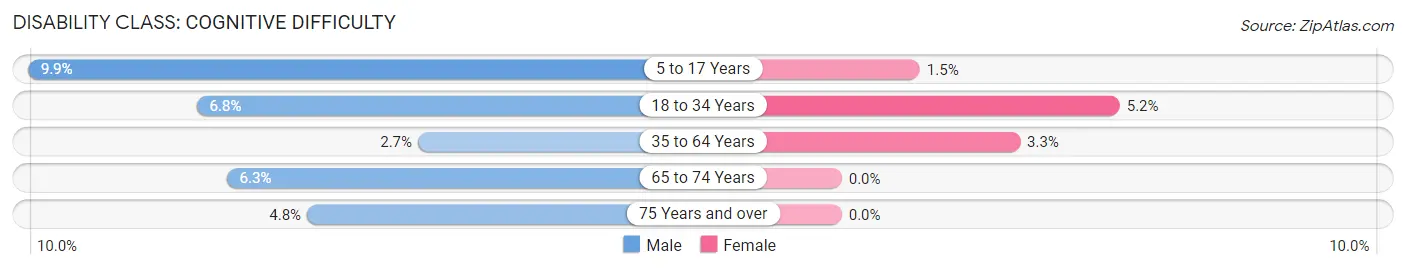
| Age Bracket | Male | Female |
| 5 to 17 Years | 18 (9.9%) | 2 (1.5%) |
| 18 to 34 Years | 22 (6.8%) | 11 (5.2%) |
| 35 to 64 Years | 9 (2.7%) | 9 (3.3%) |
| 65 to 74 Years | 3 (6.2%) | 0 (0.0%) |
| 75 Years and over | 1 (4.8%) | 0 (0.0%) |
Disability Class: Ambulatory Difficulty
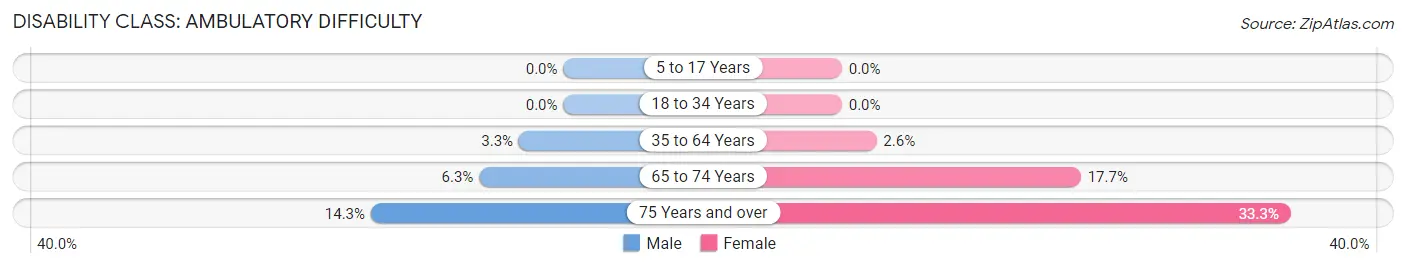
| Age Bracket | Male | Female |
| 5 to 17 Years | 0 (0.0%) | 0 (0.0%) |
| 18 to 34 Years | 0 (0.0%) | 0 (0.0%) |
| 35 to 64 Years | 11 (3.3%) | 7 (2.6%) |
| 65 to 74 Years | 3 (6.2%) | 11 (17.7%) |
| 75 Years and over | 3 (14.3%) | 2 (33.3%) |
Disability Class: Self-Care Difficulty
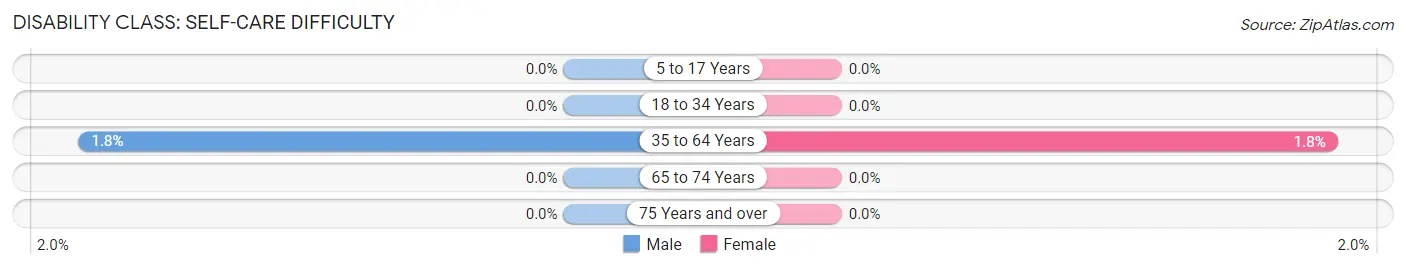
| Age Bracket | Male | Female |
| 5 to 17 Years | 0 (0.0%) | 0 (0.0%) |
| 18 to 34 Years | 0 (0.0%) | 0 (0.0%) |
| 35 to 64 Years | 6 (1.8%) | 5 (1.8%) |
| 65 to 74 Years | 0 (0.0%) | 0 (0.0%) |
| 75 Years and over | 0 (0.0%) | 0 (0.0%) |
Technology Access in Highfill
Computing Device Access in Highfill
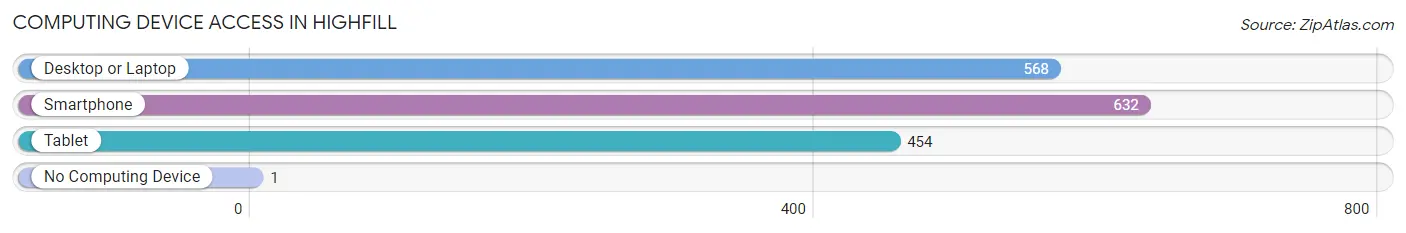
| Device Type | # Households | % Households |
| Desktop or Laptop | 568 | 86.7% |
| Smartphone | 632 | 96.5% |
| Tablet | 454 | 69.3% |
| No Computing Device | 1 | 0.2% |
| Total | 655 | 100.0% |
Internet Access in Highfill
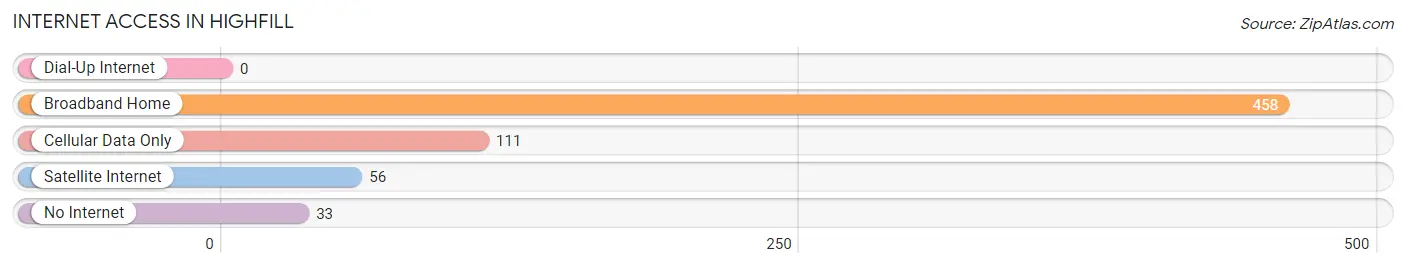
| Internet Type | # Households | % Households |
| Dial-Up Internet | 0 | 0.0% |
| Broadband Home | 458 | 69.9% |
| Cellular Data Only | 111 | 17.0% |
| Satellite Internet | 56 | 8.6% |
| No Internet | 33 | 5.0% |
| Total | 655 | 100.0% |
Highfill Summary
Highfill is a town located in Benton County, Arkansas. It is situated in the northwest corner of the state, just south of the Arkansas-Oklahoma border. The town was founded in 1883 and has a population of 1,845 as of the 2010 census.
Geography
Highfill is located at 36°20'45" North, 94°25'45" West (36.3458, -94.4261). It is situated in the northwest corner of the state, just south of the Arkansas-Oklahoma border. The town is located in the Ozark Mountains and is surrounded by rolling hills and wooded areas. The nearest major city is Fayetteville, which is located about 20 miles to the south.
The town has a total area of 1.3 square miles, all of which is land. The elevation of Highfill is 1,072 feet above sea level.
History
Highfill was founded in 1883 by a group of settlers from Missouri. The town was named after the Highfill family, who were among the first settlers. The town was originally a farming community, but it soon developed into a small trading center.
In the early 1900s, the town began to grow and prosper. The first school was built in 1910, and the first bank opened in 1912. The town also had a post office, a general store, and a few other businesses.
In the 1920s, the town experienced a period of growth and development. The population increased from about 500 in 1920 to over 1,000 in 1930. During this time, the town also saw the construction of a new school, a new bank, and several other businesses.
Economy
Highfill’s economy is largely based on agriculture. The town is home to several farms, which produce a variety of crops, including corn, soybeans, wheat, and hay. The town also has a few small businesses, including a grocery store, a hardware store, and a few restaurants.
Demographics
As of the 2010 census, Highfill had a population of 1,845. The racial makeup of the town was 95.3% White, 0.7% African American, 0.3% Native American, 0.2% Asian, 0.1% Pacific Islander, 1.2% from other races, and 2.3% from two or more races. Hispanic or Latino of any race were 3.2% of the population.
The median household income in Highfill was $37,917, and the median family income was $45,625. The per capita income was $18,945. About 11.2% of families and 14.2% of the population were below the poverty line, including 18.2% of those under age 18 and 8.3% of those age 65 or over.
Highfill is served by the Bentonville School District. The town has one elementary school, one middle school, and one high school. The town also has a public library and a few churches.
Common Questions
What is Per Capita Income in Highfill?
Per Capita income in Highfill is $41,192.
What is the Median Family Income in Highfill?
Median Family Income in Highfill is $95,114.
What is the Median Household income in Highfill?
Median Household Income in Highfill is $96,989.
What is Income or Wage Gap in Highfill?
Income or Wage Gap in Highfill is 46.2%.
Women in Highfill earn 53.8 cents for every dollar earned by a man.
What is Inequality or Gini Index in Highfill?
Inequality or Gini Index in Highfill is 0.36.
What is the Total Population of Highfill?
Total Population of Highfill is 1,679.
What is the Total Male Population of Highfill?
Total Male Population of Highfill is 949.
What is the Total Female Population of Highfill?
Total Female Population of Highfill is 730.
What is the Ratio of Males per 100 Females in Highfill?
There are 130.00 Males per 100 Females in Highfill.
What is the Ratio of Females per 100 Males in Highfill?
There are 76.92 Females per 100 Males in Highfill.
What is the Median Population Age in Highfill?
Median Population Age in Highfill is 32.1 Years.
What is the Average Family Size in Highfill
Average Family Size in Highfill is 3.2 People.
What is the Average Household Size in Highfill
Average Household Size in Highfill is 2.5 People.
How Large is the Labor Force in Highfill?
There are 990 People in the Labor Forcein in Highfill.
What is the Percentage of People in the Labor Force in Highfill?
75.1% of People are in the Labor Force in Highfill.
What is the Unemployment Rate in Highfill?
Unemployment Rate in Highfill is 0.7%.