Kibler, AR Map & Demographics
Kibler Map
Kibler Overview
$28,194
PER CAPITA INCOME
$70,833
AVG FAMILY INCOME
$76,667
AVG HOUSEHOLD INCOME
49.6%
WAGE / INCOME GAP [ % ]
50.4¢/ $1
WAGE / INCOME GAP [ $ ]
0.35
INEQUALITY / GINI INDEX
1,141
TOTAL POPULATION
555
MALE POPULATION
586
FEMALE POPULATION
94.71
MALES / 100 FEMALES
105.59
FEMALES / 100 MALES
36.5
MEDIAN AGE
2.9
AVG FAMILY SIZE
2.8
AVG HOUSEHOLD SIZE
463
LABOR FORCE [ PEOPLE ]
54.2%
PERCENT IN LABOR FORCE
4.3%
UNEMPLOYMENT RATE
Income in Kibler
Income Overview in Kibler
Per Capita Income in Kibler is $28,194, while median incomes of families and households are $70,833 and $76,667 respectively.
| Characteristic | Number | Measure |
| Per Capita Income | 1,141 | $28,194 |
| Median Family Income | 352 | $70,833 |
| Mean Family Income | 352 | $84,201 |
| Median Household Income | 406 | $76,667 |
| Mean Household Income | 406 | $82,570 |
| Income Deficit | 352 | $0 |
| Wage / Income Gap (%) | 1,141 | 49.65% |
| Wage / Income Gap ($) | 1,141 | 50.35¢ per $1 |
| Gini / Inequality Index | 1,141 | 0.35 |
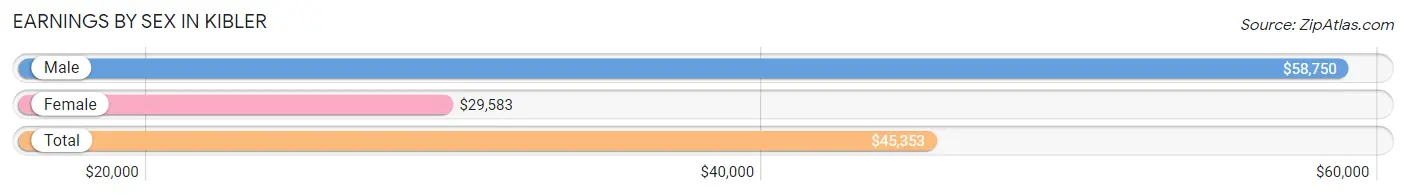
Earnings by Sex in Kibler
Average Earnings in Kibler are $45,353, $58,750 for men and $29,583 for women, a difference of 49.6%.
| Sex | Number | Average Earnings |
| Male | 272 (56.1%) | $58,750 |
| Female | 213 (43.9%) | $29,583 |
| Total | 485 (100.0%) | $45,353 |
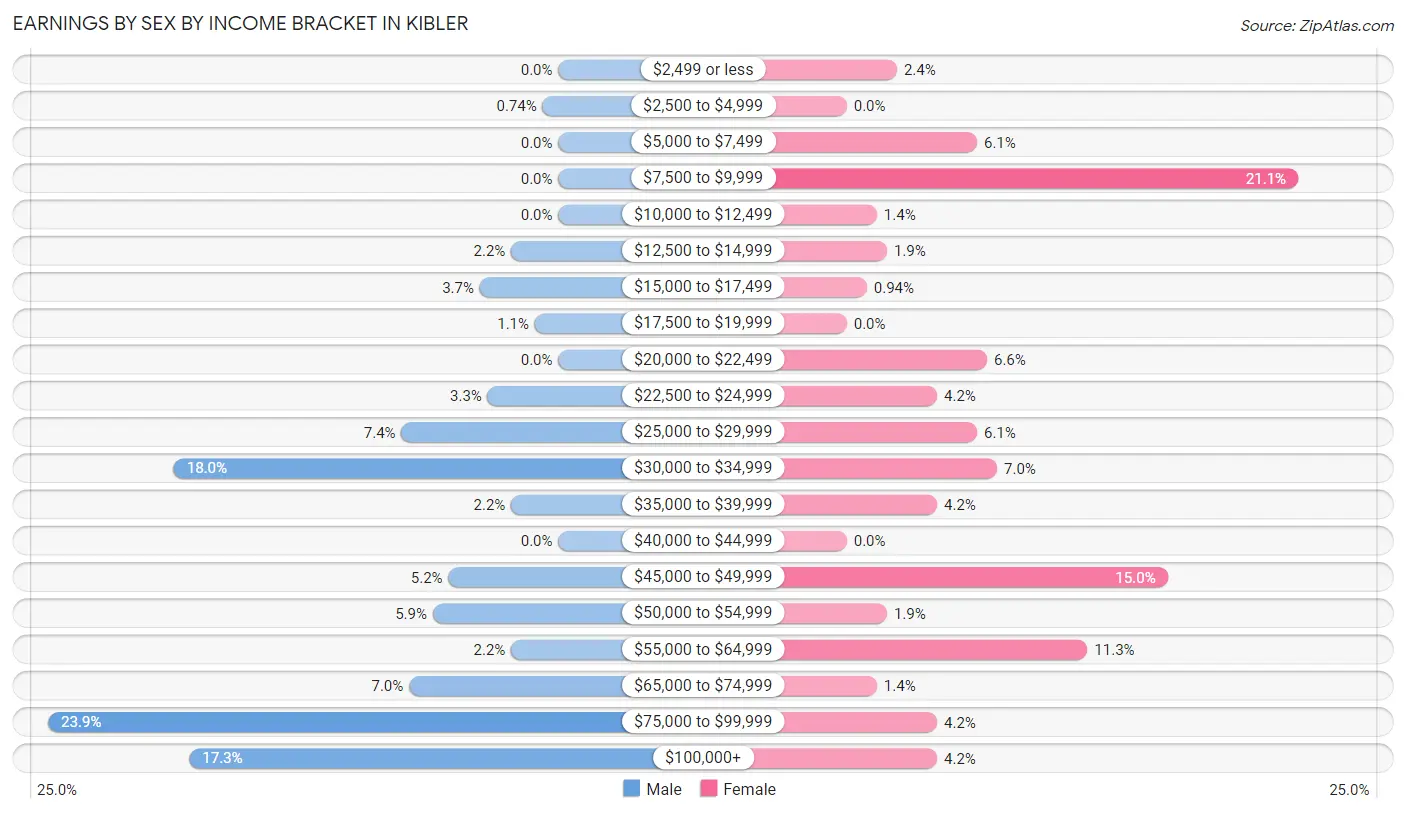
Earnings by Sex by Income Bracket in Kibler
The most common earnings brackets in Kibler are $75,000 to $99,999 for men (65 | 23.9%) and $7,500 to $9,999 for women (45 | 21.1%).
| Income | Male | Female |
| $2,499 or less | 0 (0.0%) | 5 (2.4%) |
| $2,500 to $4,999 | 2 (0.7%) | 0 (0.0%) |
| $5,000 to $7,499 | 0 (0.0%) | 13 (6.1%) |
| $7,500 to $9,999 | 0 (0.0%) | 45 (21.1%) |
| $10,000 to $12,499 | 0 (0.0%) | 3 (1.4%) |
| $12,500 to $14,999 | 6 (2.2%) | 4 (1.9%) |
| $15,000 to $17,499 | 10 (3.7%) | 2 (0.9%) |
| $17,500 to $19,999 | 3 (1.1%) | 0 (0.0%) |
| $20,000 to $22,499 | 0 (0.0%) | 14 (6.6%) |
| $22,500 to $24,999 | 9 (3.3%) | 9 (4.2%) |
| $25,000 to $29,999 | 20 (7.3%) | 13 (6.1%) |
| $30,000 to $34,999 | 49 (18.0%) | 15 (7.0%) |
| $35,000 to $39,999 | 6 (2.2%) | 9 (4.2%) |
| $40,000 to $44,999 | 0 (0.0%) | 0 (0.0%) |
| $45,000 to $49,999 | 14 (5.1%) | 32 (15.0%) |
| $50,000 to $54,999 | 16 (5.9%) | 4 (1.9%) |
| $55,000 to $64,999 | 6 (2.2%) | 24 (11.3%) |
| $65,000 to $74,999 | 19 (7.0%) | 3 (1.4%) |
| $75,000 to $99,999 | 65 (23.9%) | 9 (4.2%) |
| $100,000+ | 47 (17.3%) | 9 (4.2%) |
| Total | 272 (100.0%) | 213 (100.0%) |
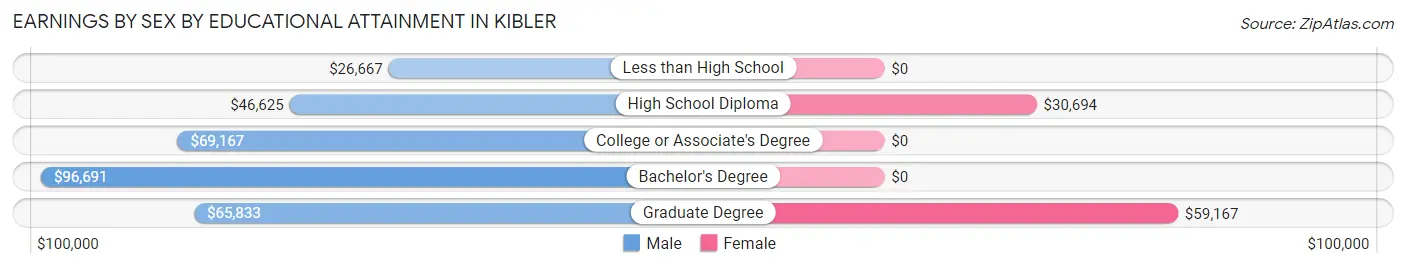
Earnings by Sex by Educational Attainment in Kibler
Average earnings in Kibler are $60,000 for men and $31,528 for women, a difference of 47.4%. Men with an educational attainment of bachelor's degree enjoy the highest average annual earnings of $96,691, while those with less than high school education earn the least with $26,667. Women with an educational attainment of graduate degree earn the most with the average annual earnings of $59,167, while those with high school diploma education have the smallest earnings of $30,694.
| Educational Attainment | Male Income | Female Income |
| Less than High School | $26,667 | $0 |
| High School Diploma | $46,625 | $30,694 |
| College or Associate's Degree | $69,167 | $0 |
| Bachelor's Degree | $96,691 | $0 |
| Graduate Degree | $65,833 | $59,167 |
| Total | $60,000 | $31,528 |
Family Income in Kibler
Family Income Brackets in Kibler
According to the Kibler family income data, there are 132 families falling into the $100,000 to $149,999 income range, which is the most common income bracket and makes up 37.5% of all families.
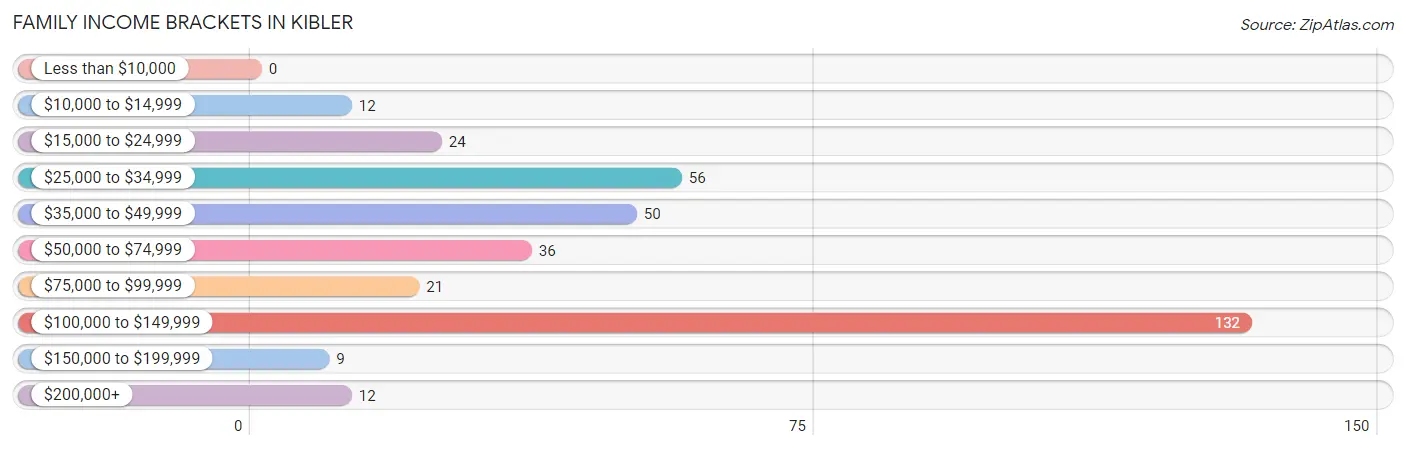
| Income Bracket | # Families | % Families |
| Less than $10,000 | 0 | 0.0% |
| $10,000 to $14,999 | 12 | 3.4% |
| $15,000 to $24,999 | 24 | 6.8% |
| $25,000 to $34,999 | 56 | 15.9% |
| $35,000 to $49,999 | 50 | 14.2% |
| $50,000 to $74,999 | 36 | 10.2% |
| $75,000 to $99,999 | 21 | 6.0% |
| $100,000 to $149,999 | 132 | 37.5% |
| $150,000 to $199,999 | 9 | 2.6% |
| $200,000+ | 12 | 3.4% |
Family Income by Famaliy Size in Kibler
5-person families (29 | 8.2%) account for the highest median family income in Kibler with $100,417 per family, while 2-person families (130 | 36.9%) have the highest median income of $23,500 per family member.
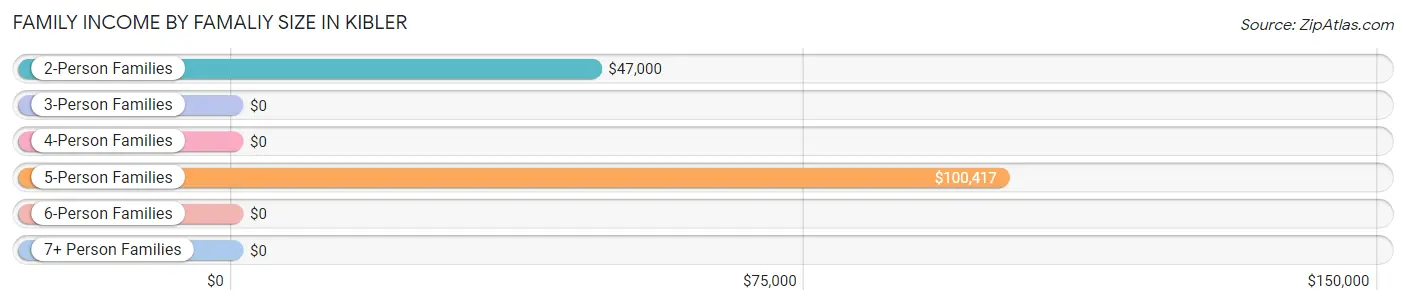
| Income Bracket | # Families | Median Income |
| 2-Person Families | 130 (36.9%) | $47,000 |
| 3-Person Families | 63 (17.9%) | $0 |
| 4-Person Families | 113 (32.1%) | $0 |
| 5-Person Families | 29 (8.2%) | $100,417 |
| 6-Person Families | 14 (4.0%) | $0 |
| 7+ Person Families | 3 (0.9%) | $0 |
| Total | 352 (100.0%) | $70,833 |
Family Income by Number of Earners in Kibler
The median family income in Kibler is $70,833, with families comprising 3+ earners (9) having the highest median family income of $133,750, while families with 1 earner (115) have the lowest median family income of $34,583, accounting for 2.6% and 32.7% of families, respectively.
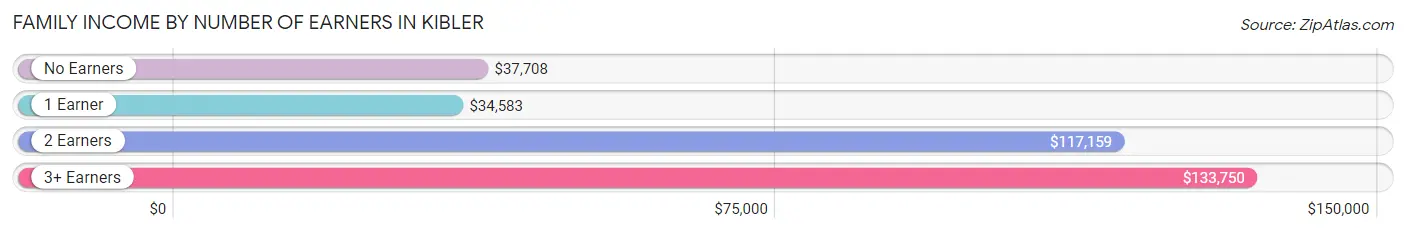
| Number of Earners | # Families | Median Income |
| No Earners | 79 (22.4%) | $37,708 |
| 1 Earner | 115 (32.7%) | $34,583 |
| 2 Earners | 149 (42.3%) | $117,159 |
| 3+ Earners | 9 (2.6%) | $133,750 |
| Total | 352 (100.0%) | $70,833 |
Household Income in Kibler
Household Income Brackets in Kibler
With 131 households falling in the category, the $100,000 to $149,999 income range is the most frequent in Kibler, accounting for 32.3% of all households.
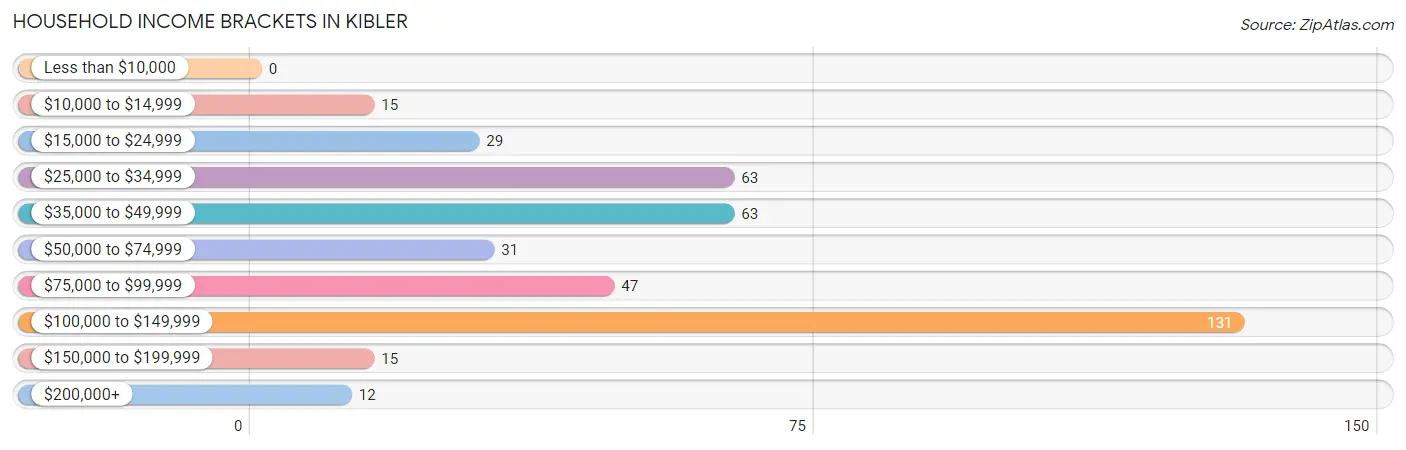
| Income Bracket | # Households | % Households |
| Less than $10,000 | 0 | 0.0% |
| $10,000 to $14,999 | 15 | 3.7% |
| $15,000 to $24,999 | 29 | 7.1% |
| $25,000 to $34,999 | 63 | 15.5% |
| $35,000 to $49,999 | 63 | 15.5% |
| $50,000 to $74,999 | 31 | 7.6% |
| $75,000 to $99,999 | 47 | 11.6% |
| $100,000 to $149,999 | 131 | 32.3% |
| $150,000 to $199,999 | 15 | 3.7% |
| $200,000+ | 12 | 3.0% |
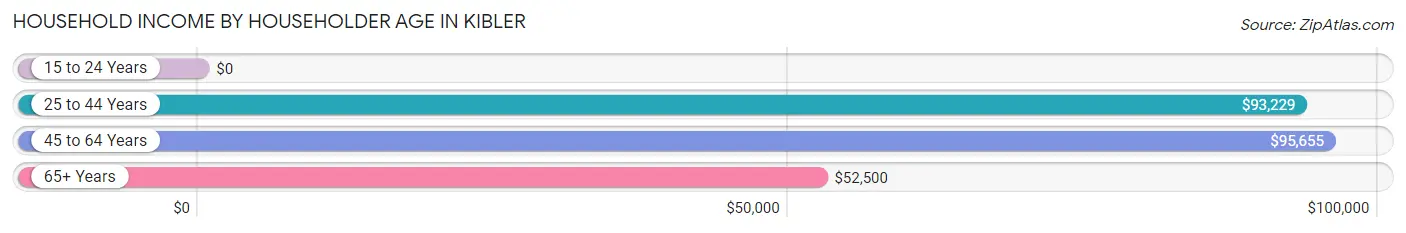
Household Income by Householder Age in Kibler
The median household income in Kibler is $76,667, with the highest median household income of $95,655 found in the 45 to 64 years age bracket for the primary householder. A total of 117 households (28.8%) fall into this category.
| Income Bracket | # Households | Median Income |
| 15 to 24 Years | 0 (0.0%) | $0 |
| 25 to 44 Years | 197 (48.5%) | $93,229 |
| 45 to 64 Years | 117 (28.8%) | $95,655 |
| 65+ Years | 92 (22.7%) | $52,500 |
| Total | 406 (100.0%) | $76,667 |
Poverty in Kibler
Income Below Poverty by Sex and Age in Kibler
With 10.7% poverty level for males and 8.1% for females among the residents of Kibler, 5 year old males and 55 to 64 year old females are the most vulnerable to poverty, with 4 males (66.7%) and 17 females (19.1%) in their respective age groups living below the poverty level.
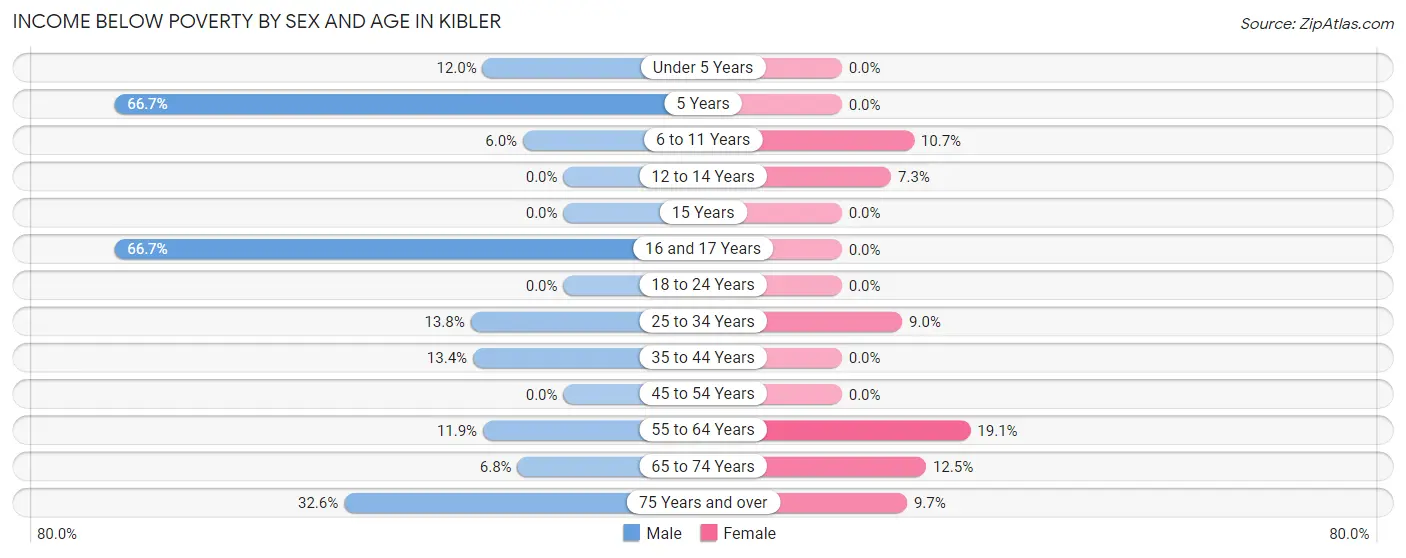
| Age Bracket | Male | Female |
| Under 5 Years | 6 (12.0%) | 0 (0.0%) |
| 5 Years | 4 (66.7%) | 0 (0.0%) |
| 6 to 11 Years | 3 (6.0%) | 6 (10.7%) |
| 12 to 14 Years | 0 (0.0%) | 3 (7.3%) |
| 15 Years | 0 (0.0%) | 0 (0.0%) |
| 16 and 17 Years | 4 (66.7%) | 0 (0.0%) |
| 18 to 24 Years | 0 (0.0%) | 0 (0.0%) |
| 25 to 34 Years | 8 (13.8%) | 12 (9.0%) |
| 35 to 44 Years | 9 (13.4%) | 0 (0.0%) |
| 45 to 54 Years | 0 (0.0%) | 0 (0.0%) |
| 55 to 64 Years | 8 (11.9%) | 17 (19.1%) |
| 65 to 74 Years | 3 (6.8%) | 6 (12.5%) |
| 75 Years and over | 14 (32.6%) | 3 (9.7%) |
| Total | 59 (10.7%) | 47 (8.1%) |
Income Above Poverty by Sex and Age in Kibler
According to the poverty statistics in Kibler, males aged 12 to 14 years and females aged under 5 years are the age groups that are most secure financially, with 100.0% of males and 100.0% of females in these age groups living above the poverty line.
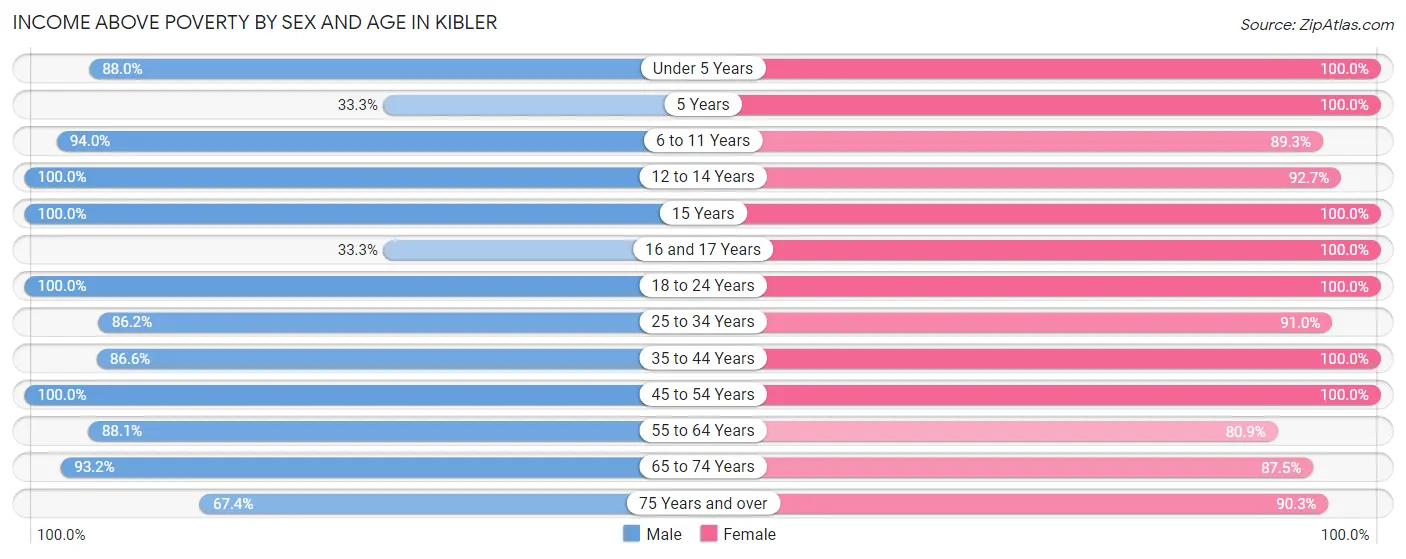
| Age Bracket | Male | Female |
| Under 5 Years | 44 (88.0%) | 32 (100.0%) |
| 5 Years | 2 (33.3%) | 3 (100.0%) |
| 6 to 11 Years | 47 (94.0%) | 50 (89.3%) |
| 12 to 14 Years | 11 (100.0%) | 38 (92.7%) |
| 15 Years | 9 (100.0%) | 16 (100.0%) |
| 16 and 17 Years | 2 (33.3%) | 12 (100.0%) |
| 18 to 24 Years | 35 (100.0%) | 13 (100.0%) |
| 25 to 34 Years | 50 (86.2%) | 122 (91.0%) |
| 35 to 44 Years | 58 (86.6%) | 75 (100.0%) |
| 45 to 54 Years | 105 (100.0%) | 28 (100.0%) |
| 55 to 64 Years | 59 (88.1%) | 72 (80.9%) |
| 65 to 74 Years | 41 (93.2%) | 42 (87.5%) |
| 75 Years and over | 29 (67.4%) | 28 (90.3%) |
| Total | 492 (89.3%) | 531 (91.9%) |
Income Below Poverty Among Married-Couple Families in Kibler
The poverty statistics for married-couple families in Kibler show that 6.6% or 19 of the total 288 families live below the poverty line. Families with 3 or 4 children have the highest poverty rate of 12.5%, comprising of 4 families. On the other hand, families with 1 or 2 children have the lowest poverty rate of 3.3%, which includes 5 families.
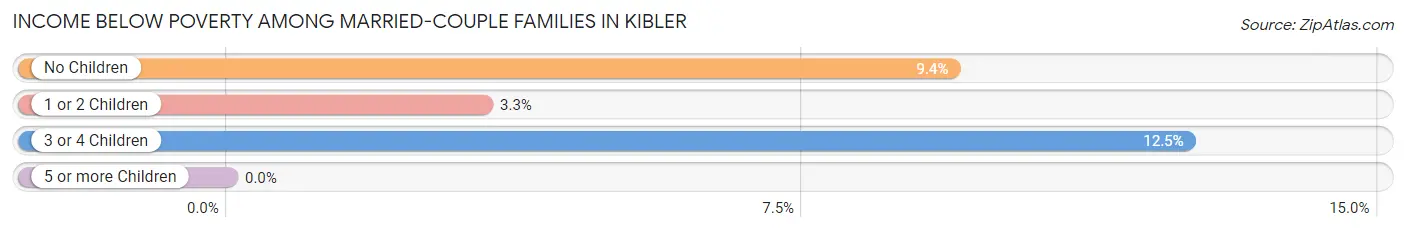
| Children | Above Poverty | Below Poverty |
| No Children | 96 (90.6%) | 10 (9.4%) |
| 1 or 2 Children | 145 (96.7%) | 5 (3.3%) |
| 3 or 4 Children | 28 (87.5%) | 4 (12.5%) |
| 5 or more Children | 0 (0.0%) | 0 (0.0%) |
| Total | 269 (93.4%) | 19 (6.6%) |
Income Below Poverty Among Single-Parent Households in Kibler
According to the poverty data in Kibler, 36.0% or 9 single-father households and 15.4% or 6 single-mother households are living below the poverty line. Among single-father households, those with no children have the highest poverty rate, with 9 households (56.2%) experiencing poverty. Likewise, among single-mother households, those with 1 or 2 children have the highest poverty rate, with 6 households (33.3%) falling below the poverty line.
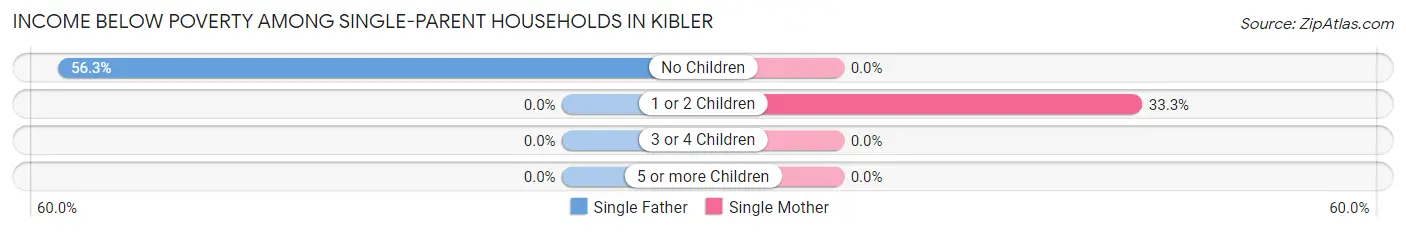
| Children | Single Father | Single Mother |
| No Children | 9 (56.2%) | 0 (0.0%) |
| 1 or 2 Children | 0 (0.0%) | 6 (33.3%) |
| 3 or 4 Children | 0 (0.0%) | 0 (0.0%) |
| 5 or more Children | 0 (0.0%) | 0 (0.0%) |
| Total | 9 (36.0%) | 6 (15.4%) |
Income Below Poverty Among Married-Couple vs Single-Parent Households in Kibler
The poverty data for Kibler shows that 19 of the married-couple family households (6.6%) and 15 of the single-parent households (23.4%) are living below the poverty level. Within the married-couple family households, those with 3 or 4 children have the highest poverty rate, with 4 households (12.5%) falling below the poverty line. Among the single-parent households, those with no children have the highest poverty rate, with 9 household (24.3%) living below poverty.
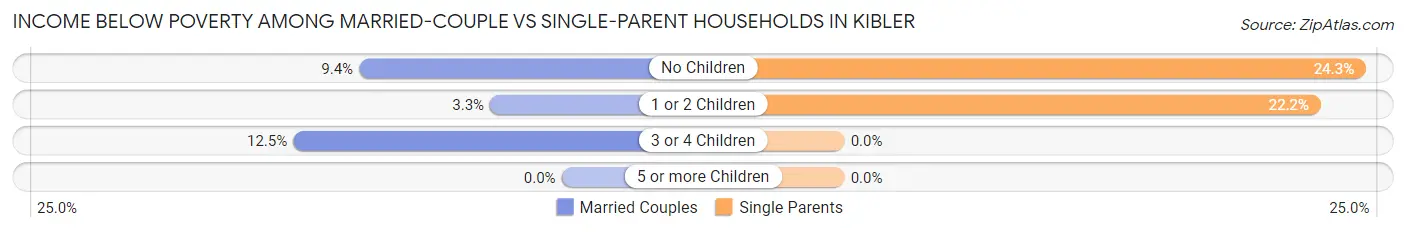
| Children | Married-Couple Families | Single-Parent Households |
| No Children | 10 (9.4%) | 9 (24.3%) |
| 1 or 2 Children | 5 (3.3%) | 6 (22.2%) |
| 3 or 4 Children | 4 (12.5%) | 0 (0.0%) |
| 5 or more Children | 0 (0.0%) | 0 (0.0%) |
| Total | 19 (6.6%) | 15 (23.4%) |
Race in Kibler
The most populous races in Kibler are White / Caucasian (1,080 | 94.7%), Two or more Races (41 | 3.6%), and Native / Alaskan (18 | 1.6%).
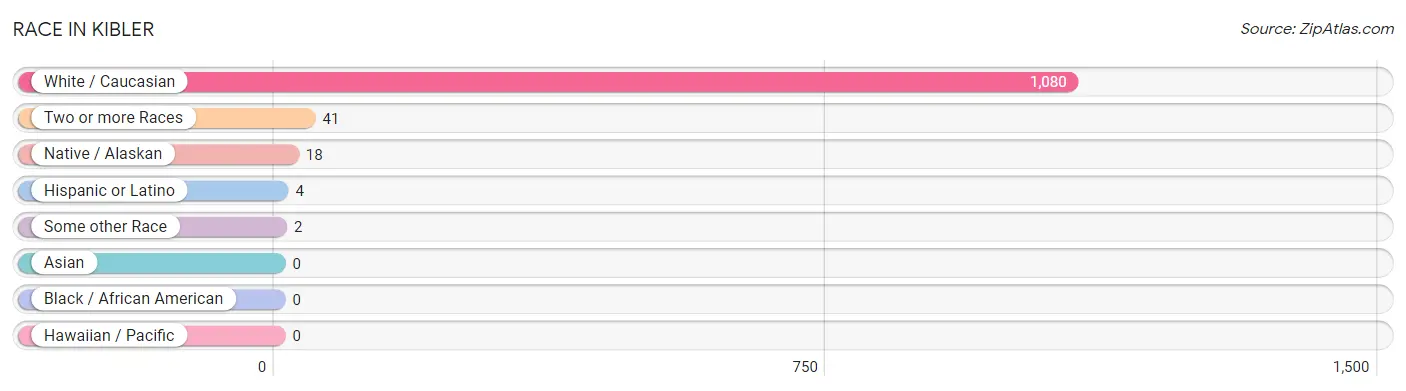
| Race | # Population | % Population |
| Asian | 0 | 0.0% |
| Black / African American | 0 | 0.0% |
| Hawaiian / Pacific | 0 | 0.0% |
| Hispanic or Latino | 4 | 0.4% |
| Native / Alaskan | 18 | 1.6% |
| White / Caucasian | 1,080 | 94.7% |
| Two or more Races | 41 | 3.6% |
| Some other Race | 2 | 0.2% |
| Total | 1,141 | 100.0% |
Ancestry in Kibler
The most populous ancestries reported in Kibler are American (296 | 25.9%), German (130 | 11.4%), Irish (127 | 11.1%), English (71 | 6.2%), and Swedish (71 | 6.2%), together accounting for 60.9% of all Kibler residents.
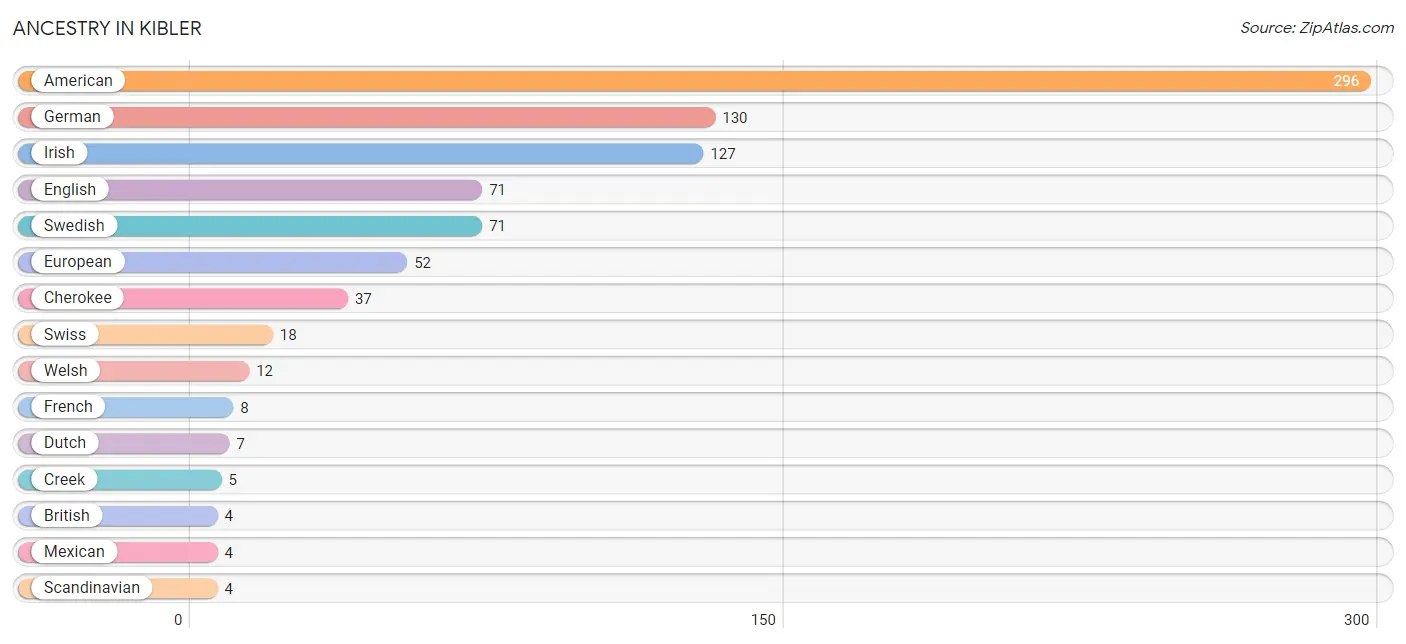
| Ancestry | # Population | % Population |
| American | 296 | 25.9% |
| British | 4 | 0.4% |
| Cajun | 2 | 0.2% |
| Cherokee | 37 | 3.2% |
| Creek | 5 | 0.4% |
| Dutch | 7 | 0.6% |
| English | 71 | 6.2% |
| European | 52 | 4.6% |
| French | 8 | 0.7% |
| German | 130 | 11.4% |
| Irish | 127 | 11.1% |
| Mexican | 4 | 0.4% |
| Northern European | 3 | 0.3% |
| Scandinavian | 4 | 0.4% |
| Seminole | 2 | 0.2% |
| Swedish | 71 | 6.2% |
| Swiss | 18 | 1.6% |
| Welsh | 12 | 1.1% | View All 18 Rows |
Immigrants in Kibler
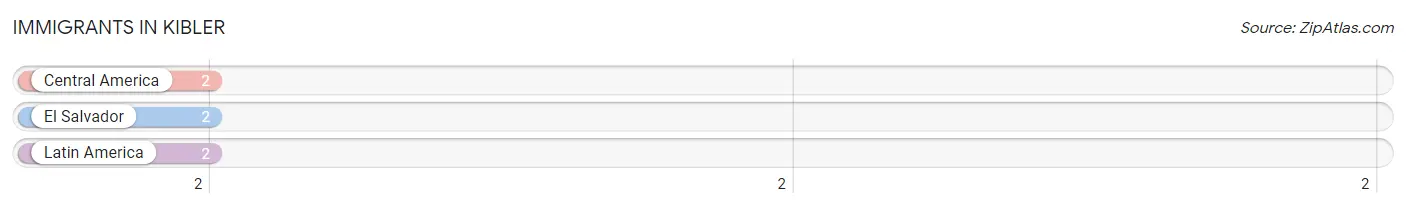
The most numerous immigrant groups reported in Kibler came from Central America (2 | 0.2%), El Salvador (2 | 0.2%), and Latin America (2 | 0.2%), together accounting for 0.5% of all Kibler residents.
| Immigration Origin | # Population | % Population |
| Central America | 2 | 0.2% |
| El Salvador | 2 | 0.2% |
| Latin America | 2 | 0.2% | View All 3 Rows |
Sex and Age in Kibler
Sex and Age in Kibler
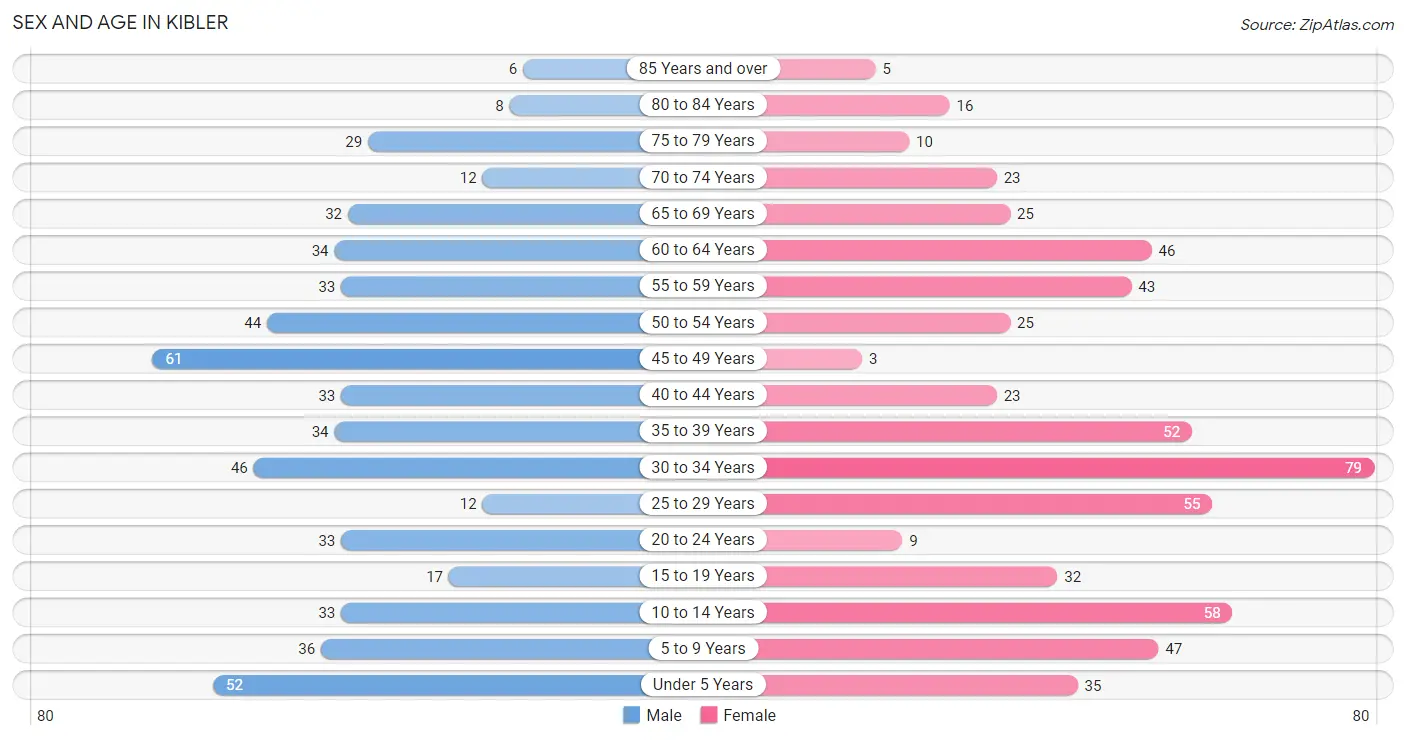
The most populous age groups in Kibler are 45 to 49 Years (61 | 11.0%) for men and 30 to 34 Years (79 | 13.5%) for women.
| Age Bracket | Male | Female |
| Under 5 Years | 52 (9.4%) | 35 (6.0%) |
| 5 to 9 Years | 36 (6.5%) | 47 (8.0%) |
| 10 to 14 Years | 33 (5.9%) | 58 (9.9%) |
| 15 to 19 Years | 17 (3.1%) | 32 (5.5%) |
| 20 to 24 Years | 33 (5.9%) | 9 (1.5%) |
| 25 to 29 Years | 12 (2.2%) | 55 (9.4%) |
| 30 to 34 Years | 46 (8.3%) | 79 (13.5%) |
| 35 to 39 Years | 34 (6.1%) | 52 (8.9%) |
| 40 to 44 Years | 33 (5.9%) | 23 (3.9%) |
| 45 to 49 Years | 61 (11.0%) | 3 (0.5%) |
| 50 to 54 Years | 44 (7.9%) | 25 (4.3%) |
| 55 to 59 Years | 33 (5.9%) | 43 (7.3%) |
| 60 to 64 Years | 34 (6.1%) | 46 (7.9%) |
| 65 to 69 Years | 32 (5.8%) | 25 (4.3%) |
| 70 to 74 Years | 12 (2.2%) | 23 (3.9%) |
| 75 to 79 Years | 29 (5.2%) | 10 (1.7%) |
| 80 to 84 Years | 8 (1.4%) | 16 (2.7%) |
| 85 Years and over | 6 (1.1%) | 5 (0.9%) |
| Total | 555 (100.0%) | 586 (100.0%) |
Families and Households in Kibler
Median Family Size in Kibler
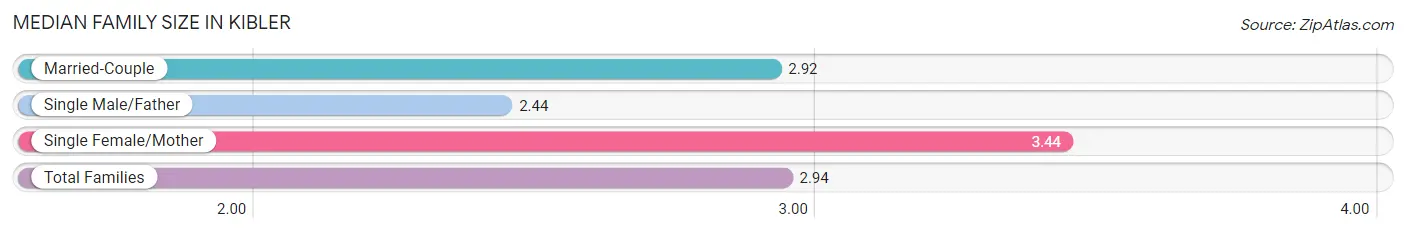
The median family size in Kibler is 2.94 persons per family, with single female/mother families (39 | 11.1%) accounting for the largest median family size of 3.44 persons per family. On the other hand, single male/father families (25 | 7.1%) represent the smallest median family size with 2.44 persons per family.
| Family Type | # Families | Family Size |
| Married-Couple | 288 (81.8%) | 2.92 |
| Single Male/Father | 25 (7.1%) | 2.44 |
| Single Female/Mother | 39 (11.1%) | 3.44 |
| Total Families | 352 (100.0%) | 2.94 |
Median Household Size in Kibler
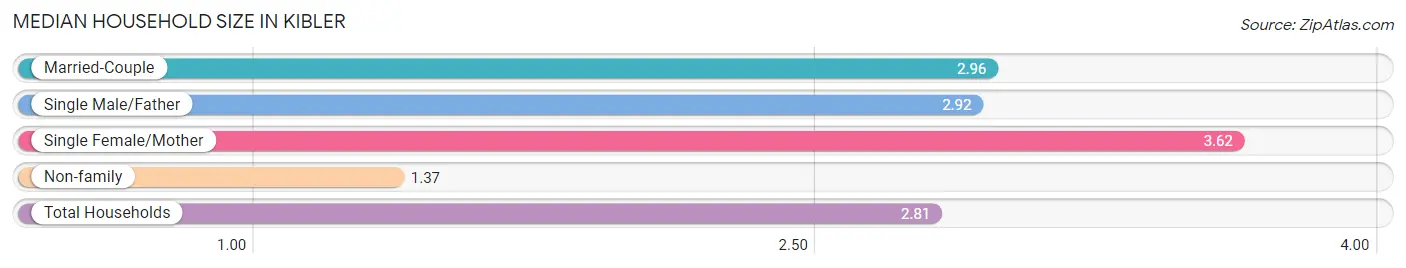
The median household size in Kibler is 2.81 persons per household, with single female/mother households (39 | 9.6%) accounting for the largest median household size of 3.62 persons per household. non-family households (54 | 13.3%) represent the smallest median household size with 1.37 persons per household.
| Household Type | # Households | Household Size |
| Married-Couple | 288 (70.9%) | 2.96 |
| Single Male/Father | 25 (6.2%) | 2.92 |
| Single Female/Mother | 39 (9.6%) | 3.62 |
| Non-family | 54 (13.3%) | 1.37 |
| Total Households | 406 (100.0%) | 2.81 |
Household Size by Marriage Status in Kibler
Out of a total of 406 households in Kibler, 352 (86.7%) are family households, while 54 (13.3%) are nonfamily households. The most numerous type of family households are 2-person households, comprising 128, and the most common type of nonfamily households are 1-person households, comprising 41.
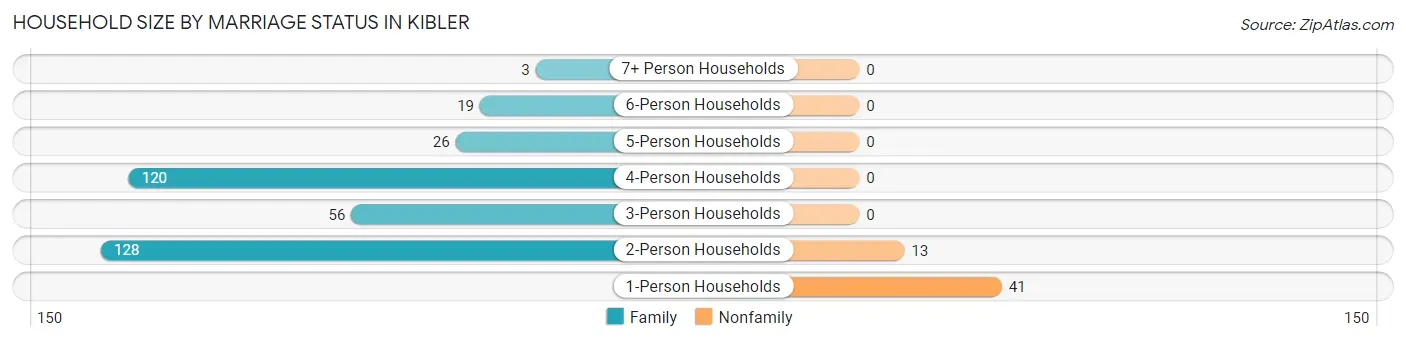
| Household Size | Family Households | Nonfamily Households |
| 1-Person Households | - | 41 (10.1%) |
| 2-Person Households | 128 (31.5%) | 13 (3.2%) |
| 3-Person Households | 56 (13.8%) | 0 (0.0%) |
| 4-Person Households | 120 (29.6%) | 0 (0.0%) |
| 5-Person Households | 26 (6.4%) | 0 (0.0%) |
| 6-Person Households | 19 (4.7%) | 0 (0.0%) |
| 7+ Person Households | 3 (0.7%) | 0 (0.0%) |
| Total | 352 (86.7%) | 54 (13.3%) |
Female Fertility in Kibler
Fertility by Age in Kibler
Average fertility rate in Kibler is 43.0 births per 1,000 women. Women in the age bracket of 20 to 34 years have the highest fertility rate with 56.0 births per 1,000 women. Women in the age bracket of 20 to 34 years acount for 72.7% of all women with births.
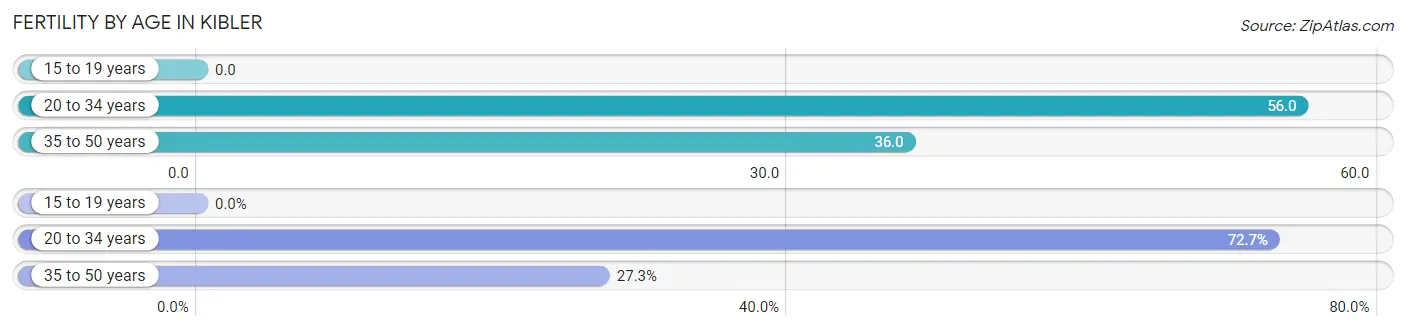
| Age Bracket | Women with Births | Births / 1,000 Women |
| 15 to 19 years | 0 (0.0%) | 0.0 |
| 20 to 34 years | 8 (72.7%) | 56.0 |
| 35 to 50 years | 3 (27.3%) | 36.0 |
| Total | 11 (100.0%) | 43.0 |
Fertility by Age by Marriage Status in Kibler
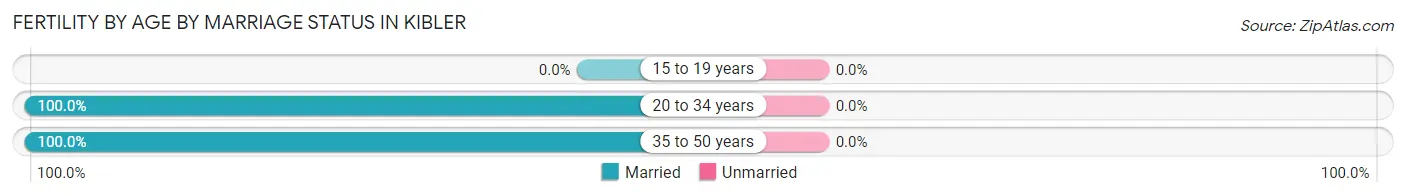
| Age Bracket | Married | Unmarried |
| 15 to 19 years | 0 (0.0%) | 0 (0.0%) |
| 20 to 34 years | 8 (100.0%) | 0 (0.0%) |
| 35 to 50 years | 3 (100.0%) | 0 (0.0%) |
| Total | 11 (100.0%) | 0 (0.0%) |
Fertility by Education in Kibler
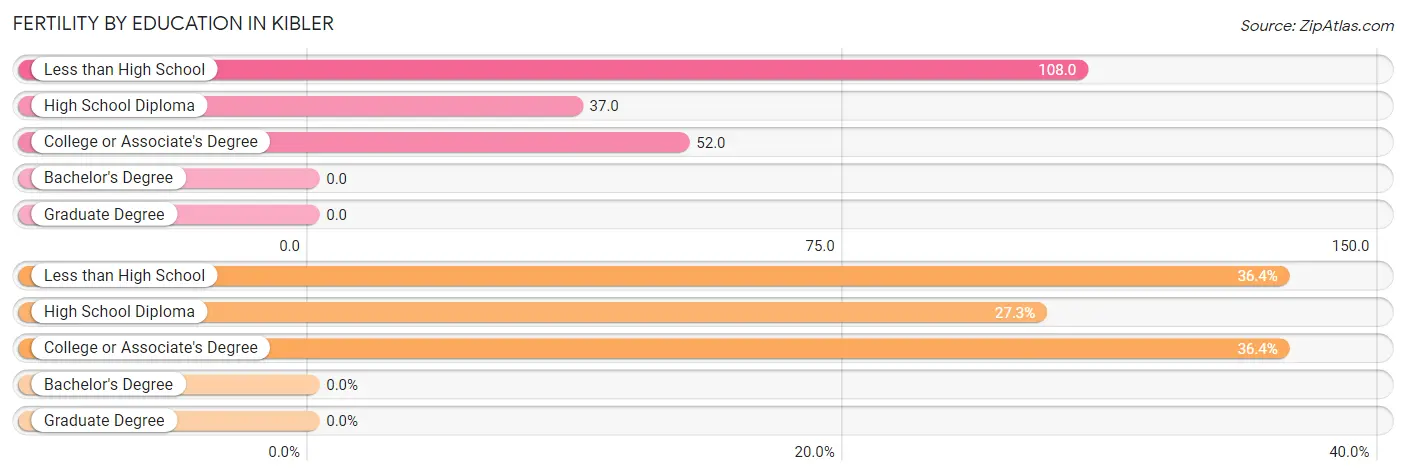
| Educational Attainment | Women with Births | Births / 1,000 Women |
| Less than High School | 4 (36.4%) | 108.0 |
| High School Diploma | 3 (27.3%) | 37.0 |
| College or Associate's Degree | 4 (36.4%) | 52.0 |
| Bachelor's Degree | 0 (0.0%) | 0.0 |
| Graduate Degree | 0 (0.0%) | 0.0 |
| Total | 11 (100.0%) | 43.0 |
Fertility by Education by Marriage Status in Kibler
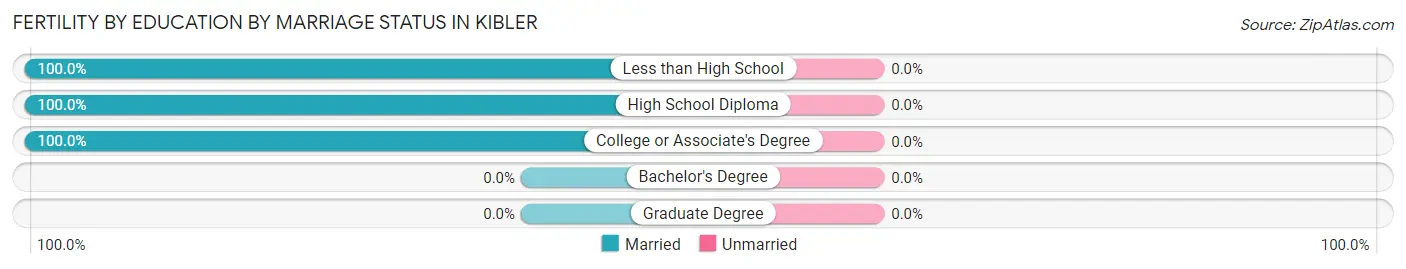
| Educational Attainment | Married | Unmarried |
| Less than High School | 4 (100.0%) | 0 (0.0%) |
| High School Diploma | 3 (100.0%) | 0 (0.0%) |
| College or Associate's Degree | 4 (100.0%) | 0 (0.0%) |
| Bachelor's Degree | 0 (0.0%) | 0 (0.0%) |
| Graduate Degree | 0 (0.0%) | 0 (0.0%) |
| Total | 11 (100.0%) | 0 (0.0%) |
Employment Characteristics in Kibler
Employment by Class of Employer in Kibler
Among the 438 employed individuals in Kibler, private company employees (280 | 63.9%), local government employees (60 | 13.7%), and self-employed (not incorporated) (45 | 10.3%) make up the most common classes of employment.
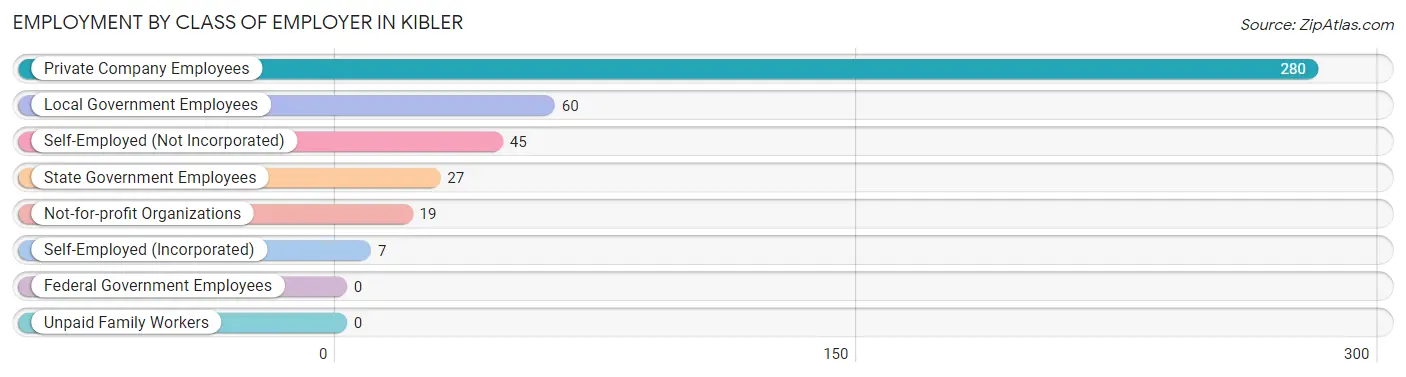
| Employer Class | # Employees | % Employees |
| Private Company Employees | 280 | 63.9% |
| Self-Employed (Incorporated) | 7 | 1.6% |
| Self-Employed (Not Incorporated) | 45 | 10.3% |
| Not-for-profit Organizations | 19 | 4.3% |
| Local Government Employees | 60 | 13.7% |
| State Government Employees | 27 | 6.2% |
| Federal Government Employees | 0 | 0.0% |
| Unpaid Family Workers | 0 | 0.0% |
| Total | 438 | 100.0% |
Employment Status by Age in Kibler
According to the labor force statistics for Kibler, out of the total population over 16 years of age (855), 54.2% or 463 individuals are in the labor force, with 4.3% or 20 of them unemployed. The age group with the highest labor force participation rate is 45 to 54 years, with 90.2% or 120 individuals in the labor force. Within the labor force, the 20 to 24 years age range has the highest percentage of unemployed individuals, with 43.8% or 7 of them being unemployed.
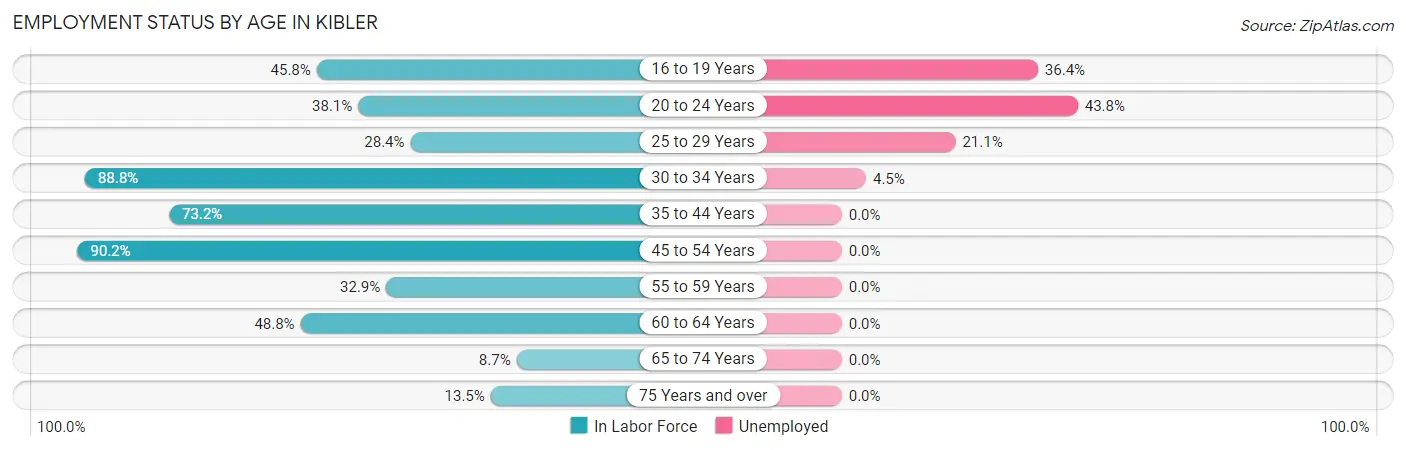
| Age Bracket | In Labor Force | Unemployed |
| 16 to 19 Years | 11 (45.8%) | 4 (36.4%) |
| 20 to 24 Years | 16 (38.1%) | 7 (43.8%) |
| 25 to 29 Years | 19 (28.4%) | 4 (21.1%) |
| 30 to 34 Years | 111 (88.8%) | 5 (4.5%) |
| 35 to 44 Years | 104 (73.2%) | 0 (0.0%) |
| 45 to 54 Years | 120 (90.2%) | 0 (0.0%) |
| 55 to 59 Years | 25 (32.9%) | 0 (0.0%) |
| 60 to 64 Years | 39 (48.8%) | 0 (0.0%) |
| 65 to 74 Years | 8 (8.7%) | 0 (0.0%) |
| 75 Years and over | 10 (13.5%) | 0 (0.0%) |
| Total | 463 (54.2%) | 20 (4.3%) |
Employment Status by Educational Attainment in Kibler
According to labor force statistics for Kibler, 67.1% of individuals (418) out of the total population between 25 and 64 years of age (623) are in the labor force, with 2.2% or 9 of them being unemployed. The group with the highest labor force participation rate are those with the educational attainment of bachelor's degree or higher, with 93.4% or 128 individuals in the labor force. Within the labor force, individuals with college / associate degree education have the highest percentage of unemployment, with 7.0% or 9 of them being unemployed.
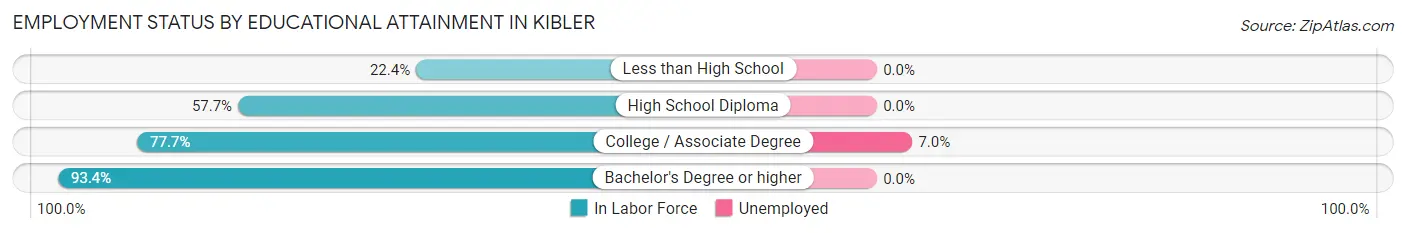
| Educational Attainment | In Labor Force | Unemployed |
| Less than High School | 15 (22.4%) | 0 (0.0%) |
| High School Diploma | 146 (57.7%) | 0 (0.0%) |
| College / Associate Degree | 129 (77.7%) | 12 (7.0%) |
| Bachelor's Degree or higher | 128 (93.4%) | 0 (0.0%) |
| Total | 418 (67.1%) | 14 (2.2%) |
Employment Occupations by Sex in Kibler
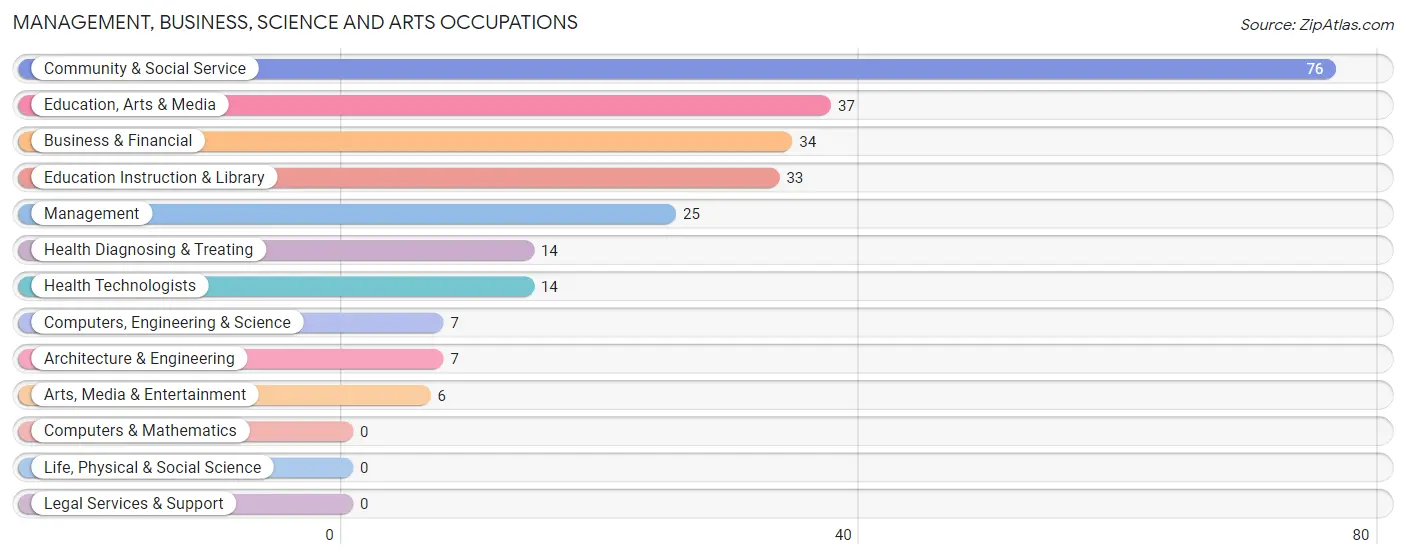
Management, Business, Science and Arts Occupations
The most common Management, Business, Science and Arts occupations in Kibler are Community & Social Service (76 | 17.2%), Education, Arts & Media (37 | 8.4%), Business & Financial (34 | 7.7%), Education Instruction & Library (33 | 7.4%), and Management (25 | 5.6%).
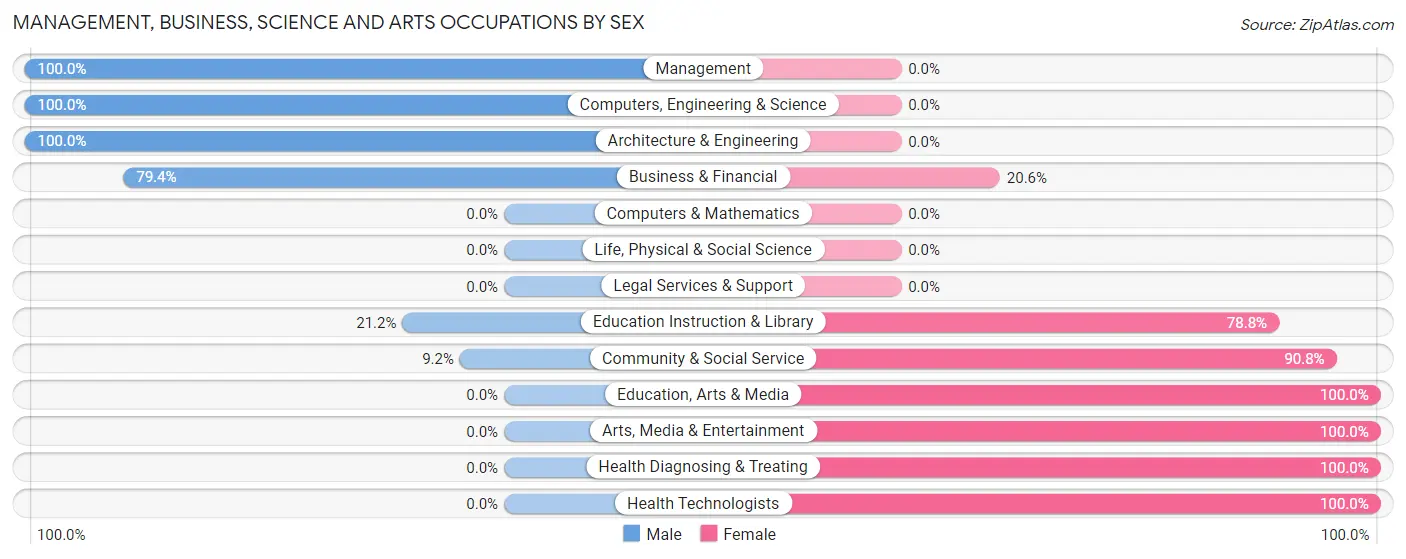
Management, Business, Science and Arts Occupations by Sex
Within the Management, Business, Science and Arts occupations in Kibler, the most male-oriented occupations are Management (100.0%), Computers, Engineering & Science (100.0%), and Architecture & Engineering (100.0%), while the most female-oriented occupations are Education, Arts & Media (100.0%), Arts, Media & Entertainment (100.0%), and Health Diagnosing & Treating (100.0%).
| Occupation | Male | Female |
| Management | 25 (100.0%) | 0 (0.0%) |
| Business & Financial | 27 (79.4%) | 7 (20.6%) |
| Computers, Engineering & Science | 7 (100.0%) | 0 (0.0%) |
| Computers & Mathematics | 0 (0.0%) | 0 (0.0%) |
| Architecture & Engineering | 7 (100.0%) | 0 (0.0%) |
| Life, Physical & Social Science | 0 (0.0%) | 0 (0.0%) |
| Community & Social Service | 7 (9.2%) | 69 (90.8%) |
| Education, Arts & Media | 0 (0.0%) | 37 (100.0%) |
| Legal Services & Support | 0 (0.0%) | 0 (0.0%) |
| Education Instruction & Library | 7 (21.2%) | 26 (78.8%) |
| Arts, Media & Entertainment | 0 (0.0%) | 6 (100.0%) |
| Health Diagnosing & Treating | 0 (0.0%) | 14 (100.0%) |
| Health Technologists | 0 (0.0%) | 14 (100.0%) |
| Total (Category) | 66 (42.3%) | 90 (57.7%) |
| Total (Overall) | 250 (56.4%) | 193 (43.6%) |
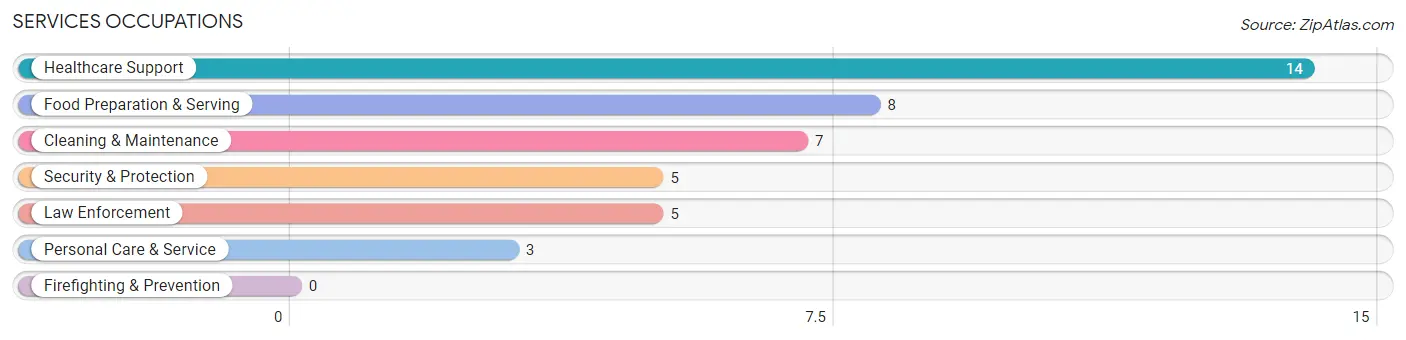
Services Occupations
The most common Services occupations in Kibler are Healthcare Support (14 | 3.2%), Food Preparation & Serving (8 | 1.8%), Cleaning & Maintenance (7 | 1.6%), Security & Protection (5 | 1.1%), and Law Enforcement (5 | 1.1%).
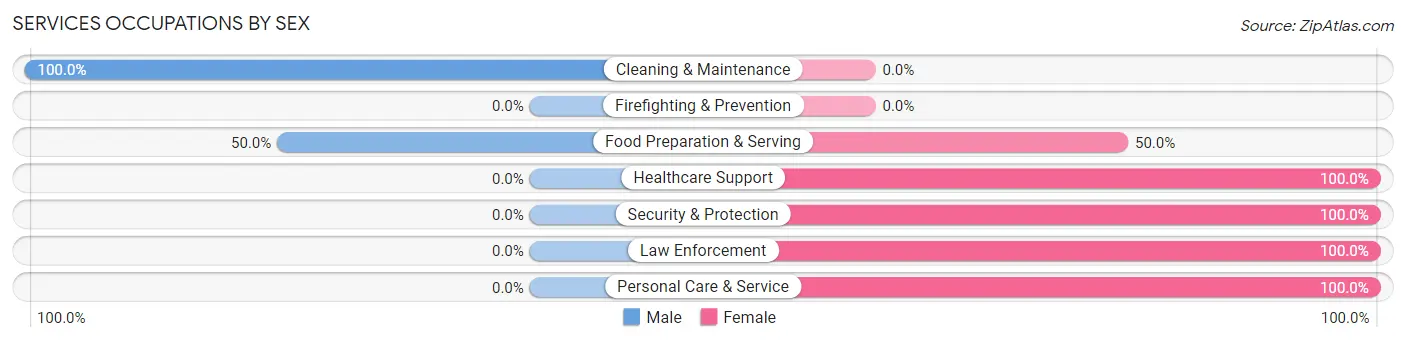
Services Occupations by Sex
Within the Services occupations in Kibler, the most male-oriented occupations are Cleaning & Maintenance (100.0%), and Food Preparation & Serving (50.0%), while the most female-oriented occupations are Healthcare Support (100.0%), Security & Protection (100.0%), and Law Enforcement (100.0%).
| Occupation | Male | Female |
| Healthcare Support | 0 (0.0%) | 14 (100.0%) |
| Security & Protection | 0 (0.0%) | 5 (100.0%) |
| Firefighting & Prevention | 0 (0.0%) | 0 (0.0%) |
| Law Enforcement | 0 (0.0%) | 5 (100.0%) |
| Food Preparation & Serving | 4 (50.0%) | 4 (50.0%) |
| Cleaning & Maintenance | 7 (100.0%) | 0 (0.0%) |
| Personal Care & Service | 0 (0.0%) | 3 (100.0%) |
| Total (Category) | 11 (29.7%) | 26 (70.3%) |
| Total (Overall) | 250 (56.4%) | 193 (43.6%) |
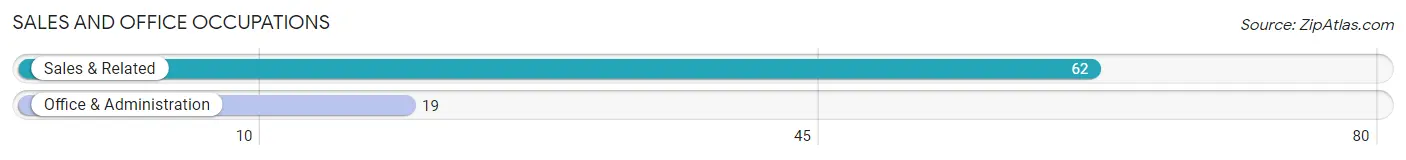
Sales and Office Occupations
The most common Sales and Office occupations in Kibler are Sales & Related (62 | 14.0%), and Office & Administration (19 | 4.3%).
Sales and Office Occupations by Sex
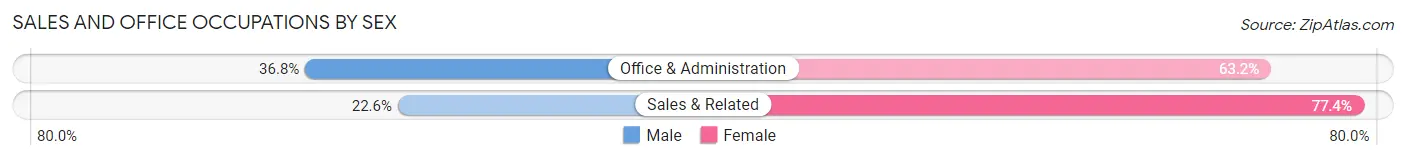
| Occupation | Male | Female |
| Sales & Related | 14 (22.6%) | 48 (77.4%) |
| Office & Administration | 7 (36.8%) | 12 (63.2%) |
| Total (Category) | 21 (25.9%) | 60 (74.1%) |
| Total (Overall) | 250 (56.4%) | 193 (43.6%) |
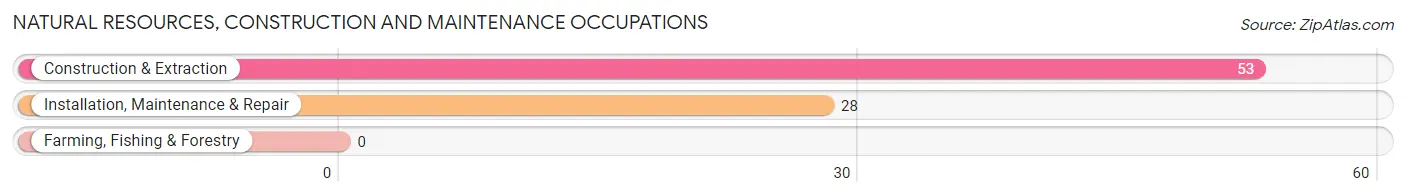
Natural Resources, Construction and Maintenance Occupations
The most common Natural Resources, Construction and Maintenance occupations in Kibler are Construction & Extraction (53 | 12.0%), and Installation, Maintenance & Repair (28 | 6.3%).
Natural Resources, Construction and Maintenance Occupations by Sex
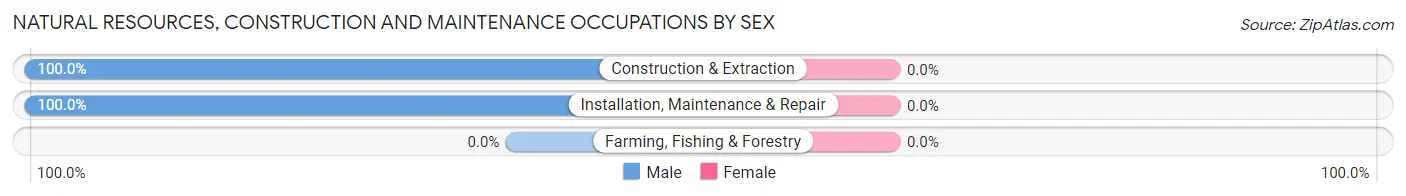
| Occupation | Male | Female |
| Farming, Fishing & Forestry | 0 (0.0%) | 0 (0.0%) |
| Construction & Extraction | 53 (100.0%) | 0 (0.0%) |
| Installation, Maintenance & Repair | 28 (100.0%) | 0 (0.0%) |
| Total (Category) | 81 (100.0%) | 0 (0.0%) |
| Total (Overall) | 250 (56.4%) | 193 (43.6%) |
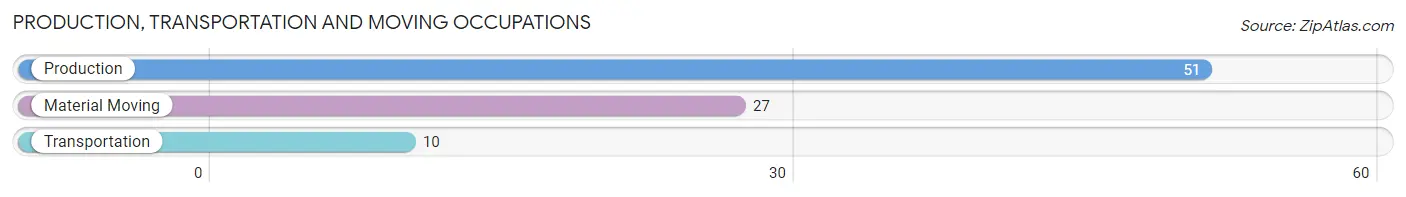
Production, Transportation and Moving Occupations
The most common Production, Transportation and Moving occupations in Kibler are Production (51 | 11.5%), Material Moving (27 | 6.1%), and Transportation (10 | 2.3%).
Production, Transportation and Moving Occupations by Sex
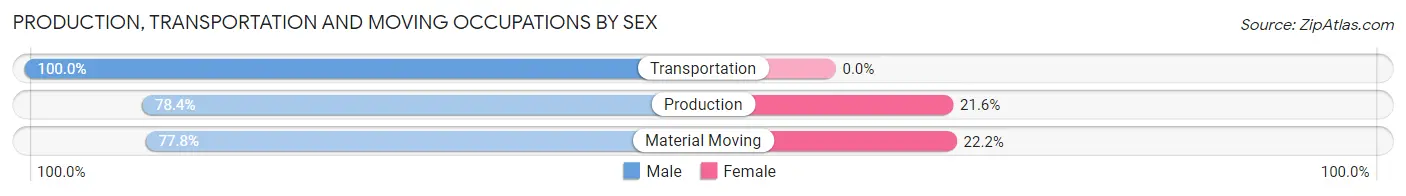
| Occupation | Male | Female |
| Production | 40 (78.4%) | 11 (21.6%) |
| Transportation | 10 (100.0%) | 0 (0.0%) |
| Material Moving | 21 (77.8%) | 6 (22.2%) |
| Total (Category) | 71 (80.7%) | 17 (19.3%) |
| Total (Overall) | 250 (56.4%) | 193 (43.6%) |
Employment Industries by Sex in Kibler
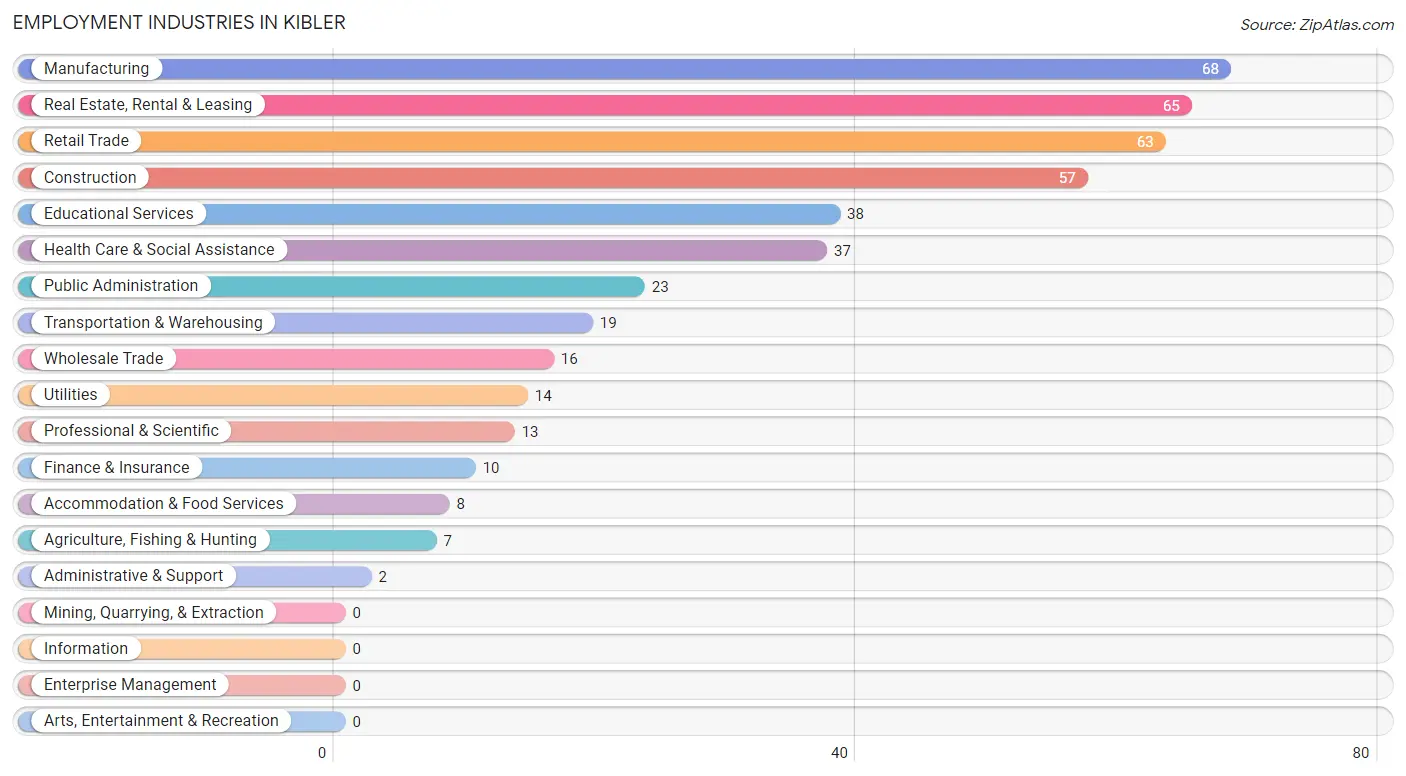
Employment Industries in Kibler
The major employment industries in Kibler include Manufacturing (68 | 15.3%), Real Estate, Rental & Leasing (65 | 14.7%), Retail Trade (63 | 14.2%), Construction (57 | 12.9%), and Educational Services (38 | 8.6%).
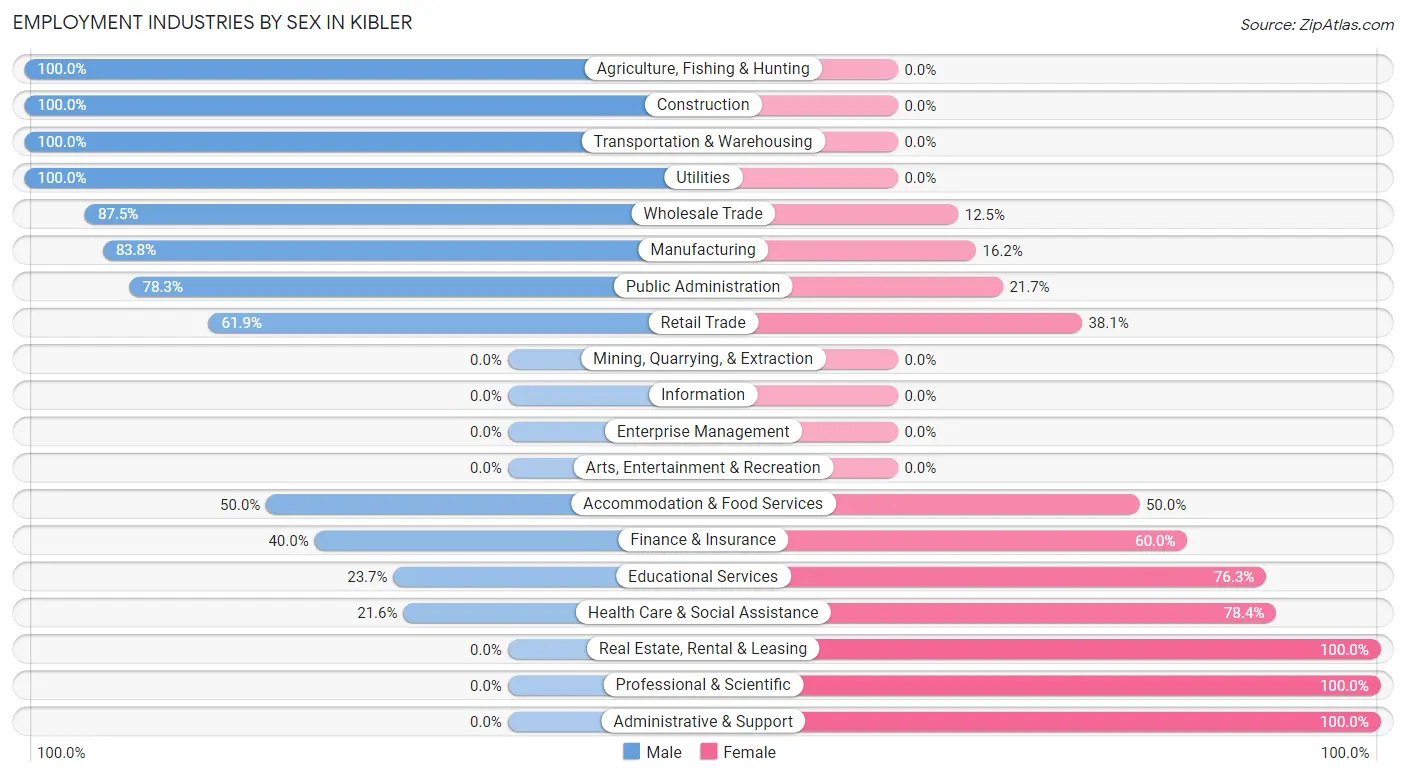
Employment Industries by Sex in Kibler
The Kibler industries that see more men than women are Agriculture, Fishing & Hunting (100.0%), Construction (100.0%), and Transportation & Warehousing (100.0%), whereas the industries that tend to have a higher number of women are Real Estate, Rental & Leasing (100.0%), Professional & Scientific (100.0%), and Administrative & Support (100.0%).
| Industry | Male | Female |
| Agriculture, Fishing & Hunting | 7 (100.0%) | 0 (0.0%) |
| Mining, Quarrying, & Extraction | 0 (0.0%) | 0 (0.0%) |
| Construction | 57 (100.0%) | 0 (0.0%) |
| Manufacturing | 57 (83.8%) | 11 (16.2%) |
| Wholesale Trade | 14 (87.5%) | 2 (12.5%) |
| Retail Trade | 39 (61.9%) | 24 (38.1%) |
| Transportation & Warehousing | 19 (100.0%) | 0 (0.0%) |
| Utilities | 14 (100.0%) | 0 (0.0%) |
| Information | 0 (0.0%) | 0 (0.0%) |
| Finance & Insurance | 4 (40.0%) | 6 (60.0%) |
| Real Estate, Rental & Leasing | 0 (0.0%) | 65 (100.0%) |
| Professional & Scientific | 0 (0.0%) | 13 (100.0%) |
| Enterprise Management | 0 (0.0%) | 0 (0.0%) |
| Administrative & Support | 0 (0.0%) | 2 (100.0%) |
| Educational Services | 9 (23.7%) | 29 (76.3%) |
| Health Care & Social Assistance | 8 (21.6%) | 29 (78.4%) |
| Arts, Entertainment & Recreation | 0 (0.0%) | 0 (0.0%) |
| Accommodation & Food Services | 4 (50.0%) | 4 (50.0%) |
| Public Administration | 18 (78.3%) | 5 (21.7%) |
| Total | 250 (56.4%) | 193 (43.6%) |
Education in Kibler
School Enrollment in Kibler
The most common levels of schooling among the 211 students in Kibler are middle school (55 | 26.1%), elementary school (46 | 21.8%), and high school (40 | 19.0%).
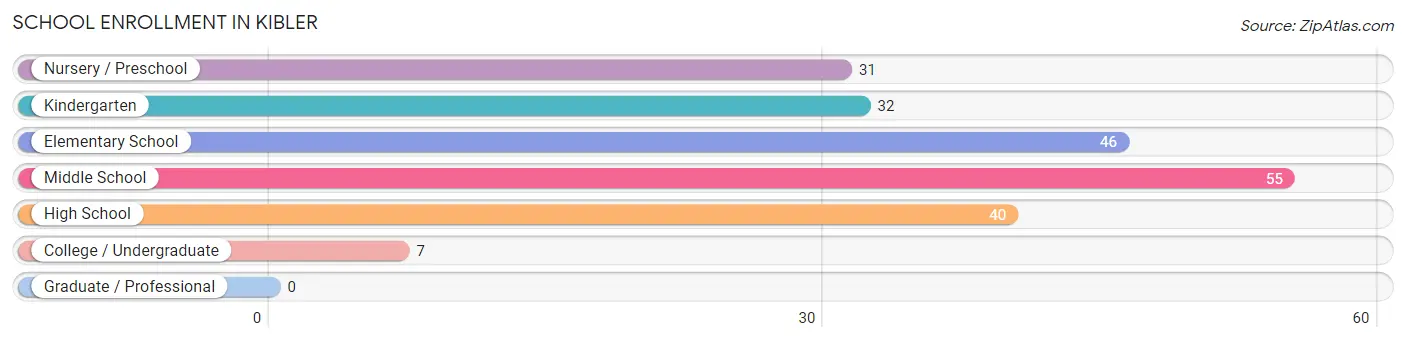
| School Level | # Students | % Students |
| Nursery / Preschool | 31 | 14.7% |
| Kindergarten | 32 | 15.2% |
| Elementary School | 46 | 21.8% |
| Middle School | 55 | 26.1% |
| High School | 40 | 19.0% |
| College / Undergraduate | 7 | 3.3% |
| Graduate / Professional | 0 | 0.0% |
| Total | 211 | 100.0% |
School Enrollment by Age by Funding Source in Kibler
Out of a total of 211 students who are enrolled in schools in Kibler, 17 (8.1%) attend a private institution, while the remaining 194 (91.9%) are enrolled in public schools. The age group of 3 to 4 year olds has the highest likelihood of being enrolled in private schools, with 11 (37.9% in the age bracket) enrolled. Conversely, the age group of 5 to 9 year old has the lowest likelihood of being enrolled in a private school, with 76 (100.0% in the age bracket) attending a public institution.
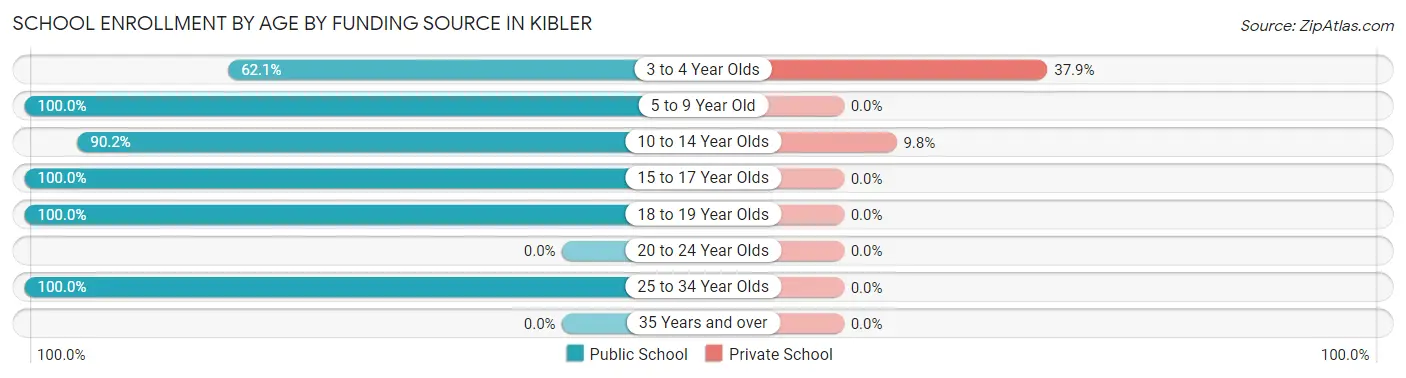
| Age Bracket | Public School | Private School |
| 3 to 4 Year Olds | 18 (62.1%) | 11 (37.9%) |
| 5 to 9 Year Old | 76 (100.0%) | 0 (0.0%) |
| 10 to 14 Year Olds | 55 (90.2%) | 6 (9.8%) |
| 15 to 17 Year Olds | 38 (100.0%) | 0 (0.0%) |
| 18 to 19 Year Olds | 4 (100.0%) | 0 (0.0%) |
| 20 to 24 Year Olds | 0 (0.0%) | 0 (0.0%) |
| 25 to 34 Year Olds | 3 (100.0%) | 0 (0.0%) |
| 35 Years and over | 0 (0.0%) | 0 (0.0%) |
| Total | 194 (91.9%) | 17 (8.1%) |
Educational Attainment by Field of Study in Kibler
Business (64 | 31.7%), education (33 | 16.3%), communications (33 | 16.3%), science & technology (22 | 10.9%), and bio, nature & agricultural (12 | 5.9%) are the most common fields of study among 202 individuals in Kibler who have obtained a bachelor's degree or higher.
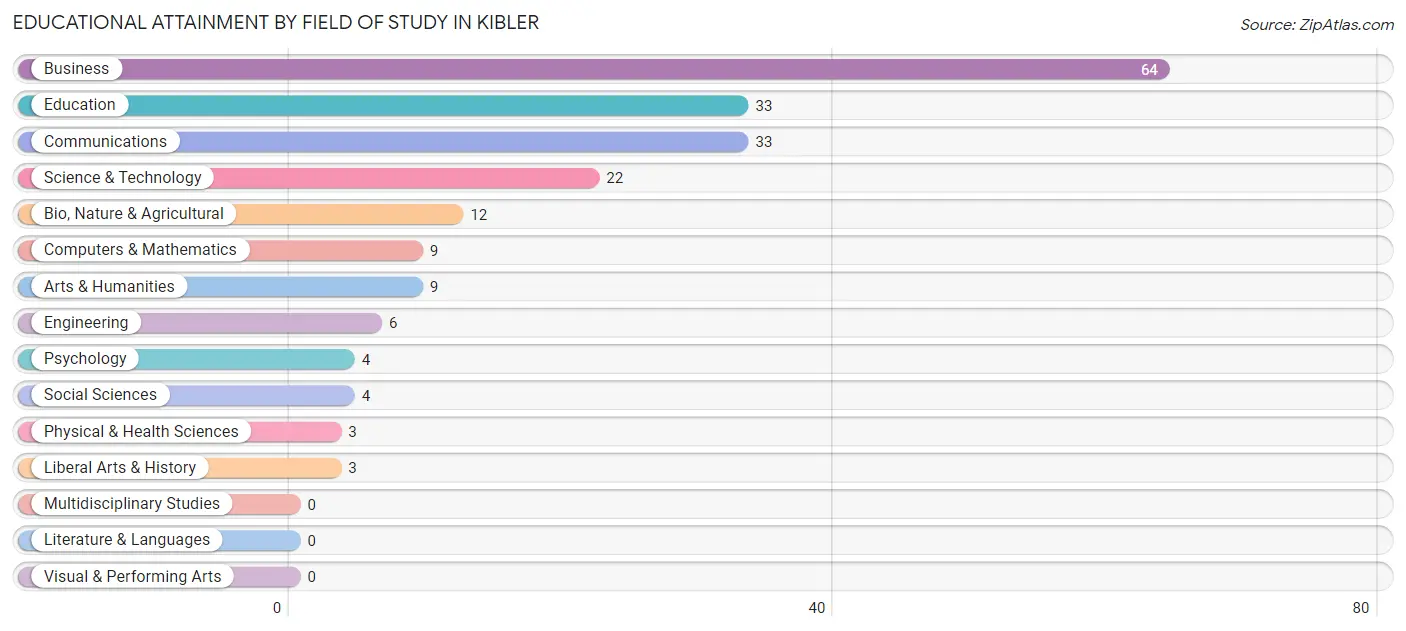
| Field of Study | # Graduates | % Graduates |
| Computers & Mathematics | 9 | 4.5% |
| Bio, Nature & Agricultural | 12 | 5.9% |
| Physical & Health Sciences | 3 | 1.5% |
| Psychology | 4 | 2.0% |
| Social Sciences | 4 | 2.0% |
| Engineering | 6 | 3.0% |
| Multidisciplinary Studies | 0 | 0.0% |
| Science & Technology | 22 | 10.9% |
| Business | 64 | 31.7% |
| Education | 33 | 16.3% |
| Literature & Languages | 0 | 0.0% |
| Liberal Arts & History | 3 | 1.5% |
| Visual & Performing Arts | 0 | 0.0% |
| Communications | 33 | 16.3% |
| Arts & Humanities | 9 | 4.5% |
| Total | 202 | 100.0% |
Transportation & Commute in Kibler
Vehicle Availability by Sex in Kibler
The most prevalent vehicle ownership categories in Kibler are males with 2 vehicles (102, accounting for 41.3%) and females with 2 vehicles (88, making up 53.4%).
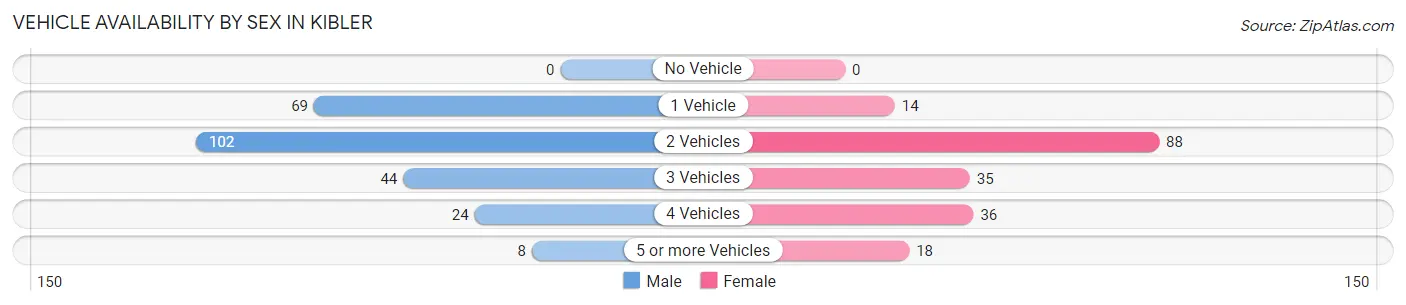
| Vehicles Available | Male | Female |
| No Vehicle | 0 (0.0%) | 0 (0.0%) |
| 1 Vehicle | 69 (27.9%) | 14 (7.3%) |
| 2 Vehicles | 102 (41.3%) | 88 (46.1%) |
| 3 Vehicles | 44 (17.8%) | 35 (18.3%) |
| 4 Vehicles | 24 (9.7%) | 36 (18.9%) |
| 5 or more Vehicles | 8 (3.2%) | 18 (9.4%) |
| Total | 247 (100.0%) | 191 (100.0%) |
Commute Time in Kibler
The most frequently occuring commute durations in Kibler are 30 to 34 minutes (89 commuters, 21.1%), 20 to 24 minutes (82 commuters, 19.5%), and 10 to 14 minutes (67 commuters, 15.9%).
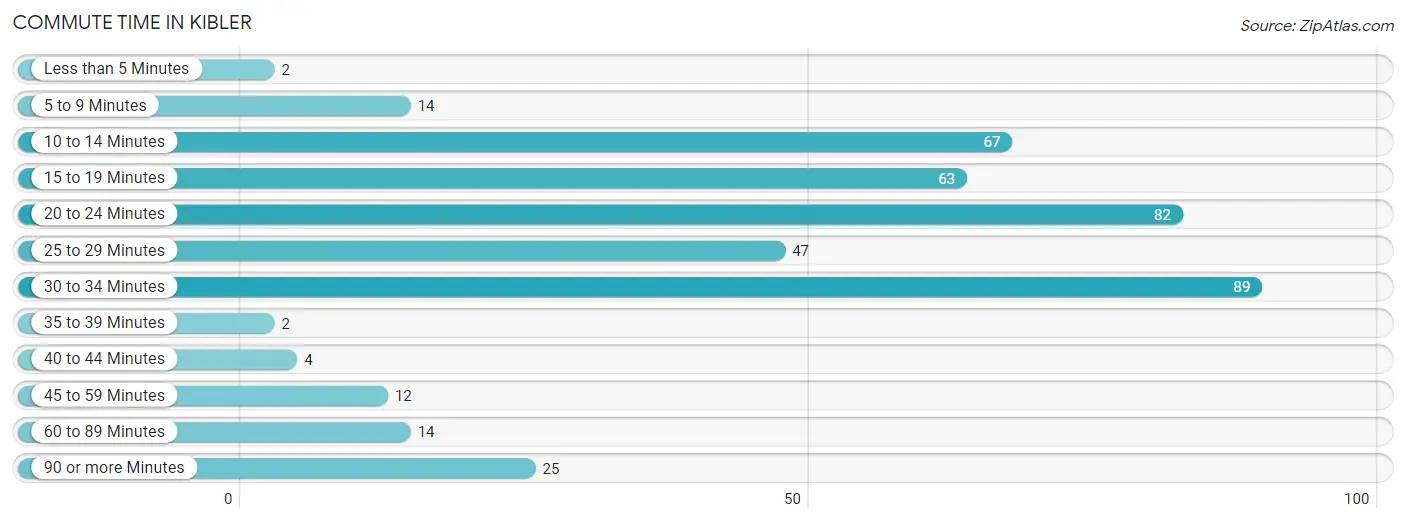
| Commute Time | # Commuters | % Commuters |
| Less than 5 Minutes | 2 | 0.5% |
| 5 to 9 Minutes | 14 | 3.3% |
| 10 to 14 Minutes | 67 | 15.9% |
| 15 to 19 Minutes | 63 | 15.0% |
| 20 to 24 Minutes | 82 | 19.5% |
| 25 to 29 Minutes | 47 | 11.2% |
| 30 to 34 Minutes | 89 | 21.1% |
| 35 to 39 Minutes | 2 | 0.5% |
| 40 to 44 Minutes | 4 | 0.9% |
| 45 to 59 Minutes | 12 | 2.9% |
| 60 to 89 Minutes | 14 | 3.3% |
| 90 or more Minutes | 25 | 5.9% |
Commute Time by Sex in Kibler
The most common commute times in Kibler are 30 to 34 minutes (64 commuters, 26.6%) for males and 20 to 24 minutes (46 commuters, 25.6%) for females.
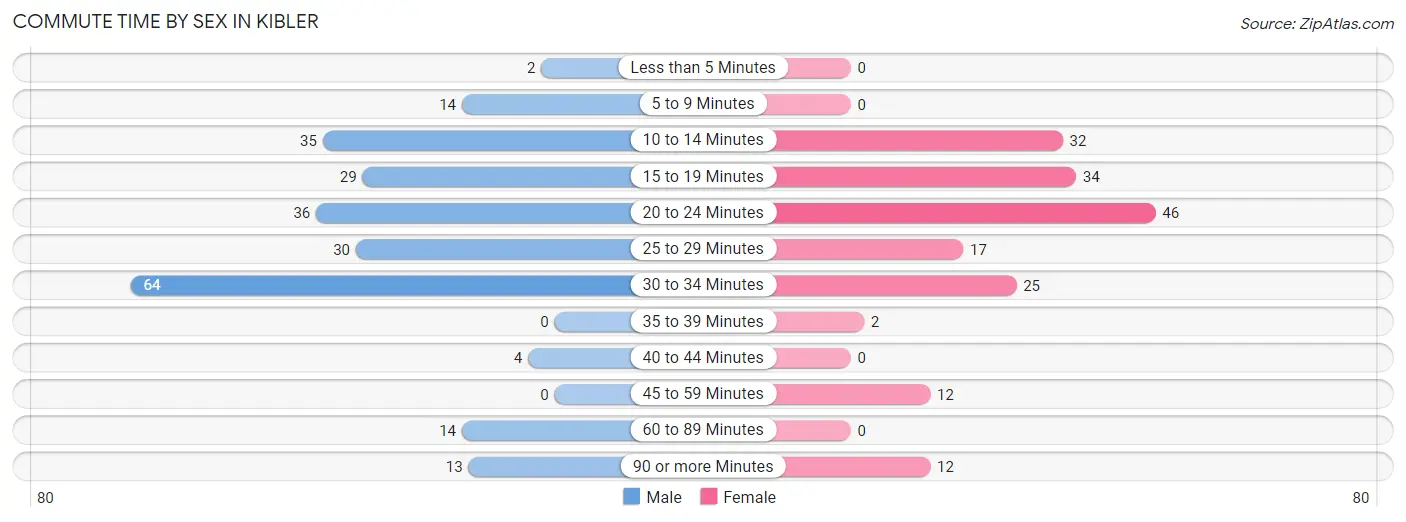
| Commute Time | Male | Female |
| Less than 5 Minutes | 2 (0.8%) | 0 (0.0%) |
| 5 to 9 Minutes | 14 (5.8%) | 0 (0.0%) |
| 10 to 14 Minutes | 35 (14.5%) | 32 (17.8%) |
| 15 to 19 Minutes | 29 (12.0%) | 34 (18.9%) |
| 20 to 24 Minutes | 36 (14.9%) | 46 (25.6%) |
| 25 to 29 Minutes | 30 (12.4%) | 17 (9.4%) |
| 30 to 34 Minutes | 64 (26.6%) | 25 (13.9%) |
| 35 to 39 Minutes | 0 (0.0%) | 2 (1.1%) |
| 40 to 44 Minutes | 4 (1.7%) | 0 (0.0%) |
| 45 to 59 Minutes | 0 (0.0%) | 12 (6.7%) |
| 60 to 89 Minutes | 14 (5.8%) | 0 (0.0%) |
| 90 or more Minutes | 13 (5.4%) | 12 (6.7%) |
Time of Departure to Work by Sex in Kibler
The most frequent times of departure to work in Kibler are 7:00 AM to 7:29 AM (59, 24.5%) for males and 7:30 AM to 7:59 AM (42, 23.3%) for females.
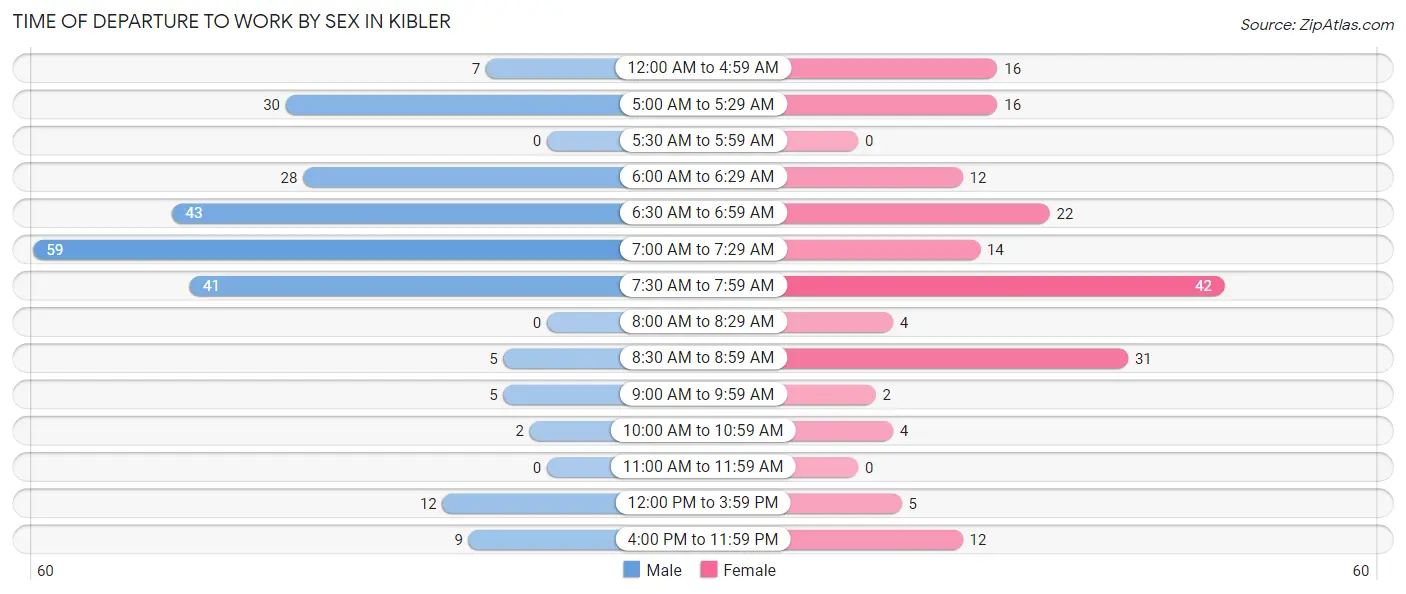
| Time of Departure | Male | Female |
| 12:00 AM to 4:59 AM | 7 (2.9%) | 16 (8.9%) |
| 5:00 AM to 5:29 AM | 30 (12.4%) | 16 (8.9%) |
| 5:30 AM to 5:59 AM | 0 (0.0%) | 0 (0.0%) |
| 6:00 AM to 6:29 AM | 28 (11.6%) | 12 (6.7%) |
| 6:30 AM to 6:59 AM | 43 (17.8%) | 22 (12.2%) |
| 7:00 AM to 7:29 AM | 59 (24.5%) | 14 (7.8%) |
| 7:30 AM to 7:59 AM | 41 (17.0%) | 42 (23.3%) |
| 8:00 AM to 8:29 AM | 0 (0.0%) | 4 (2.2%) |
| 8:30 AM to 8:59 AM | 5 (2.1%) | 31 (17.2%) |
| 9:00 AM to 9:59 AM | 5 (2.1%) | 2 (1.1%) |
| 10:00 AM to 10:59 AM | 2 (0.8%) | 4 (2.2%) |
| 11:00 AM to 11:59 AM | 0 (0.0%) | 0 (0.0%) |
| 12:00 PM to 3:59 PM | 12 (5.0%) | 5 (2.8%) |
| 4:00 PM to 11:59 PM | 9 (3.7%) | 12 (6.7%) |
| Total | 241 (100.0%) | 180 (100.0%) |
Housing Occupancy in Kibler
Occupancy by Ownership in Kibler
Of the total 406 dwellings in Kibler, owner-occupied units account for 346 (85.2%), while renter-occupied units make up 60 (14.8%).
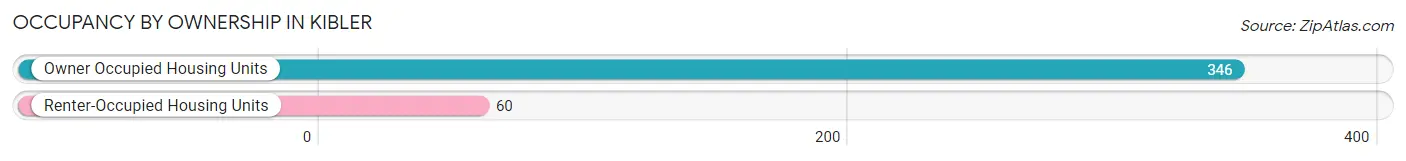
| Occupancy | # Housing Units | % Housing Units |
| Owner Occupied Housing Units | 346 | 85.2% |
| Renter-Occupied Housing Units | 60 | 14.8% |
| Total Occupied Housing Units | 406 | 100.0% |
Occupancy by Household Size in Kibler
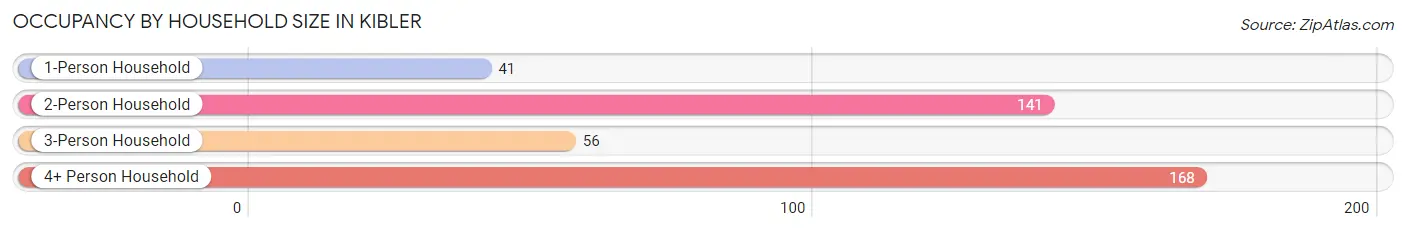
| Household Size | # Housing Units | % Housing Units |
| 1-Person Household | 41 | 10.1% |
| 2-Person Household | 141 | 34.7% |
| 3-Person Household | 56 | 13.8% |
| 4+ Person Household | 168 | 41.4% |
| Total Housing Units | 406 | 100.0% |
Occupancy by Ownership by Household Size in Kibler
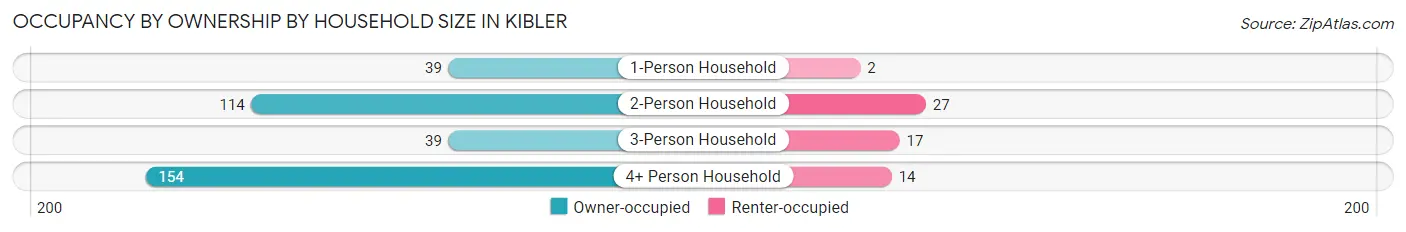
| Household Size | Owner-occupied | Renter-occupied |
| 1-Person Household | 39 (95.1%) | 2 (4.9%) |
| 2-Person Household | 114 (80.8%) | 27 (19.2%) |
| 3-Person Household | 39 (69.6%) | 17 (30.4%) |
| 4+ Person Household | 154 (91.7%) | 14 (8.3%) |
| Total Housing Units | 346 (85.2%) | 60 (14.8%) |
Occupancy by Educational Attainment in Kibler
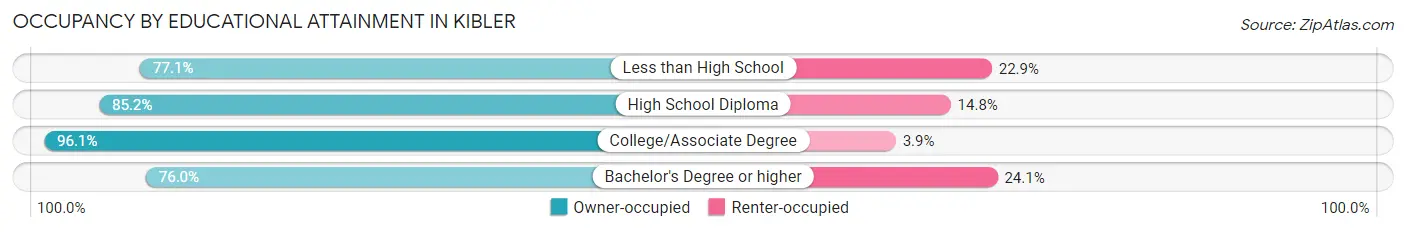
| Household Size | Owner-occupied | Renter-occupied |
| Less than High School | 37 (77.1%) | 11 (22.9%) |
| High School Diploma | 150 (85.2%) | 26 (14.8%) |
| College/Associate Degree | 99 (96.1%) | 4 (3.9%) |
| Bachelor's Degree or higher | 60 (75.9%) | 19 (24.0%) |
Occupancy by Age of Householder in Kibler
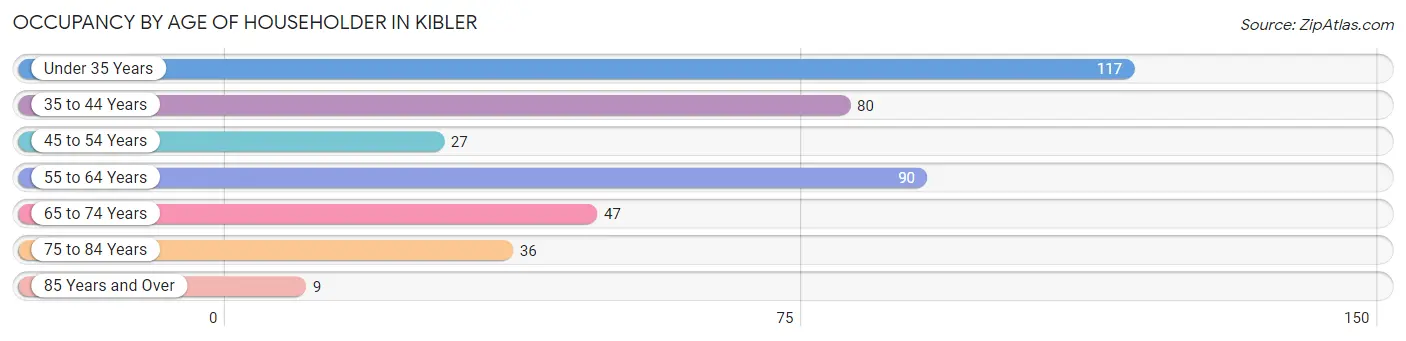
| Age Bracket | # Households | % Households |
| Under 35 Years | 117 | 28.8% |
| 35 to 44 Years | 80 | 19.7% |
| 45 to 54 Years | 27 | 6.7% |
| 55 to 64 Years | 90 | 22.2% |
| 65 to 74 Years | 47 | 11.6% |
| 75 to 84 Years | 36 | 8.9% |
| 85 Years and Over | 9 | 2.2% |
| Total | 406 | 100.0% |
Housing Finances in Kibler
Median Income by Occupancy in Kibler
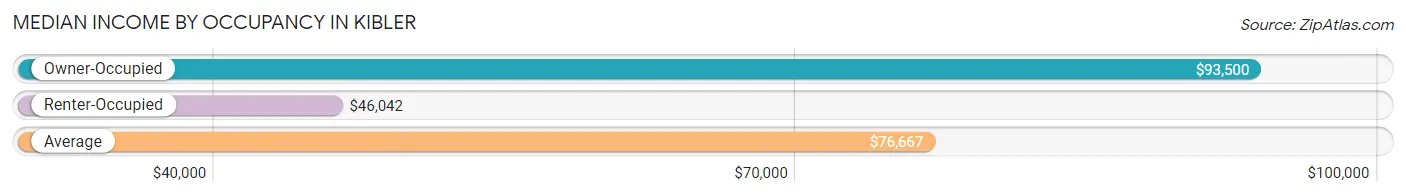
| Occupancy Type | # Households | Median Income |
| Owner-Occupied | 346 (85.2%) | $93,500 |
| Renter-Occupied | 60 (14.8%) | $46,042 |
| Average | 406 (100.0%) | $76,667 |
Occupancy by Householder Income Bracket in Kibler
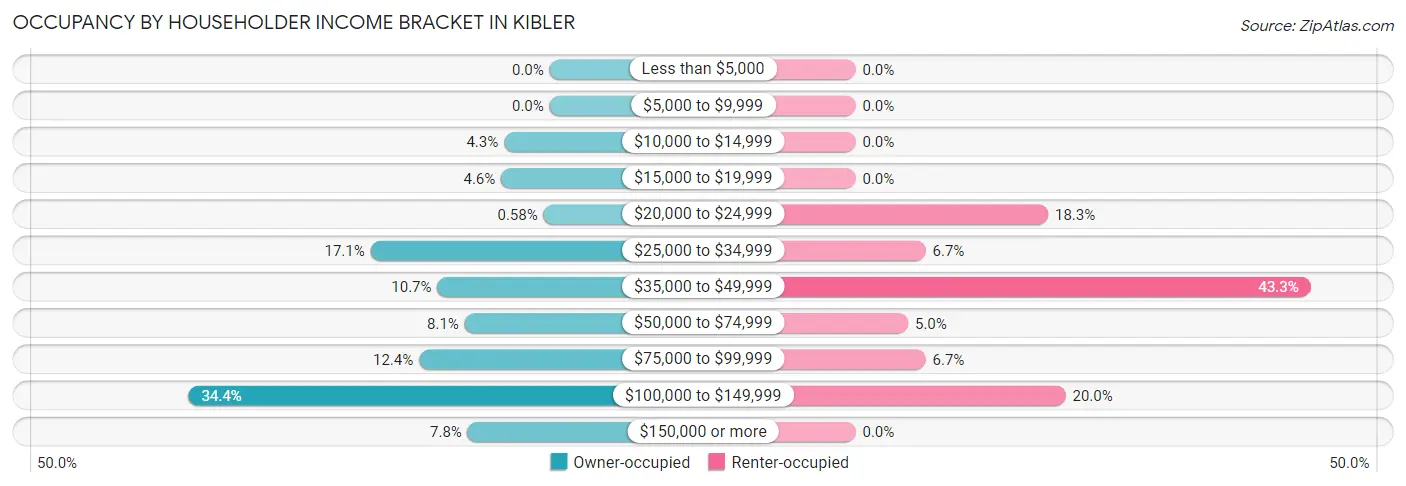
| Income Bracket | Owner-occupied | Renter-occupied |
| Less than $5,000 | 0 (0.0%) | 0 (0.0%) |
| $5,000 to $9,999 | 0 (0.0%) | 0 (0.0%) |
| $10,000 to $14,999 | 15 (4.3%) | 0 (0.0%) |
| $15,000 to $19,999 | 16 (4.6%) | 0 (0.0%) |
| $20,000 to $24,999 | 2 (0.6%) | 11 (18.3%) |
| $25,000 to $34,999 | 59 (17.1%) | 4 (6.7%) |
| $35,000 to $49,999 | 37 (10.7%) | 26 (43.3%) |
| $50,000 to $74,999 | 28 (8.1%) | 3 (5.0%) |
| $75,000 to $99,999 | 43 (12.4%) | 4 (6.7%) |
| $100,000 to $149,999 | 119 (34.4%) | 12 (20.0%) |
| $150,000 or more | 27 (7.8%) | 0 (0.0%) |
| Total | 346 (100.0%) | 60 (100.0%) |
Monthly Housing Cost Tiers in Kibler
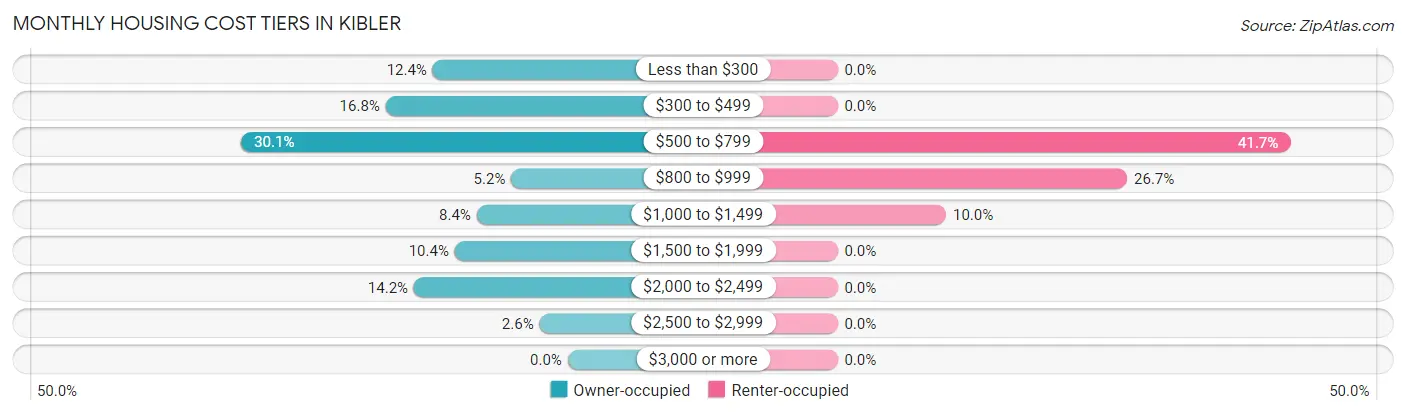
| Monthly Cost | Owner-occupied | Renter-occupied |
| Less than $300 | 43 (12.4%) | 0 (0.0%) |
| $300 to $499 | 58 (16.8%) | 0 (0.0%) |
| $500 to $799 | 104 (30.1%) | 25 (41.7%) |
| $800 to $999 | 18 (5.2%) | 16 (26.7%) |
| $1,000 to $1,499 | 29 (8.4%) | 6 (10.0%) |
| $1,500 to $1,999 | 36 (10.4%) | 0 (0.0%) |
| $2,000 to $2,499 | 49 (14.2%) | 0 (0.0%) |
| $2,500 to $2,999 | 9 (2.6%) | 0 (0.0%) |
| $3,000 or more | 0 (0.0%) | 0 (0.0%) |
| Total | 346 (100.0%) | 60 (100.0%) |
Physical Housing Characteristics in Kibler
Housing Structures in Kibler
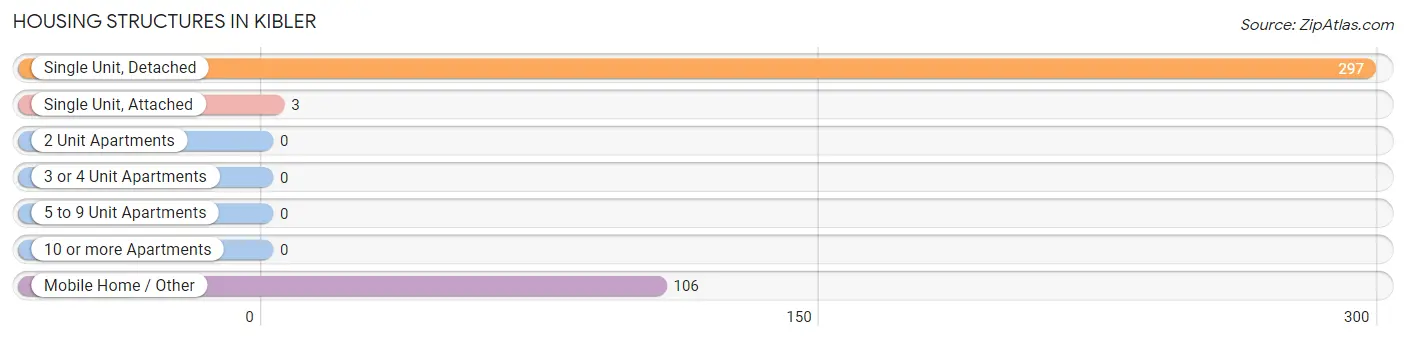
| Structure Type | # Housing Units | % Housing Units |
| Single Unit, Detached | 297 | 73.2% |
| Single Unit, Attached | 3 | 0.7% |
| 2 Unit Apartments | 0 | 0.0% |
| 3 or 4 Unit Apartments | 0 | 0.0% |
| 5 to 9 Unit Apartments | 0 | 0.0% |
| 10 or more Apartments | 0 | 0.0% |
| Mobile Home / Other | 106 | 26.1% |
| Total | 406 | 100.0% |
Housing Structures by Occupancy in Kibler
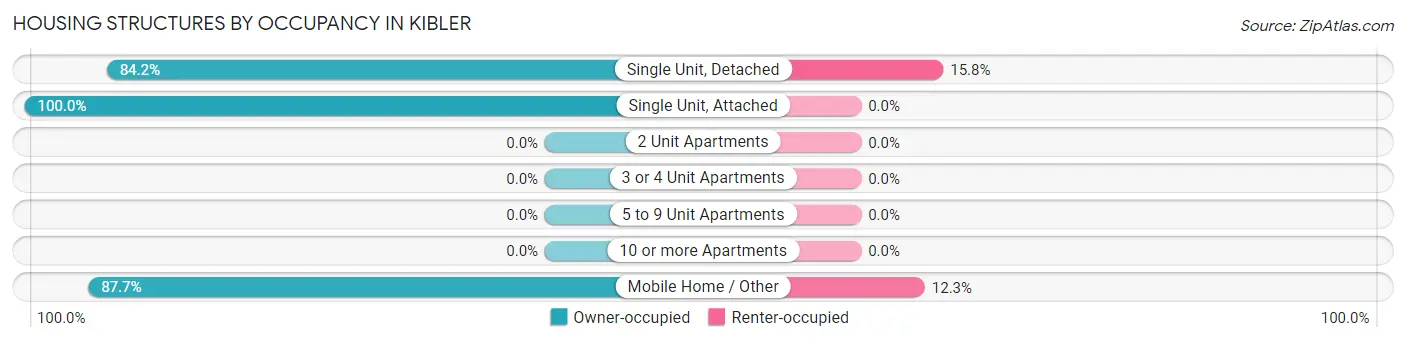
| Structure Type | Owner-occupied | Renter-occupied |
| Single Unit, Detached | 250 (84.2%) | 47 (15.8%) |
| Single Unit, Attached | 3 (100.0%) | 0 (0.0%) |
| 2 Unit Apartments | 0 (0.0%) | 0 (0.0%) |
| 3 or 4 Unit Apartments | 0 (0.0%) | 0 (0.0%) |
| 5 to 9 Unit Apartments | 0 (0.0%) | 0 (0.0%) |
| 10 or more Apartments | 0 (0.0%) | 0 (0.0%) |
| Mobile Home / Other | 93 (87.7%) | 13 (12.3%) |
| Total | 346 (85.2%) | 60 (14.8%) |
Housing Structures by Number of Rooms in Kibler
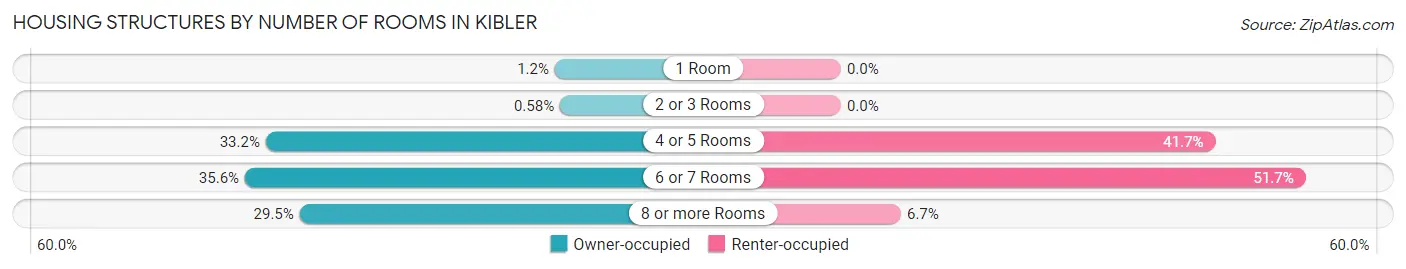
| Number of Rooms | Owner-occupied | Renter-occupied |
| 1 Room | 4 (1.2%) | 0 (0.0%) |
| 2 or 3 Rooms | 2 (0.6%) | 0 (0.0%) |
| 4 or 5 Rooms | 115 (33.2%) | 25 (41.7%) |
| 6 or 7 Rooms | 123 (35.5%) | 31 (51.7%) |
| 8 or more Rooms | 102 (29.5%) | 4 (6.7%) |
| Total | 346 (100.0%) | 60 (100.0%) |
Housing Structure by Heating Type in Kibler
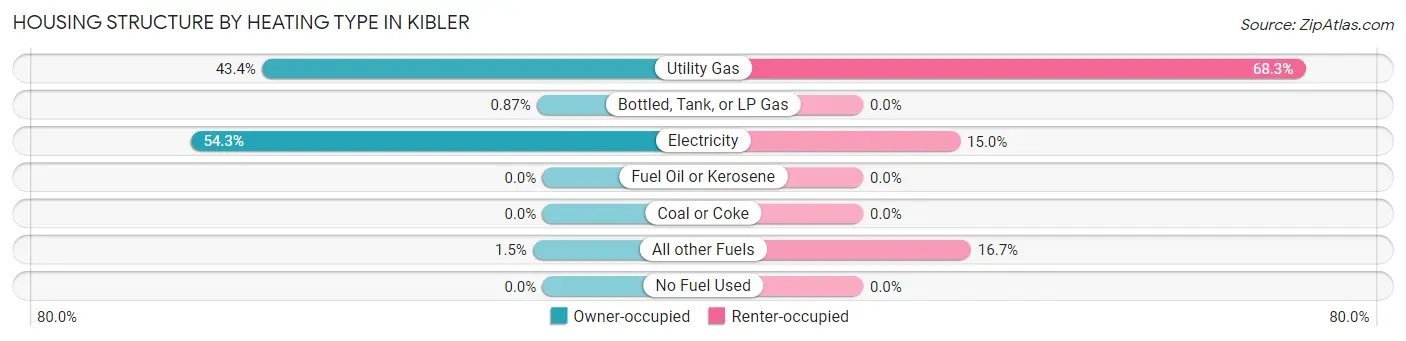
| Heating Type | Owner-occupied | Renter-occupied |
| Utility Gas | 150 (43.3%) | 41 (68.3%) |
| Bottled, Tank, or LP Gas | 3 (0.9%) | 0 (0.0%) |
| Electricity | 188 (54.3%) | 9 (15.0%) |
| Fuel Oil or Kerosene | 0 (0.0%) | 0 (0.0%) |
| Coal or Coke | 0 (0.0%) | 0 (0.0%) |
| All other Fuels | 5 (1.5%) | 10 (16.7%) |
| No Fuel Used | 0 (0.0%) | 0 (0.0%) |
| Total | 346 (100.0%) | 60 (100.0%) |
Household Vehicle Usage in Kibler
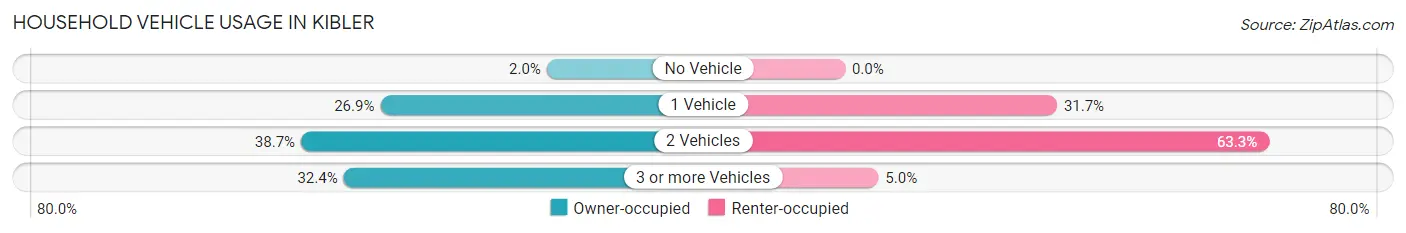
| Vehicles per Household | Owner-occupied | Renter-occupied |
| No Vehicle | 7 (2.0%) | 0 (0.0%) |
| 1 Vehicle | 93 (26.9%) | 19 (31.7%) |
| 2 Vehicles | 134 (38.7%) | 38 (63.3%) |
| 3 or more Vehicles | 112 (32.4%) | 3 (5.0%) |
| Total | 346 (100.0%) | 60 (100.0%) |
Real Estate & Mortgages in Kibler
Real Estate and Mortgage Overview in Kibler
| Characteristic | Without Mortgage | With Mortgage |
| Housing Units | 137 | 209 |
| Median Property Value | $150,600 | $189,100 |
| Median Household Income | $47,132 | $9 |
| Monthly Housing Costs | $358 | $0 |
| Real Estate Taxes | $694 | $16 |
Property Value by Mortgage Status in Kibler
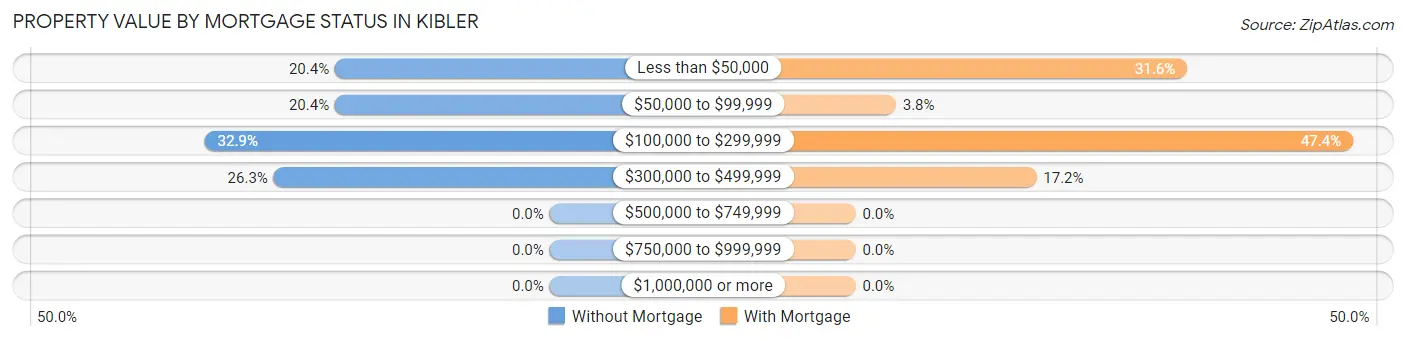
| Property Value | Without Mortgage | With Mortgage |
| Less than $50,000 | 28 (20.4%) | 66 (31.6%) |
| $50,000 to $99,999 | 28 (20.4%) | 8 (3.8%) |
| $100,000 to $299,999 | 45 (32.9%) | 99 (47.4%) |
| $300,000 to $499,999 | 36 (26.3%) | 36 (17.2%) |
| $500,000 to $749,999 | 0 (0.0%) | 0 (0.0%) |
| $750,000 to $999,999 | 0 (0.0%) | 0 (0.0%) |
| $1,000,000 or more | 0 (0.0%) | 0 (0.0%) |
| Total | 137 (100.0%) | 209 (100.0%) |
Household Income by Mortgage Status in Kibler
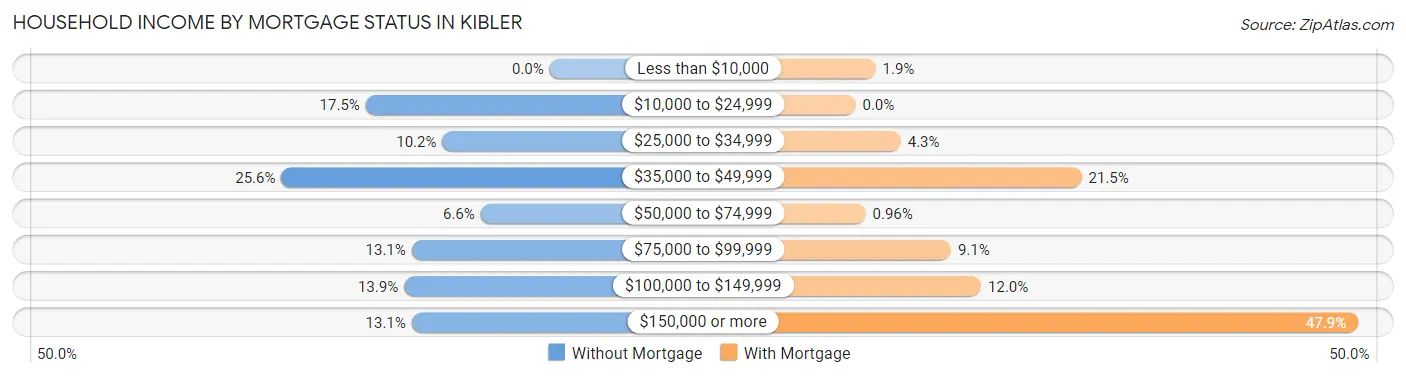
| Household Income | Without Mortgage | With Mortgage |
| Less than $10,000 | 0 (0.0%) | 4 (1.9%) |
| $10,000 to $24,999 | 24 (17.5%) | 0 (0.0%) |
| $25,000 to $34,999 | 14 (10.2%) | 9 (4.3%) |
| $35,000 to $49,999 | 35 (25.6%) | 45 (21.5%) |
| $50,000 to $74,999 | 9 (6.6%) | 2 (1.0%) |
| $75,000 to $99,999 | 18 (13.1%) | 19 (9.1%) |
| $100,000 to $149,999 | 19 (13.9%) | 25 (12.0%) |
| $150,000 or more | 18 (13.1%) | 100 (47.8%) |
| Total | 137 (100.0%) | 209 (100.0%) |
Property Value to Household Income Ratio in Kibler
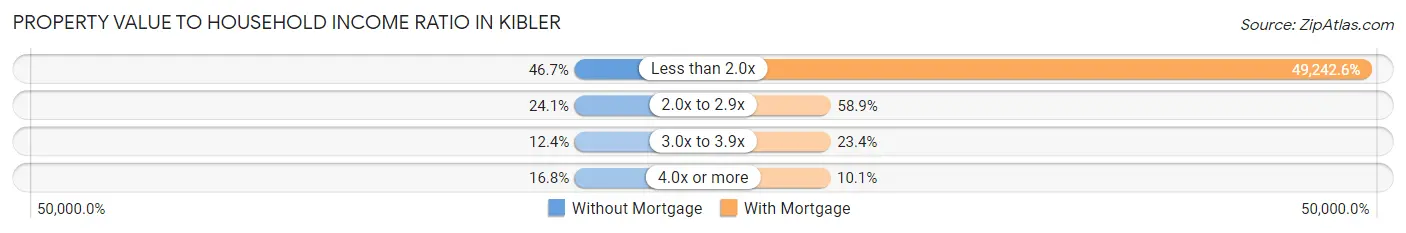
| Value-to-Income Ratio | Without Mortgage | With Mortgage |
| Less than 2.0x | 64 (46.7%) | 102,917 (49,242.6%) |
| 2.0x to 2.9x | 33 (24.1%) | 123 (58.9%) |
| 3.0x to 3.9x | 17 (12.4%) | 49 (23.4%) |
| 4.0x or more | 23 (16.8%) | 21 (10.1%) |
| Total | 137 (100.0%) | 209 (100.0%) |
Real Estate Taxes by Mortgage Status in Kibler
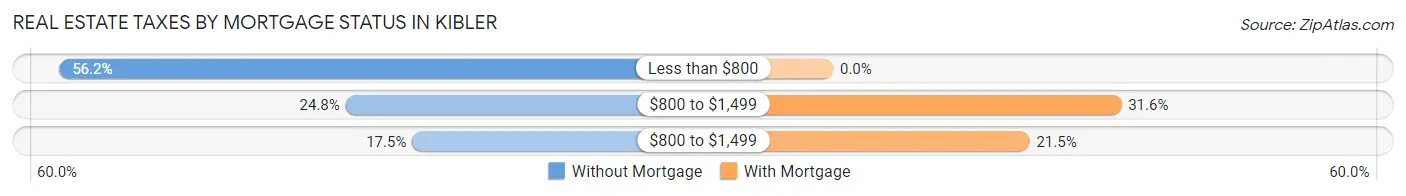
| Property Taxes | Without Mortgage | With Mortgage |
| Less than $800 | 77 (56.2%) | 0 (0.0%) |
| $800 to $1,499 | 34 (24.8%) | 66 (31.6%) |
| $800 to $1,499 | 24 (17.5%) | 45 (21.5%) |
| Total | 137 (100.0%) | 209 (100.0%) |
Health & Disability in Kibler
Health Insurance Coverage by Age in Kibler
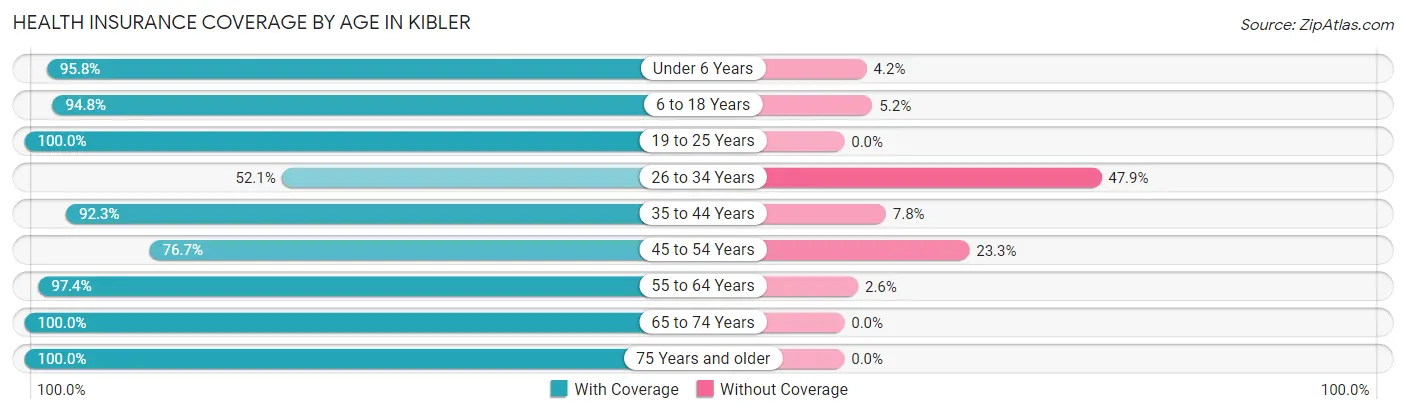
| Age Bracket | With Coverage | Without Coverage |
| Under 6 Years | 92 (95.8%) | 4 (4.2%) |
| 6 to 18 Years | 199 (94.8%) | 11 (5.2%) |
| 19 to 25 Years | 46 (100.0%) | 0 (0.0%) |
| 26 to 34 Years | 100 (52.1%) | 92 (47.9%) |
| 35 to 44 Years | 131 (92.2%) | 11 (7.7%) |
| 45 to 54 Years | 102 (76.7%) | 31 (23.3%) |
| 55 to 64 Years | 152 (97.4%) | 4 (2.6%) |
| 65 to 74 Years | 92 (100.0%) | 0 (0.0%) |
| 75 Years and older | 74 (100.0%) | 0 (0.0%) |
| Total | 988 (86.6%) | 153 (13.4%) |
Health Insurance Coverage by Citizenship Status in Kibler
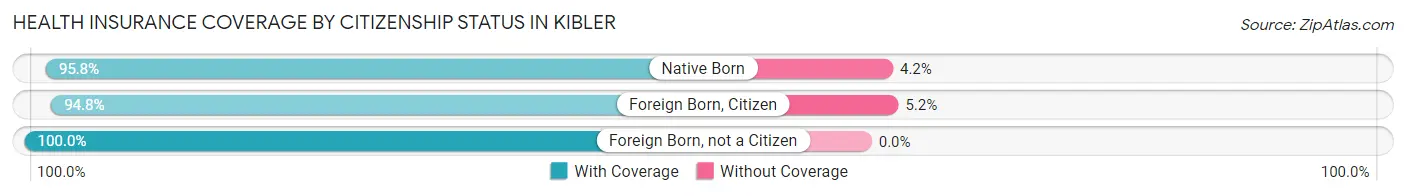
| Citizenship Status | With Coverage | Without Coverage |
| Native Born | 92 (95.8%) | 4 (4.2%) |
| Foreign Born, Citizen | 199 (94.8%) | 11 (5.2%) |
| Foreign Born, not a Citizen | 46 (100.0%) | 0 (0.0%) |
Health Insurance Coverage by Household Income in Kibler
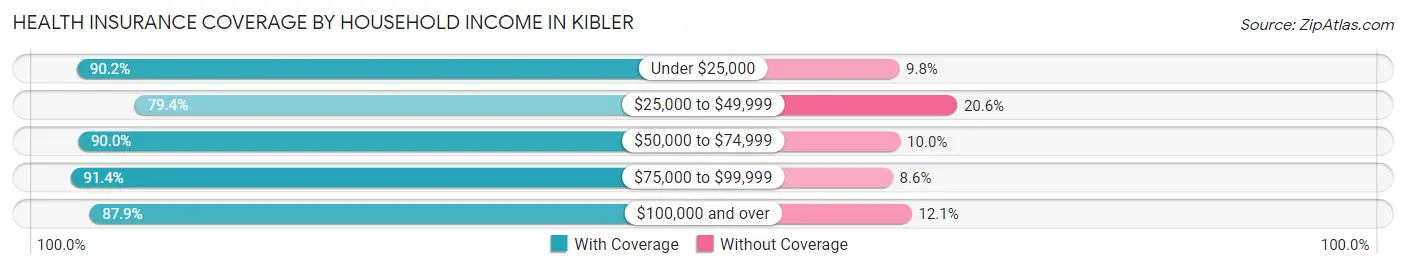
| Household Income | With Coverage | Without Coverage |
| Under $25,000 | 92 (90.2%) | 10 (9.8%) |
| $25,000 to $49,999 | 223 (79.4%) | 58 (20.6%) |
| $50,000 to $74,999 | 99 (90.0%) | 11 (10.0%) |
| $75,000 to $99,999 | 117 (91.4%) | 11 (8.6%) |
| $100,000 and over | 457 (87.9%) | 63 (12.1%) |
Public vs Private Health Insurance Coverage by Age in Kibler
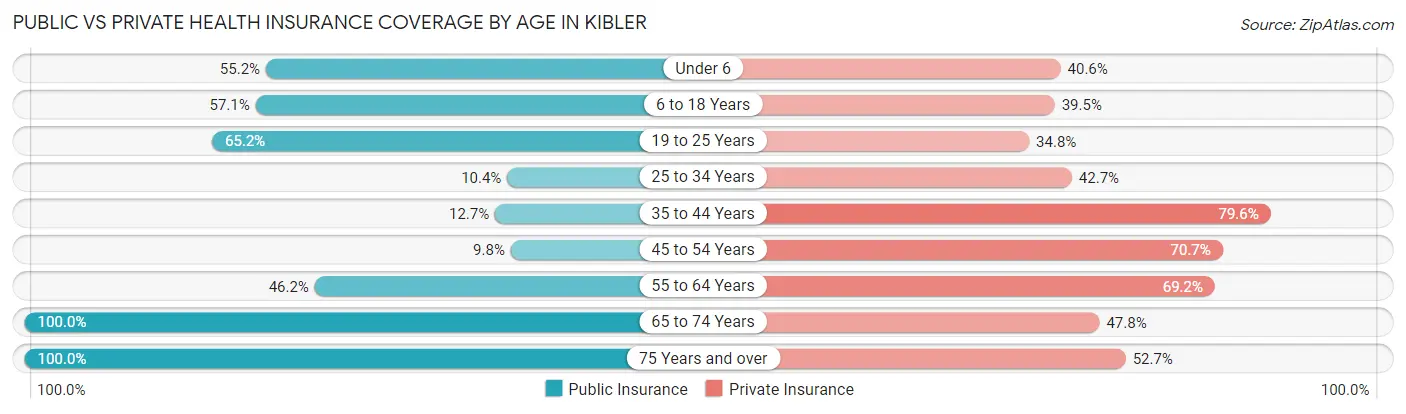
| Age Bracket | Public Insurance | Private Insurance |
| Under 6 | 53 (55.2%) | 39 (40.6%) |
| 6 to 18 Years | 120 (57.1%) | 83 (39.5%) |
| 19 to 25 Years | 30 (65.2%) | 16 (34.8%) |
| 25 to 34 Years | 20 (10.4%) | 82 (42.7%) |
| 35 to 44 Years | 18 (12.7%) | 113 (79.6%) |
| 45 to 54 Years | 13 (9.8%) | 94 (70.7%) |
| 55 to 64 Years | 72 (46.2%) | 108 (69.2%) |
| 65 to 74 Years | 92 (100.0%) | 44 (47.8%) |
| 75 Years and over | 74 (100.0%) | 39 (52.7%) |
| Total | 492 (43.1%) | 618 (54.2%) |
Disability Status by Sex by Age in Kibler
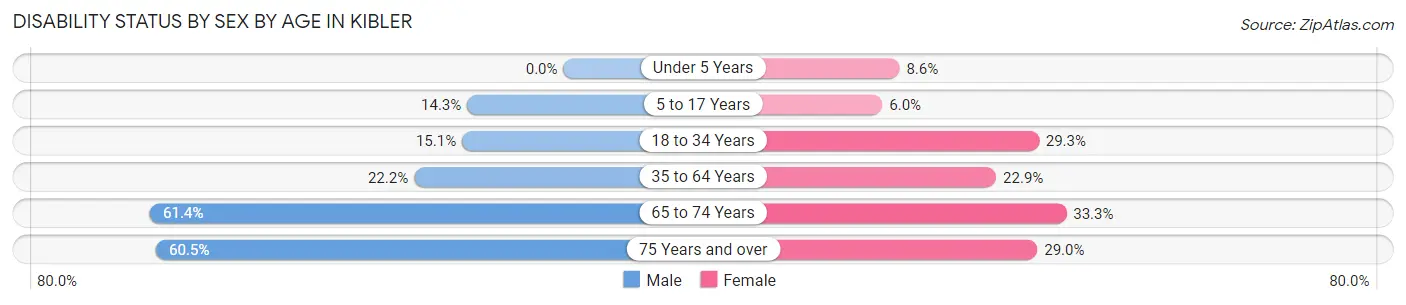
| Age Bracket | Male | Female |
| Under 5 Years | 0 (0.0%) | 3 (8.6%) |
| 5 to 17 Years | 12 (14.3%) | 8 (6.0%) |
| 18 to 34 Years | 14 (15.0%) | 43 (29.2%) |
| 35 to 64 Years | 53 (22.2%) | 44 (22.9%) |
| 65 to 74 Years | 27 (61.4%) | 16 (33.3%) |
| 75 Years and over | 26 (60.5%) | 9 (29.0%) |
Disability Class by Sex by Age in Kibler
Disability Class: Hearing Difficulty
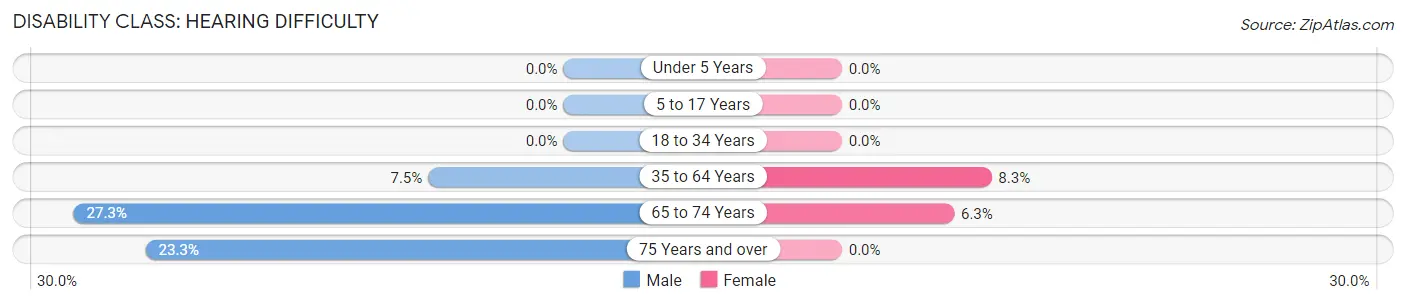
| Age Bracket | Male | Female |
| Under 5 Years | 0 (0.0%) | 0 (0.0%) |
| 5 to 17 Years | 0 (0.0%) | 0 (0.0%) |
| 18 to 34 Years | 0 (0.0%) | 0 (0.0%) |
| 35 to 64 Years | 18 (7.5%) | 16 (8.3%) |
| 65 to 74 Years | 12 (27.3%) | 3 (6.2%) |
| 75 Years and over | 10 (23.3%) | 0 (0.0%) |
Disability Class: Vision Difficulty
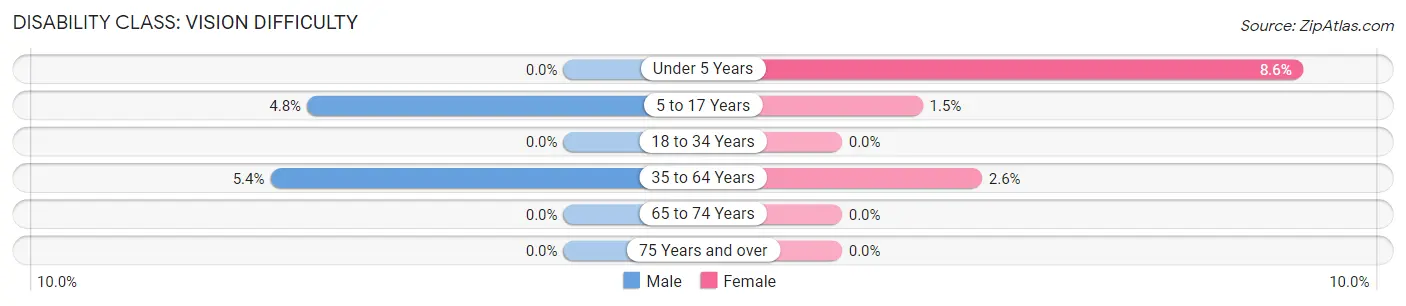
| Age Bracket | Male | Female |
| Under 5 Years | 0 (0.0%) | 3 (8.6%) |
| 5 to 17 Years | 4 (4.8%) | 2 (1.5%) |
| 18 to 34 Years | 0 (0.0%) | 0 (0.0%) |
| 35 to 64 Years | 13 (5.4%) | 5 (2.6%) |
| 65 to 74 Years | 0 (0.0%) | 0 (0.0%) |
| 75 Years and over | 0 (0.0%) | 0 (0.0%) |
Disability Class: Cognitive Difficulty
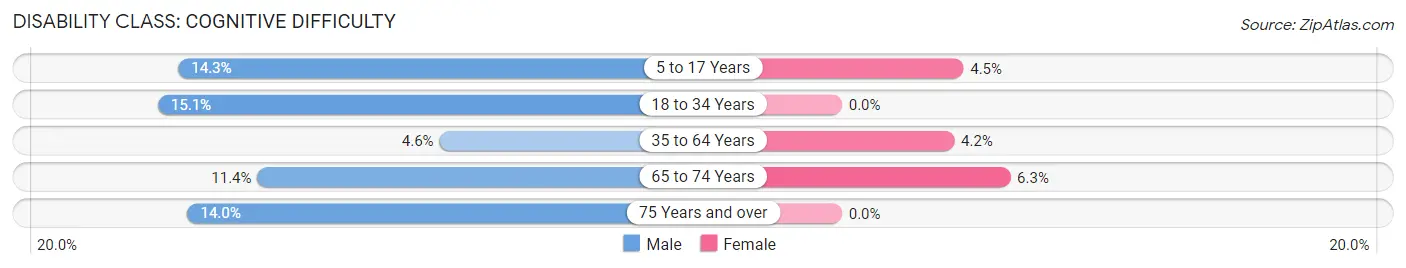
| Age Bracket | Male | Female |
| 5 to 17 Years | 12 (14.3%) | 6 (4.5%) |
| 18 to 34 Years | 14 (15.0%) | 0 (0.0%) |
| 35 to 64 Years | 11 (4.6%) | 8 (4.2%) |
| 65 to 74 Years | 5 (11.4%) | 3 (6.2%) |
| 75 Years and over | 6 (14.0%) | 0 (0.0%) |
Disability Class: Ambulatory Difficulty
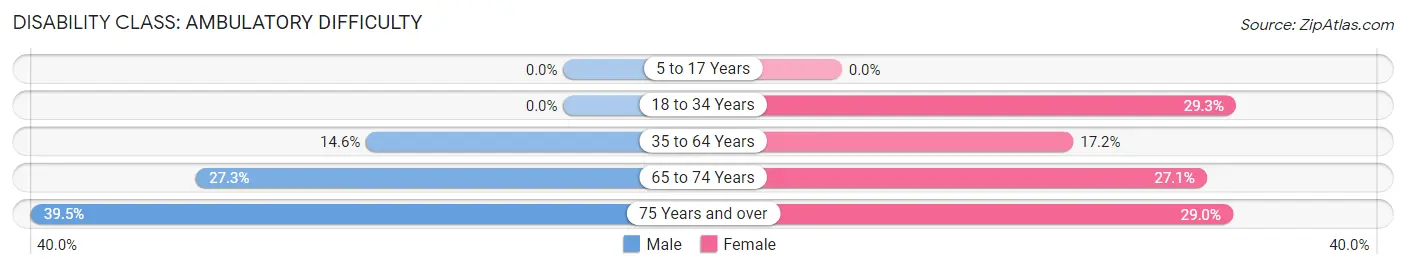
| Age Bracket | Male | Female |
| 5 to 17 Years | 0 (0.0%) | 0 (0.0%) |
| 18 to 34 Years | 0 (0.0%) | 43 (29.2%) |
| 35 to 64 Years | 35 (14.6%) | 33 (17.2%) |
| 65 to 74 Years | 12 (27.3%) | 13 (27.1%) |
| 75 Years and over | 17 (39.5%) | 9 (29.0%) |
Disability Class: Self-Care Difficulty
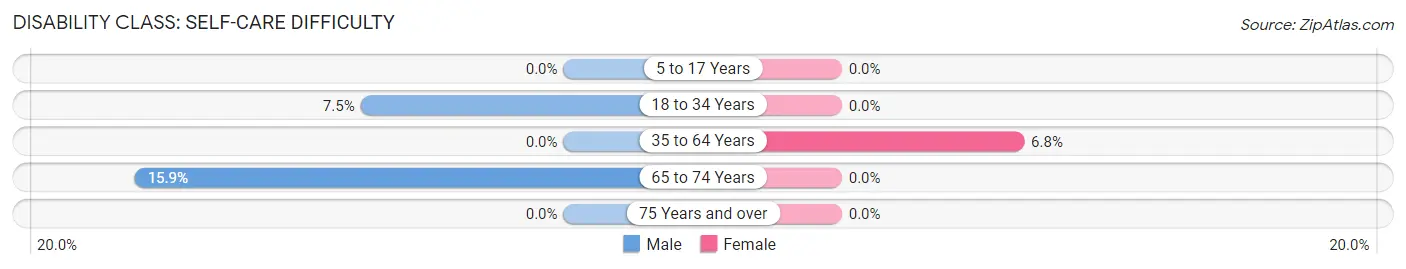
| Age Bracket | Male | Female |
| 5 to 17 Years | 0 (0.0%) | 0 (0.0%) |
| 18 to 34 Years | 7 (7.5%) | 0 (0.0%) |
| 35 to 64 Years | 0 (0.0%) | 13 (6.8%) |
| 65 to 74 Years | 7 (15.9%) | 0 (0.0%) |
| 75 Years and over | 0 (0.0%) | 0 (0.0%) |
Technology Access in Kibler
Computing Device Access in Kibler
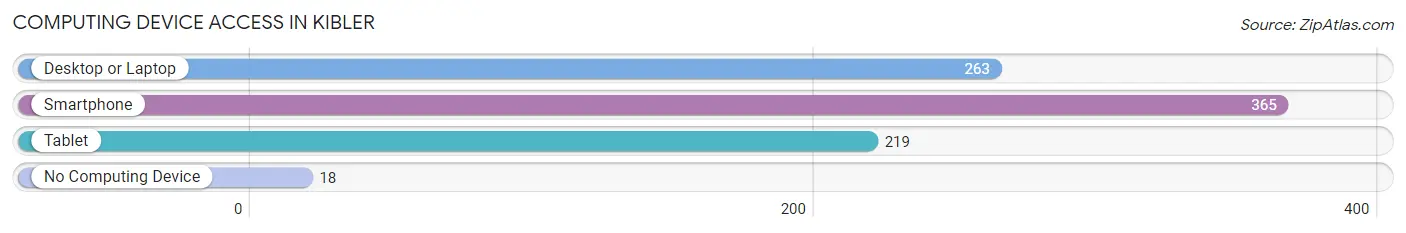
| Device Type | # Households | % Households |
| Desktop or Laptop | 263 | 64.8% |
| Smartphone | 365 | 89.9% |
| Tablet | 219 | 53.9% |
| No Computing Device | 18 | 4.4% |
| Total | 406 | 100.0% |
Internet Access in Kibler
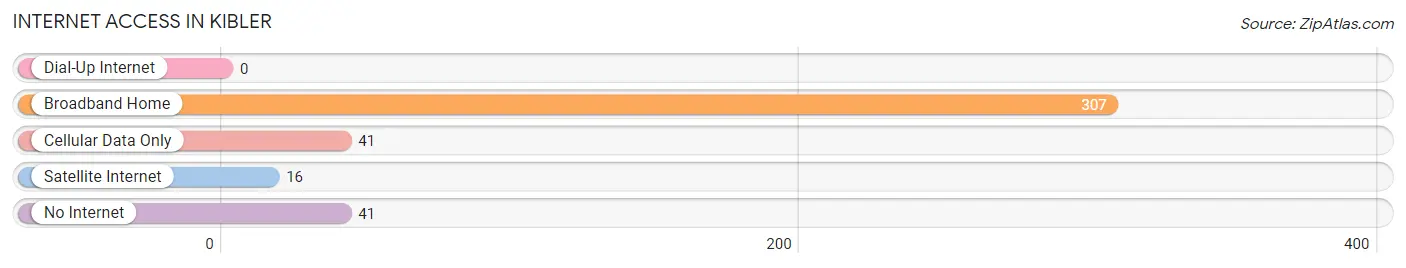
| Internet Type | # Households | % Households |
| Dial-Up Internet | 0 | 0.0% |
| Broadband Home | 307 | 75.6% |
| Cellular Data Only | 41 | 10.1% |
| Satellite Internet | 16 | 3.9% |
| No Internet | 41 | 10.1% |
| Total | 406 | 100.0% |
Kibler Summary
Kibler is a small town located in Crawford County, Arkansas. It is situated in the northwest corner of the state, just south of the Oklahoma border. The town was founded in 1887 and has a population of approximately 1,000 people.
Kibler is located in the Ozark Mountains, which are known for their rolling hills and lush forests. The town is surrounded by the Ozark National Forest, which provides a variety of recreational activities such as camping, hiking, fishing, and hunting. The town is also home to several lakes, including Lake Fort Smith and Lake Wedington.
The economy of Kibler is largely based on agriculture. The town is home to several farms, which produce a variety of crops such as corn, soybeans, wheat, and hay. The town also has a few small businesses, including a grocery store, a hardware store, and a few restaurants.
Kibler has a rich history. The town was founded in 1887 by a group of settlers from Missouri. The settlers were attracted to the area due to its fertile soil and abundant natural resources. The town was named after a local settler, John Kibler.
Kibler has a diverse population. According to the 2010 census, the town has a population of 1,000 people. The population is made up of a variety of ethnic backgrounds, including African American, Hispanic, and Native American. The town also has a large number of retirees, as well as a growing number of young professionals.
Kibler is served by the Crawford County School District. The district has two elementary schools, one middle school, and one high school. The town also has a library, a post office, and a few churches.
Kibler is a small town with a big heart. The town is known for its friendly people and its strong sense of community. The town is also known for its beautiful scenery and its abundance of outdoor activities. Kibler is a great place to live, work, and raise a family.
Common Questions
What is Per Capita Income in Kibler?
Per Capita income in Kibler is $28,194.
What is the Median Family Income in Kibler?
Median Family Income in Kibler is $70,833.
What is the Median Household income in Kibler?
Median Household Income in Kibler is $76,667.
What is Income or Wage Gap in Kibler?
Income or Wage Gap in Kibler is 49.6%.
Women in Kibler earn 50.4 cents for every dollar earned by a man.
What is Inequality or Gini Index in Kibler?
Inequality or Gini Index in Kibler is 0.35.
What is the Total Population of Kibler?
Total Population of Kibler is 1,141.
What is the Total Male Population of Kibler?
Total Male Population of Kibler is 555.
What is the Total Female Population of Kibler?
Total Female Population of Kibler is 586.
What is the Ratio of Males per 100 Females in Kibler?
There are 94.71 Males per 100 Females in Kibler.
What is the Ratio of Females per 100 Males in Kibler?
There are 105.59 Females per 100 Males in Kibler.
What is the Median Population Age in Kibler?
Median Population Age in Kibler is 36.5 Years.
What is the Average Family Size in Kibler
Average Family Size in Kibler is 2.9 People.
What is the Average Household Size in Kibler
Average Household Size in Kibler is 2.8 People.
How Large is the Labor Force in Kibler?
There are 463 People in the Labor Forcein in Kibler.
What is the Percentage of People in the Labor Force in Kibler?
54.2% of People are in the Labor Force in Kibler.
What is the Unemployment Rate in Kibler?
Unemployment Rate in Kibler is 4.3%.