Perrytown, AR Map & Demographics
Perrytown Map
Perrytown Overview
$22,382
PER CAPITA INCOME
$52,969
AVG HOUSEHOLD INCOME
19.2%
WAGE / INCOME GAP [ % ]
80.8¢/ $1
WAGE / INCOME GAP [ $ ]
0.41
INEQUALITY / GINI INDEX
415
TOTAL POPULATION
261
MALE POPULATION
154
FEMALE POPULATION
169.48
MALES / 100 FEMALES
59.00
FEMALES / 100 MALES
21.6
MEDIAN AGE
4.7
AVG FAMILY SIZE
3.8
AVG HOUSEHOLD SIZE
192
LABOR FORCE [ PEOPLE ]
78.4%
PERCENT IN LABOR FORCE
Income in Perrytown
Income Overview in Perrytown
| Characteristic | Number | Measure |
| Per Capita Income | 415 | $22,382 |
| Median Family Income | 81 | $0 |
| Mean Family Income | 81 | $86,684 |
| Median Household Income | 109 | $52,969 |
| Mean Household Income | 109 | $74,869 |
| Income Deficit | 81 | $0 |
| Wage / Income Gap (%) | 415 | 19.18% |
| Wage / Income Gap ($) | 415 | 80.82¢ per $1 |
| Gini / Inequality Index | 415 | 0.41 |
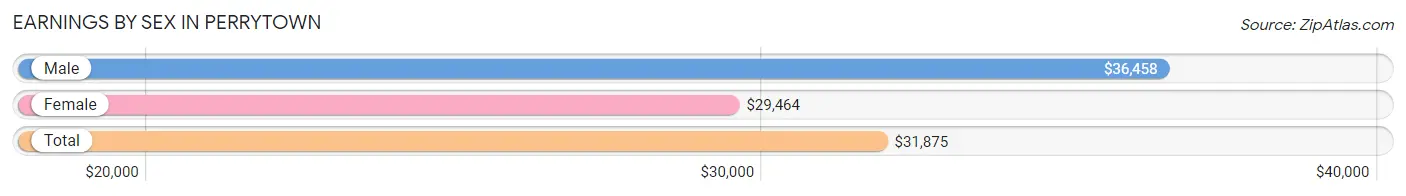
Earnings by Sex in Perrytown
Average Earnings in Perrytown are $31,875, $36,458 for men and $29,464 for women, a difference of 19.2%.
| Sex | Number | Average Earnings |
| Male | 113 (57.4%) | $36,458 |
| Female | 84 (42.6%) | $29,464 |
| Total | 197 (100.0%) | $31,875 |
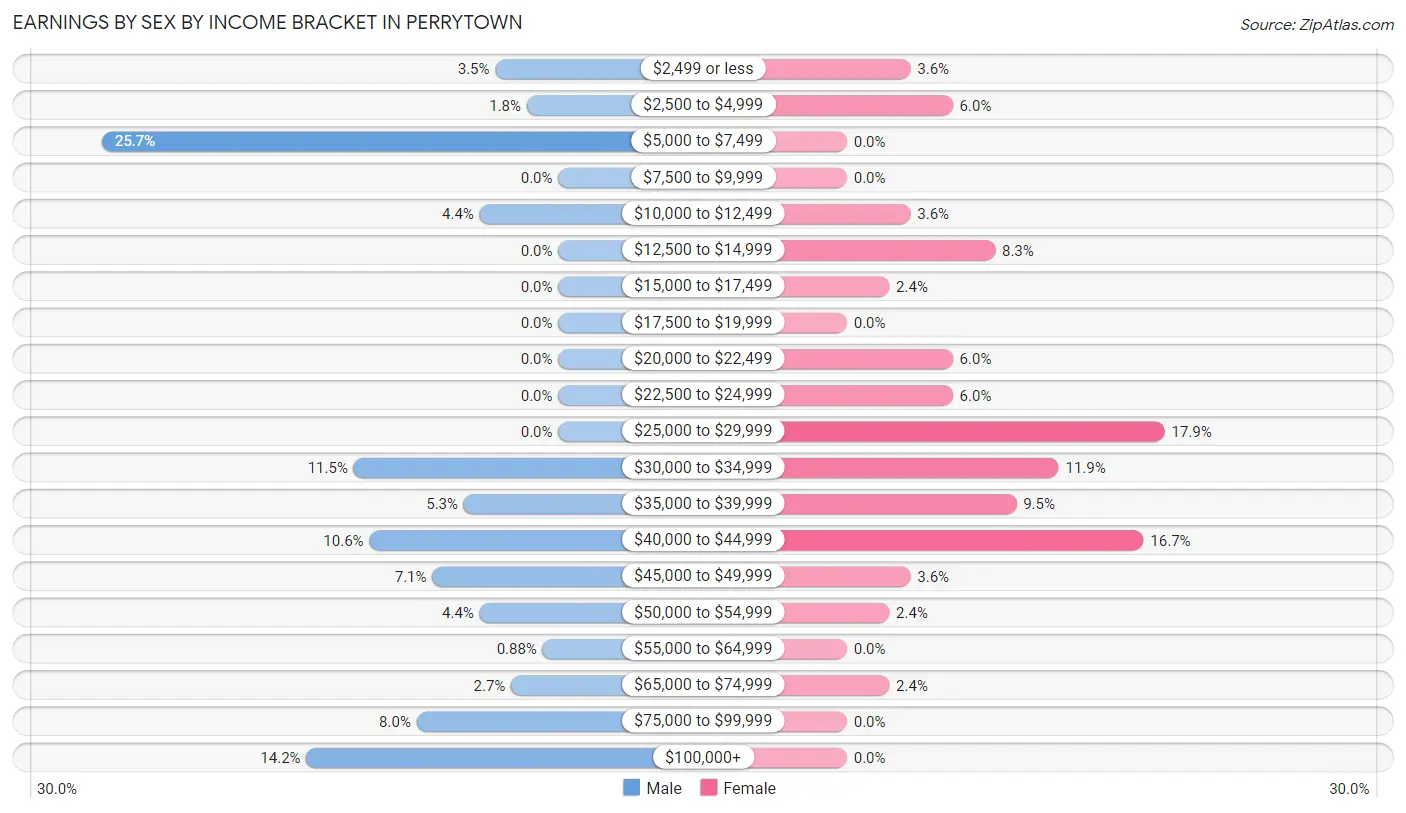
Earnings by Sex by Income Bracket in Perrytown
The most common earnings brackets in Perrytown are $5,000 to $7,499 for men (29 | 25.7%) and $25,000 to $29,999 for women (15 | 17.9%).
| Income | Male | Female |
| $2,499 or less | 4 (3.5%) | 3 (3.6%) |
| $2,500 to $4,999 | 2 (1.8%) | 5 (5.9%) |
| $5,000 to $7,499 | 29 (25.7%) | 0 (0.0%) |
| $7,500 to $9,999 | 0 (0.0%) | 0 (0.0%) |
| $10,000 to $12,499 | 5 (4.4%) | 3 (3.6%) |
| $12,500 to $14,999 | 0 (0.0%) | 7 (8.3%) |
| $15,000 to $17,499 | 0 (0.0%) | 2 (2.4%) |
| $17,500 to $19,999 | 0 (0.0%) | 0 (0.0%) |
| $20,000 to $22,499 | 0 (0.0%) | 5 (5.9%) |
| $22,500 to $24,999 | 0 (0.0%) | 5 (5.9%) |
| $25,000 to $29,999 | 0 (0.0%) | 15 (17.9%) |
| $30,000 to $34,999 | 13 (11.5%) | 10 (11.9%) |
| $35,000 to $39,999 | 6 (5.3%) | 8 (9.5%) |
| $40,000 to $44,999 | 12 (10.6%) | 14 (16.7%) |
| $45,000 to $49,999 | 8 (7.1%) | 3 (3.6%) |
| $50,000 to $54,999 | 5 (4.4%) | 2 (2.4%) |
| $55,000 to $64,999 | 1 (0.9%) | 0 (0.0%) |
| $65,000 to $74,999 | 3 (2.6%) | 2 (2.4%) |
| $75,000 to $99,999 | 9 (8.0%) | 0 (0.0%) |
| $100,000+ | 16 (14.2%) | 0 (0.0%) |
| Total | 113 (100.0%) | 84 (100.0%) |
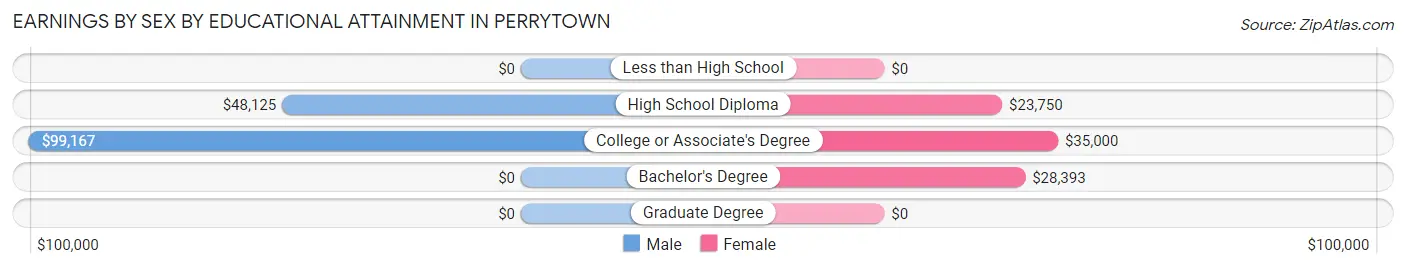
Earnings by Sex by Educational Attainment in Perrytown
Average earnings in Perrytown are $54,250 for men and $29,821 for women, a difference of 45.0%. Men with an educational attainment of college or associate's degree enjoy the highest average annual earnings of $99,167, while those with high school diploma education earn the least with $48,125. Women with an educational attainment of college or associate's degree earn the most with the average annual earnings of $35,000, while those with high school diploma education have the smallest earnings of $23,750.
| Educational Attainment | Male Income | Female Income |
| Less than High School | - | - |
| High School Diploma | $48,125 | $23,750 |
| College or Associate's Degree | $99,167 | $35,000 |
| Bachelor's Degree | - | - |
| Graduate Degree | - | - |
| Total | $54,250 | $29,821 |
Family Income in Perrytown
Family Income Brackets in Perrytown
According to the Perrytown family income data, there are 21 families falling into the $50,000 to $74,999 income range, which is the most common income bracket and makes up 25.9% of all families.
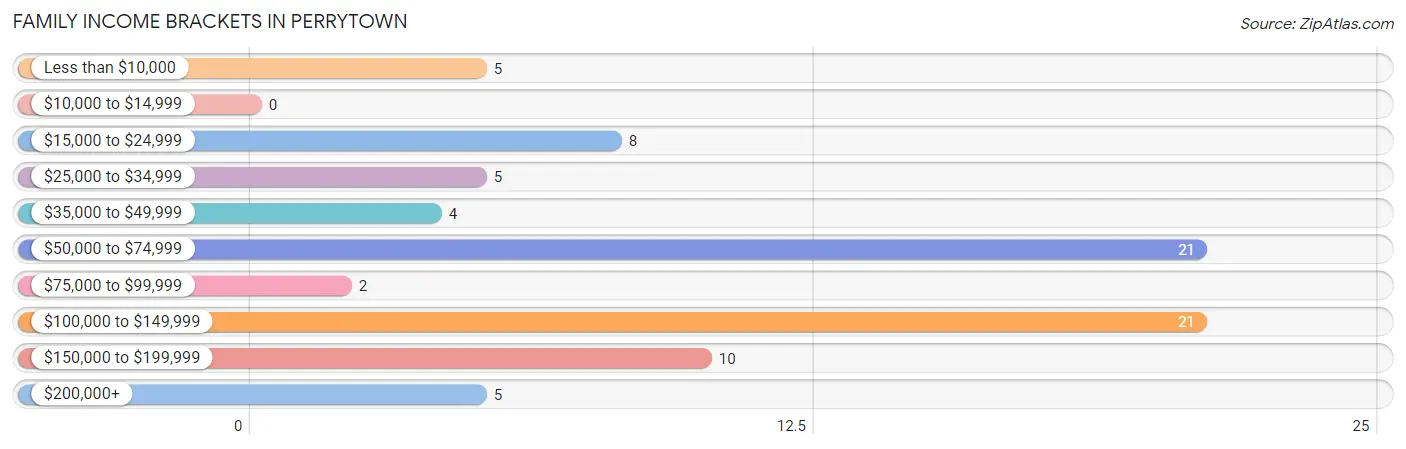
| Income Bracket | # Families | % Families |
| Less than $10,000 | 5 | 6.2% |
| $10,000 to $14,999 | 0 | 0.0% |
| $15,000 to $24,999 | 8 | 9.9% |
| $25,000 to $34,999 | 5 | 6.2% |
| $35,000 to $49,999 | 4 | 4.9% |
| $50,000 to $74,999 | 21 | 25.9% |
| $75,000 to $99,999 | 2 | 2.5% |
| $100,000 to $149,999 | 21 | 25.9% |
| $150,000 to $199,999 | 10 | 12.3% |
| $200,000+ | 5 | 6.2% |
Family Income by Famaliy Size in Perrytown
5-person families (11 | 13.6%) account for the highest median family income in Perrytown with $113,393 per family, while 2-person families (42 | 51.8%) have the highest median income of $26,250 per family member.
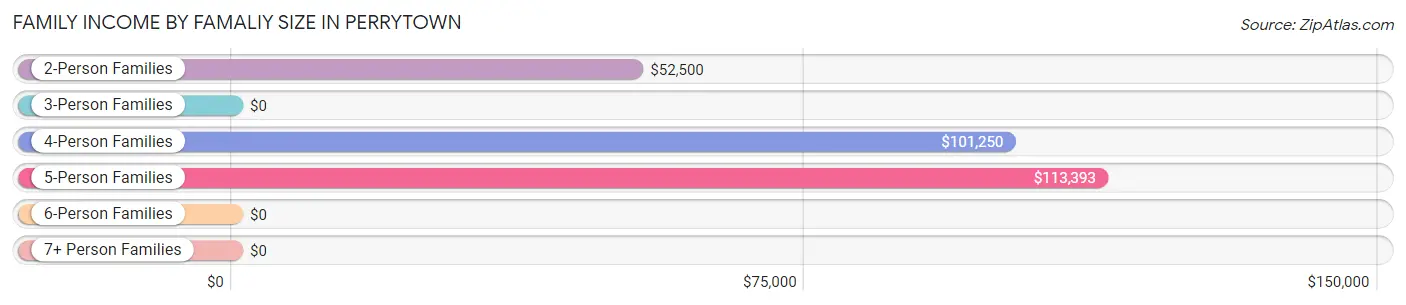
| Income Bracket | # Families | Median Income |
| 2-Person Families | 42 (51.8%) | $52,500 |
| 3-Person Families | 8 (9.9%) | $0 |
| 4-Person Families | 9 (11.1%) | $101,250 |
| 5-Person Families | 11 (13.6%) | $113,393 |
| 6-Person Families | 8 (9.9%) | $0 |
| 7+ Person Families | 3 (3.7%) | $0 |
| Total | 81 (100.0%) | $0 |
Family Income by Number of Earners in Perrytown
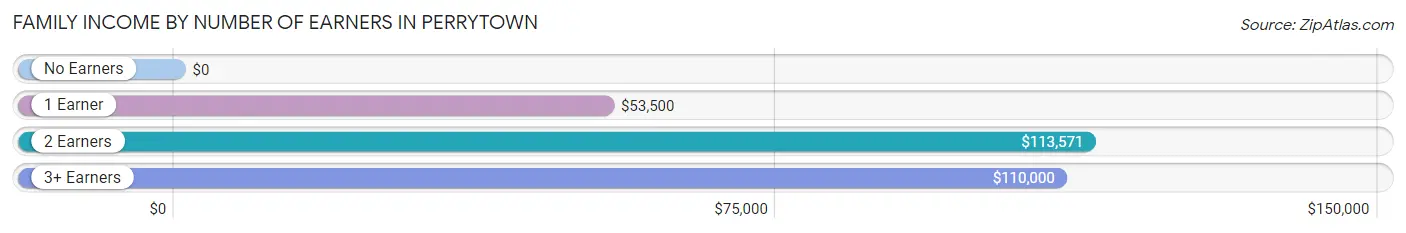
| Number of Earners | # Families | Median Income |
| No Earners | 17 (21.0%) | $0 |
| 1 Earner | 20 (24.7%) | $53,500 |
| 2 Earners | 32 (39.5%) | $113,571 |
| 3+ Earners | 12 (14.8%) | $110,000 |
| Total | 81 (100.0%) | $0 |
Household Income in Perrytown
Household Income Brackets in Perrytown
With 23 households falling in the category, the $100,000 to $149,999 income range is the most frequent in Perrytown, accounting for 21.1% of all households. In contrast, only 2 households (1.8%) fall into the $75,000 to $99,999 income bracket, making it the least populous group.
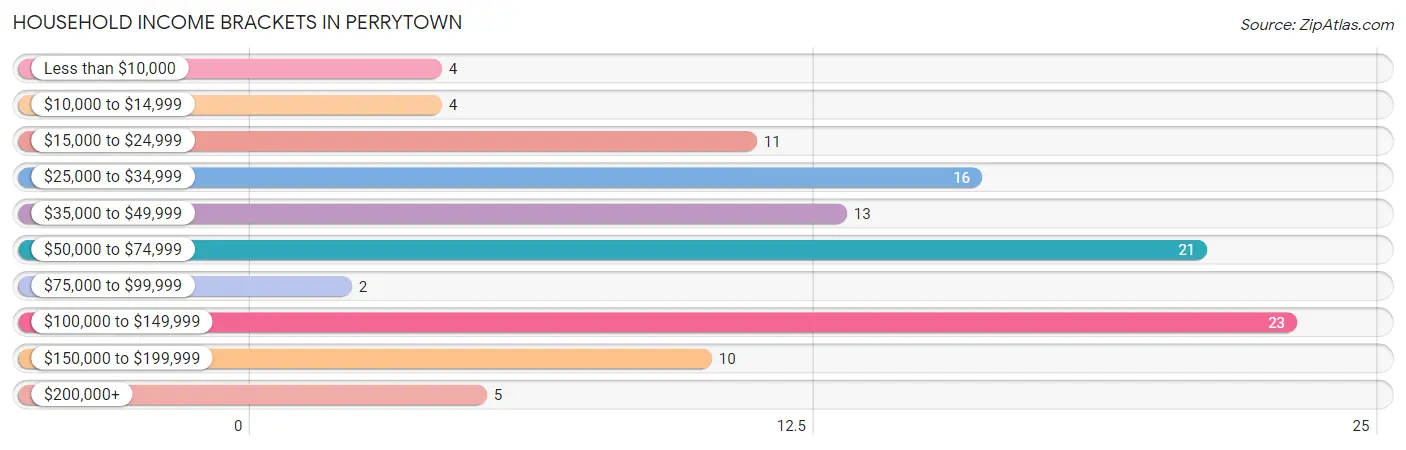
| Income Bracket | # Households | % Households |
| Less than $10,000 | 4 | 3.7% |
| $10,000 to $14,999 | 4 | 3.7% |
| $15,000 to $24,999 | 11 | 10.1% |
| $25,000 to $34,999 | 16 | 14.7% |
| $35,000 to $49,999 | 13 | 11.9% |
| $50,000 to $74,999 | 21 | 19.3% |
| $75,000 to $99,999 | 2 | 1.8% |
| $100,000 to $149,999 | 23 | 21.1% |
| $150,000 to $199,999 | 10 | 9.2% |
| $200,000+ | 5 | 4.6% |
Household Income by Householder Age in Perrytown
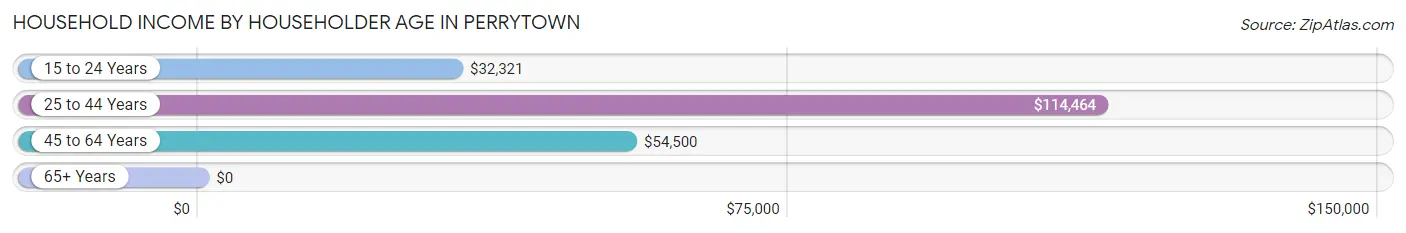
The median household income in Perrytown is $52,969, with the highest median household income of $114,464 found in the 25 to 44 years age bracket for the primary householder. A total of 33 households (30.3%) fall into this category. Meanwhile, the 65+ years age bracket for the primary householder has the lowest median household income of $0, with 31 households (28.4%) in this group.
| Income Bracket | # Households | Median Income |
| 15 to 24 Years | 17 (15.6%) | $32,321 |
| 25 to 44 Years | 33 (30.3%) | $114,464 |
| 45 to 64 Years | 28 (25.7%) | $54,500 |
| 65+ Years | 31 (28.4%) | $0 |
| Total | 109 (100.0%) | $52,969 |
Poverty in Perrytown
Income Below Poverty by Sex and Age in Perrytown
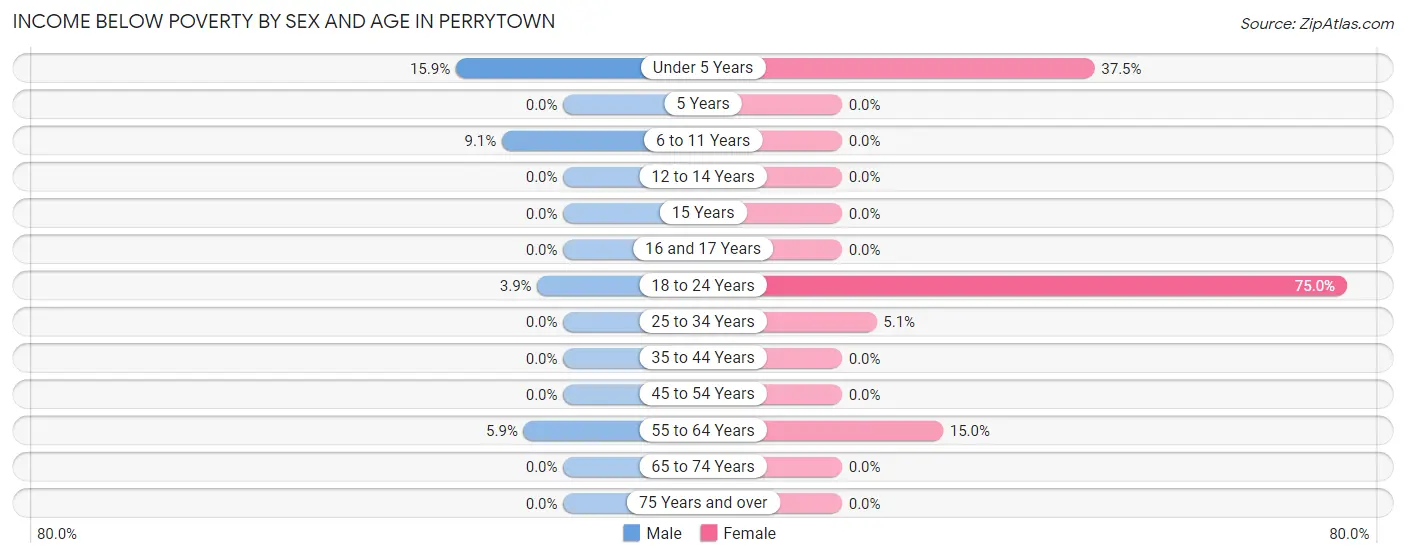
With 7.0% poverty level for males and 7.1% for females among the residents of Perrytown, under 5 year old males and 18 to 24 year old females are the most vulnerable to poverty, with 11 males (15.9%) and 3 females (75.0%) in their respective age groups living below the poverty level.
| Age Bracket | Male | Female |
| Under 5 Years | 11 (15.9%) | 3 (37.5%) |
| 5 Years | 0 (0.0%) | 0 (0.0%) |
| 6 to 11 Years | 4 (9.1%) | 0 (0.0%) |
| 12 to 14 Years | 0 (0.0%) | 0 (0.0%) |
| 15 Years | 0 (0.0%) | 0 (0.0%) |
| 16 and 17 Years | 0 (0.0%) | 0 (0.0%) |
| 18 to 24 Years | 2 (3.8%) | 3 (75.0%) |
| 25 to 34 Years | 0 (0.0%) | 2 (5.1%) |
| 35 to 44 Years | 0 (0.0%) | 0 (0.0%) |
| 45 to 54 Years | 0 (0.0%) | 0 (0.0%) |
| 55 to 64 Years | 1 (5.9%) | 3 (15.0%) |
| 65 to 74 Years | 0 (0.0%) | 0 (0.0%) |
| 75 Years and over | 0 (0.0%) | 0 (0.0%) |
| Total | 18 (7.0%) | 11 (7.1%) |
Income Above Poverty by Sex and Age in Perrytown
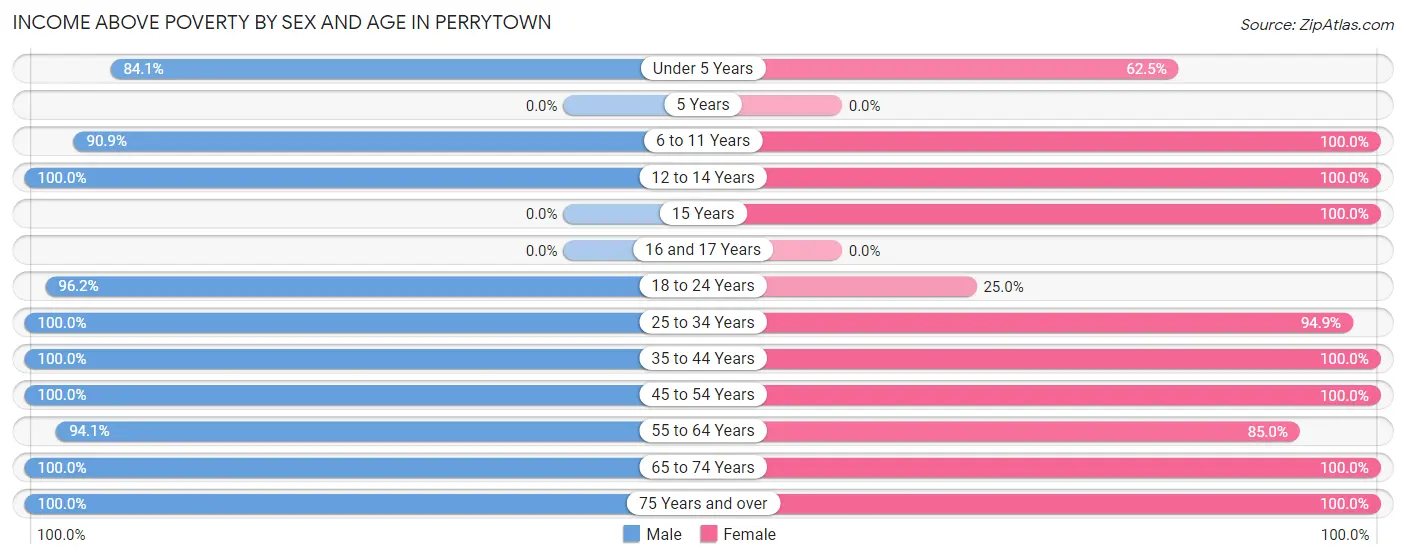
According to the poverty statistics in Perrytown, males aged 12 to 14 years and females aged 6 to 11 years are the age groups that are most secure financially, with 100.0% of males and 100.0% of females in these age groups living above the poverty line.
| Age Bracket | Male | Female |
| Under 5 Years | 58 (84.1%) | 5 (62.5%) |
| 5 Years | 0 (0.0%) | 0 (0.0%) |
| 6 to 11 Years | 40 (90.9%) | 16 (100.0%) |
| 12 to 14 Years | 12 (100.0%) | 7 (100.0%) |
| 15 Years | 0 (0.0%) | 11 (100.0%) |
| 16 and 17 Years | 0 (0.0%) | 0 (0.0%) |
| 18 to 24 Years | 50 (96.2%) | 1 (25.0%) |
| 25 to 34 Years | 11 (100.0%) | 37 (94.9%) |
| 35 to 44 Years | 18 (100.0%) | 10 (100.0%) |
| 45 to 54 Years | 6 (100.0%) | 14 (100.0%) |
| 55 to 64 Years | 16 (94.1%) | 17 (85.0%) |
| 65 to 74 Years | 11 (100.0%) | 14 (100.0%) |
| 75 Years and over | 18 (100.0%) | 11 (100.0%) |
| Total | 240 (93.0%) | 143 (92.9%) |
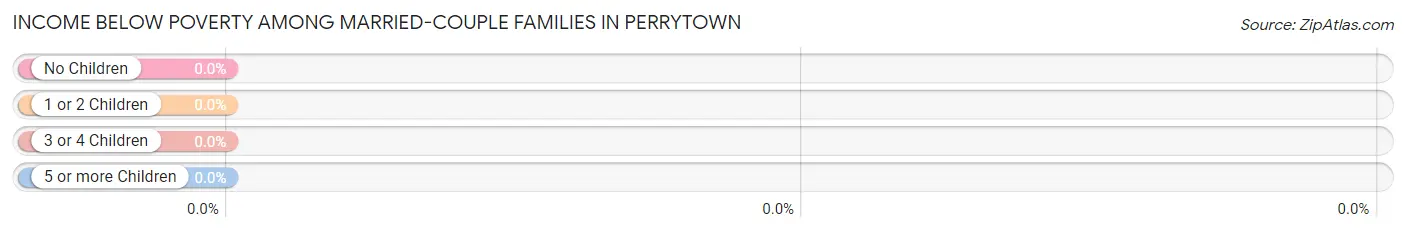
Income Below Poverty Among Married-Couple Families in Perrytown
| Children | Above Poverty | Below Poverty |
| No Children | 28 (100.0%) | 0 (0.0%) |
| 1 or 2 Children | 19 (100.0%) | 0 (0.0%) |
| 3 or 4 Children | 15 (100.0%) | 0 (0.0%) |
| 5 or more Children | 3 (100.0%) | 0 (0.0%) |
| Total | 65 (100.0%) | 0 (0.0%) |
Income Below Poverty Among Single-Parent Households in Perrytown
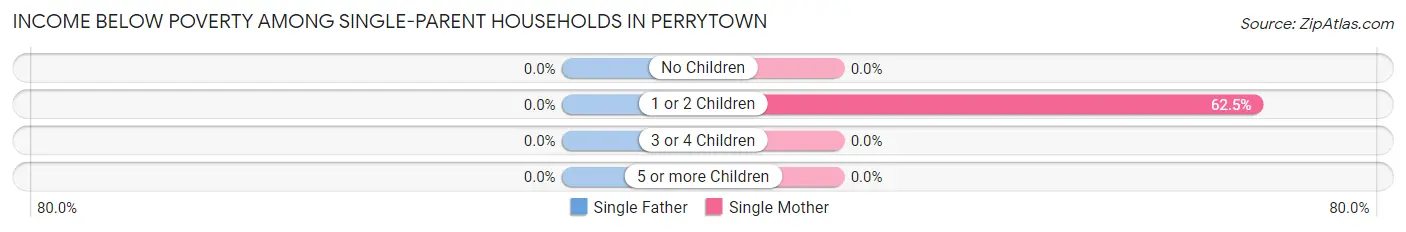
| Children | Single Father | Single Mother |
| No Children | 0 (0.0%) | 0 (0.0%) |
| 1 or 2 Children | 0 (0.0%) | 5 (62.5%) |
| 3 or 4 Children | 0 (0.0%) | 0 (0.0%) |
| 5 or more Children | 0 (0.0%) | 0 (0.0%) |
| Total | 0 (0.0%) | 5 (50.0%) |
Income Below Poverty Among Married-Couple vs Single-Parent Households in Perrytown
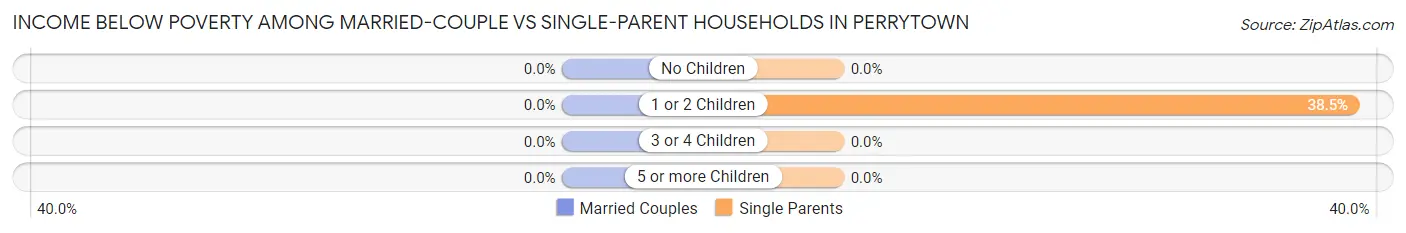
| Children | Married-Couple Families | Single-Parent Households |
| No Children | 0 (0.0%) | 0 (0.0%) |
| 1 or 2 Children | 0 (0.0%) | 5 (38.5%) |
| 3 or 4 Children | 0 (0.0%) | 0 (0.0%) |
| 5 or more Children | 0 (0.0%) | 0 (0.0%) |
| Total | 0 (0.0%) | 5 (31.2%) |
Race in Perrytown
The most populous races in Perrytown are White / Caucasian (265 | 63.9%), Black / African American (79 | 19.0%), and Hispanic or Latino (35 | 8.4%).
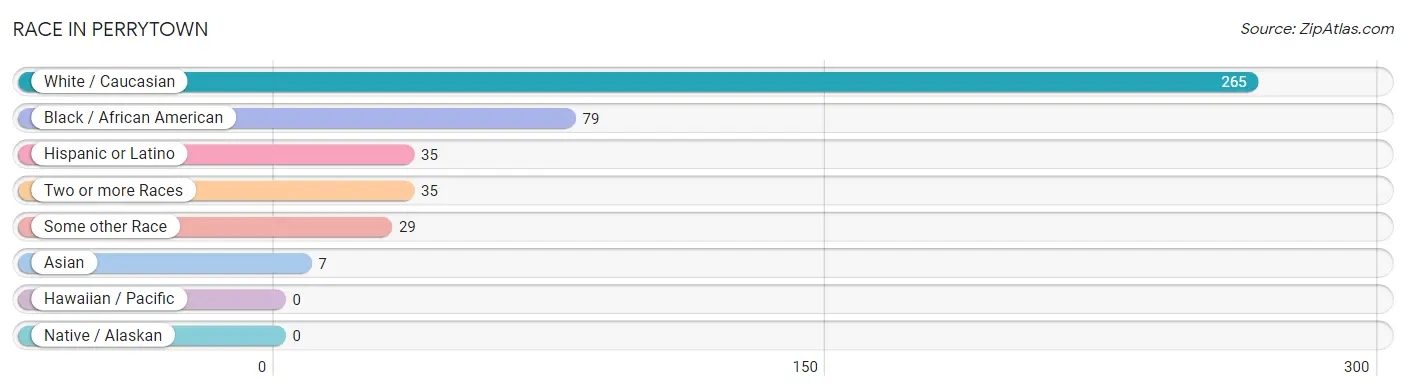
| Race | # Population | % Population |
| Asian | 7 | 1.7% |
| Black / African American | 79 | 19.0% |
| Hawaiian / Pacific | 0 | 0.0% |
| Hispanic or Latino | 35 | 8.4% |
| Native / Alaskan | 0 | 0.0% |
| White / Caucasian | 265 | 63.9% |
| Two or more Races | 35 | 8.4% |
| Some other Race | 29 | 7.0% |
| Total | 415 | 100.0% |
Ancestry in Perrytown
The most populous ancestries reported in Perrytown are English (63 | 15.2%), Irish (49 | 11.8%), Mexican (35 | 8.4%), German (29 | 7.0%), and American (25 | 6.0%), together accounting for 48.4% of all Perrytown residents.
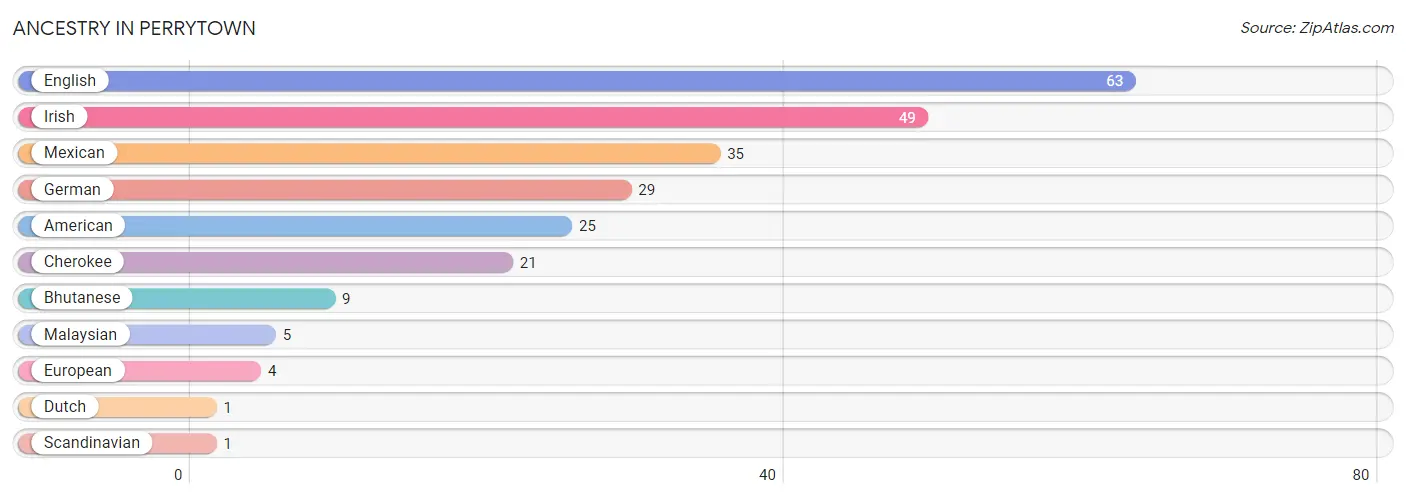
| Ancestry | # Population | % Population |
| American | 25 | 6.0% |
| Bhutanese | 9 | 2.2% |
| Cherokee | 21 | 5.1% |
| Dutch | 1 | 0.2% |
| English | 63 | 15.2% |
| European | 4 | 1.0% |
| German | 29 | 7.0% |
| Irish | 49 | 11.8% |
| Malaysian | 5 | 1.2% |
| Mexican | 35 | 8.4% |
| Scandinavian | 1 | 0.2% | View All 11 Rows |
Immigrants in Perrytown
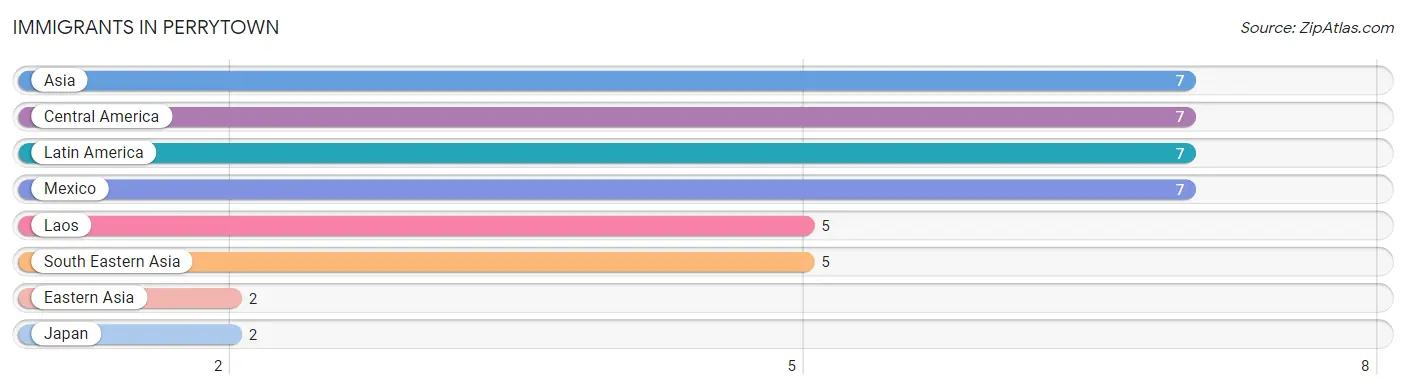
The most numerous immigrant groups reported in Perrytown came from Asia (7 | 1.7%), Central America (7 | 1.7%), Latin America (7 | 1.7%), Mexico (7 | 1.7%), and Laos (5 | 1.2%), together accounting for 8.0% of all Perrytown residents.
| Immigration Origin | # Population | % Population |
| Asia | 7 | 1.7% |
| Central America | 7 | 1.7% |
| Eastern Asia | 2 | 0.5% |
| Japan | 2 | 0.5% |
| Laos | 5 | 1.2% |
| Latin America | 7 | 1.7% |
| Mexico | 7 | 1.7% |
| South Eastern Asia | 5 | 1.2% | View All 8 Rows |
Sex and Age in Perrytown
Sex and Age in Perrytown
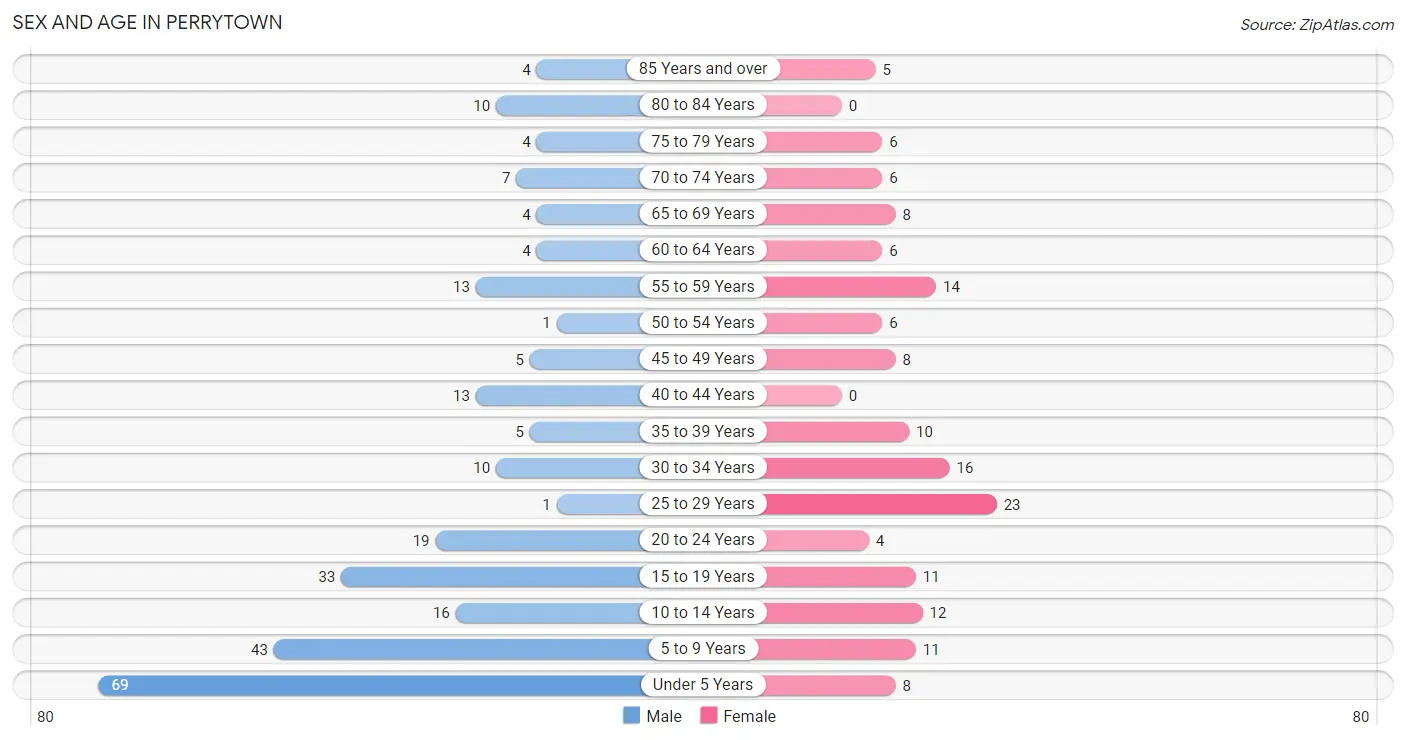
The most populous age groups in Perrytown are Under 5 Years (69 | 26.4%) for men and 25 to 29 Years (23 | 14.9%) for women.
| Age Bracket | Male | Female |
| Under 5 Years | 69 (26.4%) | 8 (5.2%) |
| 5 to 9 Years | 43 (16.5%) | 11 (7.1%) |
| 10 to 14 Years | 16 (6.1%) | 12 (7.8%) |
| 15 to 19 Years | 33 (12.6%) | 11 (7.1%) |
| 20 to 24 Years | 19 (7.3%) | 4 (2.6%) |
| 25 to 29 Years | 1 (0.4%) | 23 (14.9%) |
| 30 to 34 Years | 10 (3.8%) | 16 (10.4%) |
| 35 to 39 Years | 5 (1.9%) | 10 (6.5%) |
| 40 to 44 Years | 13 (5.0%) | 0 (0.0%) |
| 45 to 49 Years | 5 (1.9%) | 8 (5.2%) |
| 50 to 54 Years | 1 (0.4%) | 6 (3.9%) |
| 55 to 59 Years | 13 (5.0%) | 14 (9.1%) |
| 60 to 64 Years | 4 (1.5%) | 6 (3.9%) |
| 65 to 69 Years | 4 (1.5%) | 8 (5.2%) |
| 70 to 74 Years | 7 (2.7%) | 6 (3.9%) |
| 75 to 79 Years | 4 (1.5%) | 6 (3.9%) |
| 80 to 84 Years | 10 (3.8%) | 0 (0.0%) |
| 85 Years and over | 4 (1.5%) | 5 (3.3%) |
| Total | 261 (100.0%) | 154 (100.0%) |
Families and Households in Perrytown
Median Family Size in Perrytown
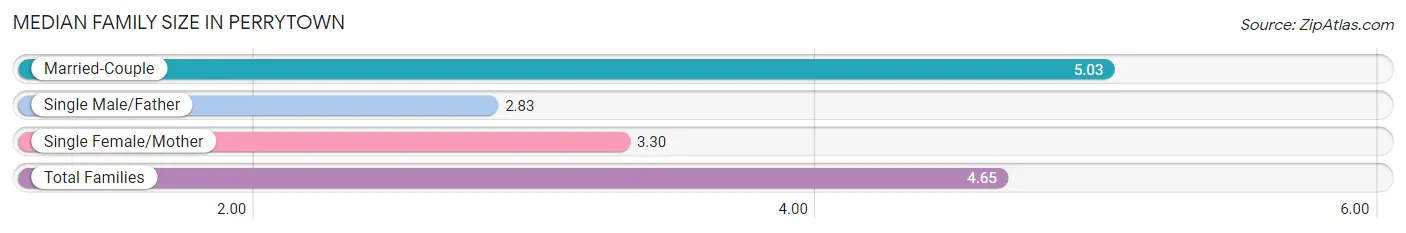
The median family size in Perrytown is 4.65 persons per family, with married-couple families (65 | 80.2%) accounting for the largest median family size of 5.03 persons per family. On the other hand, single male/father families (6 | 7.4%) represent the smallest median family size with 2.83 persons per family.
| Family Type | # Families | Family Size |
| Married-Couple | 65 (80.2%) | 5.03 |
| Single Male/Father | 6 (7.4%) | 2.83 |
| Single Female/Mother | 10 (12.3%) | 3.30 |
| Total Families | 81 (100.0%) | 4.65 |
Median Household Size in Perrytown
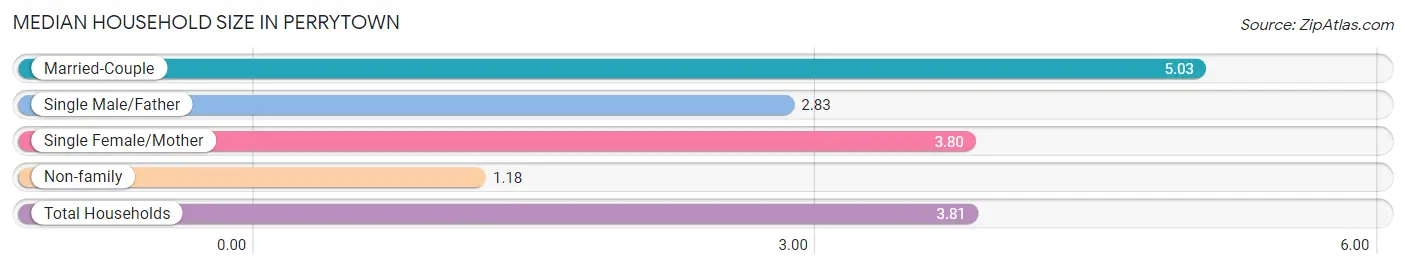
The median household size in Perrytown is 3.81 persons per household, with married-couple households (65 | 59.6%) accounting for the largest median household size of 5.03 persons per household. non-family households (28 | 25.7%) represent the smallest median household size with 1.18 persons per household.
| Household Type | # Households | Household Size |
| Married-Couple | 65 (59.6%) | 5.03 |
| Single Male/Father | 6 (5.5%) | 2.83 |
| Single Female/Mother | 10 (9.2%) | 3.80 |
| Non-family | 28 (25.7%) | 1.18 |
| Total Households | 109 (100.0%) | 3.81 |
Household Size by Marriage Status in Perrytown
Out of a total of 109 households in Perrytown, 81 (74.3%) are family households, while 28 (25.7%) are nonfamily households. The most numerous type of family households are 2-person households, comprising 39, and the most common type of nonfamily households are 1-person households, comprising 26.
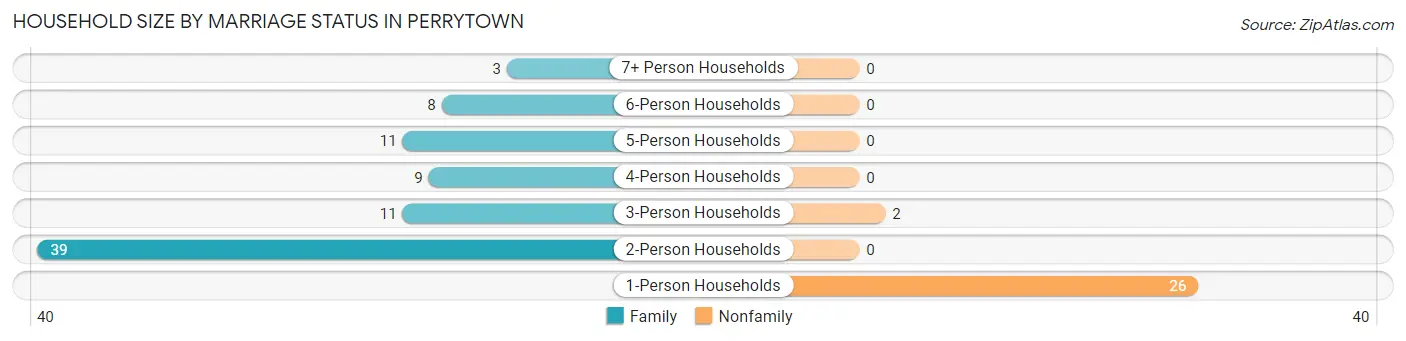
| Household Size | Family Households | Nonfamily Households |
| 1-Person Households | - | 26 (23.8%) |
| 2-Person Households | 39 (35.8%) | 0 (0.0%) |
| 3-Person Households | 11 (10.1%) | 2 (1.8%) |
| 4-Person Households | 9 (8.3%) | 0 (0.0%) |
| 5-Person Households | 11 (10.1%) | 0 (0.0%) |
| 6-Person Households | 8 (7.3%) | 0 (0.0%) |
| 7+ Person Households | 3 (2.8%) | 0 (0.0%) |
| Total | 81 (74.3%) | 28 (25.7%) |
Female Fertility in Perrytown
Fertility by Age in Perrytown
Average fertility rate in Perrytown is 14.0 births per 1,000 women. Women in the age bracket of 20 to 34 years have the highest fertility rate with 23.0 births per 1,000 women. Women in the age bracket of 20 to 34 years acount for 100.0% of all women with births.
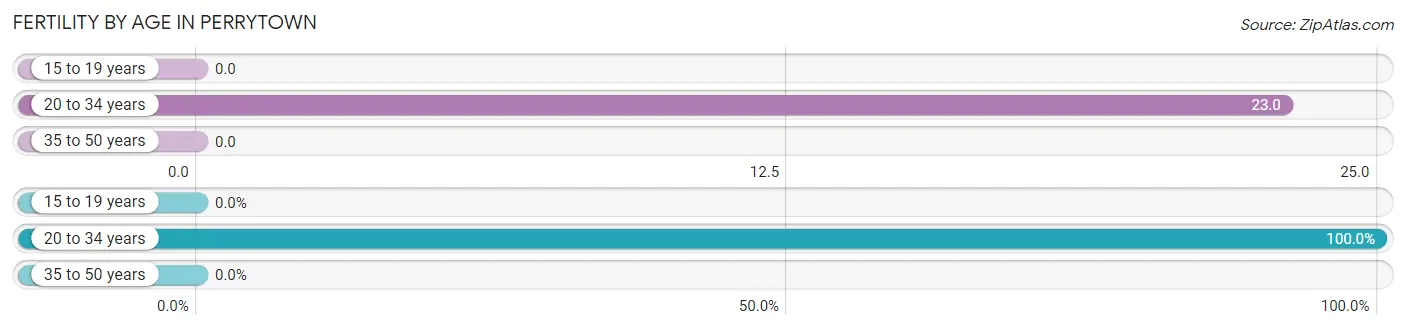
| Age Bracket | Women with Births | Births / 1,000 Women |
| 15 to 19 years | 0 (0.0%) | 0.0 |
| 20 to 34 years | 1 (100.0%) | 23.0 |
| 35 to 50 years | 0 (0.0%) | 0.0 |
| Total | 1 (100.0%) | 14.0 |
Fertility by Age by Marriage Status in Perrytown
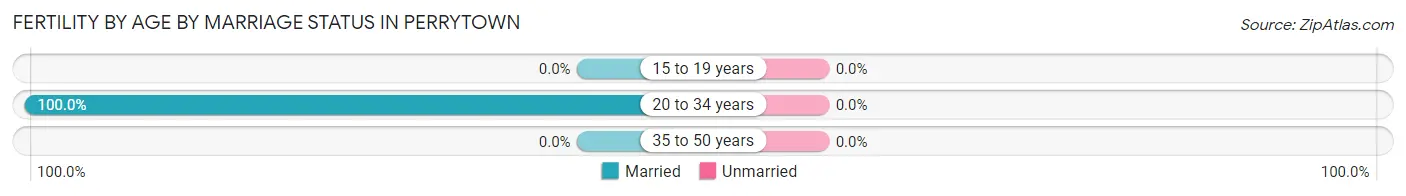
| Age Bracket | Married | Unmarried |
| 15 to 19 years | 0 (0.0%) | 0 (0.0%) |
| 20 to 34 years | 1 (100.0%) | 0 (0.0%) |
| 35 to 50 years | 0 (0.0%) | 0 (0.0%) |
| Total | 1 (100.0%) | 0 (0.0%) |
Fertility by Education in Perrytown
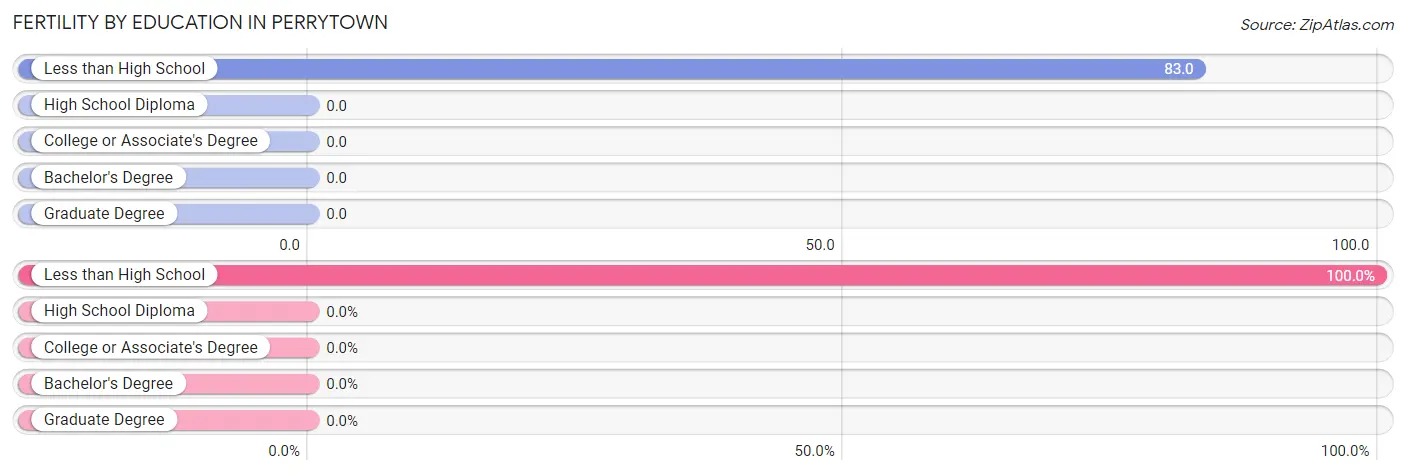
| Educational Attainment | Women with Births | Births / 1,000 Women |
| Less than High School | 1 (100.0%) | 83.0 |
| High School Diploma | 0 (0.0%) | 0.0 |
| College or Associate's Degree | 0 (0.0%) | 0.0 |
| Bachelor's Degree | 0 (0.0%) | 0.0 |
| Graduate Degree | 0 (0.0%) | 0.0 |
| Total | 1 (100.0%) | 14.0 |
Fertility by Education by Marriage Status in Perrytown
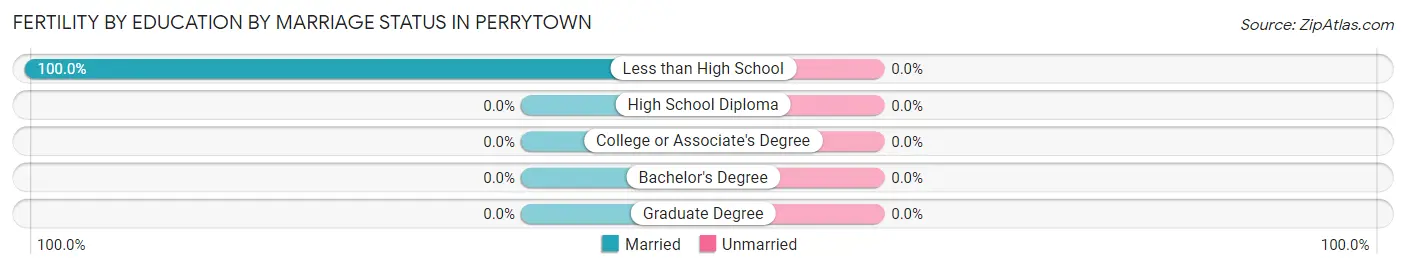
| Educational Attainment | Married | Unmarried |
| Less than High School | 1 (100.0%) | 0 (0.0%) |
| High School Diploma | 0 (0.0%) | 0 (0.0%) |
| College or Associate's Degree | 0 (0.0%) | 0 (0.0%) |
| Bachelor's Degree | 0 (0.0%) | 0 (0.0%) |
| Graduate Degree | 0 (0.0%) | 0 (0.0%) |
| Total | 1 (100.0%) | 0 (0.0%) |
Employment Characteristics in Perrytown
Employment by Class of Employer in Perrytown
Among the 181 employed individuals in Perrytown, private company employees (126 | 69.6%), local government employees (21 | 11.6%), and not-for-profit organizations (14 | 7.7%) make up the most common classes of employment.
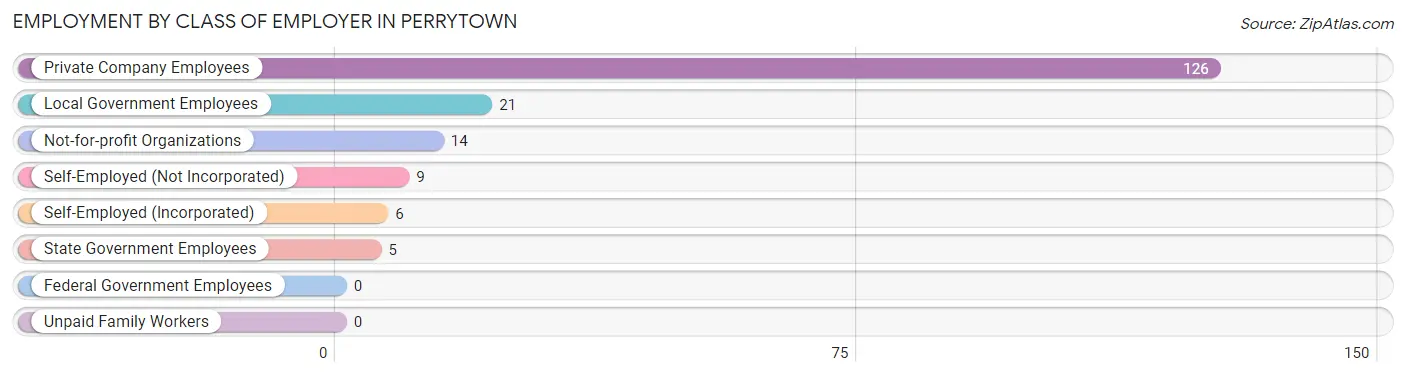
| Employer Class | # Employees | % Employees |
| Private Company Employees | 126 | 69.6% |
| Self-Employed (Incorporated) | 6 | 3.3% |
| Self-Employed (Not Incorporated) | 9 | 5.0% |
| Not-for-profit Organizations | 14 | 7.7% |
| Local Government Employees | 21 | 11.6% |
| State Government Employees | 5 | 2.8% |
| Federal Government Employees | 0 | 0.0% |
| Unpaid Family Workers | 0 | 0.0% |
| Total | 181 | 100.0% |
Employment Status by Age in Perrytown
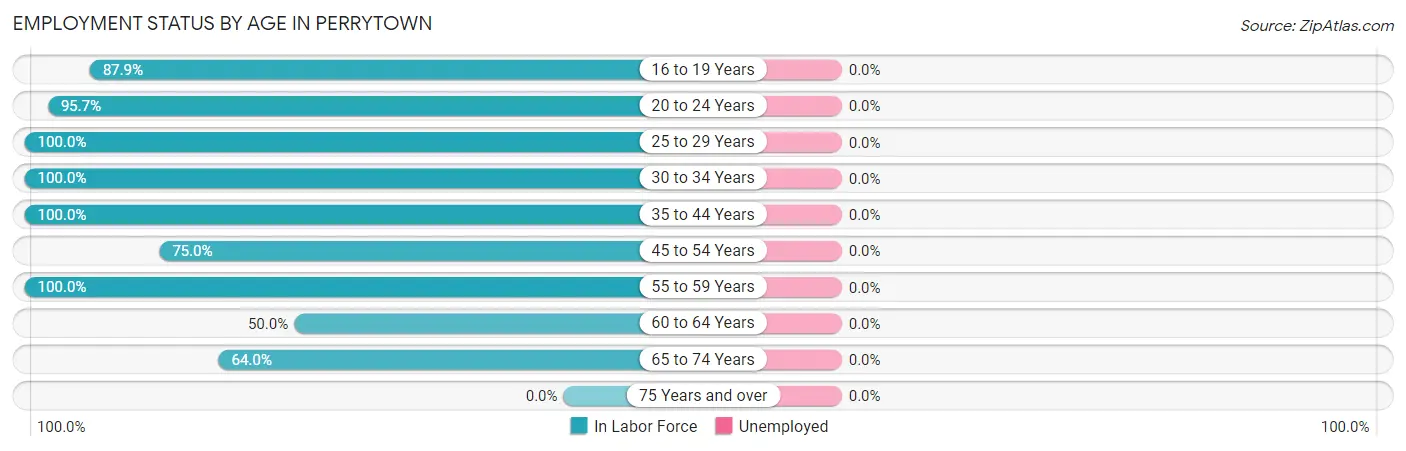
| Age Bracket | In Labor Force | Unemployed |
| 16 to 19 Years | 29 (87.9%) | 0 (0.0%) |
| 20 to 24 Years | 22 (95.7%) | 0 (0.0%) |
| 25 to 29 Years | 24 (100.0%) | 0 (0.0%) |
| 30 to 34 Years | 26 (100.0%) | 0 (0.0%) |
| 35 to 44 Years | 28 (100.0%) | 0 (0.0%) |
| 45 to 54 Years | 15 (75.0%) | 0 (0.0%) |
| 55 to 59 Years | 27 (100.0%) | 0 (0.0%) |
| 60 to 64 Years | 5 (50.0%) | 0 (0.0%) |
| 65 to 74 Years | 16 (64.0%) | 0 (0.0%) |
| 75 Years and over | 0 (0.0%) | 0 (0.0%) |
| Total | 192 (78.4%) | 0 (0.0%) |
Employment Status by Educational Attainment in Perrytown
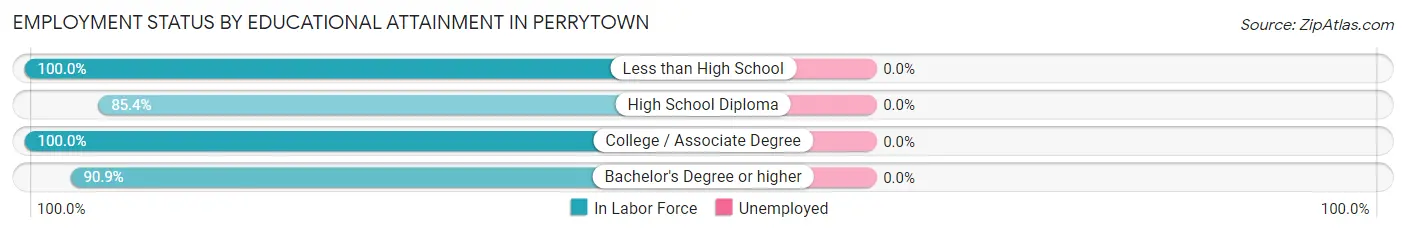
| Educational Attainment | In Labor Force | Unemployed |
| Less than High School | 5 (100.0%) | 0 (0.0%) |
| High School Diploma | 41 (85.4%) | 0 (0.0%) |
| College / Associate Degree | 49 (100.0%) | 0 (0.0%) |
| Bachelor's Degree or higher | 30 (90.9%) | 0 (0.0%) |
| Total | 125 (92.6%) | 0 (0.0%) |
Employment Occupations by Sex in Perrytown
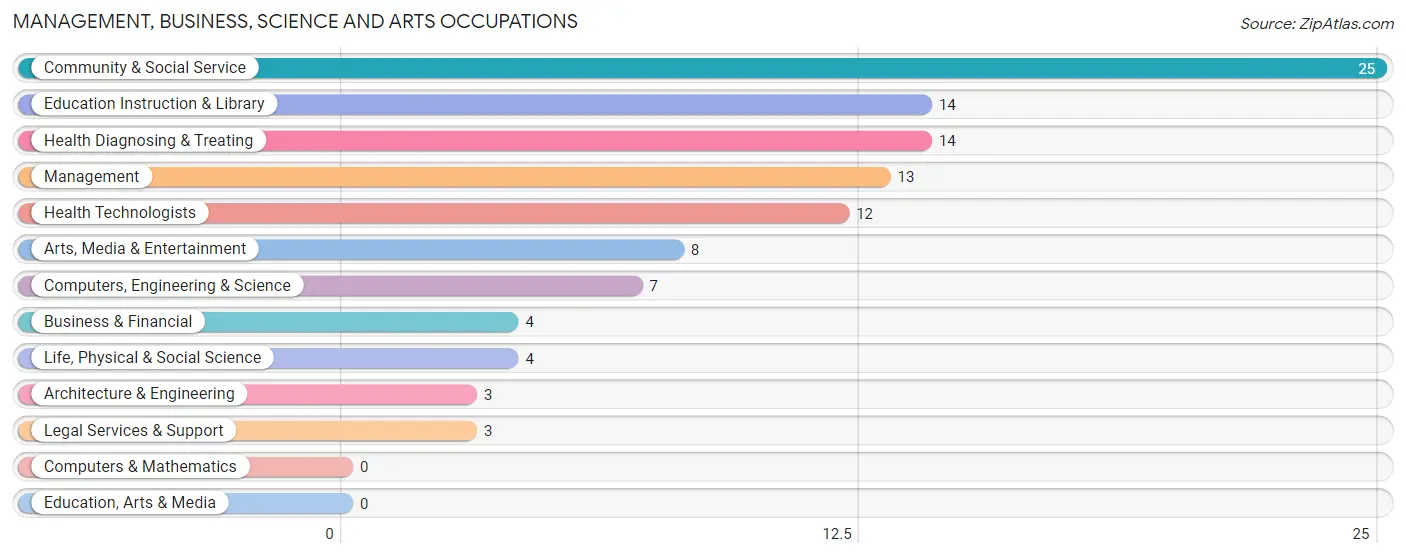
Management, Business, Science and Arts Occupations
The most common Management, Business, Science and Arts occupations in Perrytown are Community & Social Service (25 | 13.0%), Education Instruction & Library (14 | 7.3%), Health Diagnosing & Treating (14 | 7.3%), Management (13 | 6.8%), and Health Technologists (12 | 6.2%).
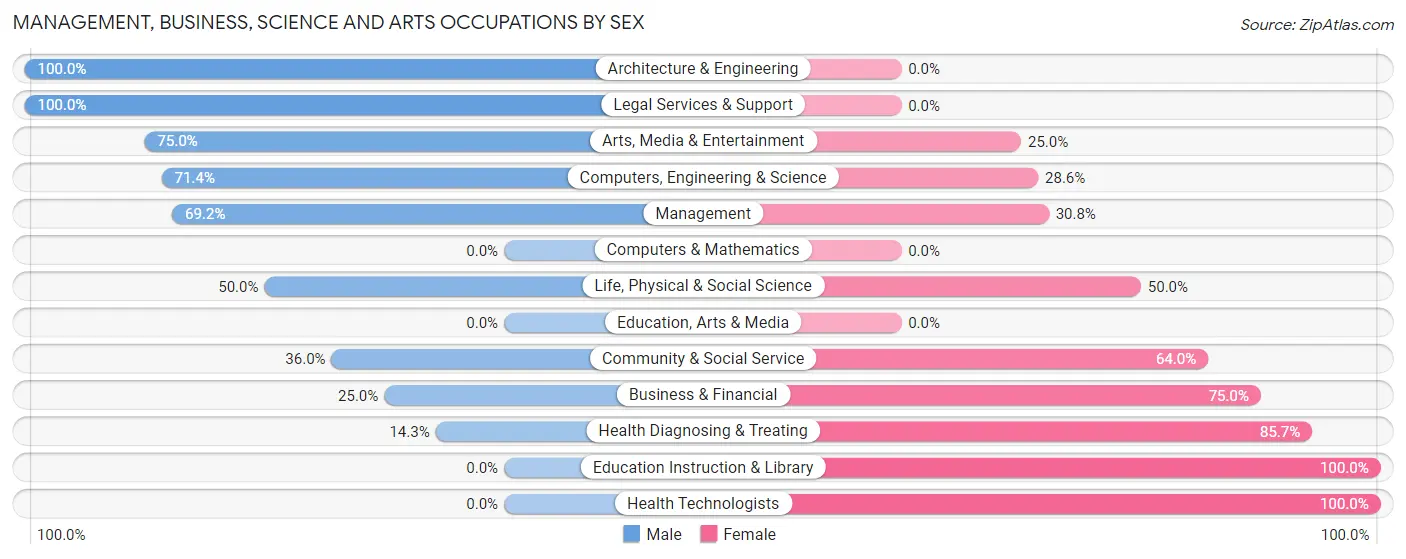
Management, Business, Science and Arts Occupations by Sex
Within the Management, Business, Science and Arts occupations in Perrytown, the most male-oriented occupations are Architecture & Engineering (100.0%), Legal Services & Support (100.0%), and Arts, Media & Entertainment (75.0%), while the most female-oriented occupations are Education Instruction & Library (100.0%), Health Technologists (100.0%), and Health Diagnosing & Treating (85.7%).
| Occupation | Male | Female |
| Management | 9 (69.2%) | 4 (30.8%) |
| Business & Financial | 1 (25.0%) | 3 (75.0%) |
| Computers, Engineering & Science | 5 (71.4%) | 2 (28.6%) |
| Computers & Mathematics | 0 (0.0%) | 0 (0.0%) |
| Architecture & Engineering | 3 (100.0%) | 0 (0.0%) |
| Life, Physical & Social Science | 2 (50.0%) | 2 (50.0%) |
| Community & Social Service | 9 (36.0%) | 16 (64.0%) |
| Education, Arts & Media | 0 (0.0%) | 0 (0.0%) |
| Legal Services & Support | 3 (100.0%) | 0 (0.0%) |
| Education Instruction & Library | 0 (0.0%) | 14 (100.0%) |
| Arts, Media & Entertainment | 6 (75.0%) | 2 (25.0%) |
| Health Diagnosing & Treating | 2 (14.3%) | 12 (85.7%) |
| Health Technologists | 0 (0.0%) | 12 (100.0%) |
| Total (Category) | 26 (41.3%) | 37 (58.7%) |
| Total (Overall) | 109 (56.8%) | 83 (43.2%) |
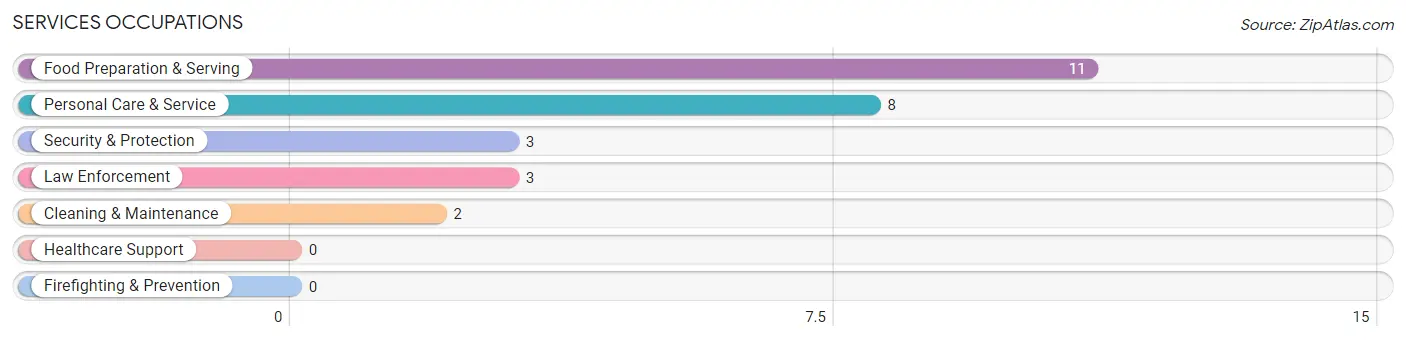
Services Occupations
The most common Services occupations in Perrytown are Food Preparation & Serving (11 | 5.7%), Personal Care & Service (8 | 4.2%), Security & Protection (3 | 1.6%), Law Enforcement (3 | 1.6%), and Cleaning & Maintenance (2 | 1.0%).
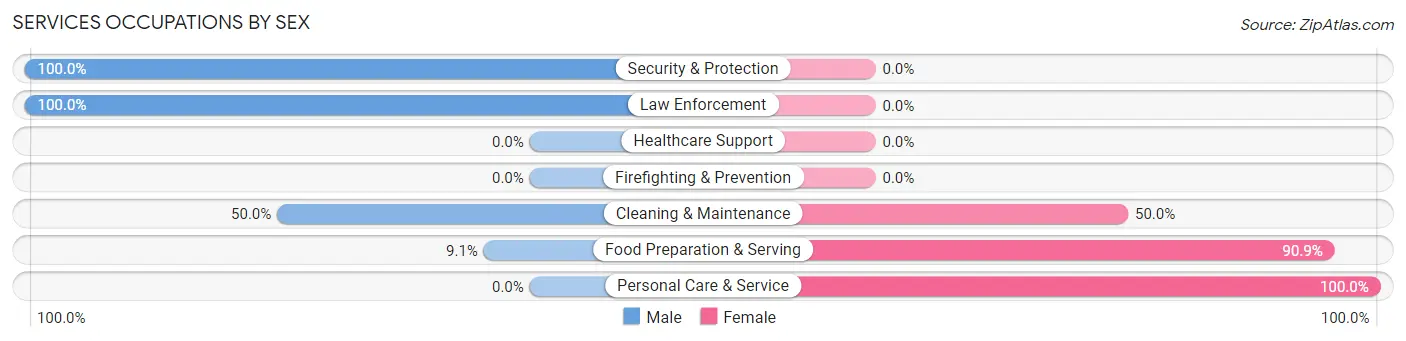
Services Occupations by Sex
Within the Services occupations in Perrytown, the most male-oriented occupations are Security & Protection (100.0%), Law Enforcement (100.0%), and Cleaning & Maintenance (50.0%), while the most female-oriented occupations are Personal Care & Service (100.0%), Food Preparation & Serving (90.9%), and Cleaning & Maintenance (50.0%).
| Occupation | Male | Female |
| Healthcare Support | 0 (0.0%) | 0 (0.0%) |
| Security & Protection | 3 (100.0%) | 0 (0.0%) |
| Firefighting & Prevention | 0 (0.0%) | 0 (0.0%) |
| Law Enforcement | 3 (100.0%) | 0 (0.0%) |
| Food Preparation & Serving | 1 (9.1%) | 10 (90.9%) |
| Cleaning & Maintenance | 1 (50.0%) | 1 (50.0%) |
| Personal Care & Service | 0 (0.0%) | 8 (100.0%) |
| Total (Category) | 5 (20.8%) | 19 (79.2%) |
| Total (Overall) | 109 (56.8%) | 83 (43.2%) |
Sales and Office Occupations
The most common Sales and Office occupations in Perrytown are Office & Administration (27 | 14.1%), and Sales & Related (10 | 5.2%).
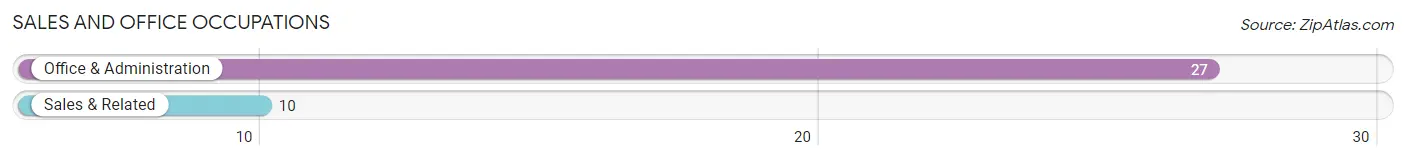
Sales and Office Occupations by Sex
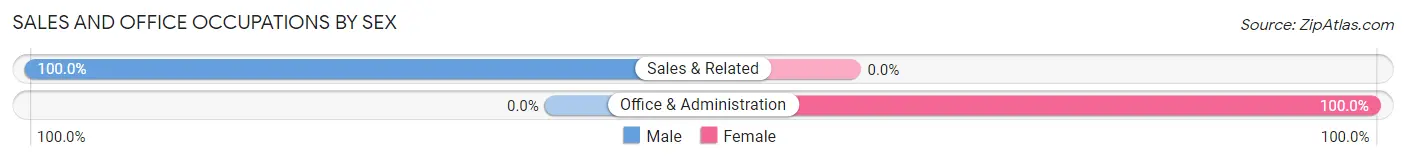
| Occupation | Male | Female |
| Sales & Related | 10 (100.0%) | 0 (0.0%) |
| Office & Administration | 0 (0.0%) | 27 (100.0%) |
| Total (Category) | 10 (27.0%) | 27 (73.0%) |
| Total (Overall) | 109 (56.8%) | 83 (43.2%) |
Natural Resources, Construction and Maintenance Occupations
The most common Natural Resources, Construction and Maintenance occupations in Perrytown are Installation, Maintenance & Repair (15 | 7.8%), and Farming, Fishing & Forestry (1 | 0.5%).
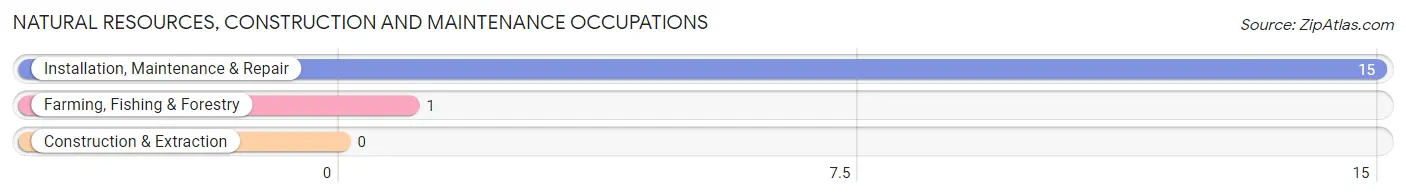
Natural Resources, Construction and Maintenance Occupations by Sex
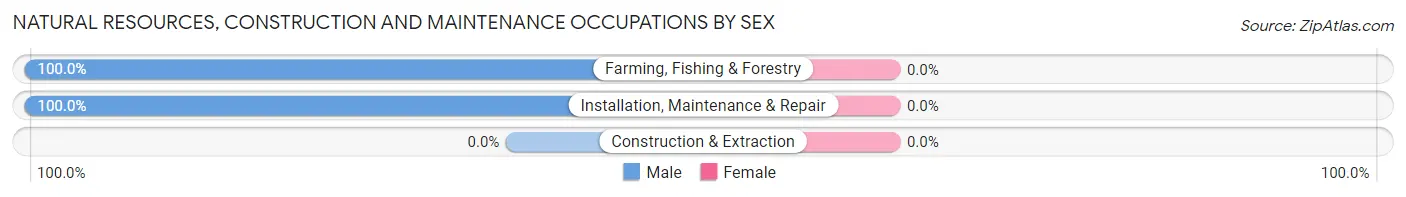
| Occupation | Male | Female |
| Farming, Fishing & Forestry | 1 (100.0%) | 0 (0.0%) |
| Construction & Extraction | 0 (0.0%) | 0 (0.0%) |
| Installation, Maintenance & Repair | 15 (100.0%) | 0 (0.0%) |
| Total (Category) | 16 (100.0%) | 0 (0.0%) |
| Total (Overall) | 109 (56.8%) | 83 (43.2%) |
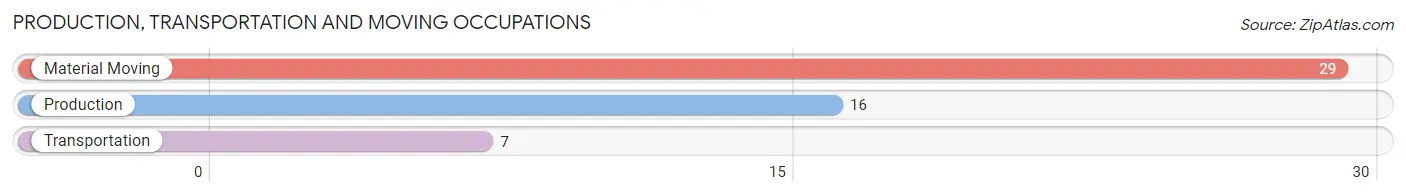
Production, Transportation and Moving Occupations
The most common Production, Transportation and Moving occupations in Perrytown are Material Moving (29 | 15.1%), Production (16 | 8.3%), and Transportation (7 | 3.6%).
Production, Transportation and Moving Occupations by Sex
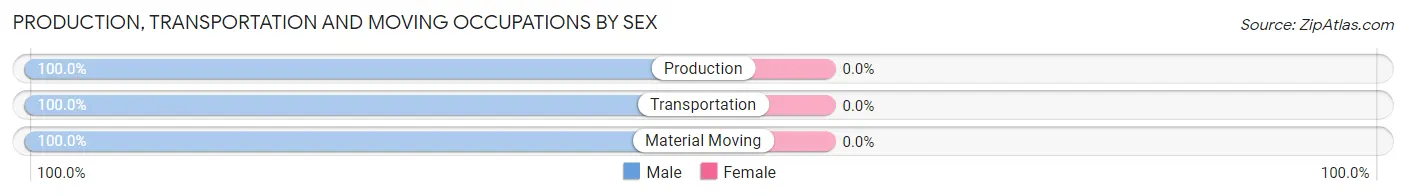
| Occupation | Male | Female |
| Production | 16 (100.0%) | 0 (0.0%) |
| Transportation | 7 (100.0%) | 0 (0.0%) |
| Material Moving | 29 (100.0%) | 0 (0.0%) |
| Total (Category) | 52 (100.0%) | 0 (0.0%) |
| Total (Overall) | 109 (56.8%) | 83 (43.2%) |
Employment Industries by Sex in Perrytown
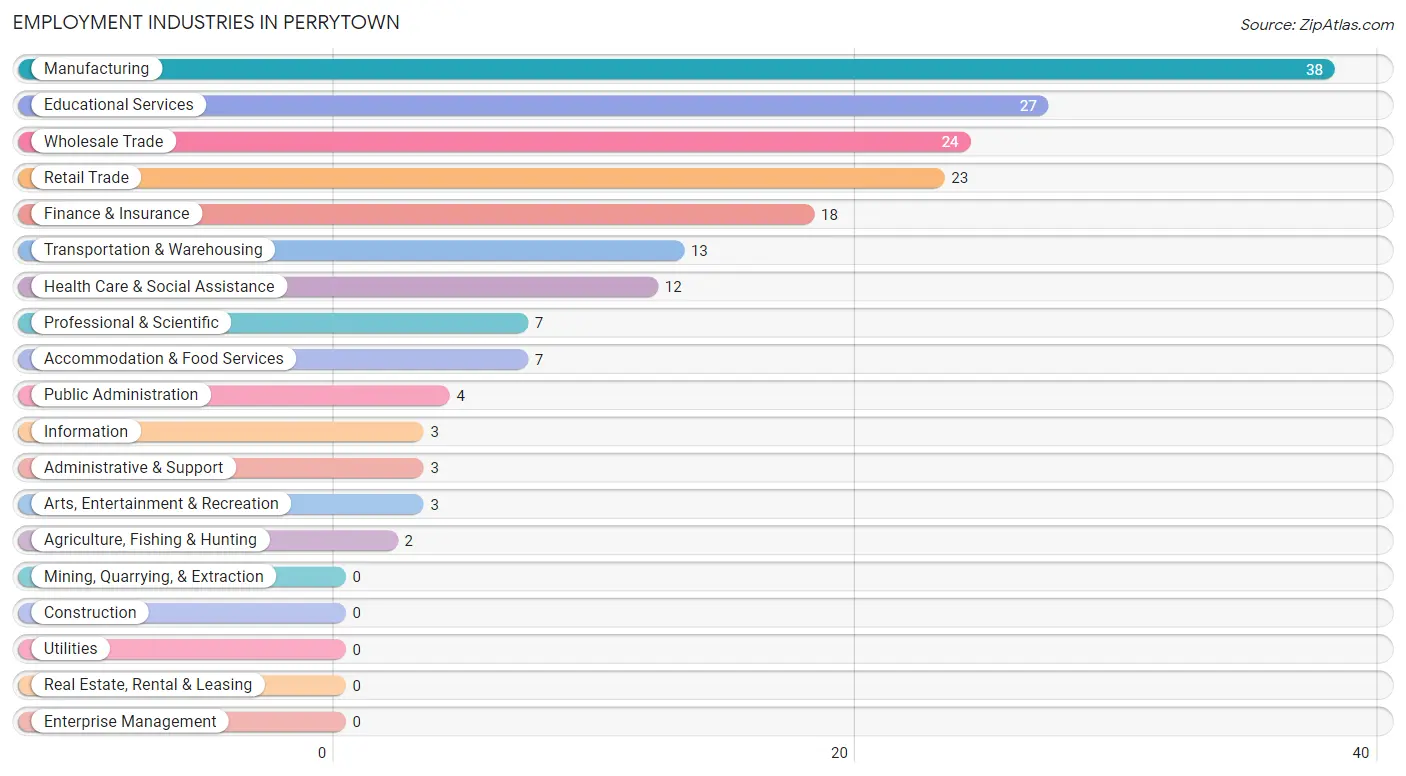
Employment Industries in Perrytown
The major employment industries in Perrytown include Manufacturing (38 | 19.8%), Educational Services (27 | 14.1%), Wholesale Trade (24 | 12.5%), Retail Trade (23 | 12.0%), and Finance & Insurance (18 | 9.4%).
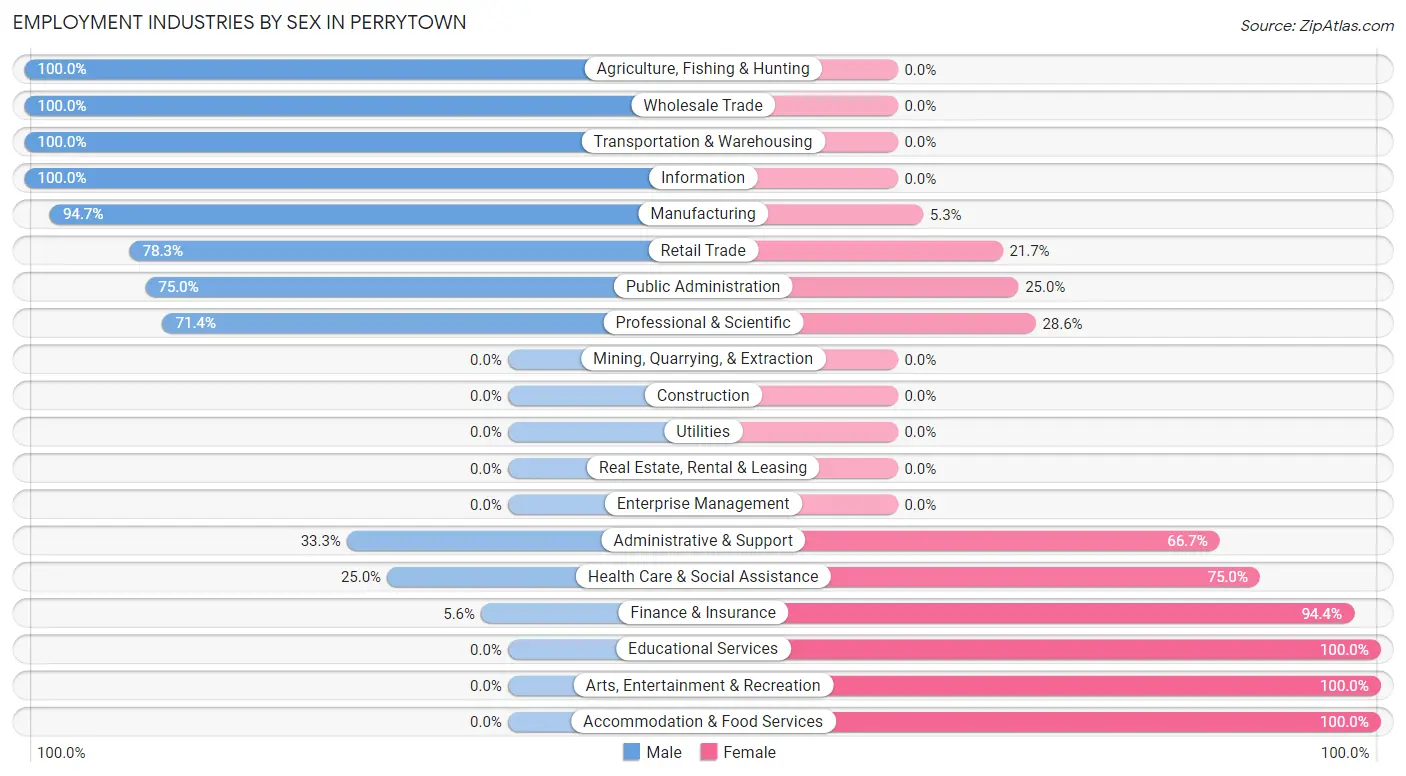
Employment Industries by Sex in Perrytown
The Perrytown industries that see more men than women are Agriculture, Fishing & Hunting (100.0%), Wholesale Trade (100.0%), and Transportation & Warehousing (100.0%), whereas the industries that tend to have a higher number of women are Educational Services (100.0%), Arts, Entertainment & Recreation (100.0%), and Accommodation & Food Services (100.0%).
| Industry | Male | Female |
| Agriculture, Fishing & Hunting | 2 (100.0%) | 0 (0.0%) |
| Mining, Quarrying, & Extraction | 0 (0.0%) | 0 (0.0%) |
| Construction | 0 (0.0%) | 0 (0.0%) |
| Manufacturing | 36 (94.7%) | 2 (5.3%) |
| Wholesale Trade | 24 (100.0%) | 0 (0.0%) |
| Retail Trade | 18 (78.3%) | 5 (21.7%) |
| Transportation & Warehousing | 13 (100.0%) | 0 (0.0%) |
| Utilities | 0 (0.0%) | 0 (0.0%) |
| Information | 3 (100.0%) | 0 (0.0%) |
| Finance & Insurance | 1 (5.6%) | 17 (94.4%) |
| Real Estate, Rental & Leasing | 0 (0.0%) | 0 (0.0%) |
| Professional & Scientific | 5 (71.4%) | 2 (28.6%) |
| Enterprise Management | 0 (0.0%) | 0 (0.0%) |
| Administrative & Support | 1 (33.3%) | 2 (66.7%) |
| Educational Services | 0 (0.0%) | 27 (100.0%) |
| Health Care & Social Assistance | 3 (25.0%) | 9 (75.0%) |
| Arts, Entertainment & Recreation | 0 (0.0%) | 3 (100.0%) |
| Accommodation & Food Services | 0 (0.0%) | 7 (100.0%) |
| Public Administration | 3 (75.0%) | 1 (25.0%) |
| Total | 109 (56.8%) | 83 (43.2%) |
Education in Perrytown
School Enrollment in Perrytown
The most common levels of schooling among the 117 students in Perrytown are elementary school (54 | 46.2%), middle school (28 | 23.9%), and high school (20 | 17.1%).
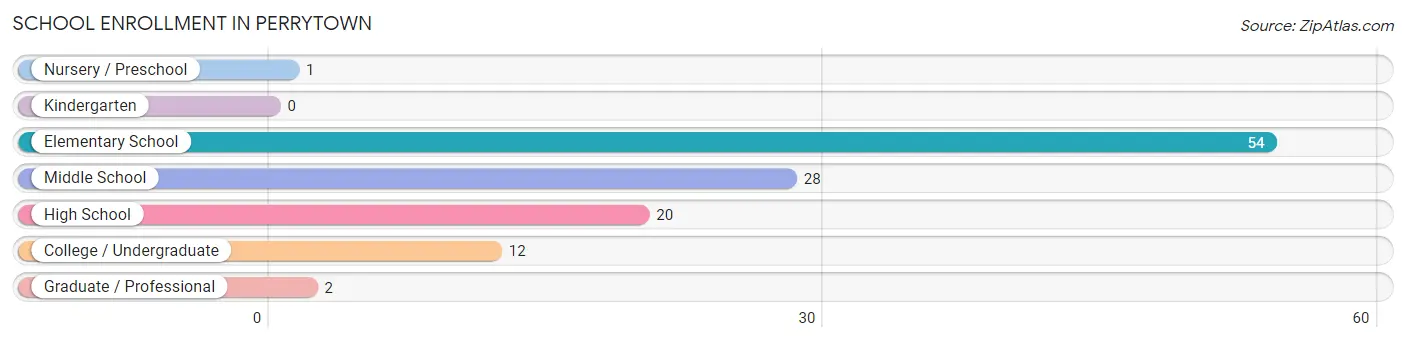
| School Level | # Students | % Students |
| Nursery / Preschool | 1 | 0.9% |
| Kindergarten | 0 | 0.0% |
| Elementary School | 54 | 46.2% |
| Middle School | 28 | 23.9% |
| High School | 20 | 17.1% |
| College / Undergraduate | 12 | 10.3% |
| Graduate / Professional | 2 | 1.7% |
| Total | 117 | 100.0% |
School Enrollment by Age by Funding Source in Perrytown
Out of a total of 117 students who are enrolled in schools in Perrytown, 34 (29.1%) attend a private institution, while the remaining 83 (70.9%) are enrolled in public schools. The age group of 35 years and over has the highest likelihood of being enrolled in private schools, with 3 (100.0% in the age bracket) enrolled. Conversely, the age group of 3 to 4 year olds has the lowest likelihood of being enrolled in a private school, with 1 (100.0% in the age bracket) attending a public institution.
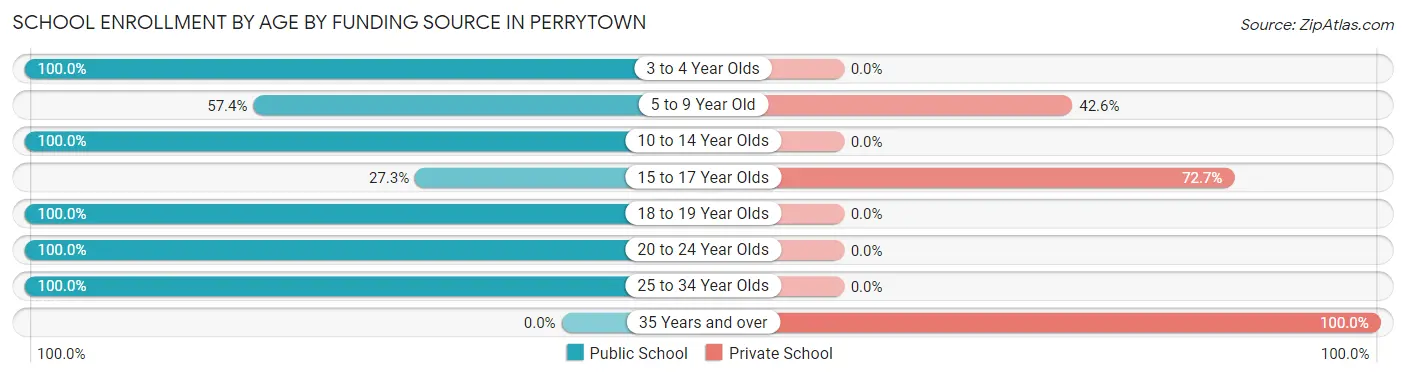
| Age Bracket | Public School | Private School |
| 3 to 4 Year Olds | 1 (100.0%) | 0 (0.0%) |
| 5 to 9 Year Old | 31 (57.4%) | 23 (42.6%) |
| 10 to 14 Year Olds | 28 (100.0%) | 0 (0.0%) |
| 15 to 17 Year Olds | 3 (27.3%) | 8 (72.7%) |
| 18 to 19 Year Olds | 9 (100.0%) | 0 (0.0%) |
| 20 to 24 Year Olds | 2 (100.0%) | 0 (0.0%) |
| 25 to 34 Year Olds | 9 (100.0%) | 0 (0.0%) |
| 35 Years and over | 0 (0.0%) | 3 (100.0%) |
| Total | 83 (70.9%) | 34 (29.1%) |
Educational Attainment by Field of Study in Perrytown
Bio, nature & agricultural (15 | 28.3%), liberal arts & history (14 | 26.4%), arts & humanities (14 | 26.4%), education (4 | 7.5%), and psychology (2 | 3.8%) are the most common fields of study among 53 individuals in Perrytown who have obtained a bachelor's degree or higher.
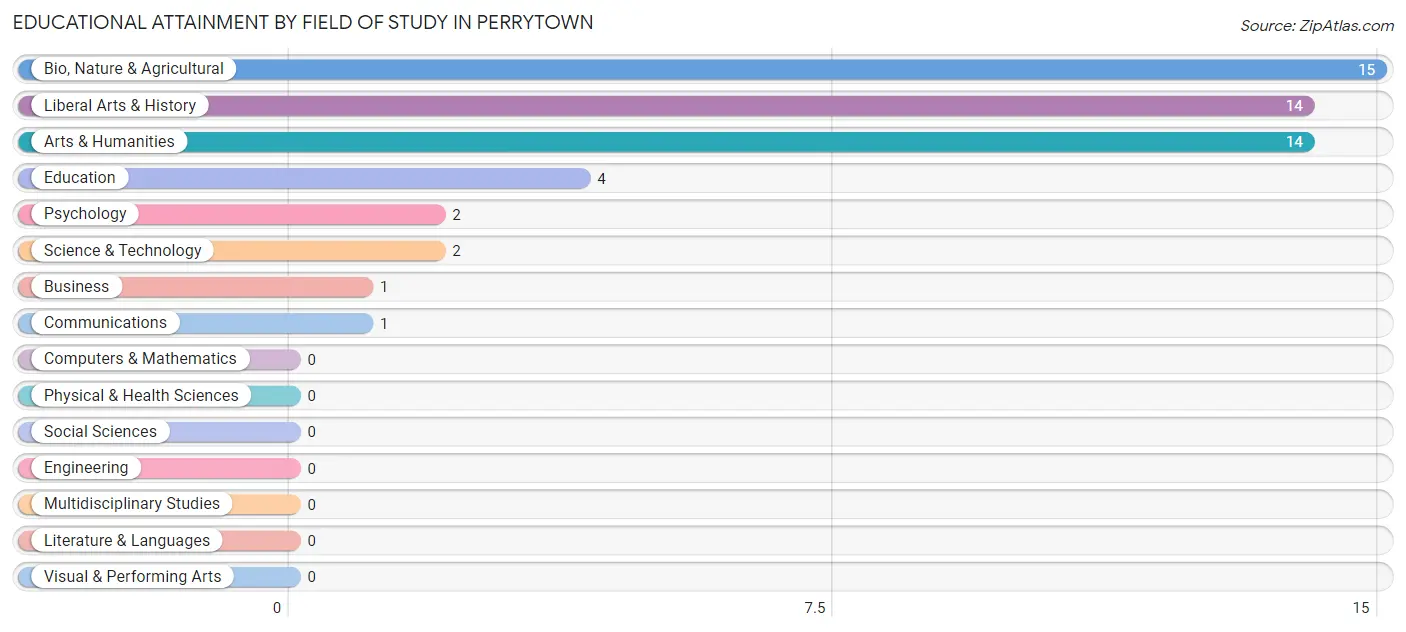
| Field of Study | # Graduates | % Graduates |
| Computers & Mathematics | 0 | 0.0% |
| Bio, Nature & Agricultural | 15 | 28.3% |
| Physical & Health Sciences | 0 | 0.0% |
| Psychology | 2 | 3.8% |
| Social Sciences | 0 | 0.0% |
| Engineering | 0 | 0.0% |
| Multidisciplinary Studies | 0 | 0.0% |
| Science & Technology | 2 | 3.8% |
| Business | 1 | 1.9% |
| Education | 4 | 7.5% |
| Literature & Languages | 0 | 0.0% |
| Liberal Arts & History | 14 | 26.4% |
| Visual & Performing Arts | 0 | 0.0% |
| Communications | 1 | 1.9% |
| Arts & Humanities | 14 | 26.4% |
| Total | 53 | 100.0% |
Transportation & Commute in Perrytown
Vehicle Availability by Sex in Perrytown
The most prevalent vehicle ownership categories in Perrytown are males with 3 vehicles (51, accounting for 46.8%) and females with 3 vehicles (44, making up 70.8%).
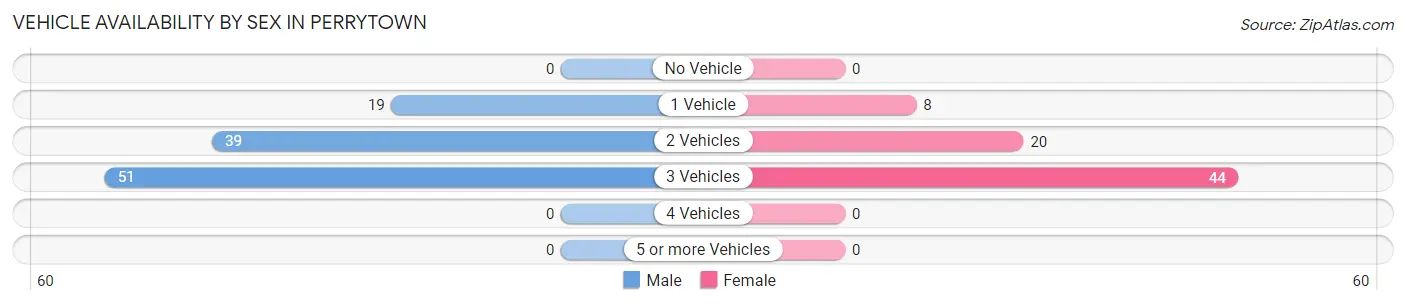
| Vehicles Available | Male | Female |
| No Vehicle | 0 (0.0%) | 0 (0.0%) |
| 1 Vehicle | 19 (17.4%) | 8 (11.1%) |
| 2 Vehicles | 39 (35.8%) | 20 (27.8%) |
| 3 Vehicles | 51 (46.8%) | 44 (61.1%) |
| 4 Vehicles | 0 (0.0%) | 0 (0.0%) |
| 5 or more Vehicles | 0 (0.0%) | 0 (0.0%) |
| Total | 109 (100.0%) | 72 (100.0%) |
Commute Time in Perrytown
The most frequently occuring commute durations in Perrytown are 15 to 19 minutes (67 commuters, 38.1%), 10 to 14 minutes (41 commuters, 23.3%), and 5 to 9 minutes (28 commuters, 15.9%).
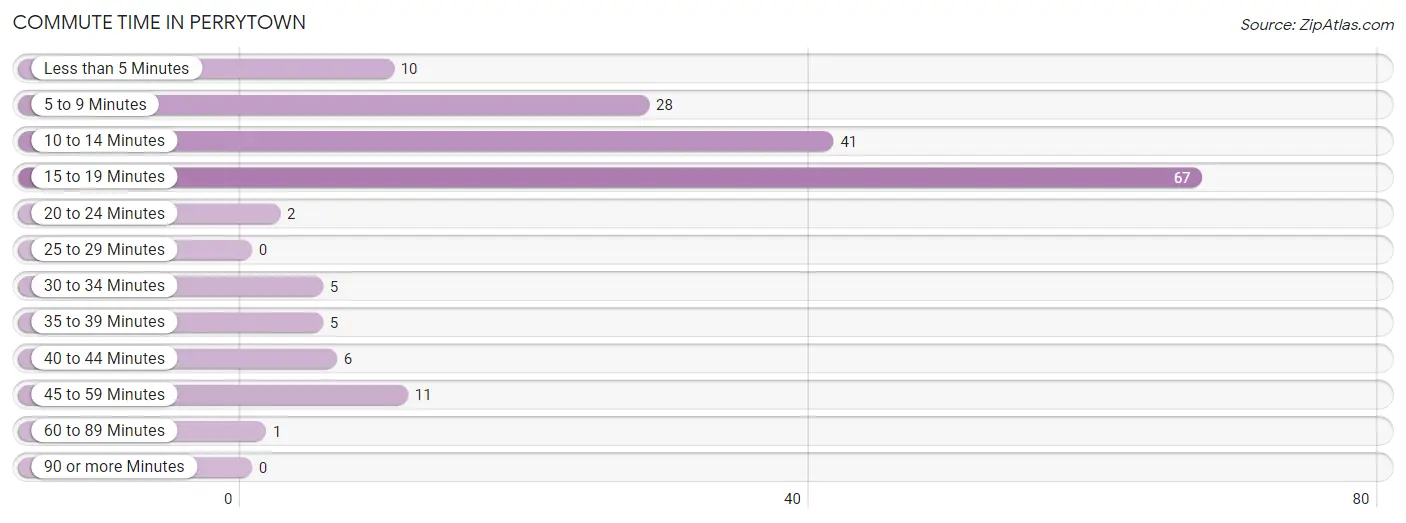
| Commute Time | # Commuters | % Commuters |
| Less than 5 Minutes | 10 | 5.7% |
| 5 to 9 Minutes | 28 | 15.9% |
| 10 to 14 Minutes | 41 | 23.3% |
| 15 to 19 Minutes | 67 | 38.1% |
| 20 to 24 Minutes | 2 | 1.1% |
| 25 to 29 Minutes | 0 | 0.0% |
| 30 to 34 Minutes | 5 | 2.8% |
| 35 to 39 Minutes | 5 | 2.8% |
| 40 to 44 Minutes | 6 | 3.4% |
| 45 to 59 Minutes | 11 | 6.2% |
| 60 to 89 Minutes | 1 | 0.6% |
| 90 or more Minutes | 0 | 0.0% |
Commute Time by Sex in Perrytown
The most common commute times in Perrytown are 5 to 9 minutes (28 commuters, 25.7%) for males and 15 to 19 minutes (47 commuters, 70.2%) for females.
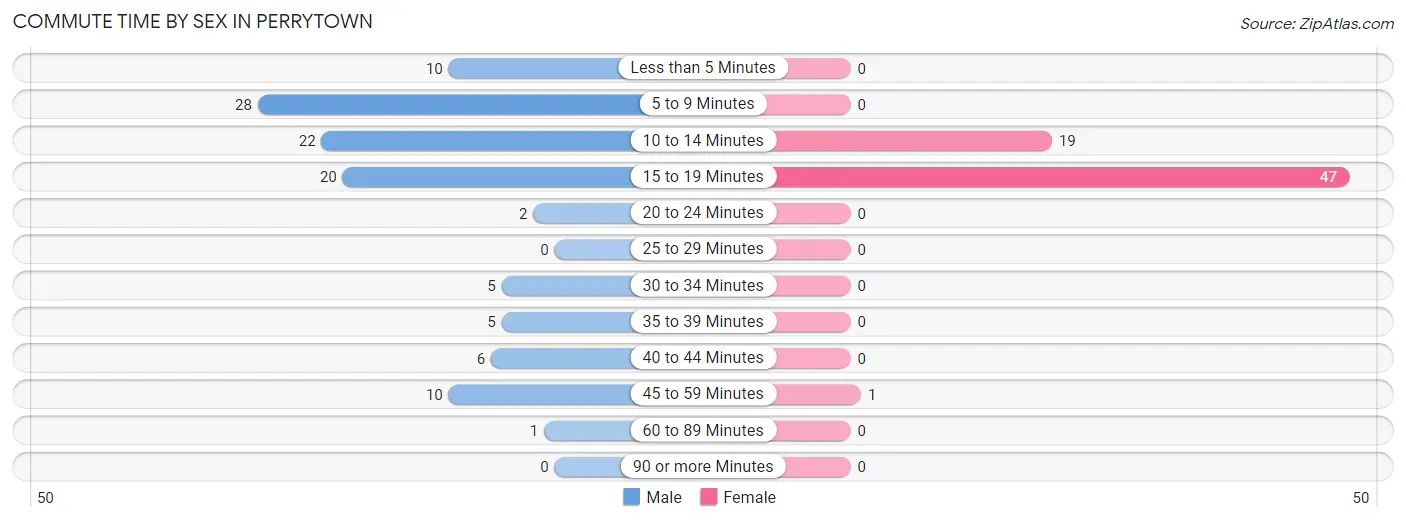
| Commute Time | Male | Female |
| Less than 5 Minutes | 10 (9.2%) | 0 (0.0%) |
| 5 to 9 Minutes | 28 (25.7%) | 0 (0.0%) |
| 10 to 14 Minutes | 22 (20.2%) | 19 (28.4%) |
| 15 to 19 Minutes | 20 (18.3%) | 47 (70.2%) |
| 20 to 24 Minutes | 2 (1.8%) | 0 (0.0%) |
| 25 to 29 Minutes | 0 (0.0%) | 0 (0.0%) |
| 30 to 34 Minutes | 5 (4.6%) | 0 (0.0%) |
| 35 to 39 Minutes | 5 (4.6%) | 0 (0.0%) |
| 40 to 44 Minutes | 6 (5.5%) | 0 (0.0%) |
| 45 to 59 Minutes | 10 (9.2%) | 1 (1.5%) |
| 60 to 89 Minutes | 1 (0.9%) | 0 (0.0%) |
| 90 or more Minutes | 0 (0.0%) | 0 (0.0%) |
Time of Departure to Work by Sex in Perrytown
The most frequent times of departure to work in Perrytown are 7:30 AM to 7:59 AM (30, 27.5%) for males and 7:00 AM to 7:29 AM (21, 31.3%) for females.
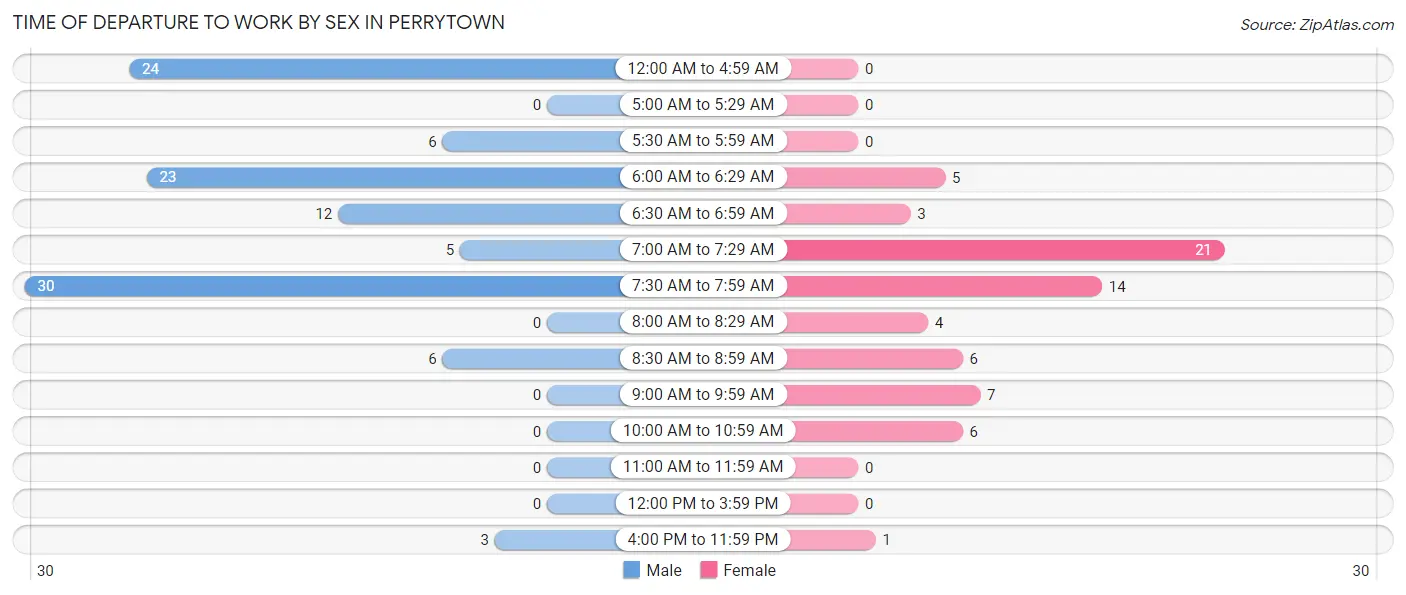
| Time of Departure | Male | Female |
| 12:00 AM to 4:59 AM | 24 (22.0%) | 0 (0.0%) |
| 5:00 AM to 5:29 AM | 0 (0.0%) | 0 (0.0%) |
| 5:30 AM to 5:59 AM | 6 (5.5%) | 0 (0.0%) |
| 6:00 AM to 6:29 AM | 23 (21.1%) | 5 (7.5%) |
| 6:30 AM to 6:59 AM | 12 (11.0%) | 3 (4.5%) |
| 7:00 AM to 7:29 AM | 5 (4.6%) | 21 (31.3%) |
| 7:30 AM to 7:59 AM | 30 (27.5%) | 14 (20.9%) |
| 8:00 AM to 8:29 AM | 0 (0.0%) | 4 (6.0%) |
| 8:30 AM to 8:59 AM | 6 (5.5%) | 6 (9.0%) |
| 9:00 AM to 9:59 AM | 0 (0.0%) | 7 (10.4%) |
| 10:00 AM to 10:59 AM | 0 (0.0%) | 6 (9.0%) |
| 11:00 AM to 11:59 AM | 0 (0.0%) | 0 (0.0%) |
| 12:00 PM to 3:59 PM | 0 (0.0%) | 0 (0.0%) |
| 4:00 PM to 11:59 PM | 3 (2.8%) | 1 (1.5%) |
| Total | 109 (100.0%) | 67 (100.0%) |
Housing Occupancy in Perrytown
Occupancy by Ownership in Perrytown
Of the total 109 dwellings in Perrytown, owner-occupied units account for 77 (70.6%), while renter-occupied units make up 32 (29.4%).
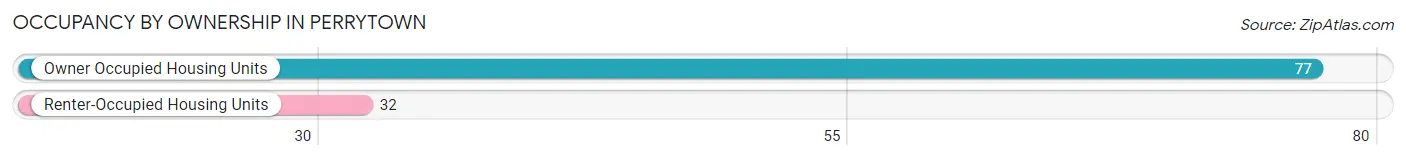
| Occupancy | # Housing Units | % Housing Units |
| Owner Occupied Housing Units | 77 | 70.6% |
| Renter-Occupied Housing Units | 32 | 29.4% |
| Total Occupied Housing Units | 109 | 100.0% |
Occupancy by Household Size in Perrytown
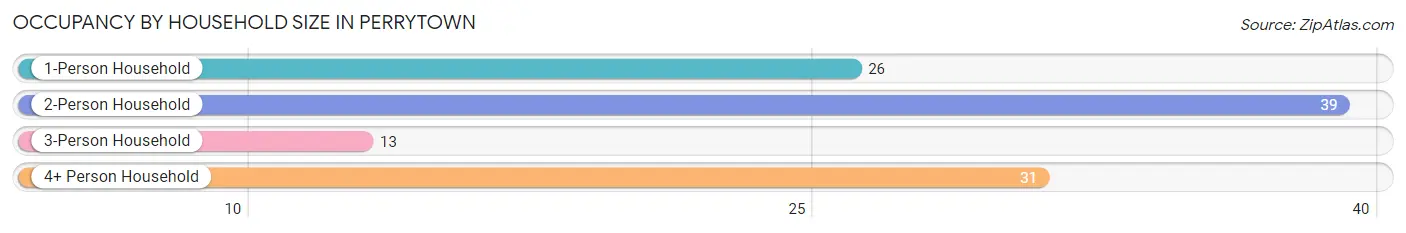
| Household Size | # Housing Units | % Housing Units |
| 1-Person Household | 26 | 23.8% |
| 2-Person Household | 39 | 35.8% |
| 3-Person Household | 13 | 11.9% |
| 4+ Person Household | 31 | 28.4% |
| Total Housing Units | 109 | 100.0% |
Occupancy by Ownership by Household Size in Perrytown
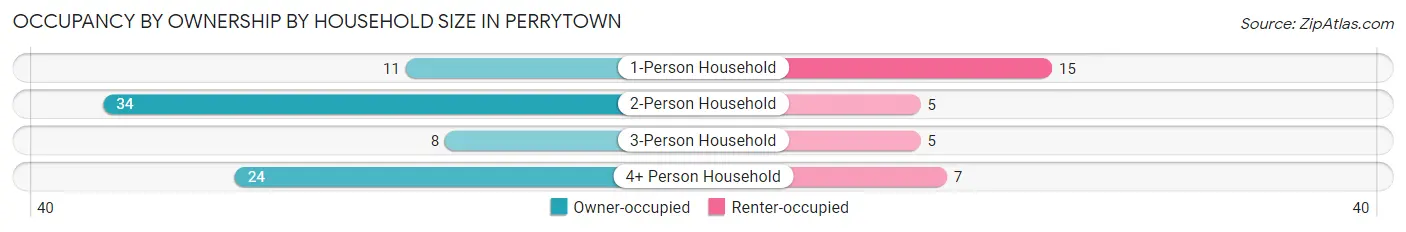
| Household Size | Owner-occupied | Renter-occupied |
| 1-Person Household | 11 (42.3%) | 15 (57.7%) |
| 2-Person Household | 34 (87.2%) | 5 (12.8%) |
| 3-Person Household | 8 (61.5%) | 5 (38.5%) |
| 4+ Person Household | 24 (77.4%) | 7 (22.6%) |
| Total Housing Units | 77 (70.6%) | 32 (29.4%) |
Occupancy by Educational Attainment in Perrytown
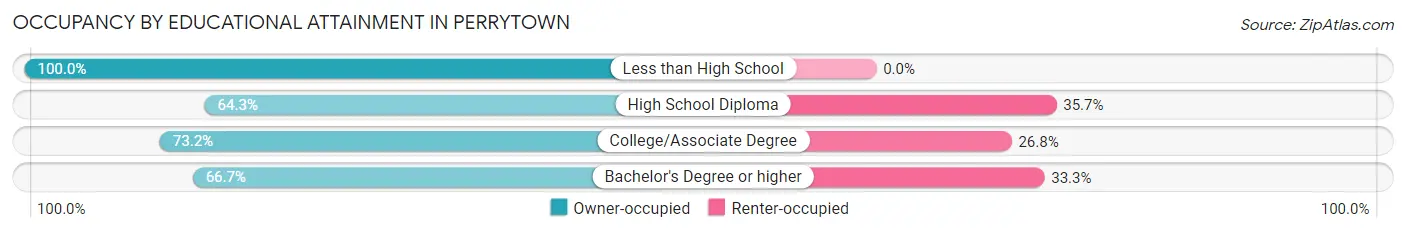
| Household Size | Owner-occupied | Renter-occupied |
| Less than High School | 8 (100.0%) | 0 (0.0%) |
| High School Diploma | 27 (64.3%) | 15 (35.7%) |
| College/Associate Degree | 30 (73.2%) | 11 (26.8%) |
| Bachelor's Degree or higher | 12 (66.7%) | 6 (33.3%) |
Occupancy by Age of Householder in Perrytown
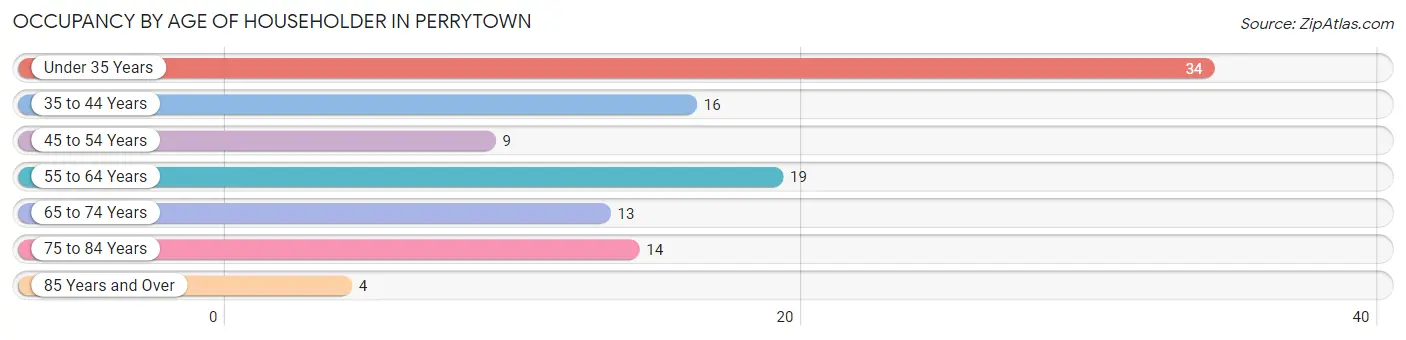
| Age Bracket | # Households | % Households |
| Under 35 Years | 34 | 31.2% |
| 35 to 44 Years | 16 | 14.7% |
| 45 to 54 Years | 9 | 8.3% |
| 55 to 64 Years | 19 | 17.4% |
| 65 to 74 Years | 13 | 11.9% |
| 75 to 84 Years | 14 | 12.8% |
| 85 Years and Over | 4 | 3.7% |
| Total | 109 | 100.0% |
Housing Finances in Perrytown
Median Income by Occupancy in Perrytown
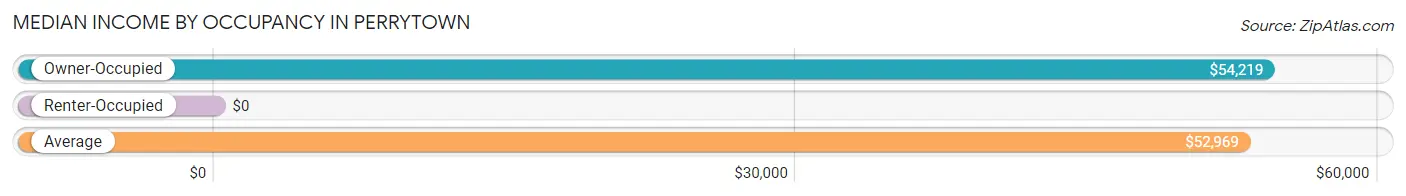
| Occupancy Type | # Households | Median Income |
| Owner-Occupied | 77 (70.6%) | $54,219 |
| Renter-Occupied | 32 (29.4%) | $0 |
| Average | 109 (100.0%) | $52,969 |
Occupancy by Householder Income Bracket in Perrytown
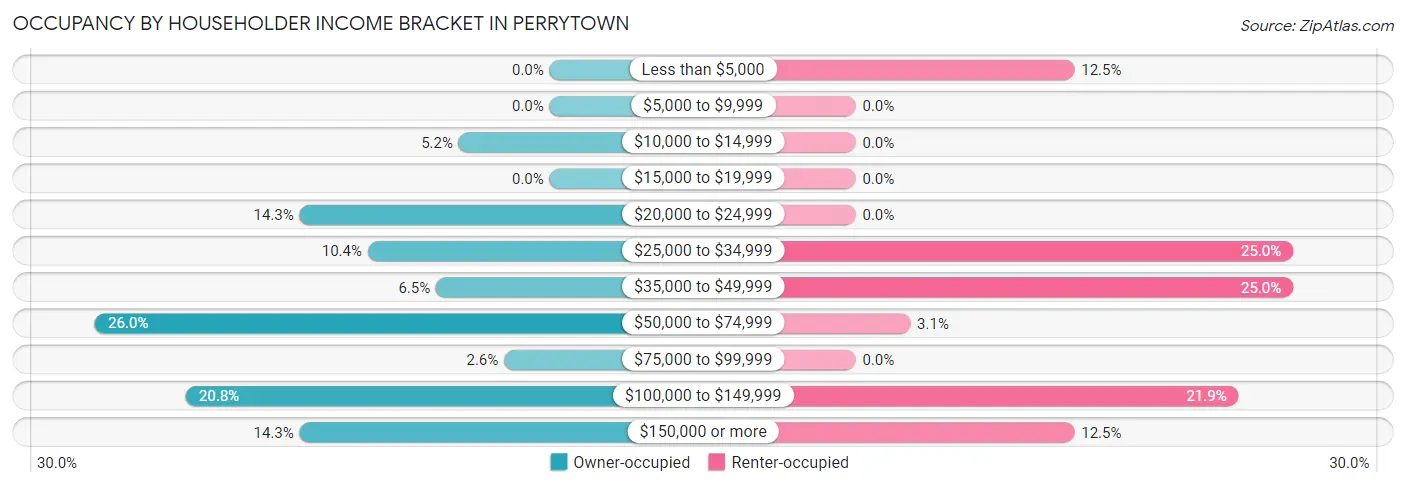
| Income Bracket | Owner-occupied | Renter-occupied |
| Less than $5,000 | 0 (0.0%) | 4 (12.5%) |
| $5,000 to $9,999 | 0 (0.0%) | 0 (0.0%) |
| $10,000 to $14,999 | 4 (5.2%) | 0 (0.0%) |
| $15,000 to $19,999 | 0 (0.0%) | 0 (0.0%) |
| $20,000 to $24,999 | 11 (14.3%) | 0 (0.0%) |
| $25,000 to $34,999 | 8 (10.4%) | 8 (25.0%) |
| $35,000 to $49,999 | 5 (6.5%) | 8 (25.0%) |
| $50,000 to $74,999 | 20 (26.0%) | 1 (3.1%) |
| $75,000 to $99,999 | 2 (2.6%) | 0 (0.0%) |
| $100,000 to $149,999 | 16 (20.8%) | 7 (21.9%) |
| $150,000 or more | 11 (14.3%) | 4 (12.5%) |
| Total | 77 (100.0%) | 32 (100.0%) |
Monthly Housing Cost Tiers in Perrytown
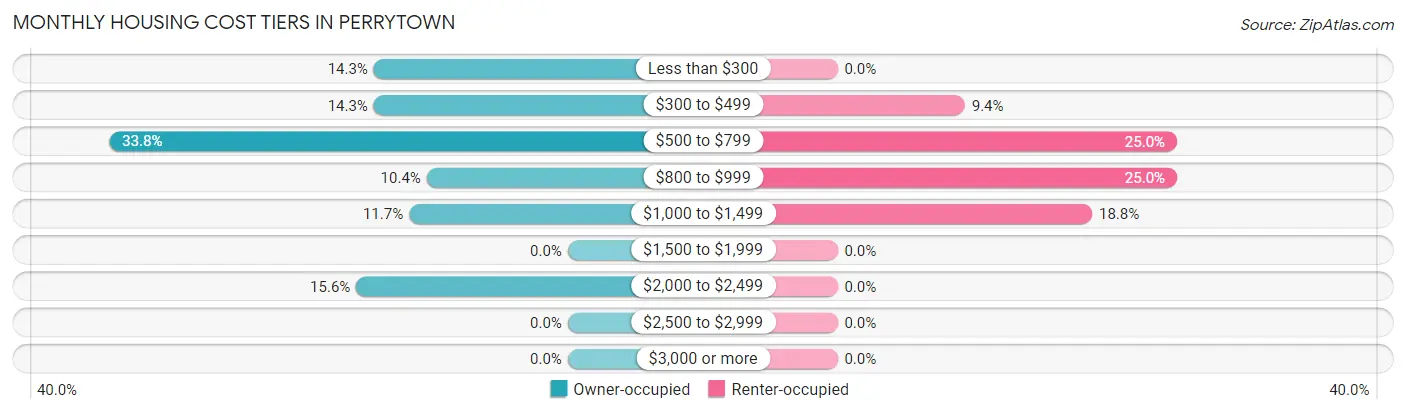
| Monthly Cost | Owner-occupied | Renter-occupied |
| Less than $300 | 11 (14.3%) | 0 (0.0%) |
| $300 to $499 | 11 (14.3%) | 3 (9.4%) |
| $500 to $799 | 26 (33.8%) | 8 (25.0%) |
| $800 to $999 | 8 (10.4%) | 8 (25.0%) |
| $1,000 to $1,499 | 9 (11.7%) | 6 (18.8%) |
| $1,500 to $1,999 | 0 (0.0%) | 0 (0.0%) |
| $2,000 to $2,499 | 12 (15.6%) | 0 (0.0%) |
| $2,500 to $2,999 | 0 (0.0%) | 0 (0.0%) |
| $3,000 or more | 0 (0.0%) | 0 (0.0%) |
| Total | 77 (100.0%) | 32 (100.0%) |
Physical Housing Characteristics in Perrytown
Housing Structures in Perrytown
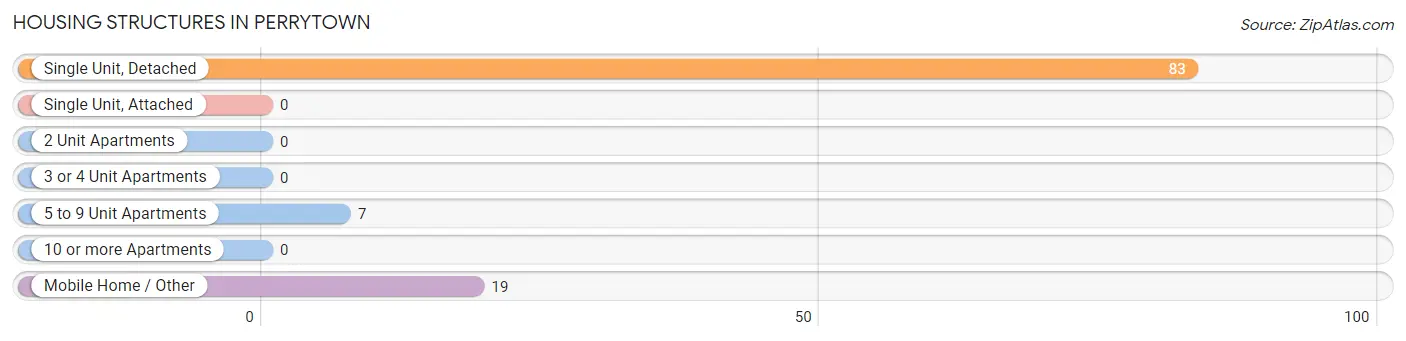
| Structure Type | # Housing Units | % Housing Units |
| Single Unit, Detached | 83 | 76.1% |
| Single Unit, Attached | 0 | 0.0% |
| 2 Unit Apartments | 0 | 0.0% |
| 3 or 4 Unit Apartments | 0 | 0.0% |
| 5 to 9 Unit Apartments | 7 | 6.4% |
| 10 or more Apartments | 0 | 0.0% |
| Mobile Home / Other | 19 | 17.4% |
| Total | 109 | 100.0% |
Housing Structures by Occupancy in Perrytown
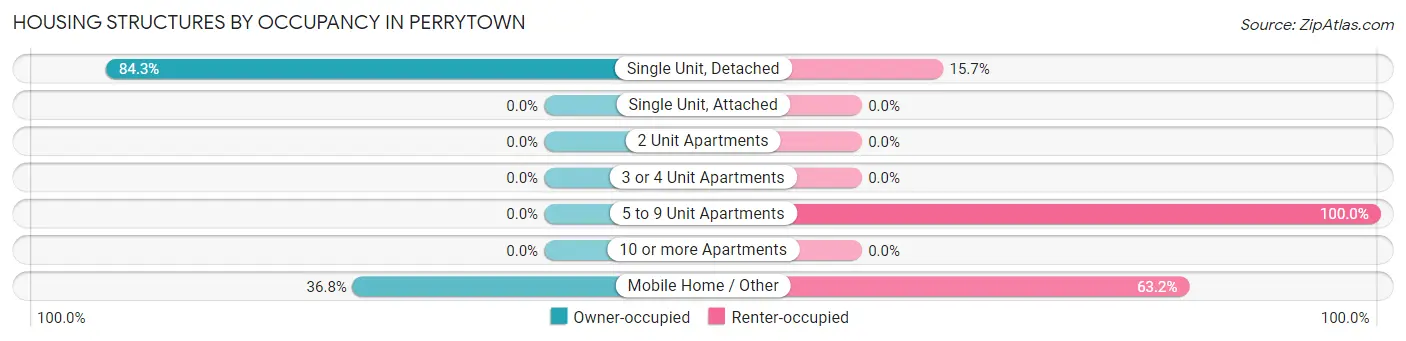
| Structure Type | Owner-occupied | Renter-occupied |
| Single Unit, Detached | 70 (84.3%) | 13 (15.7%) |
| Single Unit, Attached | 0 (0.0%) | 0 (0.0%) |
| 2 Unit Apartments | 0 (0.0%) | 0 (0.0%) |
| 3 or 4 Unit Apartments | 0 (0.0%) | 0 (0.0%) |
| 5 to 9 Unit Apartments | 0 (0.0%) | 7 (100.0%) |
| 10 or more Apartments | 0 (0.0%) | 0 (0.0%) |
| Mobile Home / Other | 7 (36.8%) | 12 (63.2%) |
| Total | 77 (70.6%) | 32 (29.4%) |
Housing Structures by Number of Rooms in Perrytown
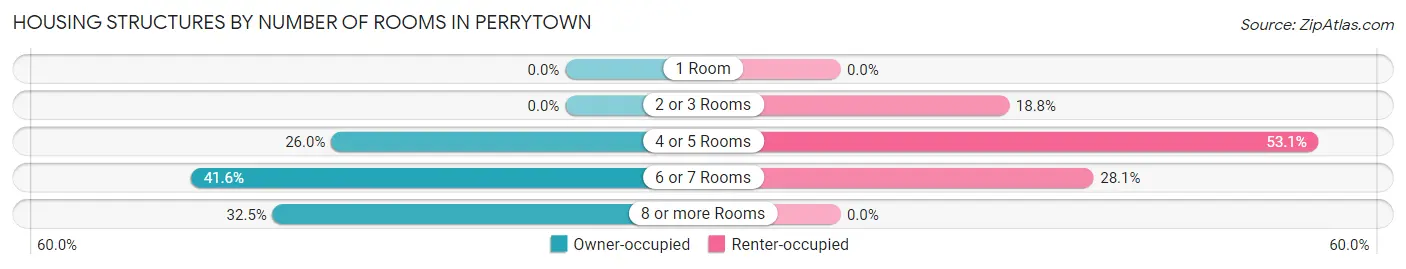
| Number of Rooms | Owner-occupied | Renter-occupied |
| 1 Room | 0 (0.0%) | 0 (0.0%) |
| 2 or 3 Rooms | 0 (0.0%) | 6 (18.8%) |
| 4 or 5 Rooms | 20 (26.0%) | 17 (53.1%) |
| 6 or 7 Rooms | 32 (41.6%) | 9 (28.1%) |
| 8 or more Rooms | 25 (32.5%) | 0 (0.0%) |
| Total | 77 (100.0%) | 32 (100.0%) |
Housing Structure by Heating Type in Perrytown
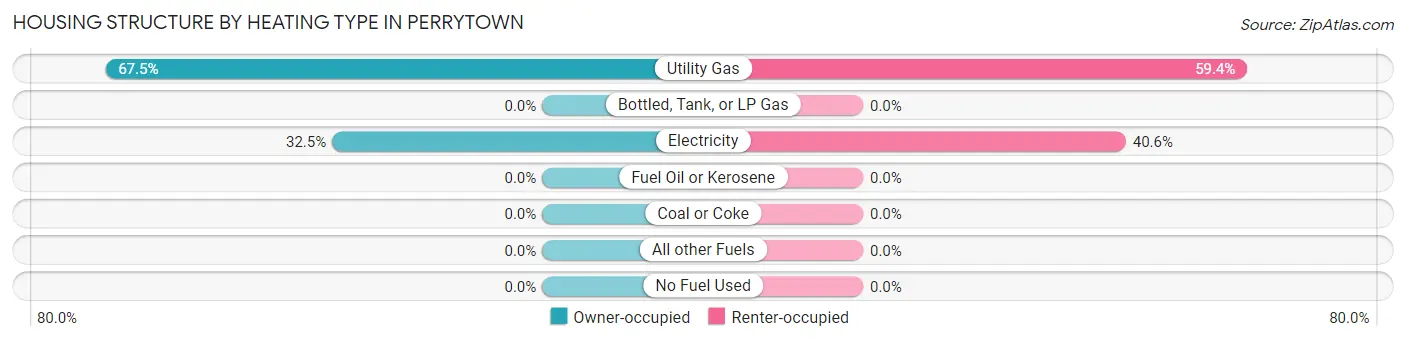
| Heating Type | Owner-occupied | Renter-occupied |
| Utility Gas | 52 (67.5%) | 19 (59.4%) |
| Bottled, Tank, or LP Gas | 0 (0.0%) | 0 (0.0%) |
| Electricity | 25 (32.5%) | 13 (40.6%) |
| Fuel Oil or Kerosene | 0 (0.0%) | 0 (0.0%) |
| Coal or Coke | 0 (0.0%) | 0 (0.0%) |
| All other Fuels | 0 (0.0%) | 0 (0.0%) |
| No Fuel Used | 0 (0.0%) | 0 (0.0%) |
| Total | 77 (100.0%) | 32 (100.0%) |
Household Vehicle Usage in Perrytown
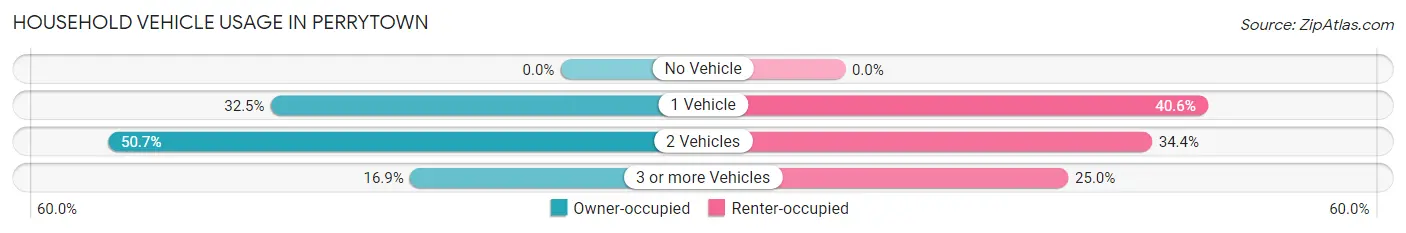
| Vehicles per Household | Owner-occupied | Renter-occupied |
| No Vehicle | 0 (0.0%) | 0 (0.0%) |
| 1 Vehicle | 25 (32.5%) | 13 (40.6%) |
| 2 Vehicles | 39 (50.6%) | 11 (34.4%) |
| 3 or more Vehicles | 13 (16.9%) | 8 (25.0%) |
| Total | 77 (100.0%) | 32 (100.0%) |
Real Estate & Mortgages in Perrytown
Real Estate and Mortgage Overview in Perrytown
| Characteristic | Without Mortgage | With Mortgage |
| Housing Units | 35 | 42 |
| Median Property Value | $95,000 | $132,500 |
| Median Household Income | $49,688 | $11 |
| Monthly Housing Costs | $425 | $0 |
| Real Estate Taxes | $396 | $1 |
Property Value by Mortgage Status in Perrytown
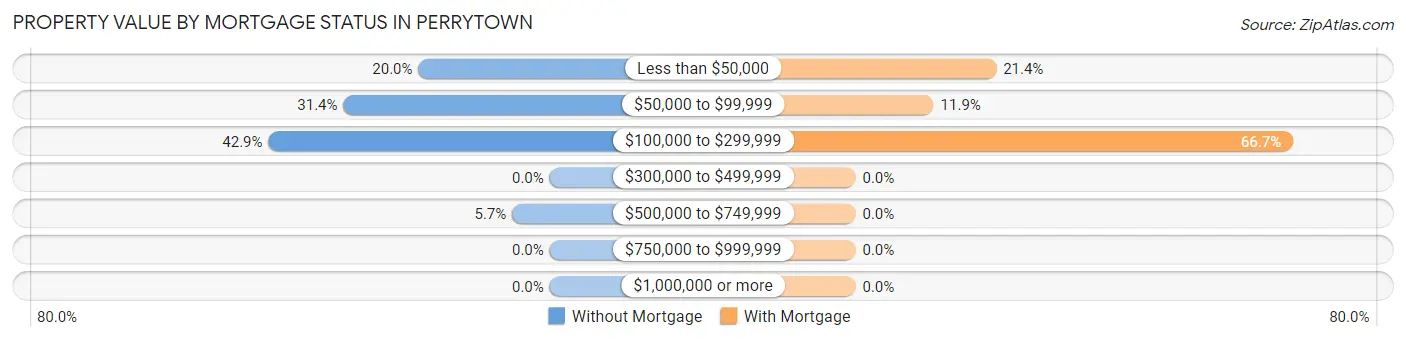
| Property Value | Without Mortgage | With Mortgage |
| Less than $50,000 | 7 (20.0%) | 9 (21.4%) |
| $50,000 to $99,999 | 11 (31.4%) | 5 (11.9%) |
| $100,000 to $299,999 | 15 (42.9%) | 28 (66.7%) |
| $300,000 to $499,999 | 0 (0.0%) | 0 (0.0%) |
| $500,000 to $749,999 | 2 (5.7%) | 0 (0.0%) |
| $750,000 to $999,999 | 0 (0.0%) | 0 (0.0%) |
| $1,000,000 or more | 0 (0.0%) | 0 (0.0%) |
| Total | 35 (100.0%) | 42 (100.0%) |
Household Income by Mortgage Status in Perrytown
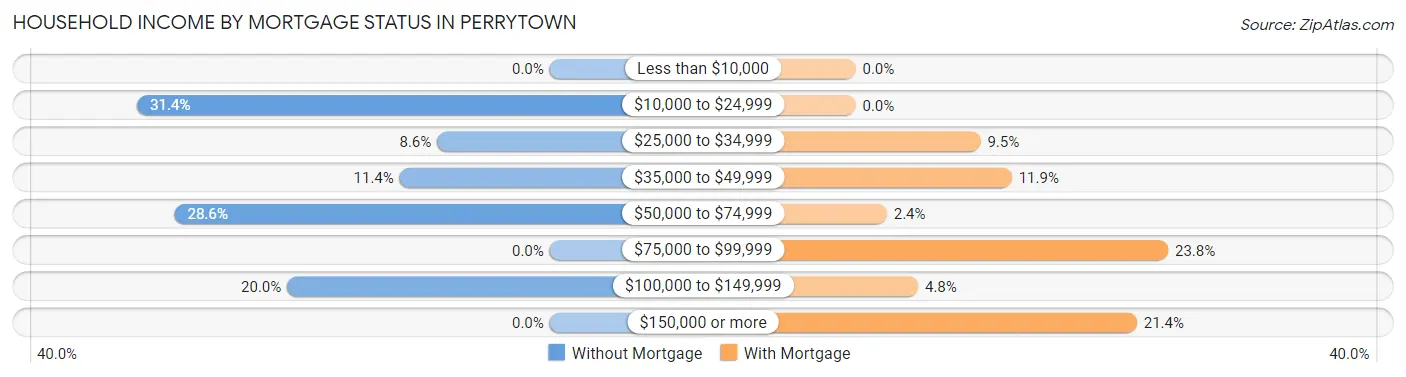
| Household Income | Without Mortgage | With Mortgage |
| Less than $10,000 | 0 (0.0%) | 0 (0.0%) |
| $10,000 to $24,999 | 11 (31.4%) | 0 (0.0%) |
| $25,000 to $34,999 | 3 (8.6%) | 4 (9.5%) |
| $35,000 to $49,999 | 4 (11.4%) | 5 (11.9%) |
| $50,000 to $74,999 | 10 (28.6%) | 1 (2.4%) |
| $75,000 to $99,999 | 0 (0.0%) | 10 (23.8%) |
| $100,000 to $149,999 | 7 (20.0%) | 2 (4.8%) |
| $150,000 or more | 0 (0.0%) | 9 (21.4%) |
| Total | 35 (100.0%) | 42 (100.0%) |
Property Value to Household Income Ratio in Perrytown
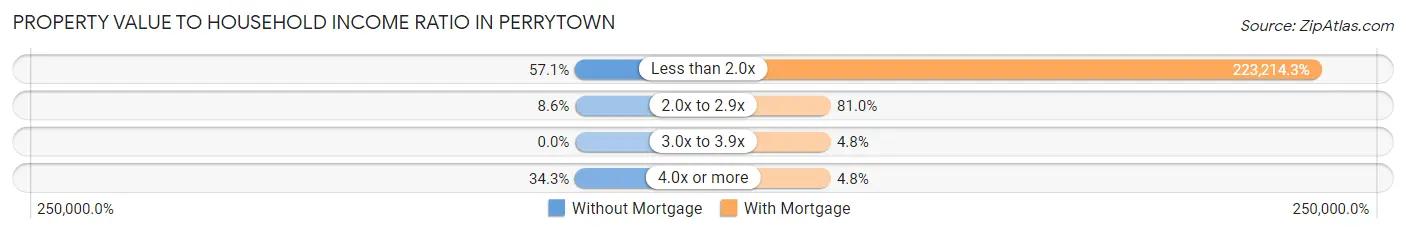
| Value-to-Income Ratio | Without Mortgage | With Mortgage |
| Less than 2.0x | 20 (57.1%) | 93,750 (223,214.3%) |
| 2.0x to 2.9x | 3 (8.6%) | 34 (80.9%) |
| 3.0x to 3.9x | 0 (0.0%) | 2 (4.8%) |
| 4.0x or more | 12 (34.3%) | 2 (4.8%) |
| Total | 35 (100.0%) | 42 (100.0%) |
Real Estate Taxes by Mortgage Status in Perrytown
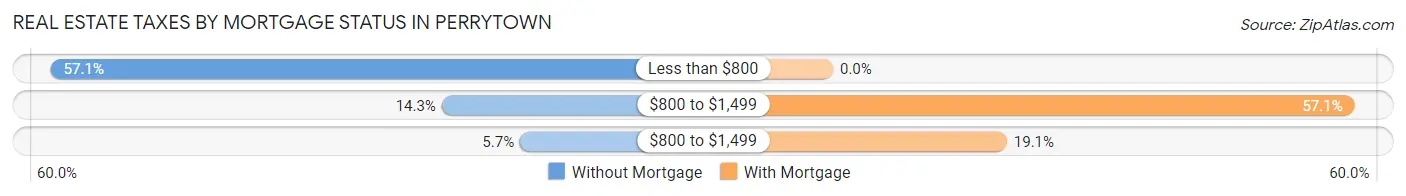
| Property Taxes | Without Mortgage | With Mortgage |
| Less than $800 | 20 (57.1%) | 0 (0.0%) |
| $800 to $1,499 | 5 (14.3%) | 24 (57.1%) |
| $800 to $1,499 | 2 (5.7%) | 8 (19.1%) |
| Total | 35 (100.0%) | 42 (100.0%) |
Health & Disability in Perrytown
Health Insurance Coverage by Age in Perrytown
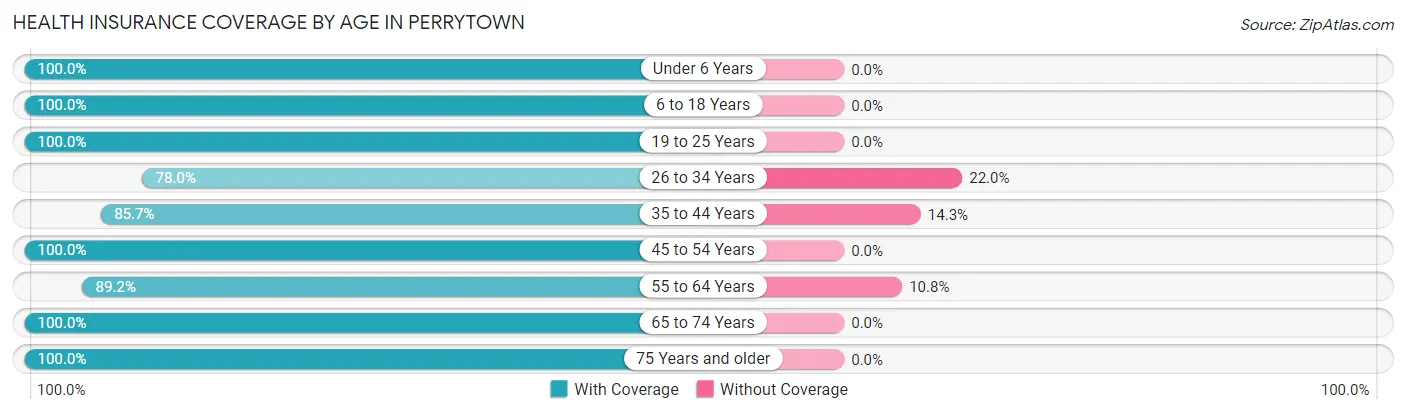
| Age Bracket | With Coverage | Without Coverage |
| Under 6 Years | 77 (100.0%) | 0 (0.0%) |
| 6 to 18 Years | 126 (100.0%) | 0 (0.0%) |
| 19 to 25 Years | 23 (100.0%) | 0 (0.0%) |
| 26 to 34 Years | 39 (78.0%) | 11 (22.0%) |
| 35 to 44 Years | 24 (85.7%) | 4 (14.3%) |
| 45 to 54 Years | 20 (100.0%) | 0 (0.0%) |
| 55 to 64 Years | 33 (89.2%) | 4 (10.8%) |
| 65 to 74 Years | 25 (100.0%) | 0 (0.0%) |
| 75 Years and older | 29 (100.0%) | 0 (0.0%) |
| Total | 396 (95.4%) | 19 (4.6%) |
Health Insurance Coverage by Citizenship Status in Perrytown
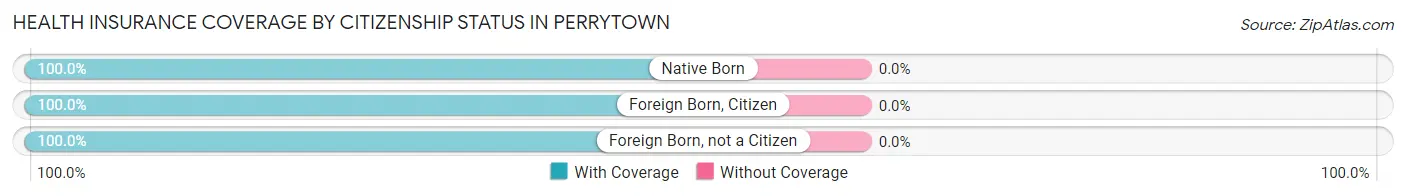
| Citizenship Status | With Coverage | Without Coverage |
| Native Born | 77 (100.0%) | 0 (0.0%) |
| Foreign Born, Citizen | 126 (100.0%) | 0 (0.0%) |
| Foreign Born, not a Citizen | 23 (100.0%) | 0 (0.0%) |
Health Insurance Coverage by Household Income in Perrytown
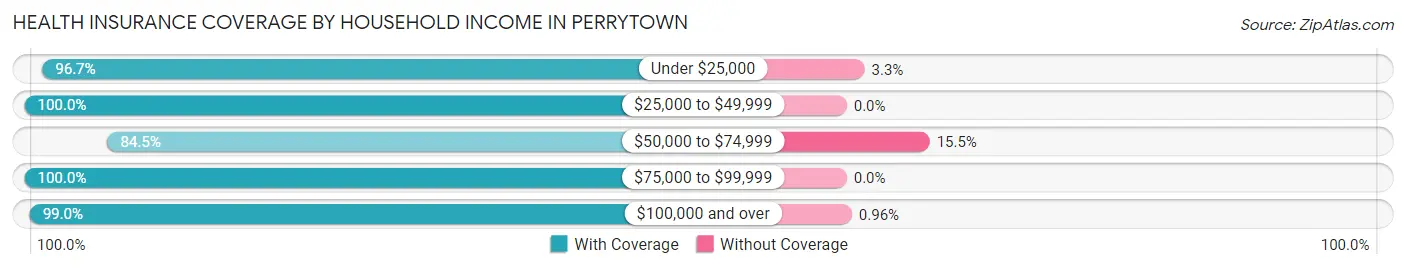
| Household Income | With Coverage | Without Coverage |
| Under $25,000 | 29 (96.7%) | 1 (3.3%) |
| $25,000 to $49,999 | 54 (100.0%) | 0 (0.0%) |
| $50,000 to $74,999 | 87 (84.5%) | 16 (15.5%) |
| $75,000 to $99,999 | 19 (100.0%) | 0 (0.0%) |
| $100,000 and over | 207 (99.0%) | 2 (1.0%) |
Public vs Private Health Insurance Coverage by Age in Perrytown
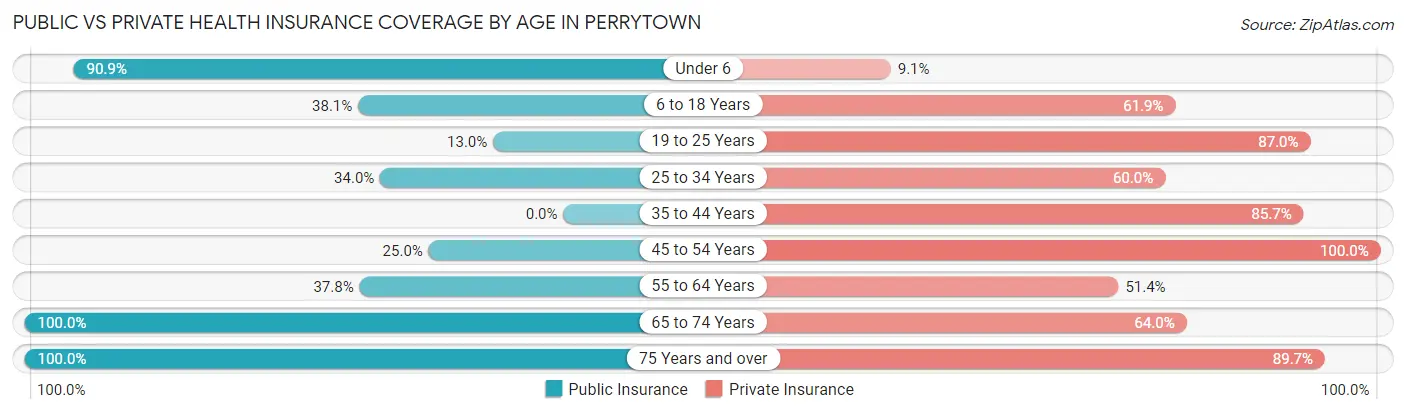
| Age Bracket | Public Insurance | Private Insurance |
| Under 6 | 70 (90.9%) | 7 (9.1%) |
| 6 to 18 Years | 48 (38.1%) | 78 (61.9%) |
| 19 to 25 Years | 3 (13.0%) | 20 (87.0%) |
| 25 to 34 Years | 17 (34.0%) | 30 (60.0%) |
| 35 to 44 Years | 0 (0.0%) | 24 (85.7%) |
| 45 to 54 Years | 5 (25.0%) | 20 (100.0%) |
| 55 to 64 Years | 14 (37.8%) | 19 (51.3%) |
| 65 to 74 Years | 25 (100.0%) | 16 (64.0%) |
| 75 Years and over | 29 (100.0%) | 26 (89.7%) |
| Total | 211 (50.8%) | 240 (57.8%) |
Disability Status by Sex by Age in Perrytown
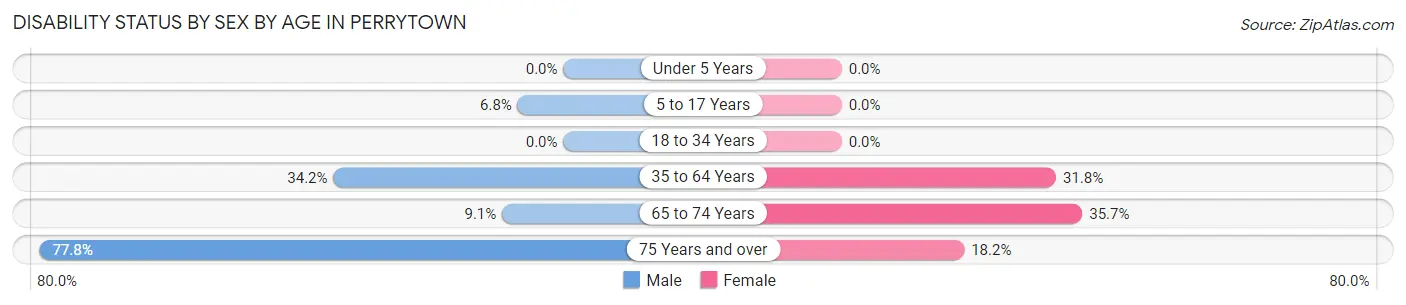
| Age Bracket | Male | Female |
| Under 5 Years | 0 (0.0%) | 0 (0.0%) |
| 5 to 17 Years | 4 (6.8%) | 0 (0.0%) |
| 18 to 34 Years | 0 (0.0%) | 0 (0.0%) |
| 35 to 64 Years | 14 (34.2%) | 14 (31.8%) |
| 65 to 74 Years | 1 (9.1%) | 5 (35.7%) |
| 75 Years and over | 14 (77.8%) | 2 (18.2%) |
Disability Class by Sex by Age in Perrytown
Disability Class: Hearing Difficulty
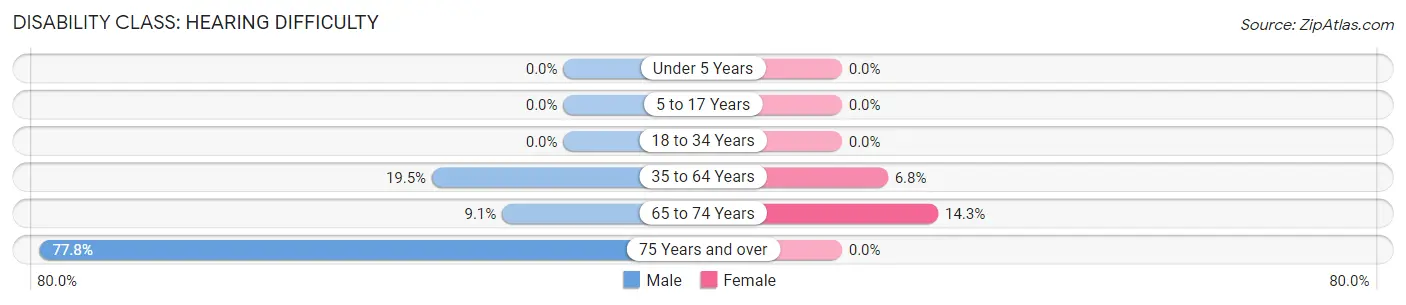
| Age Bracket | Male | Female |
| Under 5 Years | 0 (0.0%) | 0 (0.0%) |
| 5 to 17 Years | 0 (0.0%) | 0 (0.0%) |
| 18 to 34 Years | 0 (0.0%) | 0 (0.0%) |
| 35 to 64 Years | 8 (19.5%) | 3 (6.8%) |
| 65 to 74 Years | 1 (9.1%) | 2 (14.3%) |
| 75 Years and over | 14 (77.8%) | 0 (0.0%) |
Disability Class: Vision Difficulty
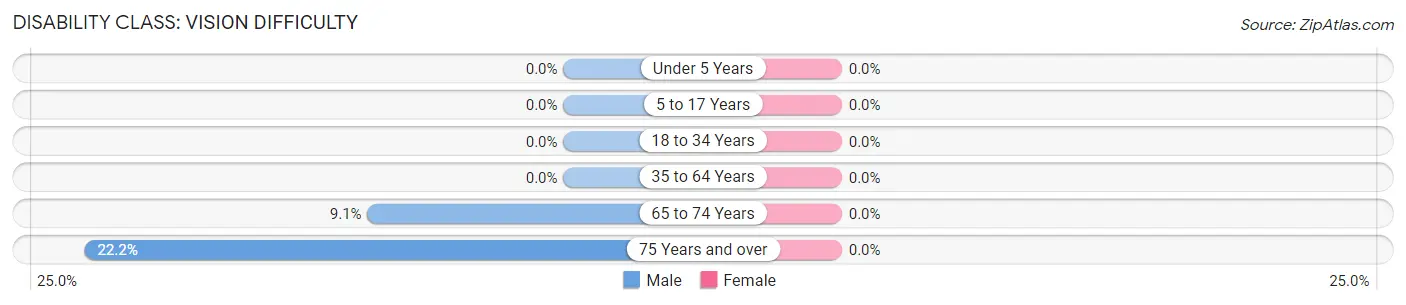
| Age Bracket | Male | Female |
| Under 5 Years | 0 (0.0%) | 0 (0.0%) |
| 5 to 17 Years | 0 (0.0%) | 0 (0.0%) |
| 18 to 34 Years | 0 (0.0%) | 0 (0.0%) |
| 35 to 64 Years | 0 (0.0%) | 0 (0.0%) |
| 65 to 74 Years | 1 (9.1%) | 0 (0.0%) |
| 75 Years and over | 4 (22.2%) | 0 (0.0%) |
Disability Class: Cognitive Difficulty
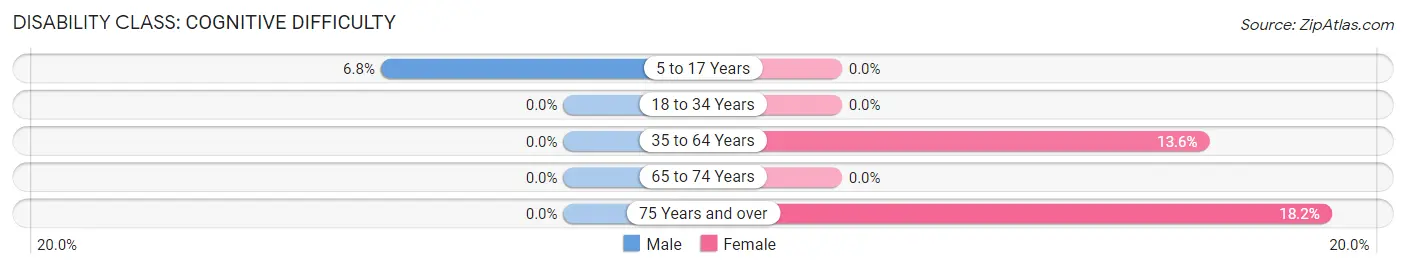
| Age Bracket | Male | Female |
| 5 to 17 Years | 4 (6.8%) | 0 (0.0%) |
| 18 to 34 Years | 0 (0.0%) | 0 (0.0%) |
| 35 to 64 Years | 0 (0.0%) | 6 (13.6%) |
| 65 to 74 Years | 0 (0.0%) | 0 (0.0%) |
| 75 Years and over | 0 (0.0%) | 2 (18.2%) |
Disability Class: Ambulatory Difficulty
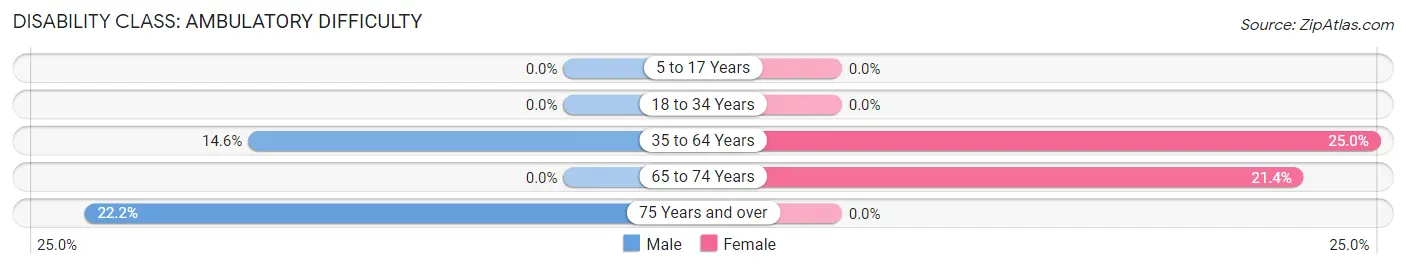
| Age Bracket | Male | Female |
| 5 to 17 Years | 0 (0.0%) | 0 (0.0%) |
| 18 to 34 Years | 0 (0.0%) | 0 (0.0%) |
| 35 to 64 Years | 6 (14.6%) | 11 (25.0%) |
| 65 to 74 Years | 0 (0.0%) | 3 (21.4%) |
| 75 Years and over | 4 (22.2%) | 0 (0.0%) |
Disability Class: Self-Care Difficulty
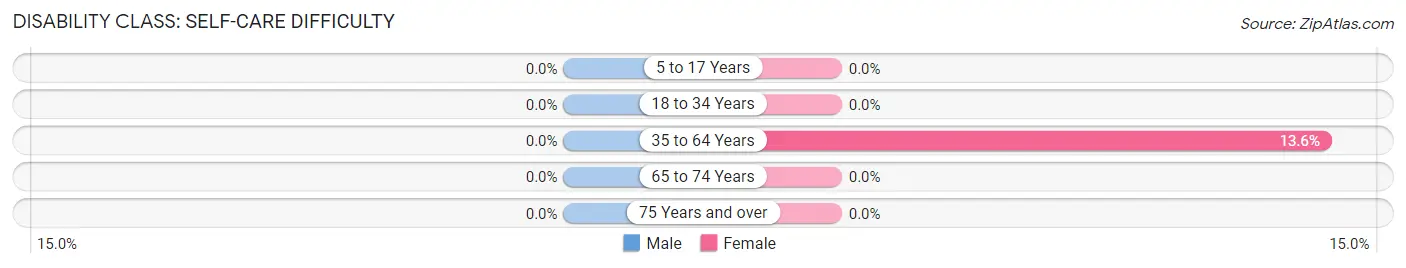
| Age Bracket | Male | Female |
| 5 to 17 Years | 0 (0.0%) | 0 (0.0%) |
| 18 to 34 Years | 0 (0.0%) | 0 (0.0%) |
| 35 to 64 Years | 0 (0.0%) | 6 (13.6%) |
| 65 to 74 Years | 0 (0.0%) | 0 (0.0%) |
| 75 Years and over | 0 (0.0%) | 0 (0.0%) |
Technology Access in Perrytown
Computing Device Access in Perrytown
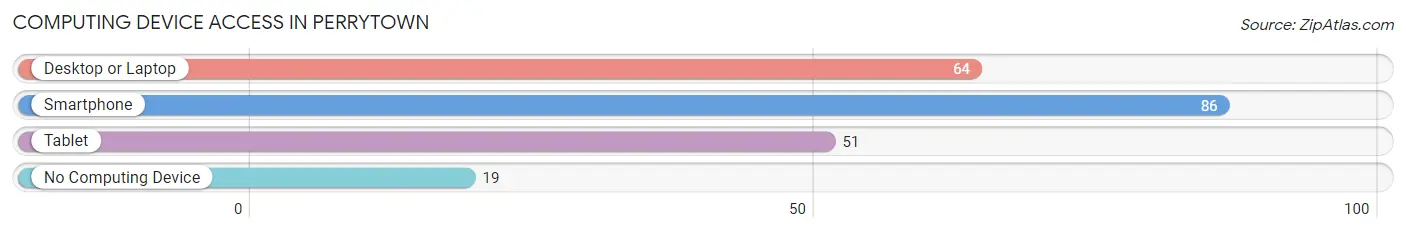
| Device Type | # Households | % Households |
| Desktop or Laptop | 64 | 58.7% |
| Smartphone | 86 | 78.9% |
| Tablet | 51 | 46.8% |
| No Computing Device | 19 | 17.4% |
| Total | 109 | 100.0% |
Internet Access in Perrytown
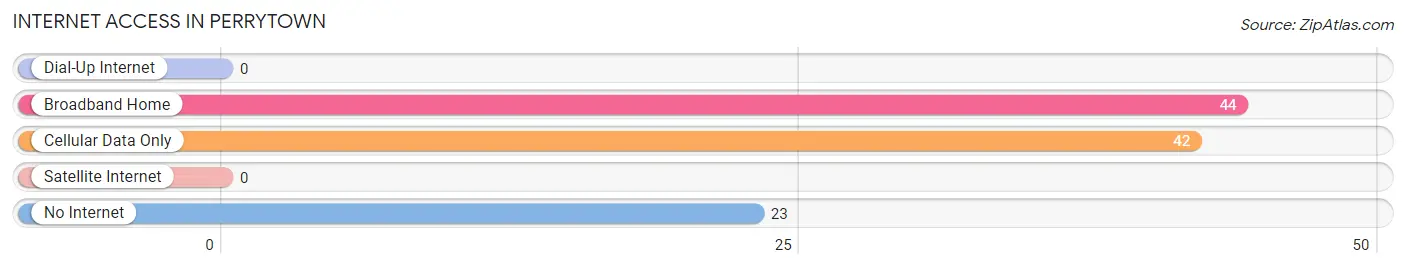
| Internet Type | # Households | % Households |
| Dial-Up Internet | 0 | 0.0% |
| Broadband Home | 44 | 40.4% |
| Cellular Data Only | 42 | 38.5% |
| Satellite Internet | 0 | 0.0% |
| No Internet | 23 | 21.1% |
| Total | 109 | 100.0% |
Perrytown Summary
Perrytown is a small town located in Arkansas, United States. It is situated in the northern part of the state, in the foothills of the Ozark Mountains. The town is located in Perry County, and is part of the Little Rock-North Little Rock-Conway Metropolitan Statistical Area. As of the 2010 census, the population of Perrytown was 1,845.
History
Perrytown was founded in 1883 by a group of settlers from Perry County, Tennessee. The town was named after the county in Tennessee, and was originally known as Perryville. The town was incorporated in 1887, and the first post office was established in 1888.
The town grew slowly, but steadily, and by the early 1900s, it had become a thriving community. The town was home to several businesses, including a sawmill, a gristmill, a cotton gin, and a general store. The town also had a school, a church, and a newspaper.
In the 1920s, the town experienced a period of growth, as the timber industry began to boom in the area. The town was home to several sawmills, and the population grew to over 1,000.
In the 1950s, the timber industry began to decline, and the town's population began to decline as well. By the 1970s, the population had dropped to just over 500.
Geography
Perrytown is located in the northern part of Arkansas, in the foothills of the Ozark Mountains. The town is situated in Perry County, and is part of the Little Rock-North Little Rock-Conway Metropolitan Statistical Area.
The town is located at an elevation of 845 feet (258 m). The town is located at the intersection of Arkansas Highway 9 and Arkansas Highway 10.
The climate in Perrytown is humid subtropical, with hot, humid summers and mild winters. The average annual temperature is 64°F (18°C), and the average annual precipitation is 48 inches (122 cm).
Economy
The economy of Perrytown is largely based on agriculture and timber. The town is home to several farms, and the timber industry is still an important part of the local economy.
The town is also home to several small businesses, including a grocery store, a hardware store, and a restaurant.
Demographics
As of the 2010 census, the population of Perrytown was 1,845. The racial makeup of the town was 97.3% White, 0.7% African American, 0.3% Native American, 0.2% Asian, 0.1% Pacific Islander, 0.3% from other races, and 1.2% from two or more races. Hispanic or Latino of any race were 1.2% of the population.
The median household income in Perrytown was $31,250, and the median family income was $37,500. The per capita income was $15,945. About 17.2% of the population was below the poverty line.
Common Questions
What is Per Capita Income in Perrytown?
Per Capita income in Perrytown is $22,382.
What is the Median Household income in Perrytown?
Median Household Income in Perrytown is $52,969.
What is Income or Wage Gap in Perrytown?
Income or Wage Gap in Perrytown is 19.2%.
Women in Perrytown earn 80.8 cents for every dollar earned by a man.
What is Inequality or Gini Index in Perrytown?
Inequality or Gini Index in Perrytown is 0.41.
What is the Total Population of Perrytown?
Total Population of Perrytown is 415.
What is the Total Male Population of Perrytown?
Total Male Population of Perrytown is 261.
What is the Total Female Population of Perrytown?
Total Female Population of Perrytown is 154.
What is the Ratio of Males per 100 Females in Perrytown?
There are 169.48 Males per 100 Females in Perrytown.
What is the Ratio of Females per 100 Males in Perrytown?
There are 59.00 Females per 100 Males in Perrytown.
What is the Median Population Age in Perrytown?
Median Population Age in Perrytown is 21.6 Years.
What is the Average Family Size in Perrytown
Average Family Size in Perrytown is 4.7 People.
What is the Average Household Size in Perrytown
Average Household Size in Perrytown is 3.8 People.
How Large is the Labor Force in Perrytown?
There are 192 People in the Labor Forcein in Perrytown.
What is the Percentage of People in the Labor Force in Perrytown?
78.4% of People are in the Labor Force in Perrytown.