Rockport, AR Map & Demographics
Rockport Map
Rockport Overview
$30,027
PER CAPITA INCOME
$76,250
AVG FAMILY INCOME
$62,031
AVG HOUSEHOLD INCOME
20.5%
WAGE / INCOME GAP [ % ]
79.5¢/ $1
WAGE / INCOME GAP [ $ ]
0.41
INEQUALITY / GINI INDEX
884
TOTAL POPULATION
495
MALE POPULATION
389
FEMALE POPULATION
127.25
MALES / 100 FEMALES
78.59
FEMALES / 100 MALES
47.6
MEDIAN AGE
3.1
AVG FAMILY SIZE
2.8
AVG HOUSEHOLD SIZE
383
LABOR FORCE [ PEOPLE ]
53.6%
PERCENT IN LABOR FORCE
1.3%
UNEMPLOYMENT RATE
Rockport Area Codes
Income in Rockport
Income Overview in Rockport
Per Capita Income in Rockport is $30,027, while median incomes of families and households are $76,250 and $62,031 respectively.
| Characteristic | Number | Measure |
| Per Capita Income | 884 | $30,027 |
| Median Family Income | 249 | $76,250 |
| Mean Family Income | 249 | $90,935 |
| Median Household Income | 317 | $62,031 |
| Mean Household Income | 317 | $79,428 |
| Income Deficit | 249 | $0 |
| Wage / Income Gap (%) | 884 | 20.52% |
| Wage / Income Gap ($) | 884 | 79.48¢ per $1 |
| Gini / Inequality Index | 884 | 0.41 |
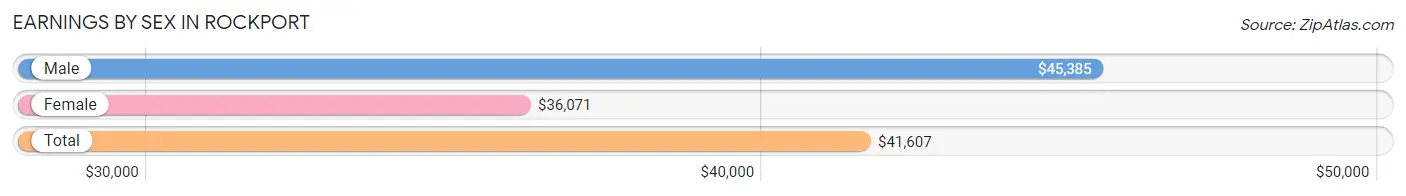
Earnings by Sex in Rockport
Average Earnings in Rockport are $41,607, $45,385 for men and $36,071 for women, a difference of 20.5%.
| Sex | Number | Average Earnings |
| Male | 242 (55.2%) | $45,385 |
| Female | 196 (44.8%) | $36,071 |
| Total | 438 (100.0%) | $41,607 |
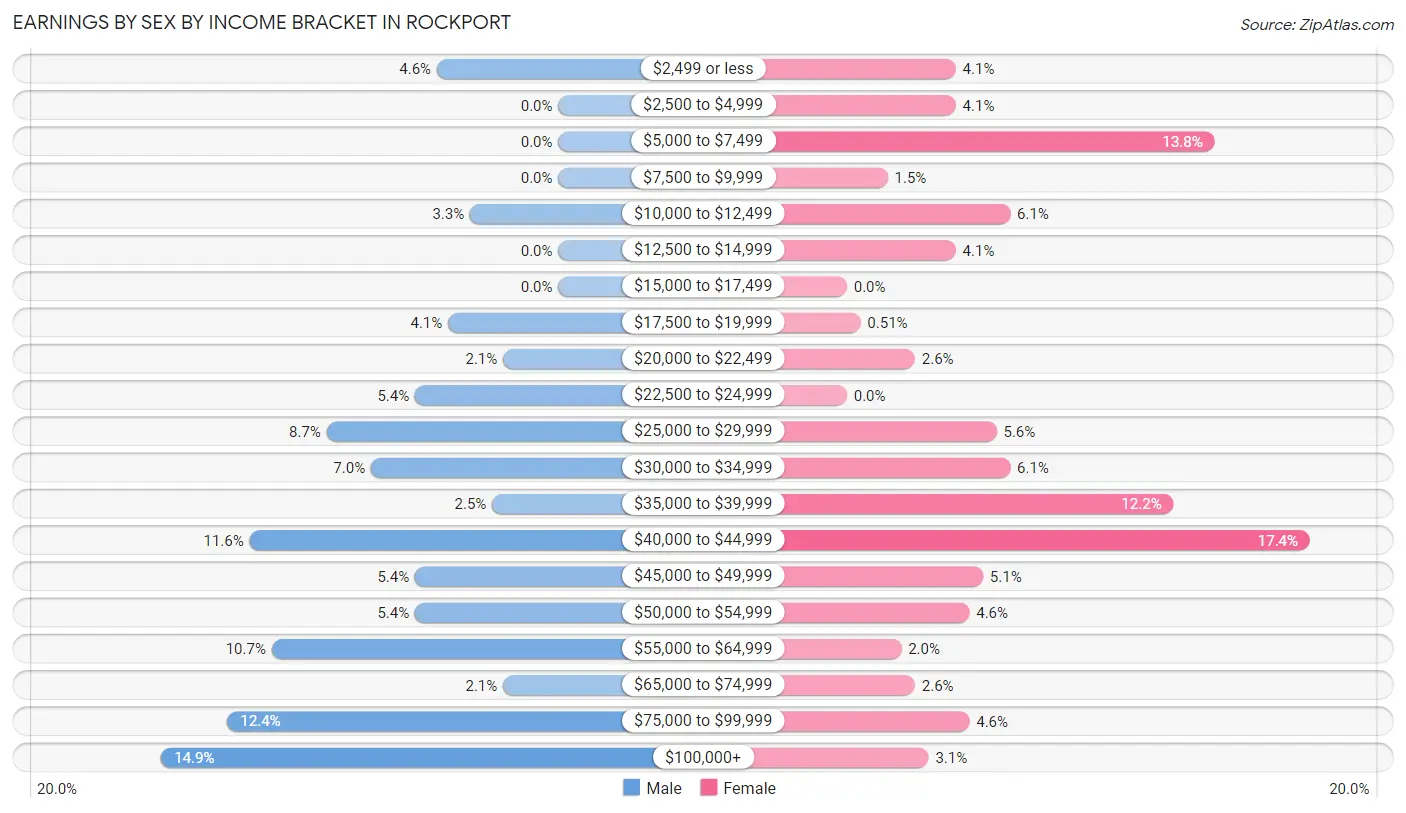
Earnings by Sex by Income Bracket in Rockport
The most common earnings brackets in Rockport are $100,000+ for men (36 | 14.9%) and $40,000 to $44,999 for women (34 | 17.3%).
| Income | Male | Female |
| $2,499 or less | 11 (4.5%) | 8 (4.1%) |
| $2,500 to $4,999 | 0 (0.0%) | 8 (4.1%) |
| $5,000 to $7,499 | 0 (0.0%) | 27 (13.8%) |
| $7,500 to $9,999 | 0 (0.0%) | 3 (1.5%) |
| $10,000 to $12,499 | 8 (3.3%) | 12 (6.1%) |
| $12,500 to $14,999 | 0 (0.0%) | 8 (4.1%) |
| $15,000 to $17,499 | 0 (0.0%) | 0 (0.0%) |
| $17,500 to $19,999 | 10 (4.1%) | 1 (0.5%) |
| $20,000 to $22,499 | 5 (2.1%) | 5 (2.5%) |
| $22,500 to $24,999 | 13 (5.4%) | 0 (0.0%) |
| $25,000 to $29,999 | 21 (8.7%) | 11 (5.6%) |
| $30,000 to $34,999 | 17 (7.0%) | 12 (6.1%) |
| $35,000 to $39,999 | 6 (2.5%) | 24 (12.2%) |
| $40,000 to $44,999 | 28 (11.6%) | 34 (17.3%) |
| $45,000 to $49,999 | 13 (5.4%) | 10 (5.1%) |
| $50,000 to $54,999 | 13 (5.4%) | 9 (4.6%) |
| $55,000 to $64,999 | 26 (10.7%) | 4 (2.0%) |
| $65,000 to $74,999 | 5 (2.1%) | 5 (2.5%) |
| $75,000 to $99,999 | 30 (12.4%) | 9 (4.6%) |
| $100,000+ | 36 (14.9%) | 6 (3.1%) |
| Total | 242 (100.0%) | 196 (100.0%) |
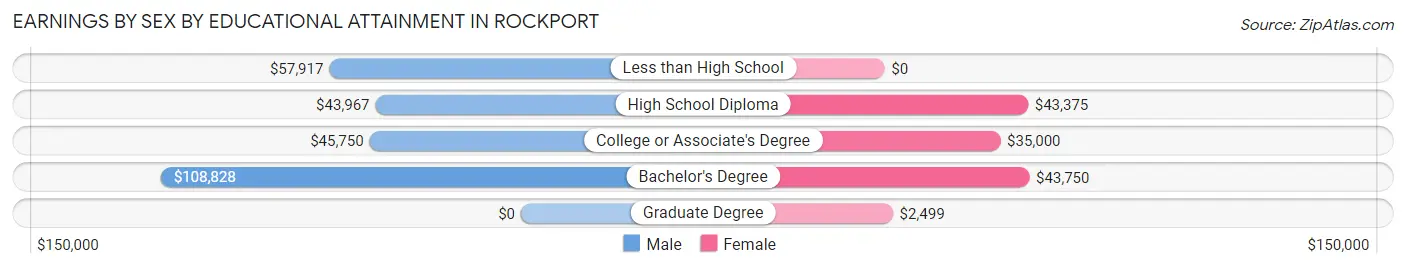
Earnings by Sex by Educational Attainment in Rockport
Average earnings in Rockport are $46,250 for men and $39,338 for women, a difference of 14.9%. Men with an educational attainment of bachelor's degree enjoy the highest average annual earnings of $108,828, while those with high school diploma education earn the least with $43,967. Women with an educational attainment of bachelor's degree earn the most with the average annual earnings of $43,750, while those with graduate degree education have the smallest earnings of $2,499.
| Educational Attainment | Male Income | Female Income |
| Less than High School | $57,917 | $0 |
| High School Diploma | $43,967 | $43,375 |
| College or Associate's Degree | $45,750 | $35,000 |
| Bachelor's Degree | $108,828 | $43,750 |
| Graduate Degree | - | - |
| Total | $46,250 | $39,338 |
Family Income in Rockport
Family Income Brackets in Rockport
According to the Rockport family income data, there are 59 families falling into the $100,000 to $149,999 income range, which is the most common income bracket and makes up 23.7% of all families. Conversely, the less than $10,000 income bracket is the least frequent group with only 5 families (2.0%) belonging to this category.
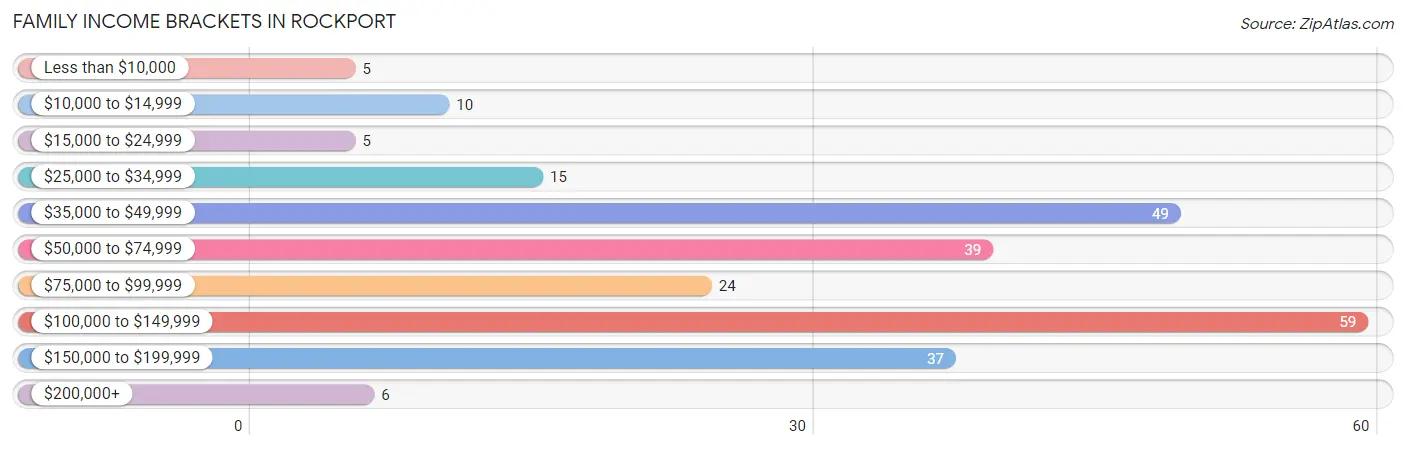
| Income Bracket | # Families | % Families |
| Less than $10,000 | 5 | 2.0% |
| $10,000 to $14,999 | 10 | 4.0% |
| $15,000 to $24,999 | 5 | 2.0% |
| $25,000 to $34,999 | 15 | 6.0% |
| $35,000 to $49,999 | 49 | 19.7% |
| $50,000 to $74,999 | 39 | 15.7% |
| $75,000 to $99,999 | 24 | 9.6% |
| $100,000 to $149,999 | 59 | 23.7% |
| $150,000 to $199,999 | 37 | 14.9% |
| $200,000+ | 6 | 2.4% |
Family Income by Famaliy Size in Rockport
3-person families (45 | 18.1%) account for the highest median family income in Rockport with $170,078 per family, while 3-person families (45 | 18.1%) have the highest median income of $56,693 per family member.
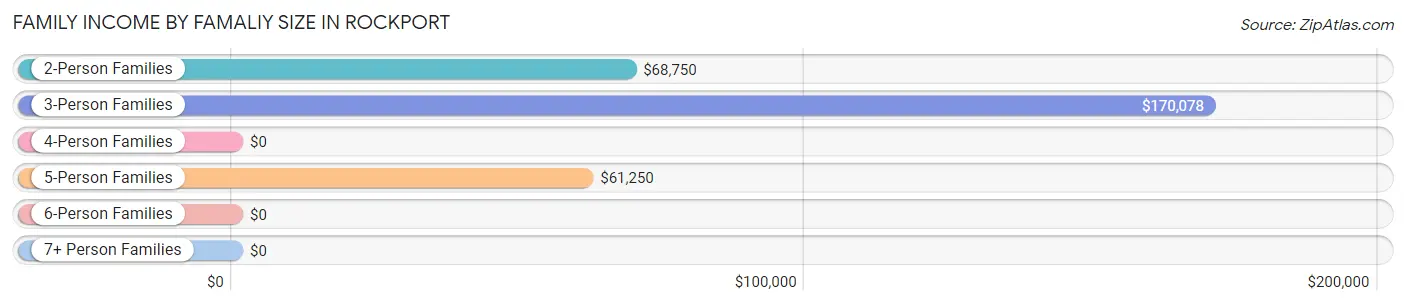
| Income Bracket | # Families | Median Income |
| 2-Person Families | 180 (72.3%) | $68,750 |
| 3-Person Families | 45 (18.1%) | $170,078 |
| 4-Person Families | 12 (4.8%) | $0 |
| 5-Person Families | 12 (4.8%) | $61,250 |
| 6-Person Families | 0 (0.0%) | $0 |
| 7+ Person Families | 0 (0.0%) | $0 |
| Total | 249 (100.0%) | $76,250 |
Family Income by Number of Earners in Rockport
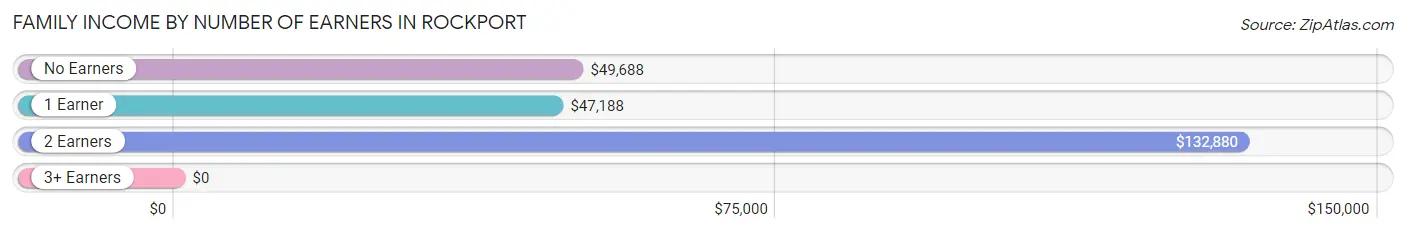
| Number of Earners | # Families | Median Income |
| No Earners | 27 (10.8%) | $49,688 |
| 1 Earner | 110 (44.2%) | $47,188 |
| 2 Earners | 101 (40.6%) | $132,880 |
| 3+ Earners | 11 (4.4%) | $0 |
| Total | 249 (100.0%) | $76,250 |
Household Income in Rockport
Household Income Brackets in Rockport
With 61 households falling in the category, the $100,000 to $149,999 income range is the most frequent in Rockport, accounting for 19.2% of all households. In contrast, only 6 households (1.9%) fall into the $200,000+ income bracket, making it the least populous group.
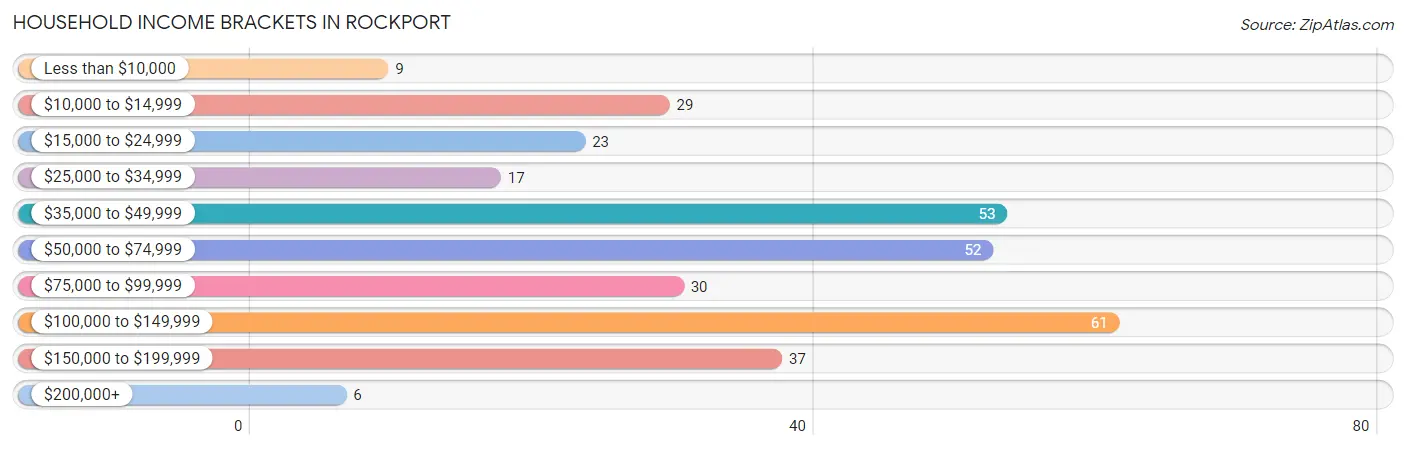
| Income Bracket | # Households | % Households |
| Less than $10,000 | 9 | 2.8% |
| $10,000 to $14,999 | 29 | 9.1% |
| $15,000 to $24,999 | 23 | 7.3% |
| $25,000 to $34,999 | 17 | 5.4% |
| $35,000 to $49,999 | 53 | 16.7% |
| $50,000 to $74,999 | 52 | 16.4% |
| $75,000 to $99,999 | 30 | 9.5% |
| $100,000 to $149,999 | 61 | 19.2% |
| $150,000 to $199,999 | 37 | 11.7% |
| $200,000+ | 6 | 1.9% |
Household Income by Householder Age in Rockport
The median household income in Rockport is $62,031, with the highest median household income of $75,833 found in the 45 to 64 years age bracket for the primary householder. A total of 194 households (61.2%) fall into this category. Meanwhile, the 15 to 24 years age bracket for the primary householder has the lowest median household income of $0, with 2 households (0.6%) in this group.
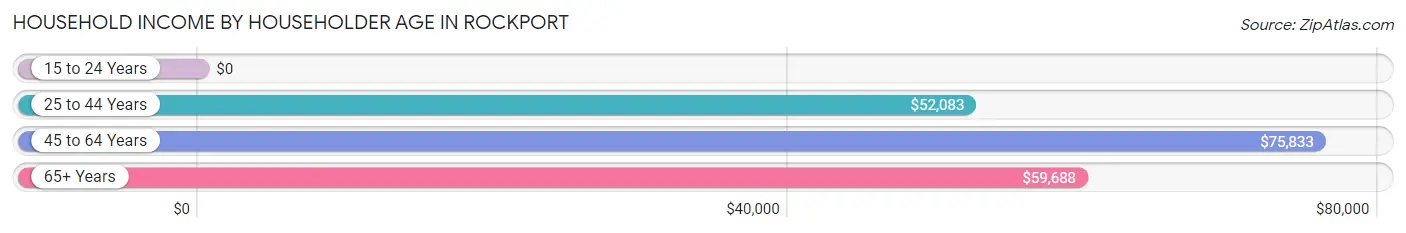
| Income Bracket | # Households | Median Income |
| 15 to 24 Years | 2 (0.6%) | $0 |
| 25 to 44 Years | 58 (18.3%) | $52,083 |
| 45 to 64 Years | 194 (61.2%) | $75,833 |
| 65+ Years | 63 (19.9%) | $59,688 |
| Total | 317 (100.0%) | $62,031 |
Poverty in Rockport
Income Below Poverty by Sex and Age in Rockport
With 24.4% poverty level for males and 14.1% for females among the residents of Rockport, under 5 year old males and under 5 year old females are the most vulnerable to poverty, with 32 males (94.1%) and 17 females (89.5%) in their respective age groups living below the poverty level.
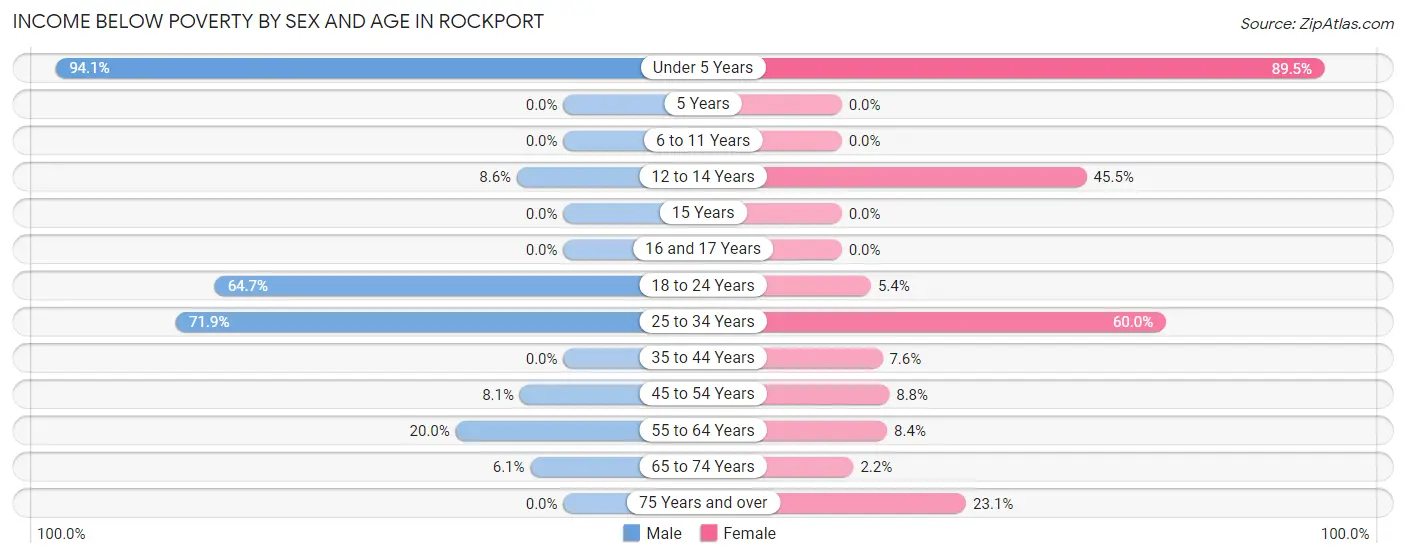
| Age Bracket | Male | Female |
| Under 5 Years | 32 (94.1%) | 17 (89.5%) |
| 5 Years | 0 (0.0%) | 0 (0.0%) |
| 6 to 11 Years | 0 (0.0%) | 0 (0.0%) |
| 12 to 14 Years | 5 (8.6%) | 5 (45.5%) |
| 15 Years | 0 (0.0%) | 0 (0.0%) |
| 16 and 17 Years | 0 (0.0%) | 0 (0.0%) |
| 18 to 24 Years | 11 (64.7%) | 2 (5.4%) |
| 25 to 34 Years | 46 (71.9%) | 9 (60.0%) |
| 35 to 44 Years | 0 (0.0%) | 4 (7.5%) |
| 45 to 54 Years | 8 (8.1%) | 6 (8.8%) |
| 55 to 64 Years | 16 (20.0%) | 8 (8.4%) |
| 65 to 74 Years | 3 (6.1%) | 1 (2.2%) |
| 75 Years and over | 0 (0.0%) | 3 (23.1%) |
| Total | 121 (24.4%) | 55 (14.1%) |
Income Above Poverty by Sex and Age in Rockport
According to the poverty statistics in Rockport, males aged 6 to 11 years and females aged 6 to 11 years are the age groups that are most secure financially, with 100.0% of males and 100.0% of females in these age groups living above the poverty line.
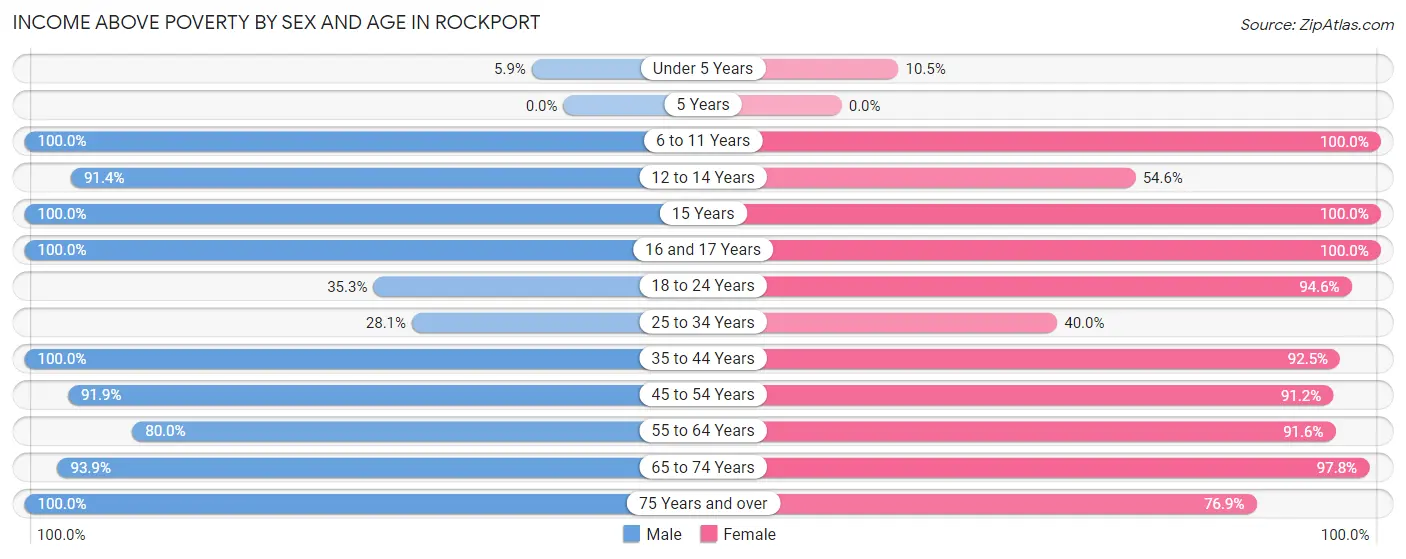
| Age Bracket | Male | Female |
| Under 5 Years | 2 (5.9%) | 2 (10.5%) |
| 5 Years | 0 (0.0%) | 0 (0.0%) |
| 6 to 11 Years | 15 (100.0%) | 14 (100.0%) |
| 12 to 14 Years | 53 (91.4%) | 6 (54.5%) |
| 15 Years | 13 (100.0%) | 5 (100.0%) |
| 16 and 17 Years | 4 (100.0%) | 13 (100.0%) |
| 18 to 24 Years | 6 (35.3%) | 35 (94.6%) |
| 25 to 34 Years | 18 (28.1%) | 6 (40.0%) |
| 35 to 44 Years | 31 (100.0%) | 49 (92.4%) |
| 45 to 54 Years | 91 (91.9%) | 62 (91.2%) |
| 55 to 64 Years | 64 (80.0%) | 87 (91.6%) |
| 65 to 74 Years | 46 (93.9%) | 45 (97.8%) |
| 75 Years and over | 31 (100.0%) | 10 (76.9%) |
| Total | 374 (75.6%) | 334 (85.9%) |
Income Below Poverty Among Married-Couple Families in Rockport
The poverty statistics for married-couple families in Rockport show that 2.8% or 5 of the total 181 families live below the poverty line. Families with 1 or 2 children have the highest poverty rate of 11.9%, comprising of 5 families. On the other hand, families with no children have the lowest poverty rate of 0.0%, which includes 0 families.
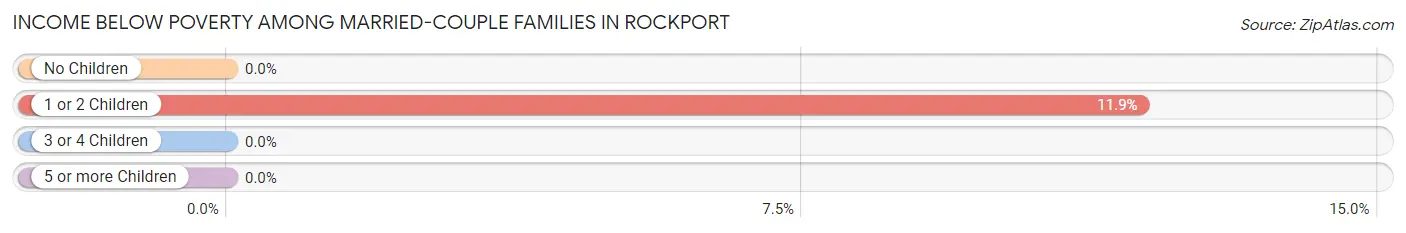
| Children | Above Poverty | Below Poverty |
| No Children | 133 (100.0%) | 0 (0.0%) |
| 1 or 2 Children | 37 (88.1%) | 5 (11.9%) |
| 3 or 4 Children | 6 (100.0%) | 0 (0.0%) |
| 5 or more Children | 0 (0.0%) | 0 (0.0%) |
| Total | 176 (97.2%) | 5 (2.8%) |
Income Below Poverty Among Single-Parent Households in Rockport
According to the poverty data in Rockport, 15.8% or 6 single-father households and 13.3% or 4 single-mother households are living below the poverty line. Among single-father households, those with 1 or 2 children have the highest poverty rate, with 6 households (15.8%) experiencing poverty. Likewise, among single-mother households, those with 1 or 2 children have the highest poverty rate, with 4 households (33.3%) falling below the poverty line.
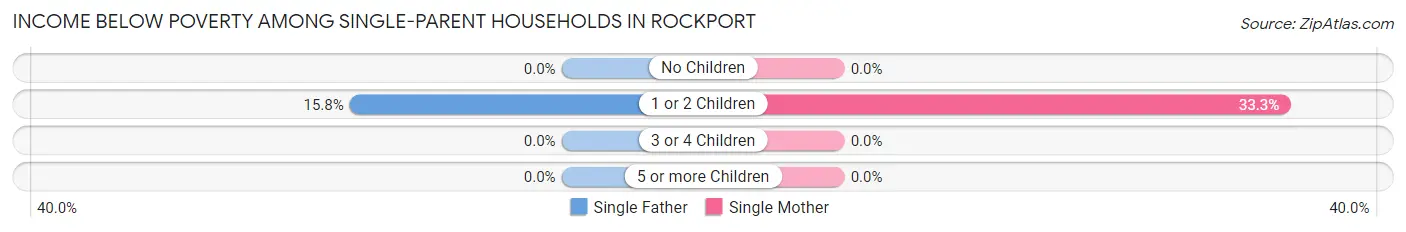
| Children | Single Father | Single Mother |
| No Children | 0 (0.0%) | 0 (0.0%) |
| 1 or 2 Children | 6 (15.8%) | 4 (33.3%) |
| 3 or 4 Children | 0 (0.0%) | 0 (0.0%) |
| 5 or more Children | 0 (0.0%) | 0 (0.0%) |
| Total | 6 (15.8%) | 4 (13.3%) |
Income Below Poverty Among Married-Couple vs Single-Parent Households in Rockport
The poverty data for Rockport shows that 5 of the married-couple family households (2.8%) and 10 of the single-parent households (14.7%) are living below the poverty level. Within the married-couple family households, those with 1 or 2 children have the highest poverty rate, with 5 households (11.9%) falling below the poverty line. Among the single-parent households, those with 1 or 2 children have the highest poverty rate, with 10 household (20.0%) living below poverty.
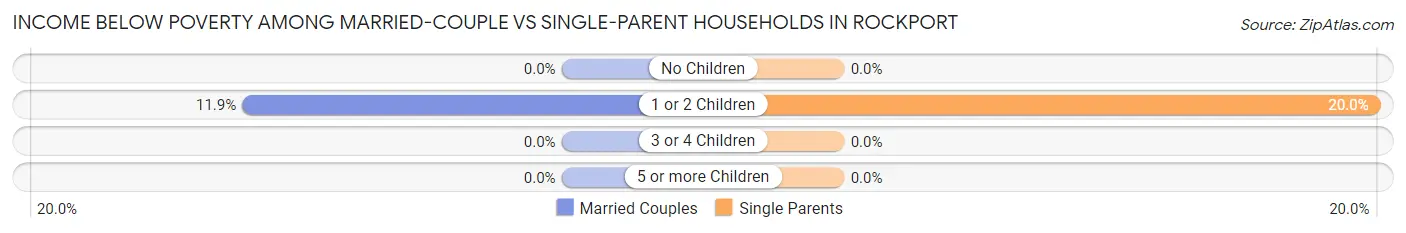
| Children | Married-Couple Families | Single-Parent Households |
| No Children | 0 (0.0%) | 0 (0.0%) |
| 1 or 2 Children | 5 (11.9%) | 10 (20.0%) |
| 3 or 4 Children | 0 (0.0%) | 0 (0.0%) |
| 5 or more Children | 0 (0.0%) | 0 (0.0%) |
| Total | 5 (2.8%) | 10 (14.7%) |
Race in Rockport
The most populous races in Rockport are White / Caucasian (752 | 85.1%), Two or more Races (126 | 14.2%), and Hispanic or Latino (117 | 13.2%).
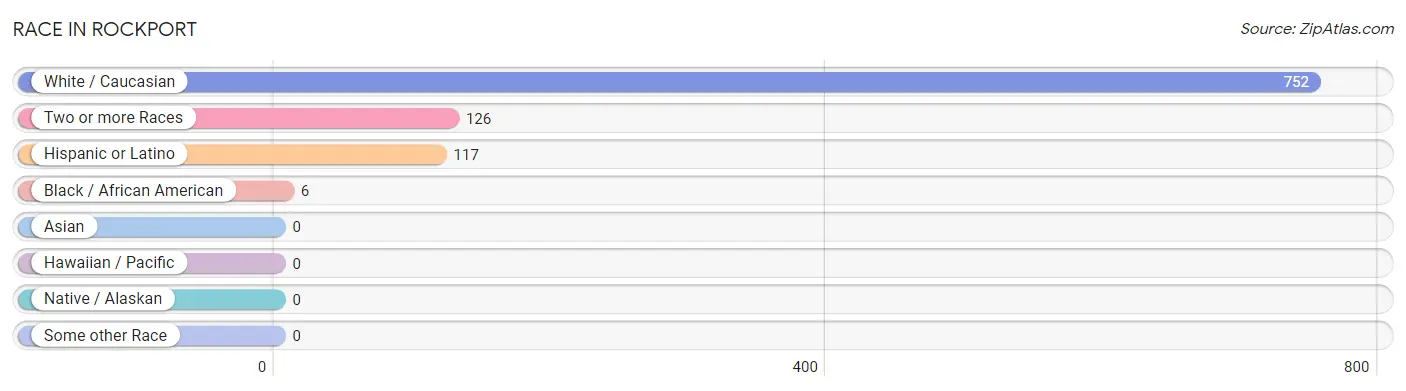
| Race | # Population | % Population |
| Asian | 0 | 0.0% |
| Black / African American | 6 | 0.7% |
| Hawaiian / Pacific | 0 | 0.0% |
| Hispanic or Latino | 117 | 13.2% |
| Native / Alaskan | 0 | 0.0% |
| White / Caucasian | 752 | 85.1% |
| Two or more Races | 126 | 14.2% |
| Some other Race | 0 | 0.0% |
| Total | 884 | 100.0% |
Ancestry in Rockport
The most populous ancestries reported in Rockport are English (96 | 10.9%), Irish (95 | 10.7%), Mexican (90 | 10.2%), Cherokee (79 | 8.9%), and American (57 | 6.5%), together accounting for 47.2% of all Rockport residents.
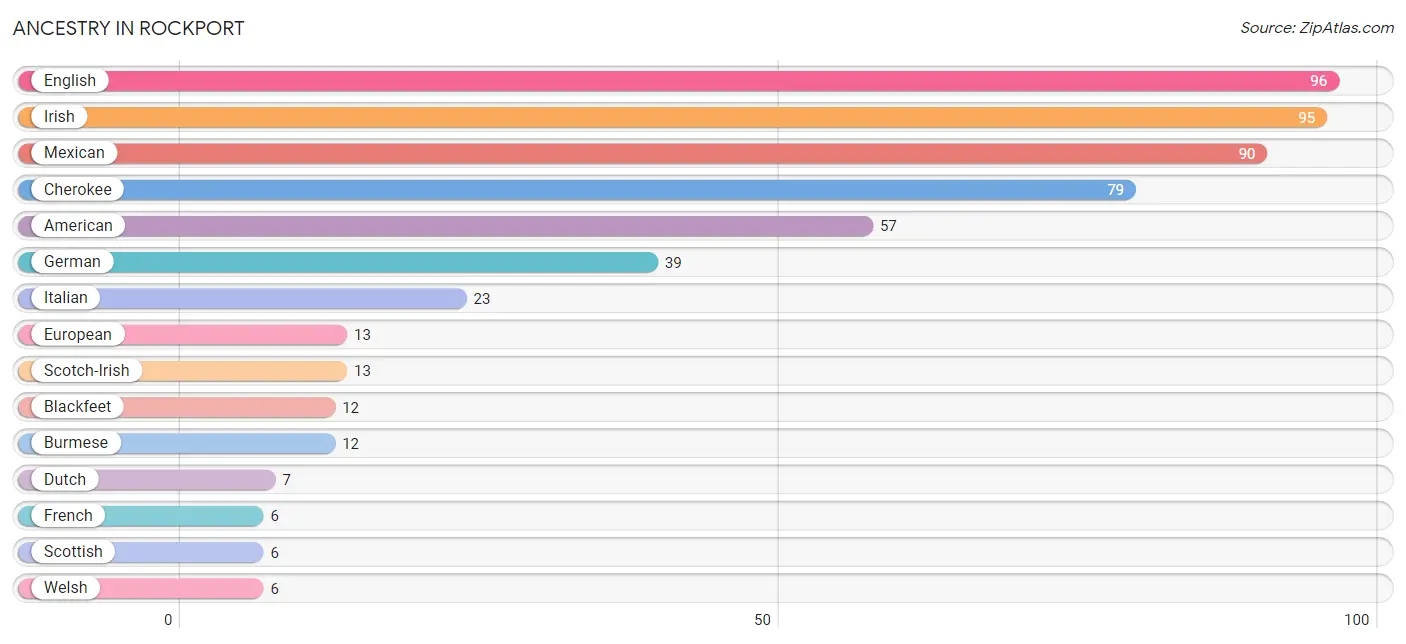
| Ancestry | # Population | % Population |
| American | 57 | 6.5% |
| Blackfeet | 12 | 1.4% |
| British | 1 | 0.1% |
| Burmese | 12 | 1.4% |
| Cherokee | 79 | 8.9% |
| Dutch | 7 | 0.8% |
| Dutch West Indian | 5 | 0.6% |
| English | 96 | 10.9% |
| European | 13 | 1.5% |
| French | 6 | 0.7% |
| German | 39 | 4.4% |
| Icelander | 2 | 0.2% |
| Irish | 95 | 10.7% |
| Italian | 23 | 2.6% |
| Korean | 1 | 0.1% |
| Mexican | 90 | 10.2% |
| Scandinavian | 1 | 0.1% |
| Scotch-Irish | 13 | 1.5% |
| Scottish | 6 | 0.7% |
| Welsh | 6 | 0.7% | View All 20 Rows |
Immigrants in Rockport
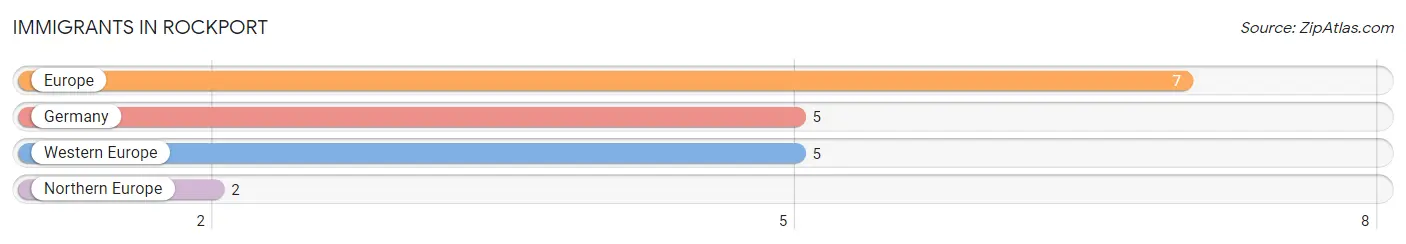
The most numerous immigrant groups reported in Rockport came from Europe (7 | 0.8%), Germany (5 | 0.6%), Western Europe (5 | 0.6%), and Northern Europe (2 | 0.2%), together accounting for 2.2% of all Rockport residents.
| Immigration Origin | # Population | % Population |
| Europe | 7 | 0.8% |
| Germany | 5 | 0.6% |
| Northern Europe | 2 | 0.2% |
| Western Europe | 5 | 0.6% | View All 4 Rows |
Sex and Age in Rockport
Sex and Age in Rockport
The most populous age groups in Rockport are 45 to 49 Years (69 | 13.9%) for men and 60 to 64 Years (50 | 12.9%) for women.
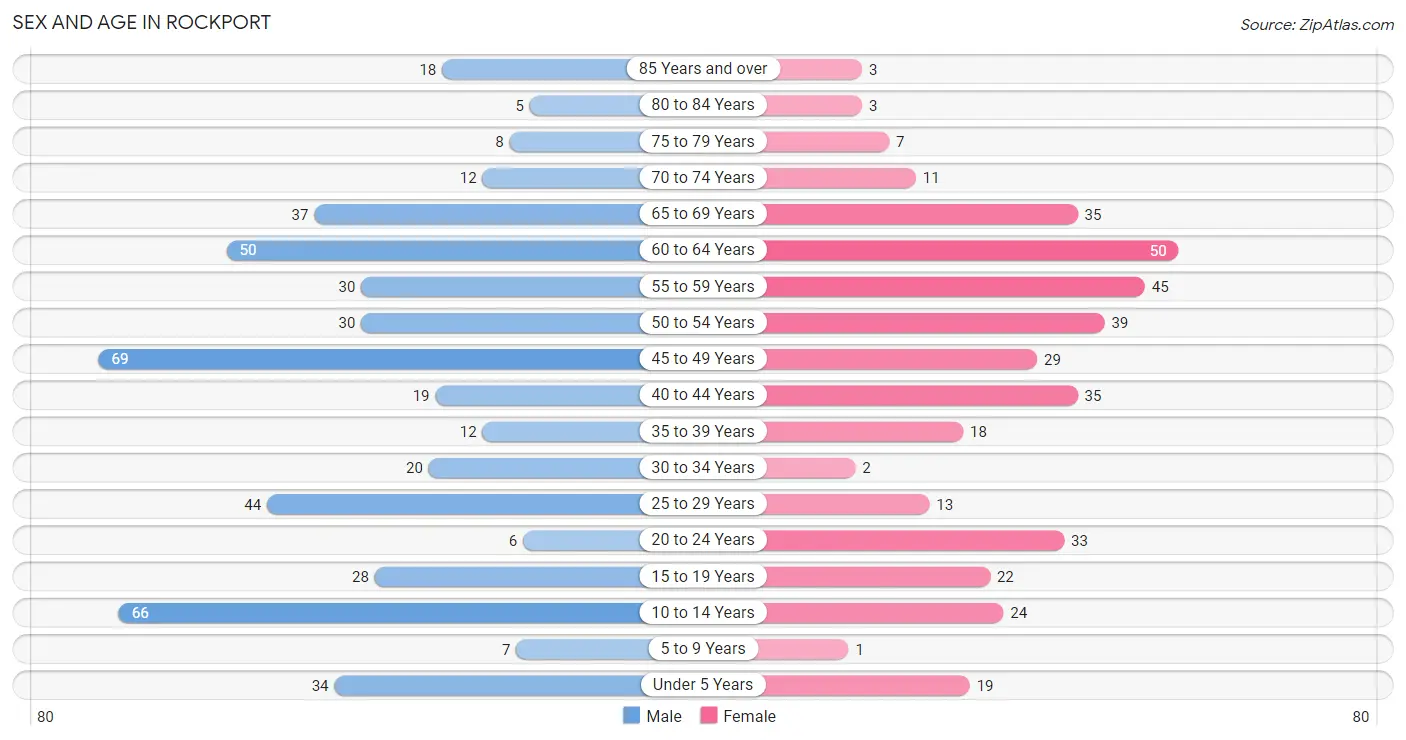
| Age Bracket | Male | Female |
| Under 5 Years | 34 (6.9%) | 19 (4.9%) |
| 5 to 9 Years | 7 (1.4%) | 1 (0.3%) |
| 10 to 14 Years | 66 (13.3%) | 24 (6.2%) |
| 15 to 19 Years | 28 (5.7%) | 22 (5.7%) |
| 20 to 24 Years | 6 (1.2%) | 33 (8.5%) |
| 25 to 29 Years | 44 (8.9%) | 13 (3.3%) |
| 30 to 34 Years | 20 (4.0%) | 2 (0.5%) |
| 35 to 39 Years | 12 (2.4%) | 18 (4.6%) |
| 40 to 44 Years | 19 (3.8%) | 35 (9.0%) |
| 45 to 49 Years | 69 (13.9%) | 29 (7.5%) |
| 50 to 54 Years | 30 (6.1%) | 39 (10.0%) |
| 55 to 59 Years | 30 (6.1%) | 45 (11.6%) |
| 60 to 64 Years | 50 (10.1%) | 50 (12.9%) |
| 65 to 69 Years | 37 (7.5%) | 35 (9.0%) |
| 70 to 74 Years | 12 (2.4%) | 11 (2.8%) |
| 75 to 79 Years | 8 (1.6%) | 7 (1.8%) |
| 80 to 84 Years | 5 (1.0%) | 3 (0.8%) |
| 85 Years and over | 18 (3.6%) | 3 (0.8%) |
| Total | 495 (100.0%) | 389 (100.0%) |
Families and Households in Rockport
Median Family Size in Rockport
The median family size in Rockport is 3.06 persons per family, with single female/mother families (30 | 12.0%) accounting for the largest median family size of 3.33 persons per family. On the other hand, single male/father families (38 | 15.3%) represent the smallest median family size with 2.18 persons per family.
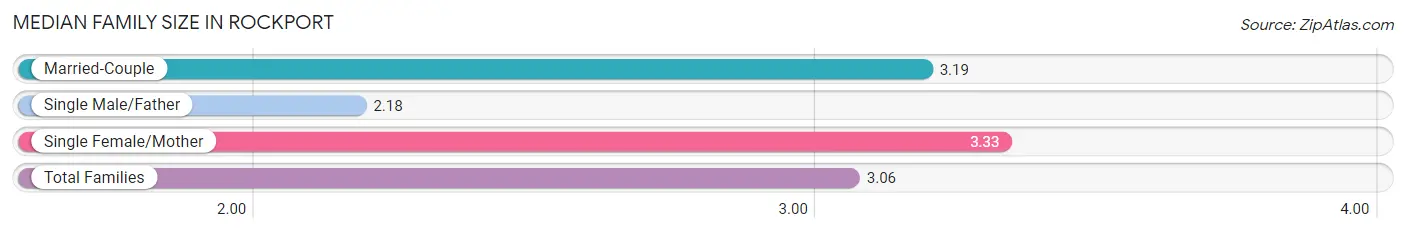
| Family Type | # Families | Family Size |
| Married-Couple | 181 (72.7%) | 3.19 |
| Single Male/Father | 38 (15.3%) | 2.18 |
| Single Female/Mother | 30 (12.0%) | 3.33 |
| Total Families | 249 (100.0%) | 3.06 |
Median Household Size in Rockport
The median household size in Rockport is 2.79 persons per household, with single female/mother households (30 | 9.5%) accounting for the largest median household size of 4.03 persons per household. non-family households (68 | 21.4%) represent the smallest median household size with 1.41 persons per household.
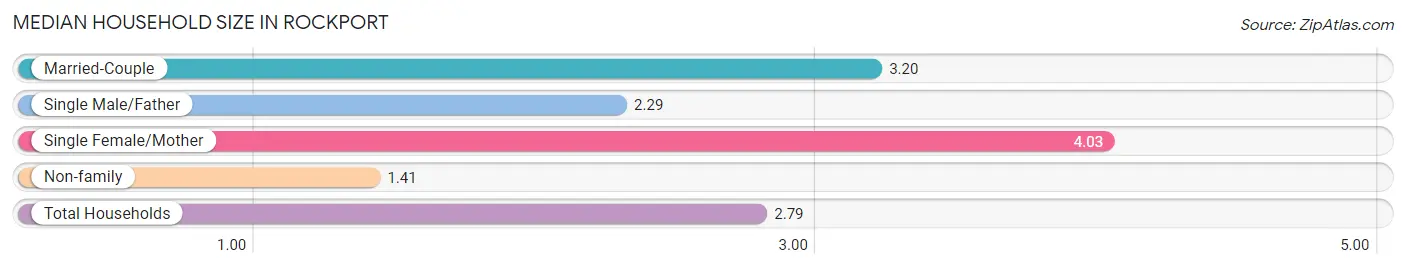
| Household Type | # Households | Household Size |
| Married-Couple | 181 (57.1%) | 3.20 |
| Single Male/Father | 38 (12.0%) | 2.29 |
| Single Female/Mother | 30 (9.5%) | 4.03 |
| Non-family | 68 (21.4%) | 1.41 |
| Total Households | 317 (100.0%) | 2.79 |
Household Size by Marriage Status in Rockport
Out of a total of 317 households in Rockport, 249 (78.5%) are family households, while 68 (21.4%) are nonfamily households. The most numerous type of family households are 2-person households, comprising 176, and the most common type of nonfamily households are 1-person households, comprising 55.
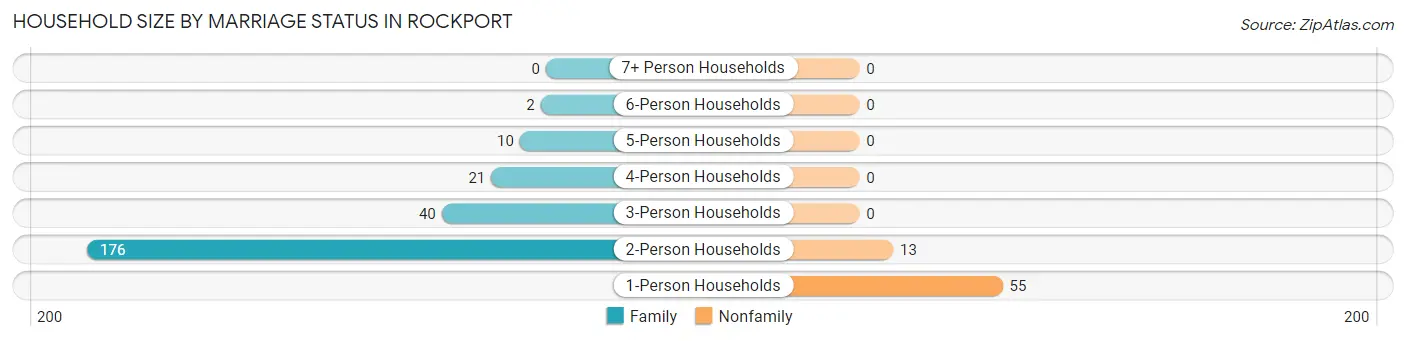
| Household Size | Family Households | Nonfamily Households |
| 1-Person Households | - | 55 (17.3%) |
| 2-Person Households | 176 (55.5%) | 13 (4.1%) |
| 3-Person Households | 40 (12.6%) | 0 (0.0%) |
| 4-Person Households | 21 (6.6%) | 0 (0.0%) |
| 5-Person Households | 10 (3.2%) | 0 (0.0%) |
| 6-Person Households | 2 (0.6%) | 0 (0.0%) |
| 7+ Person Households | 0 (0.0%) | 0 (0.0%) |
| Total | 249 (78.5%) | 68 (21.4%) |
Female Fertility in Rockport
Fertility by Age in Rockport
Average fertility rate in Rockport is 13.0 births per 1,000 women. Women in the age bracket of 35 to 50 years have the highest fertility rate with 22.0 births per 1,000 women. Women in the age bracket of 35 to 50 years acount for 100.0% of all women with births.
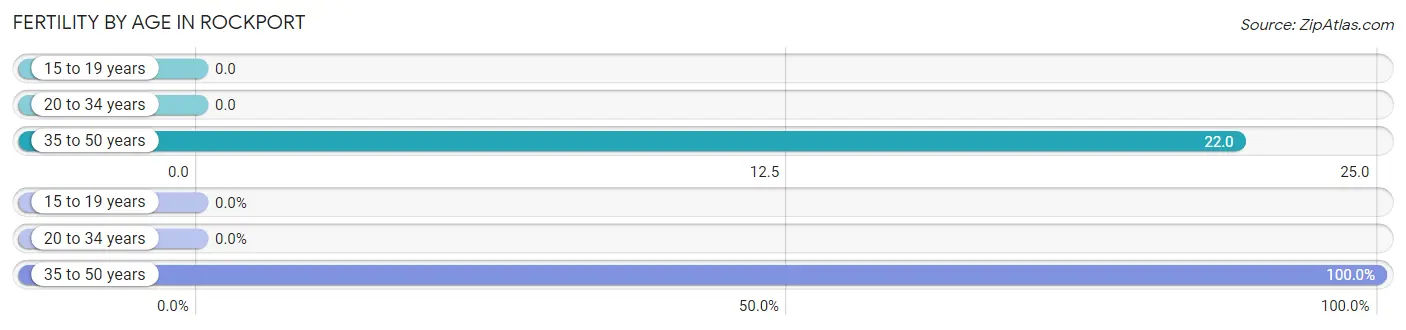
| Age Bracket | Women with Births | Births / 1,000 Women |
| 15 to 19 years | 0 (0.0%) | 0.0 |
| 20 to 34 years | 0 (0.0%) | 0.0 |
| 35 to 50 years | 2 (100.0%) | 22.0 |
| Total | 2 (100.0%) | 13.0 |
Fertility by Age by Marriage Status in Rockport
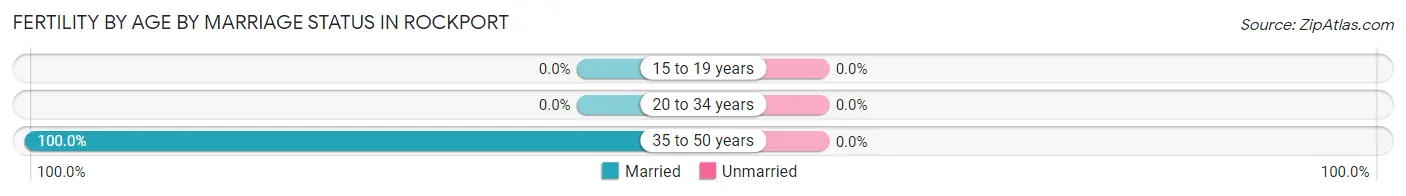
| Age Bracket | Married | Unmarried |
| 15 to 19 years | 0 (0.0%) | 0 (0.0%) |
| 20 to 34 years | 0 (0.0%) | 0 (0.0%) |
| 35 to 50 years | 2 (100.0%) | 0 (0.0%) |
| Total | 2 (100.0%) | 0 (0.0%) |
Fertility by Education in Rockport
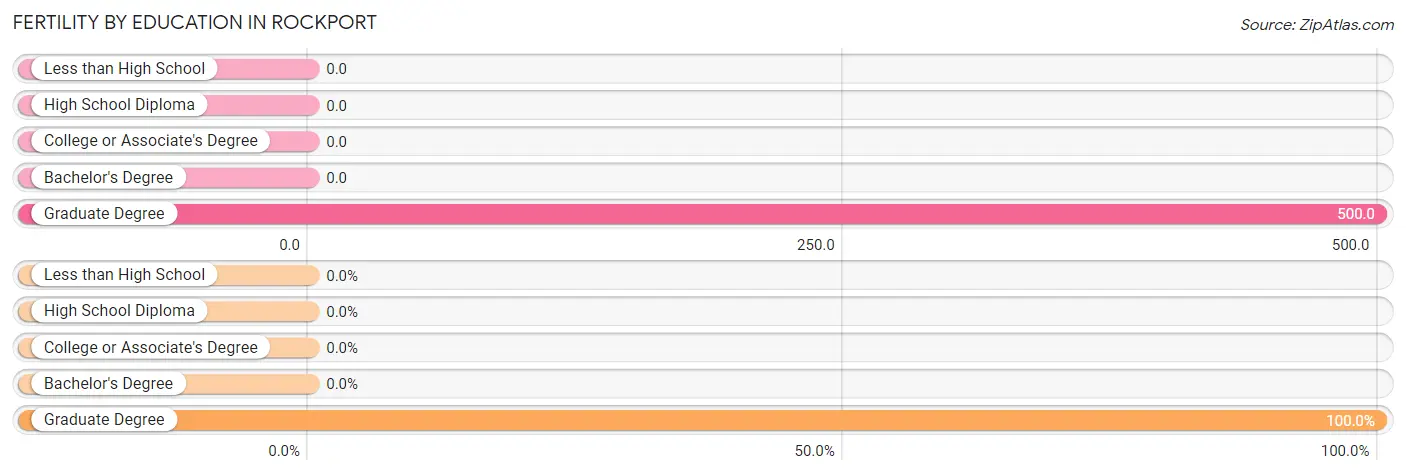
| Educational Attainment | Women with Births | Births / 1,000 Women |
| Less than High School | 0 (0.0%) | 0.0 |
| High School Diploma | 0 (0.0%) | 0.0 |
| College or Associate's Degree | 0 (0.0%) | 0.0 |
| Bachelor's Degree | 0 (0.0%) | 0.0 |
| Graduate Degree | 2 (100.0%) | 500.0 |
| Total | 2 (100.0%) | 13.0 |
Fertility by Education by Marriage Status in Rockport
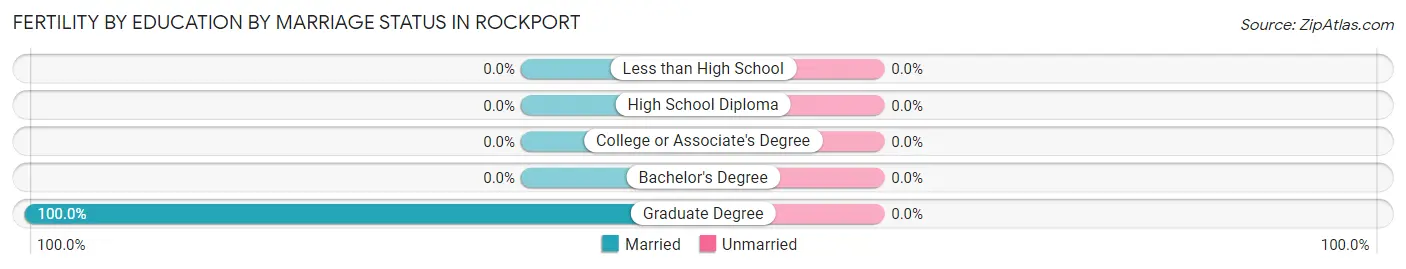
| Educational Attainment | Married | Unmarried |
| Less than High School | 0 (0.0%) | 0 (0.0%) |
| High School Diploma | 0 (0.0%) | 0 (0.0%) |
| College or Associate's Degree | 0 (0.0%) | 0 (0.0%) |
| Bachelor's Degree | 0 (0.0%) | 0 (0.0%) |
| Graduate Degree | 2 (100.0%) | 0 (0.0%) |
| Total | 2 (100.0%) | 0 (0.0%) |
Employment Characteristics in Rockport
Employment by Class of Employer in Rockport
Among the 378 employed individuals in Rockport, private company employees (269 | 71.2%), not-for-profit organizations (31 | 8.2%), and self-employed (not incorporated) (23 | 6.1%) make up the most common classes of employment.
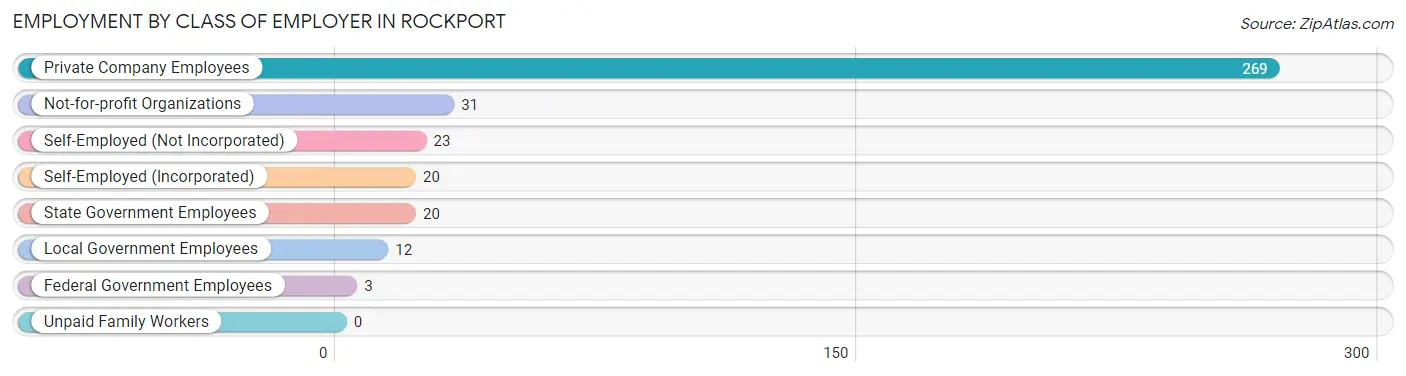
| Employer Class | # Employees | % Employees |
| Private Company Employees | 269 | 71.2% |
| Self-Employed (Incorporated) | 20 | 5.3% |
| Self-Employed (Not Incorporated) | 23 | 6.1% |
| Not-for-profit Organizations | 31 | 8.2% |
| Local Government Employees | 12 | 3.2% |
| State Government Employees | 20 | 5.3% |
| Federal Government Employees | 3 | 0.8% |
| Unpaid Family Workers | 0 | 0.0% |
| Total | 378 | 100.0% |
Employment Status by Age in Rockport
According to the labor force statistics for Rockport, out of the total population over 16 years of age (715), 53.6% or 383 individuals are in the labor force, with 1.3% or 5 of them unemployed. The age group with the highest labor force participation rate is 30 to 34 years, with 100.0% or 22 individuals in the labor force. Within the labor force, the 16 to 19 years age range has the highest percentage of unemployed individuals, with 27.3% or 3 of them being unemployed.
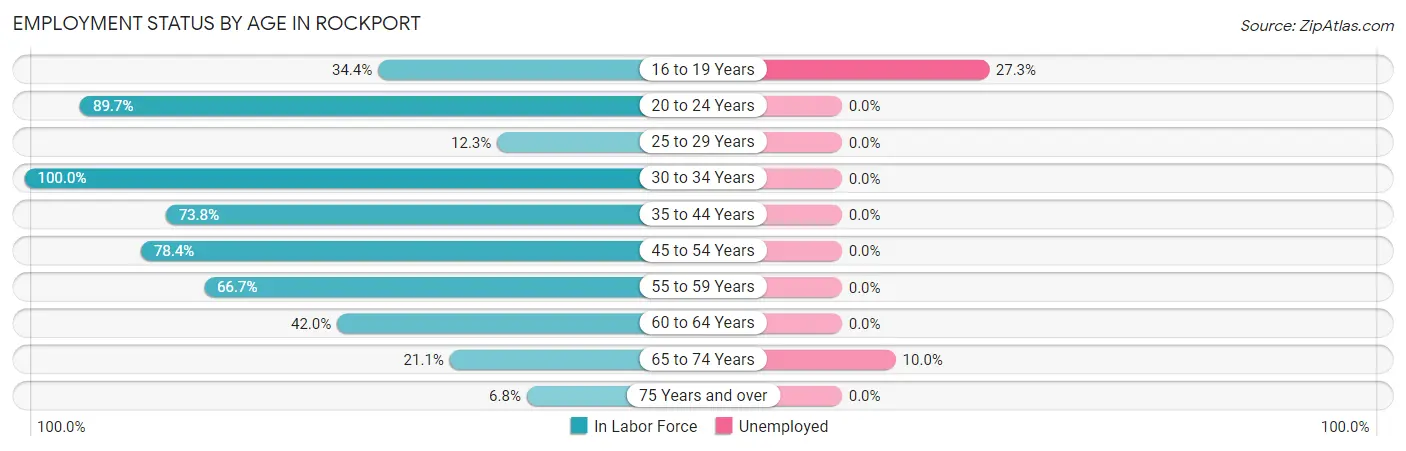
| Age Bracket | In Labor Force | Unemployed |
| 16 to 19 Years | 11 (34.4%) | 3 (27.3%) |
| 20 to 24 Years | 35 (89.7%) | 0 (0.0%) |
| 25 to 29 Years | 7 (12.3%) | 0 (0.0%) |
| 30 to 34 Years | 22 (100.0%) | 0 (0.0%) |
| 35 to 44 Years | 62 (73.8%) | 0 (0.0%) |
| 45 to 54 Years | 131 (78.4%) | 0 (0.0%) |
| 55 to 59 Years | 50 (66.7%) | 0 (0.0%) |
| 60 to 64 Years | 42 (42.0%) | 0 (0.0%) |
| 65 to 74 Years | 20 (21.1%) | 2 (10.0%) |
| 75 Years and over | 3 (6.8%) | 0 (0.0%) |
| Total | 383 (53.6%) | 5 (1.3%) |
Employment Status by Educational Attainment in Rockport
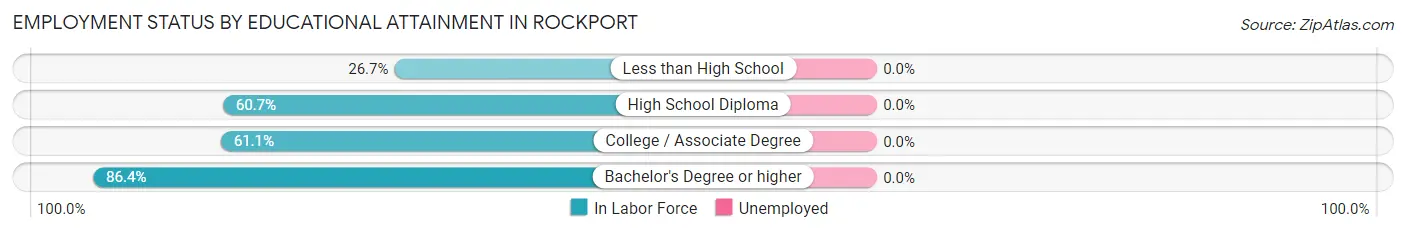
| Educational Attainment | In Labor Force | Unemployed |
| Less than High School | 8 (26.7%) | 0 (0.0%) |
| High School Diploma | 128 (60.7%) | 0 (0.0%) |
| College / Associate Degree | 121 (61.1%) | 0 (0.0%) |
| Bachelor's Degree or higher | 57 (86.4%) | 0 (0.0%) |
| Total | 314 (62.2%) | 0 (0.0%) |
Employment Occupations by Sex in Rockport
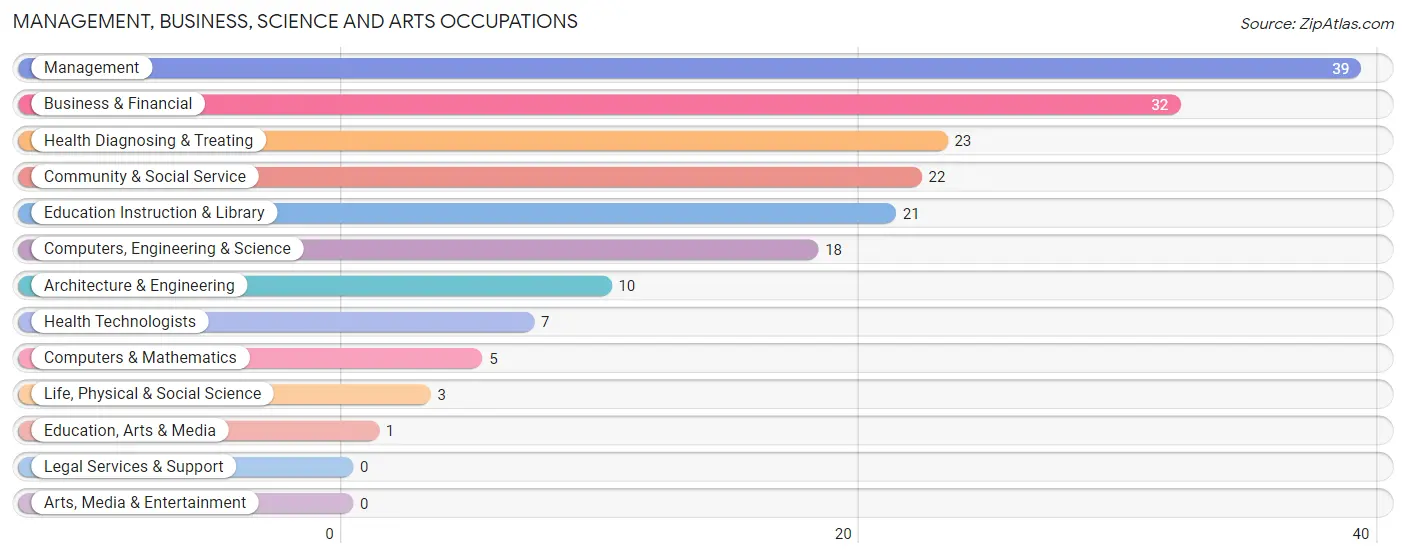
Management, Business, Science and Arts Occupations
The most common Management, Business, Science and Arts occupations in Rockport are Management (39 | 10.3%), Business & Financial (32 | 8.5%), Health Diagnosing & Treating (23 | 6.1%), Community & Social Service (22 | 5.8%), and Education Instruction & Library (21 | 5.6%).
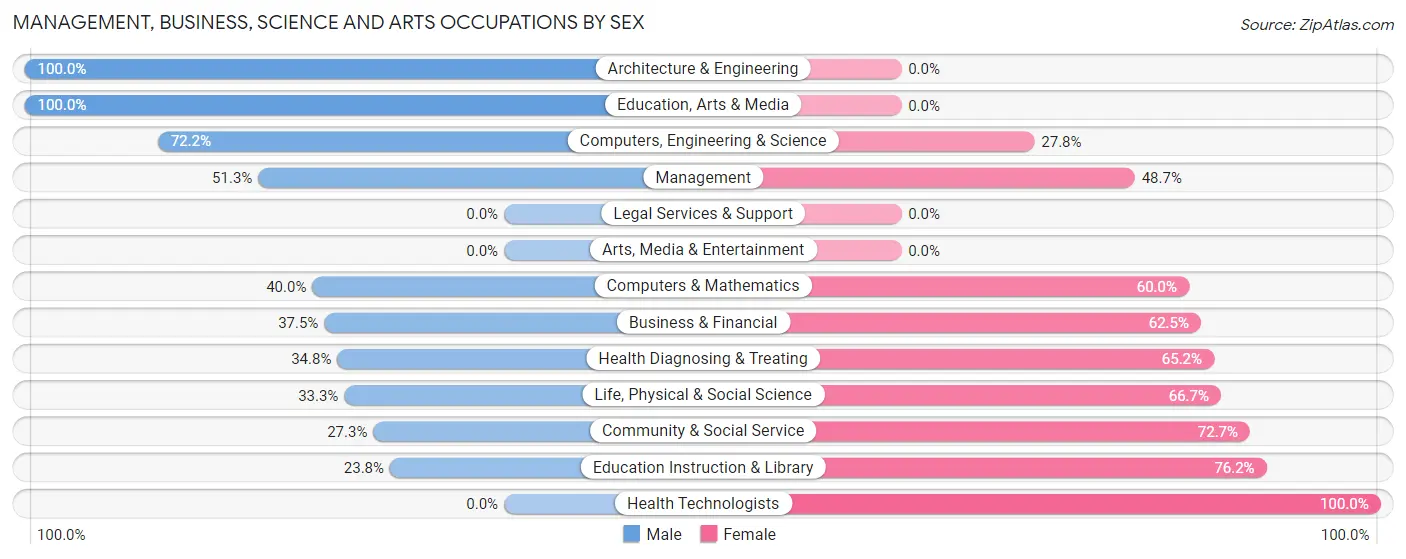
Management, Business, Science and Arts Occupations by Sex
Within the Management, Business, Science and Arts occupations in Rockport, the most male-oriented occupations are Architecture & Engineering (100.0%), Education, Arts & Media (100.0%), and Computers, Engineering & Science (72.2%), while the most female-oriented occupations are Health Technologists (100.0%), Education Instruction & Library (76.2%), and Community & Social Service (72.7%).
| Occupation | Male | Female |
| Management | 20 (51.3%) | 19 (48.7%) |
| Business & Financial | 12 (37.5%) | 20 (62.5%) |
| Computers, Engineering & Science | 13 (72.2%) | 5 (27.8%) |
| Computers & Mathematics | 2 (40.0%) | 3 (60.0%) |
| Architecture & Engineering | 10 (100.0%) | 0 (0.0%) |
| Life, Physical & Social Science | 1 (33.3%) | 2 (66.7%) |
| Community & Social Service | 6 (27.3%) | 16 (72.7%) |
| Education, Arts & Media | 1 (100.0%) | 0 (0.0%) |
| Legal Services & Support | 0 (0.0%) | 0 (0.0%) |
| Education Instruction & Library | 5 (23.8%) | 16 (76.2%) |
| Arts, Media & Entertainment | 0 (0.0%) | 0 (0.0%) |
| Health Diagnosing & Treating | 8 (34.8%) | 15 (65.2%) |
| Health Technologists | 0 (0.0%) | 7 (100.0%) |
| Total (Category) | 59 (44.0%) | 75 (56.0%) |
| Total (Overall) | 203 (53.7%) | 175 (46.3%) |
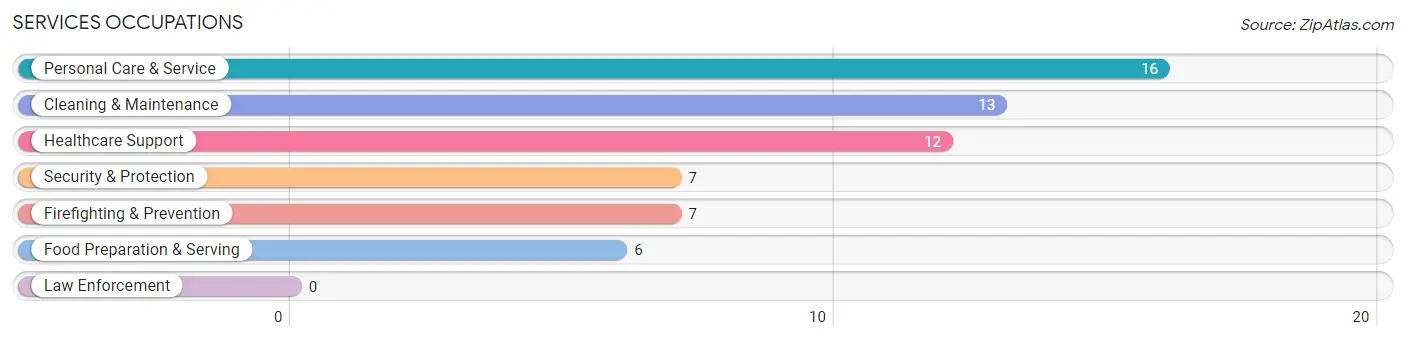
Services Occupations
The most common Services occupations in Rockport are Personal Care & Service (16 | 4.2%), Cleaning & Maintenance (13 | 3.4%), Healthcare Support (12 | 3.2%), Security & Protection (7 | 1.8%), and Firefighting & Prevention (7 | 1.8%).
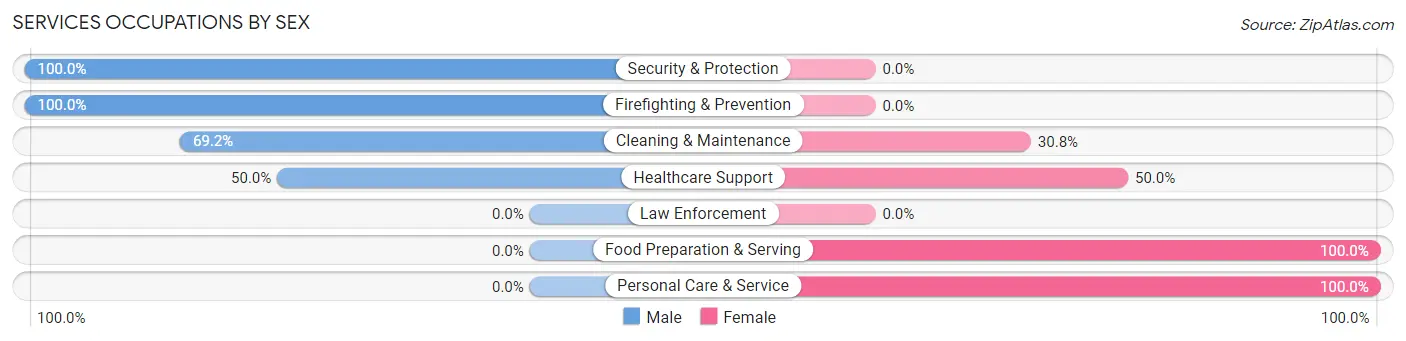
Services Occupations by Sex
Within the Services occupations in Rockport, the most male-oriented occupations are Security & Protection (100.0%), Firefighting & Prevention (100.0%), and Cleaning & Maintenance (69.2%), while the most female-oriented occupations are Food Preparation & Serving (100.0%), Personal Care & Service (100.0%), and Healthcare Support (50.0%).
| Occupation | Male | Female |
| Healthcare Support | 6 (50.0%) | 6 (50.0%) |
| Security & Protection | 7 (100.0%) | 0 (0.0%) |
| Firefighting & Prevention | 7 (100.0%) | 0 (0.0%) |
| Law Enforcement | 0 (0.0%) | 0 (0.0%) |
| Food Preparation & Serving | 0 (0.0%) | 6 (100.0%) |
| Cleaning & Maintenance | 9 (69.2%) | 4 (30.8%) |
| Personal Care & Service | 0 (0.0%) | 16 (100.0%) |
| Total (Category) | 22 (40.7%) | 32 (59.3%) |
| Total (Overall) | 203 (53.7%) | 175 (46.3%) |
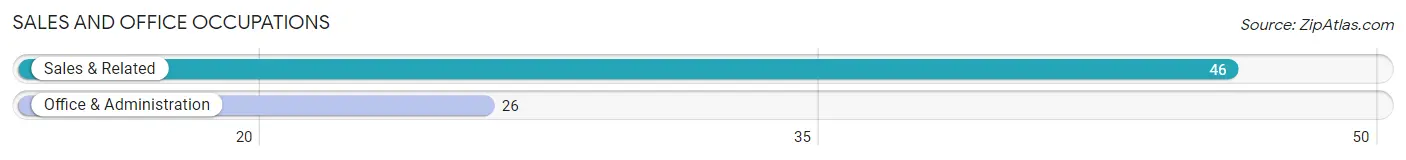
Sales and Office Occupations
The most common Sales and Office occupations in Rockport are Sales & Related (46 | 12.2%), and Office & Administration (26 | 6.9%).
Sales and Office Occupations by Sex
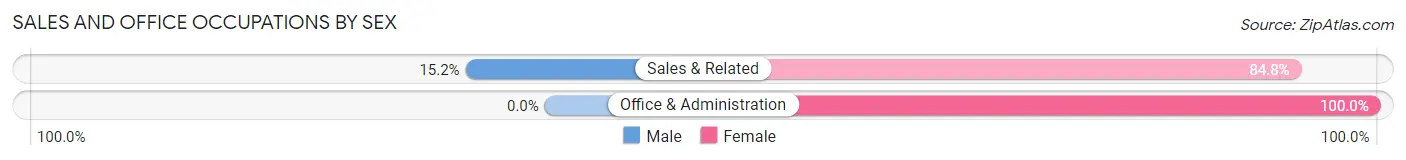
| Occupation | Male | Female |
| Sales & Related | 7 (15.2%) | 39 (84.8%) |
| Office & Administration | 0 (0.0%) | 26 (100.0%) |
| Total (Category) | 7 (9.7%) | 65 (90.3%) |
| Total (Overall) | 203 (53.7%) | 175 (46.3%) |
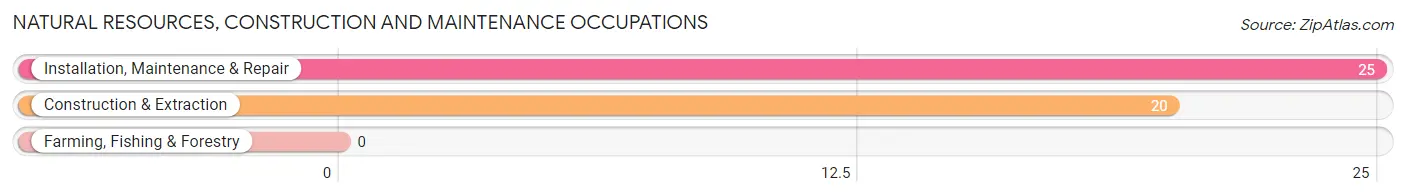
Natural Resources, Construction and Maintenance Occupations
The most common Natural Resources, Construction and Maintenance occupations in Rockport are Installation, Maintenance & Repair (25 | 6.6%), and Construction & Extraction (20 | 5.3%).
Natural Resources, Construction and Maintenance Occupations by Sex
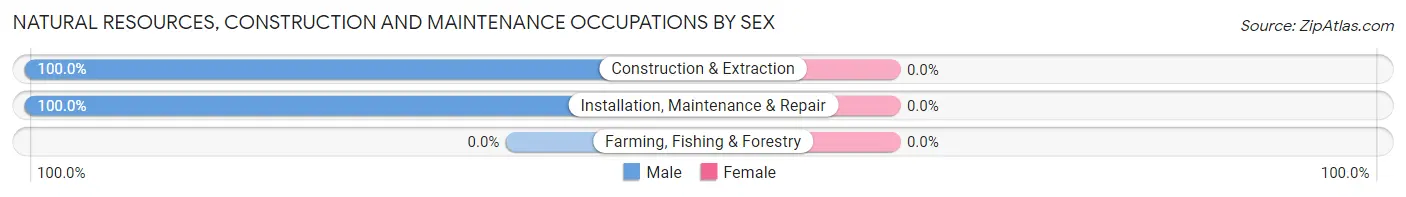
| Occupation | Male | Female |
| Farming, Fishing & Forestry | 0 (0.0%) | 0 (0.0%) |
| Construction & Extraction | 20 (100.0%) | 0 (0.0%) |
| Installation, Maintenance & Repair | 25 (100.0%) | 0 (0.0%) |
| Total (Category) | 45 (100.0%) | 0 (0.0%) |
| Total (Overall) | 203 (53.7%) | 175 (46.3%) |
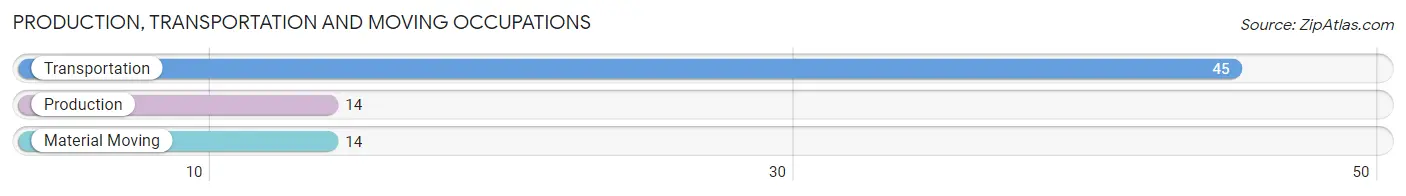
Production, Transportation and Moving Occupations
The most common Production, Transportation and Moving occupations in Rockport are Transportation (45 | 11.9%), Production (14 | 3.7%), and Material Moving (14 | 3.7%).
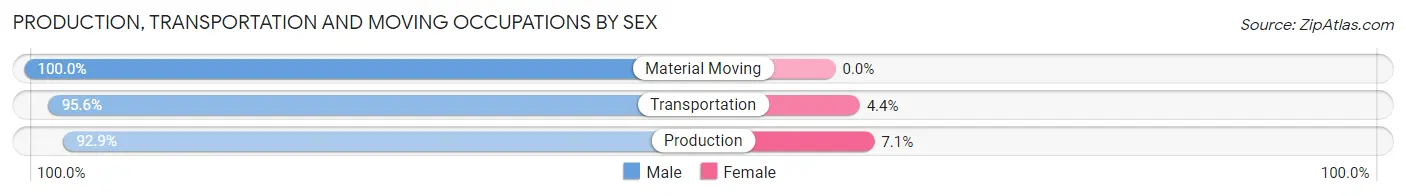
Production, Transportation and Moving Occupations by Sex
| Occupation | Male | Female |
| Production | 13 (92.9%) | 1 (7.1%) |
| Transportation | 43 (95.6%) | 2 (4.4%) |
| Material Moving | 14 (100.0%) | 0 (0.0%) |
| Total (Category) | 70 (95.9%) | 3 (4.1%) |
| Total (Overall) | 203 (53.7%) | 175 (46.3%) |
Employment Industries by Sex in Rockport
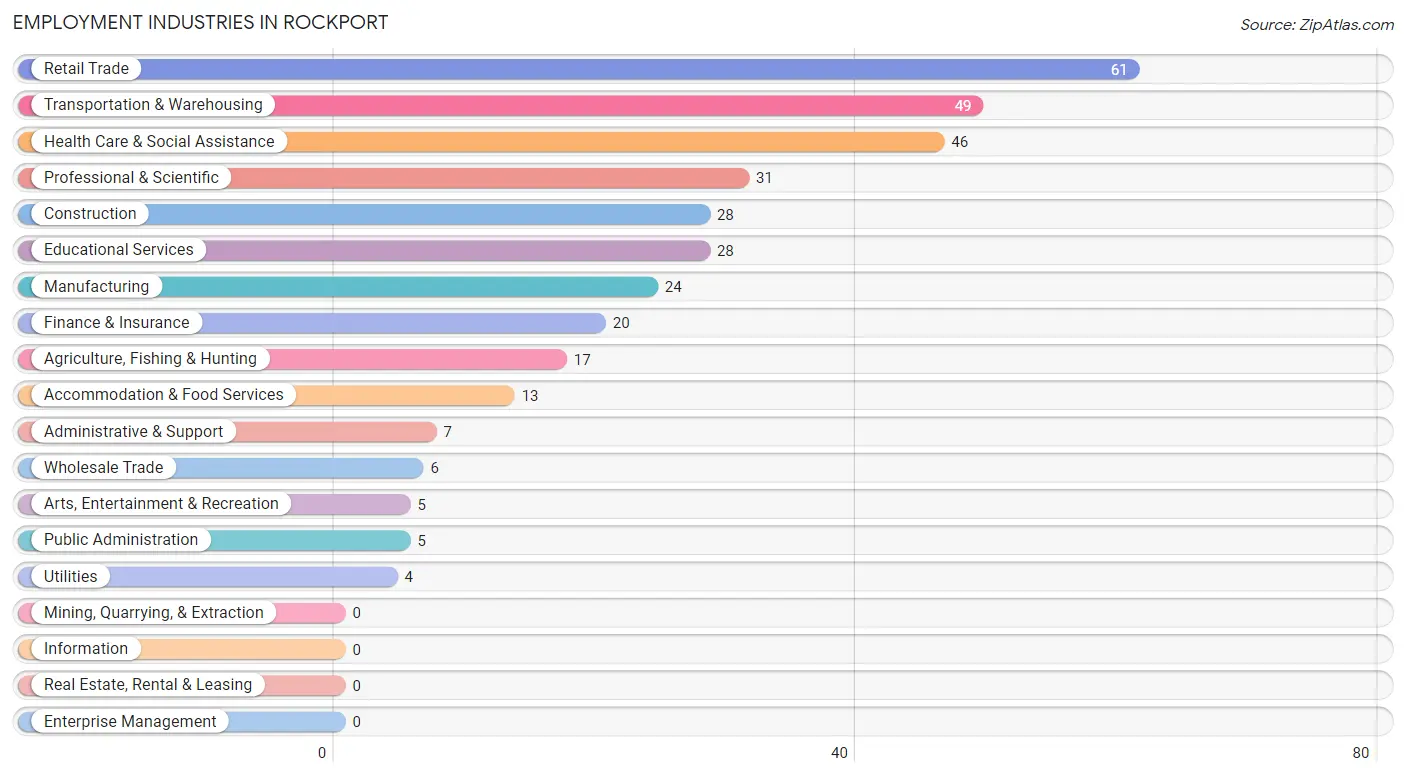
Employment Industries in Rockport
The major employment industries in Rockport include Retail Trade (61 | 16.1%), Transportation & Warehousing (49 | 13.0%), Health Care & Social Assistance (46 | 12.2%), Professional & Scientific (31 | 8.2%), and Construction (28 | 7.4%).
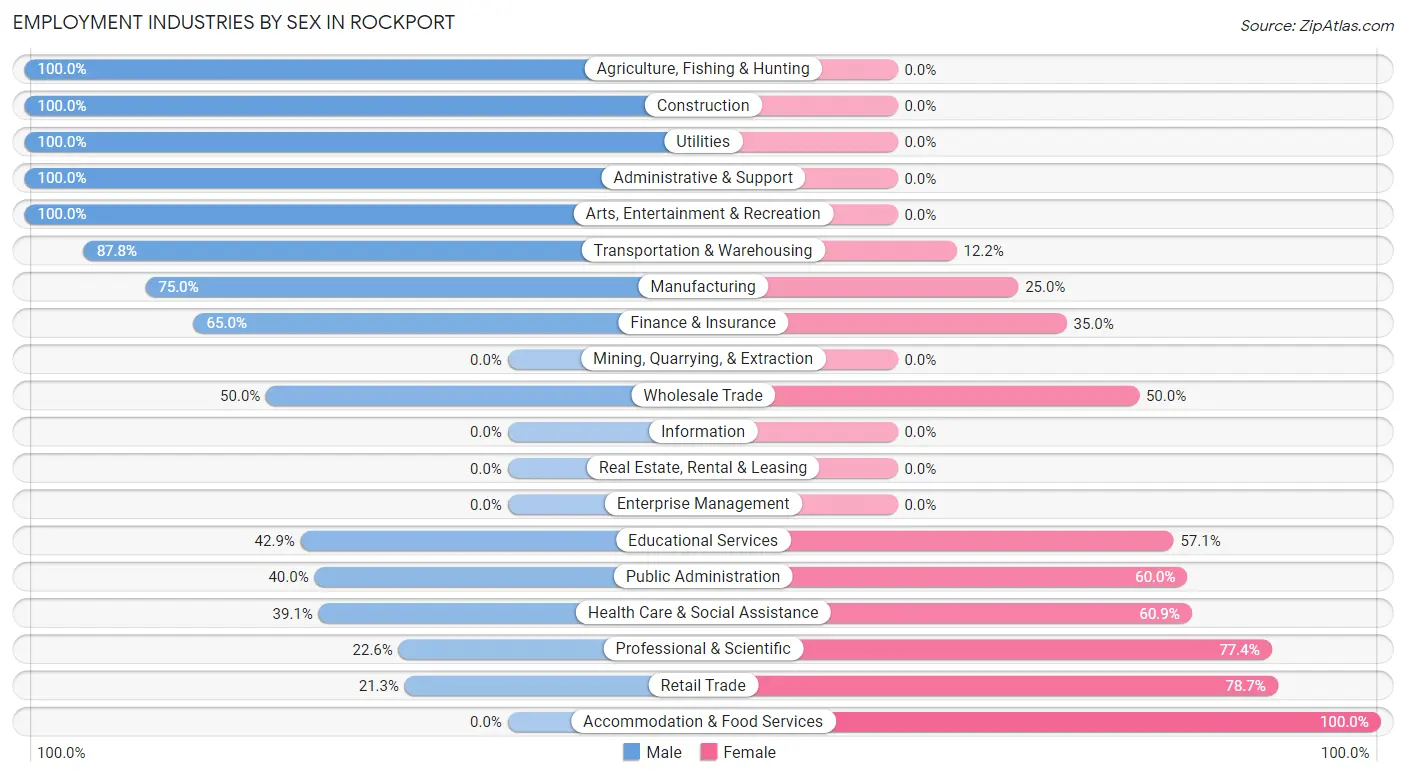
Employment Industries by Sex in Rockport
The Rockport industries that see more men than women are Agriculture, Fishing & Hunting (100.0%), Construction (100.0%), and Utilities (100.0%), whereas the industries that tend to have a higher number of women are Accommodation & Food Services (100.0%), Retail Trade (78.7%), and Professional & Scientific (77.4%).
| Industry | Male | Female |
| Agriculture, Fishing & Hunting | 17 (100.0%) | 0 (0.0%) |
| Mining, Quarrying, & Extraction | 0 (0.0%) | 0 (0.0%) |
| Construction | 28 (100.0%) | 0 (0.0%) |
| Manufacturing | 18 (75.0%) | 6 (25.0%) |
| Wholesale Trade | 3 (50.0%) | 3 (50.0%) |
| Retail Trade | 13 (21.3%) | 48 (78.7%) |
| Transportation & Warehousing | 43 (87.8%) | 6 (12.2%) |
| Utilities | 4 (100.0%) | 0 (0.0%) |
| Information | 0 (0.0%) | 0 (0.0%) |
| Finance & Insurance | 13 (65.0%) | 7 (35.0%) |
| Real Estate, Rental & Leasing | 0 (0.0%) | 0 (0.0%) |
| Professional & Scientific | 7 (22.6%) | 24 (77.4%) |
| Enterprise Management | 0 (0.0%) | 0 (0.0%) |
| Administrative & Support | 7 (100.0%) | 0 (0.0%) |
| Educational Services | 12 (42.9%) | 16 (57.1%) |
| Health Care & Social Assistance | 18 (39.1%) | 28 (60.9%) |
| Arts, Entertainment & Recreation | 5 (100.0%) | 0 (0.0%) |
| Accommodation & Food Services | 0 (0.0%) | 13 (100.0%) |
| Public Administration | 2 (40.0%) | 3 (60.0%) |
| Total | 203 (53.7%) | 175 (46.3%) |
Education in Rockport
School Enrollment in Rockport
The most common levels of schooling among the 146 students in Rockport are middle school (78 | 53.4%), high school (35 | 24.0%), and elementary school (20 | 13.7%).
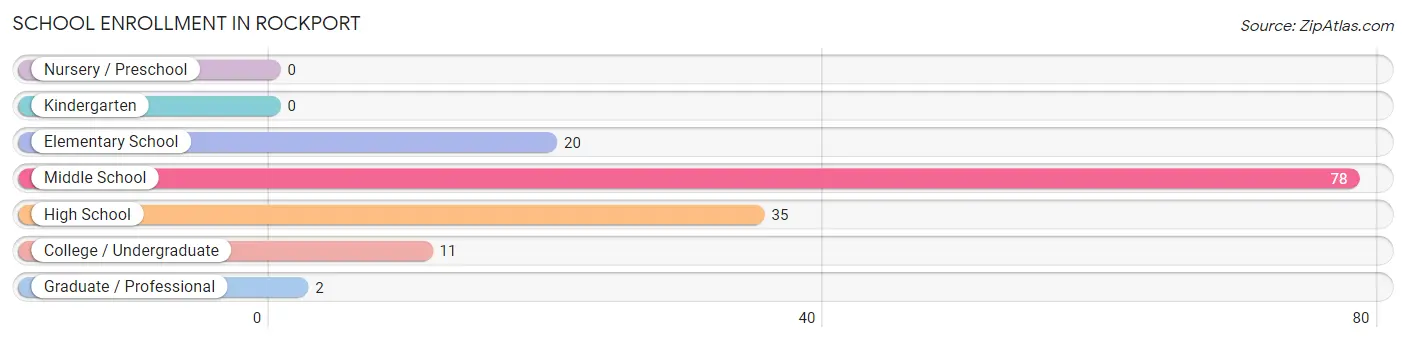
| School Level | # Students | % Students |
| Nursery / Preschool | 0 | 0.0% |
| Kindergarten | 0 | 0.0% |
| Elementary School | 20 | 13.7% |
| Middle School | 78 | 53.4% |
| High School | 35 | 24.0% |
| College / Undergraduate | 11 | 7.5% |
| Graduate / Professional | 2 | 1.4% |
| Total | 146 | 100.0% |
School Enrollment by Age by Funding Source in Rockport
Out of a total of 146 students who are enrolled in schools in Rockport, 3 (2.1%) attend a private institution, while the remaining 143 (97.9%) are enrolled in public schools. The age group of 35 years and over has the highest likelihood of being enrolled in private schools, with 2 (28.6% in the age bracket) enrolled. Conversely, the age group of 5 to 9 year old has the lowest likelihood of being enrolled in a private school, with 8 (100.0% in the age bracket) attending a public institution.
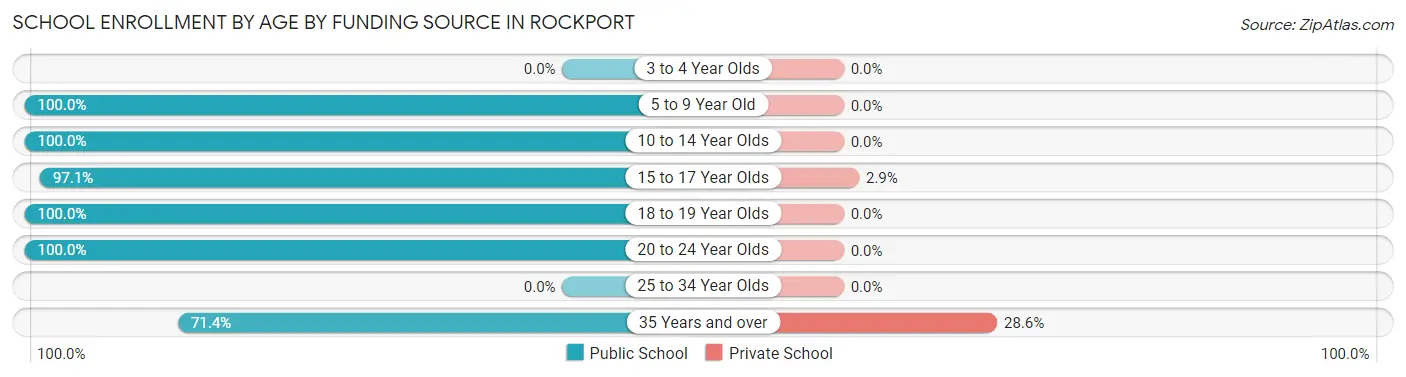
| Age Bracket | Public School | Private School |
| 3 to 4 Year Olds | 0 (0.0%) | 0 (0.0%) |
| 5 to 9 Year Old | 8 (100.0%) | 0 (0.0%) |
| 10 to 14 Year Olds | 90 (100.0%) | 0 (0.0%) |
| 15 to 17 Year Olds | 34 (97.1%) | 1 (2.9%) |
| 18 to 19 Year Olds | 4 (100.0%) | 0 (0.0%) |
| 20 to 24 Year Olds | 2 (100.0%) | 0 (0.0%) |
| 25 to 34 Year Olds | 0 (0.0%) | 0 (0.0%) |
| 35 Years and over | 5 (71.4%) | 2 (28.6%) |
| Total | 143 (97.9%) | 3 (2.1%) |
Educational Attainment by Field of Study in Rockport
Education (27 | 32.1%), arts & humanities (17 | 20.2%), business (15 | 17.9%), physical & health sciences (4 | 4.8%), and psychology (4 | 4.8%) are the most common fields of study among 84 individuals in Rockport who have obtained a bachelor's degree or higher.
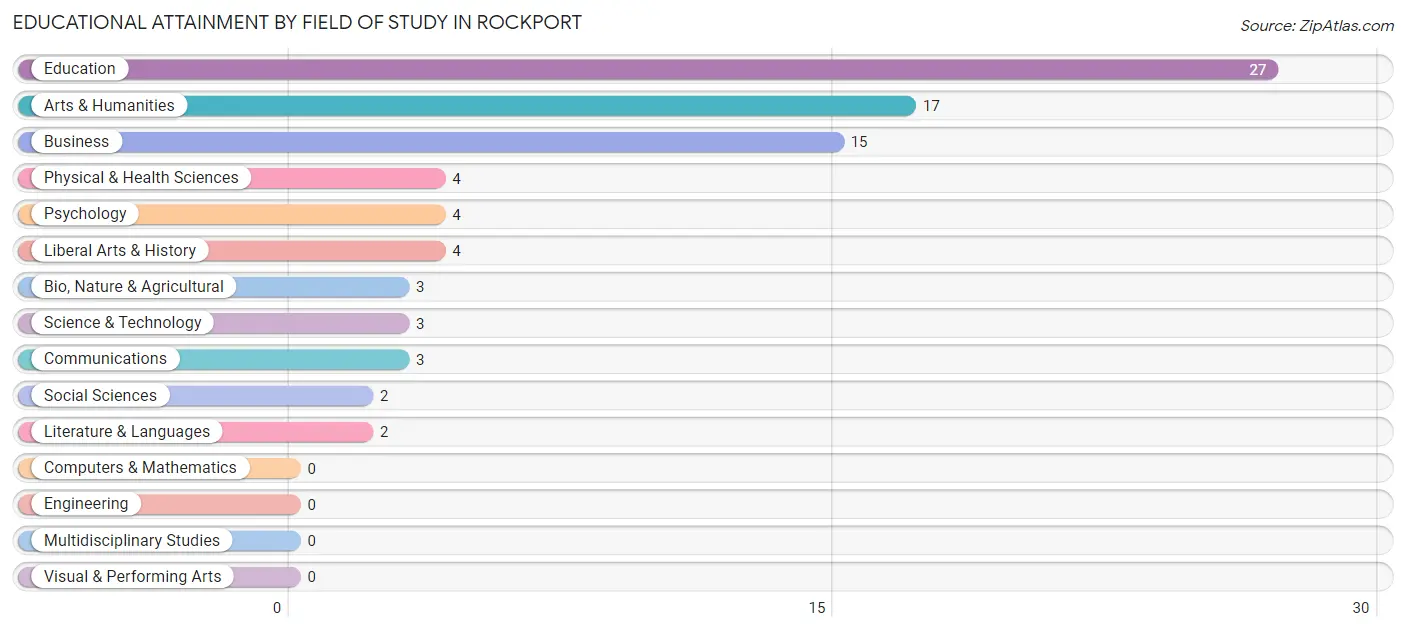
| Field of Study | # Graduates | % Graduates |
| Computers & Mathematics | 0 | 0.0% |
| Bio, Nature & Agricultural | 3 | 3.6% |
| Physical & Health Sciences | 4 | 4.8% |
| Psychology | 4 | 4.8% |
| Social Sciences | 2 | 2.4% |
| Engineering | 0 | 0.0% |
| Multidisciplinary Studies | 0 | 0.0% |
| Science & Technology | 3 | 3.6% |
| Business | 15 | 17.9% |
| Education | 27 | 32.1% |
| Literature & Languages | 2 | 2.4% |
| Liberal Arts & History | 4 | 4.8% |
| Visual & Performing Arts | 0 | 0.0% |
| Communications | 3 | 3.6% |
| Arts & Humanities | 17 | 20.2% |
| Total | 84 | 100.0% |
Transportation & Commute in Rockport
Vehicle Availability by Sex in Rockport
The most prevalent vehicle ownership categories in Rockport are males with 2 vehicles (85, accounting for 41.9%) and females with 2 vehicles (97, making up 48.6%).
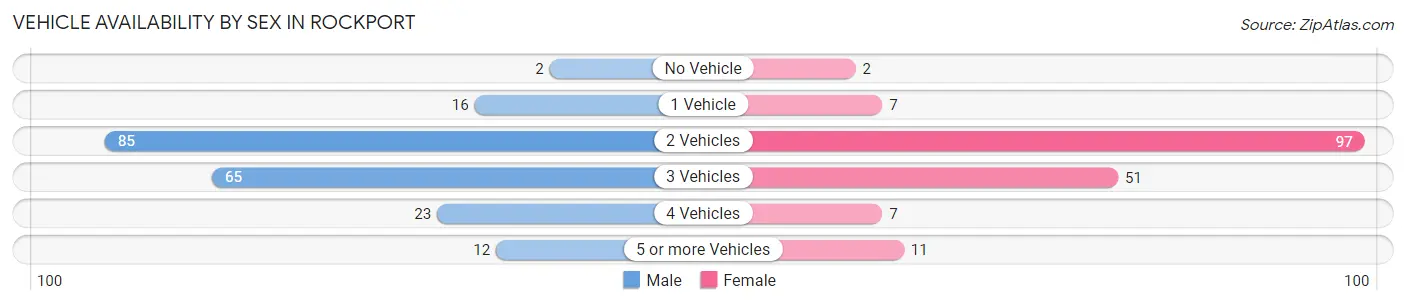
| Vehicles Available | Male | Female |
| No Vehicle | 2 (1.0%) | 2 (1.1%) |
| 1 Vehicle | 16 (7.9%) | 7 (4.0%) |
| 2 Vehicles | 85 (41.9%) | 97 (55.4%) |
| 3 Vehicles | 65 (32.0%) | 51 (29.1%) |
| 4 Vehicles | 23 (11.3%) | 7 (4.0%) |
| 5 or more Vehicles | 12 (5.9%) | 11 (6.3%) |
| Total | 203 (100.0%) | 175 (100.0%) |
Commute Time in Rockport
The most frequently occuring commute durations in Rockport are 5 to 9 minutes (76 commuters, 20.3%), 30 to 34 minutes (69 commuters, 18.4%), and 45 to 59 minutes (69 commuters, 18.4%).
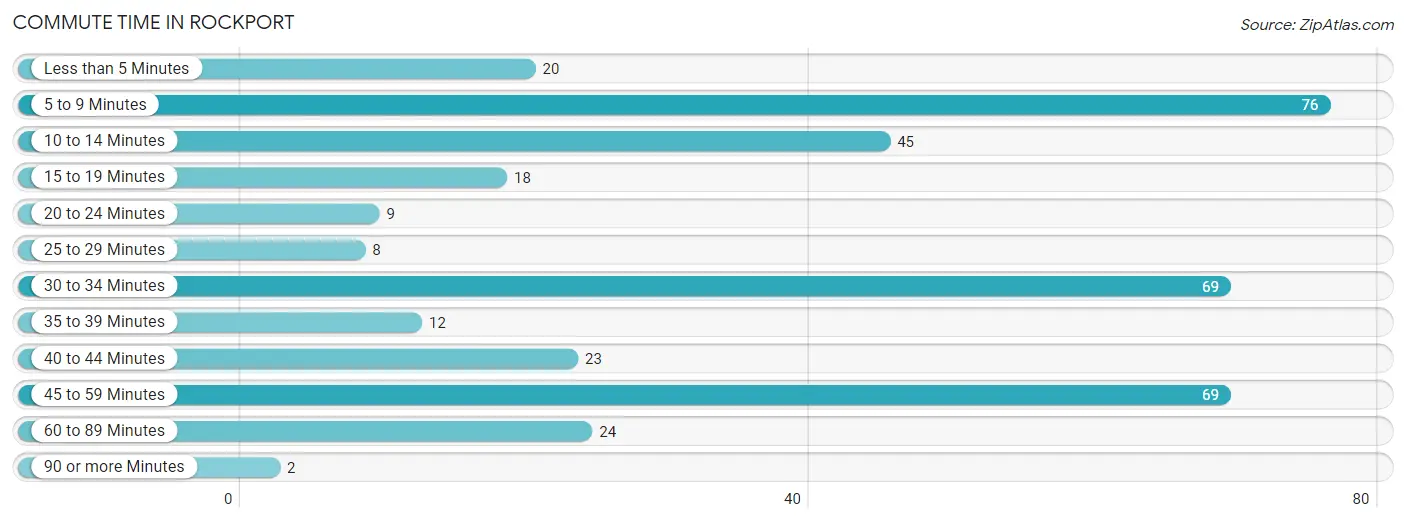
| Commute Time | # Commuters | % Commuters |
| Less than 5 Minutes | 20 | 5.3% |
| 5 to 9 Minutes | 76 | 20.3% |
| 10 to 14 Minutes | 45 | 12.0% |
| 15 to 19 Minutes | 18 | 4.8% |
| 20 to 24 Minutes | 9 | 2.4% |
| 25 to 29 Minutes | 8 | 2.1% |
| 30 to 34 Minutes | 69 | 18.4% |
| 35 to 39 Minutes | 12 | 3.2% |
| 40 to 44 Minutes | 23 | 6.1% |
| 45 to 59 Minutes | 69 | 18.4% |
| 60 to 89 Minutes | 24 | 6.4% |
| 90 or more Minutes | 2 | 0.5% |
Commute Time by Sex in Rockport
The most common commute times in Rockport are 30 to 34 minutes (50 commuters, 24.6%) for males and 5 to 9 minutes (60 commuters, 34.9%) for females.
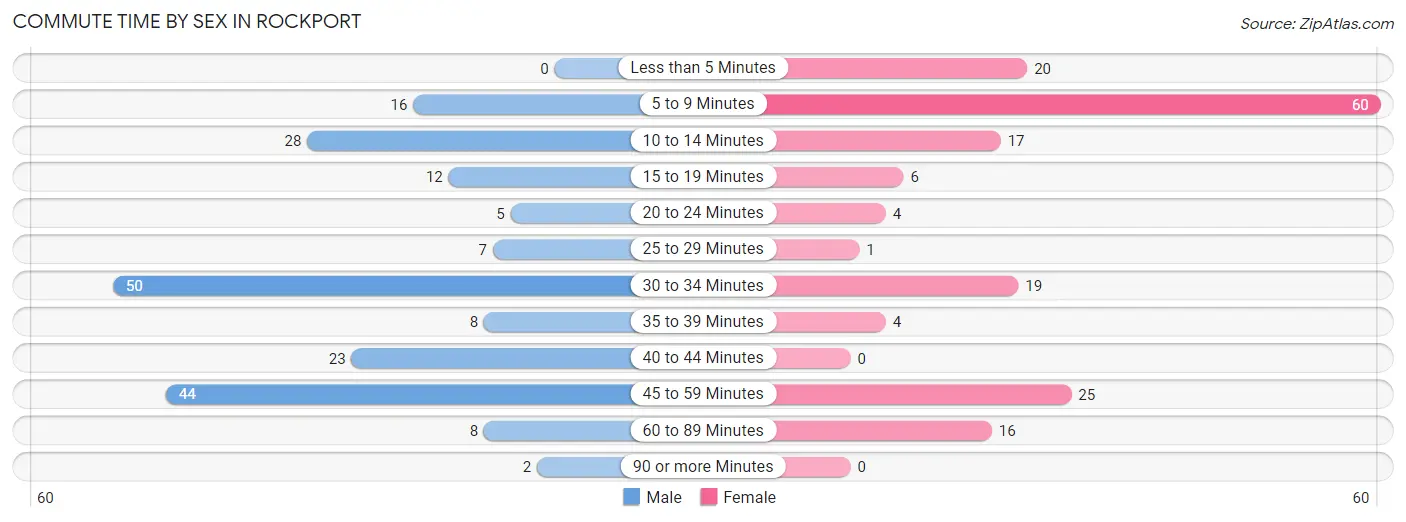
| Commute Time | Male | Female |
| Less than 5 Minutes | 0 (0.0%) | 20 (11.6%) |
| 5 to 9 Minutes | 16 (7.9%) | 60 (34.9%) |
| 10 to 14 Minutes | 28 (13.8%) | 17 (9.9%) |
| 15 to 19 Minutes | 12 (5.9%) | 6 (3.5%) |
| 20 to 24 Minutes | 5 (2.5%) | 4 (2.3%) |
| 25 to 29 Minutes | 7 (3.5%) | 1 (0.6%) |
| 30 to 34 Minutes | 50 (24.6%) | 19 (11.1%) |
| 35 to 39 Minutes | 8 (3.9%) | 4 (2.3%) |
| 40 to 44 Minutes | 23 (11.3%) | 0 (0.0%) |
| 45 to 59 Minutes | 44 (21.7%) | 25 (14.5%) |
| 60 to 89 Minutes | 8 (3.9%) | 16 (9.3%) |
| 90 or more Minutes | 2 (1.0%) | 0 (0.0%) |
Time of Departure to Work by Sex in Rockport
The most frequent times of departure to work in Rockport are 5:30 AM to 5:59 AM (47, 23.2%) for males and 12:00 PM to 3:59 PM (33, 19.2%) for females.
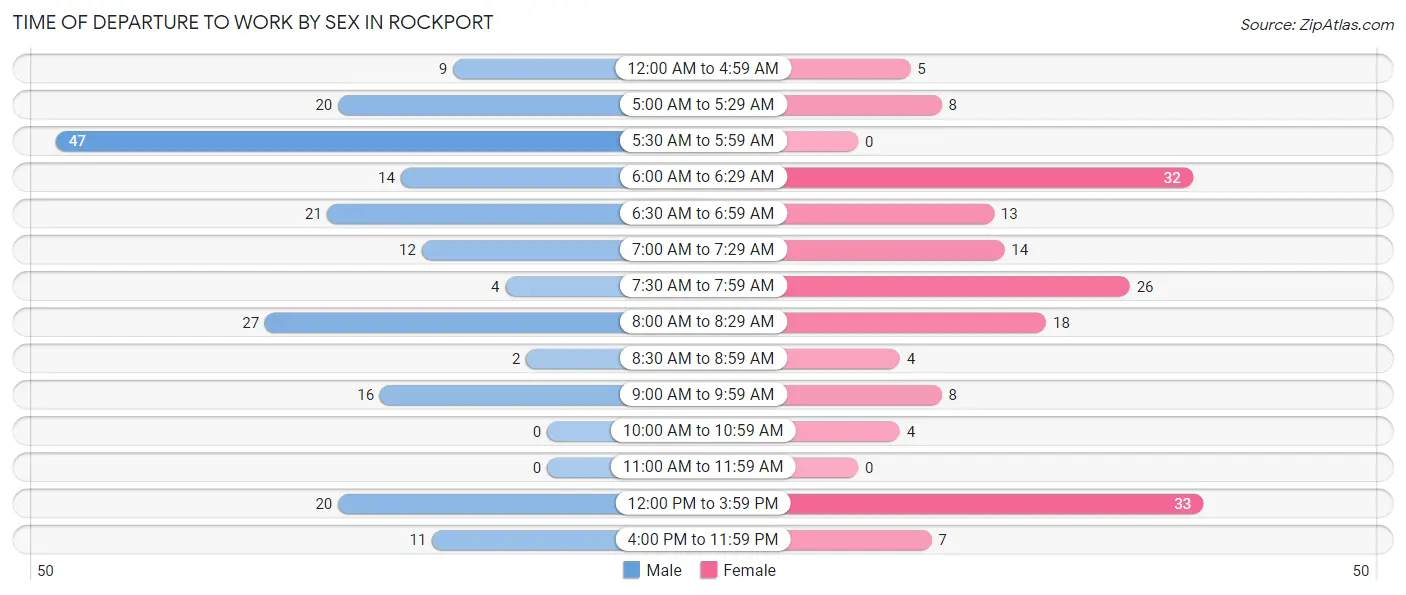
| Time of Departure | Male | Female |
| 12:00 AM to 4:59 AM | 9 (4.4%) | 5 (2.9%) |
| 5:00 AM to 5:29 AM | 20 (9.9%) | 8 (4.6%) |
| 5:30 AM to 5:59 AM | 47 (23.2%) | 0 (0.0%) |
| 6:00 AM to 6:29 AM | 14 (6.9%) | 32 (18.6%) |
| 6:30 AM to 6:59 AM | 21 (10.3%) | 13 (7.6%) |
| 7:00 AM to 7:29 AM | 12 (5.9%) | 14 (8.1%) |
| 7:30 AM to 7:59 AM | 4 (2.0%) | 26 (15.1%) |
| 8:00 AM to 8:29 AM | 27 (13.3%) | 18 (10.5%) |
| 8:30 AM to 8:59 AM | 2 (1.0%) | 4 (2.3%) |
| 9:00 AM to 9:59 AM | 16 (7.9%) | 8 (4.6%) |
| 10:00 AM to 10:59 AM | 0 (0.0%) | 4 (2.3%) |
| 11:00 AM to 11:59 AM | 0 (0.0%) | 0 (0.0%) |
| 12:00 PM to 3:59 PM | 20 (9.9%) | 33 (19.2%) |
| 4:00 PM to 11:59 PM | 11 (5.4%) | 7 (4.1%) |
| Total | 203 (100.0%) | 172 (100.0%) |
Housing Occupancy in Rockport
Occupancy by Ownership in Rockport
Of the total 317 dwellings in Rockport, owner-occupied units account for 266 (83.9%), while renter-occupied units make up 51 (16.1%).
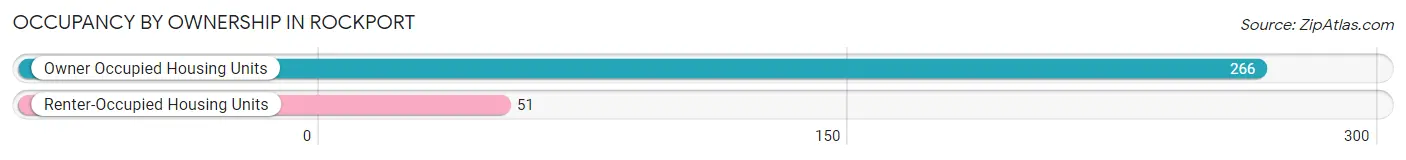
| Occupancy | # Housing Units | % Housing Units |
| Owner Occupied Housing Units | 266 | 83.9% |
| Renter-Occupied Housing Units | 51 | 16.1% |
| Total Occupied Housing Units | 317 | 100.0% |
Occupancy by Household Size in Rockport
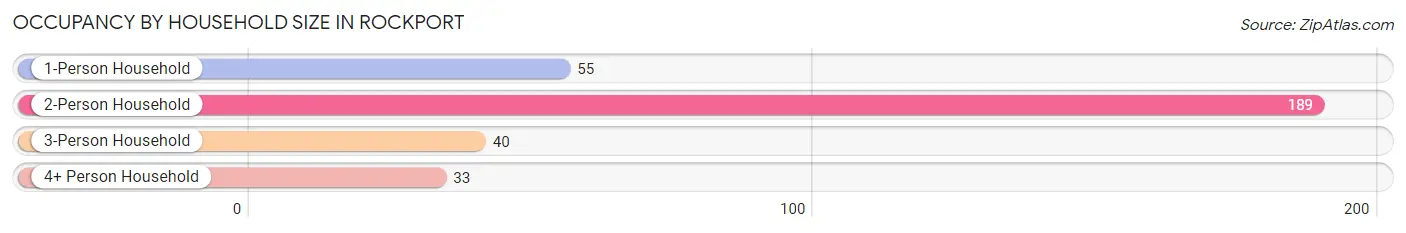
| Household Size | # Housing Units | % Housing Units |
| 1-Person Household | 55 | 17.3% |
| 2-Person Household | 189 | 59.6% |
| 3-Person Household | 40 | 12.6% |
| 4+ Person Household | 33 | 10.4% |
| Total Housing Units | 317 | 100.0% |
Occupancy by Ownership by Household Size in Rockport
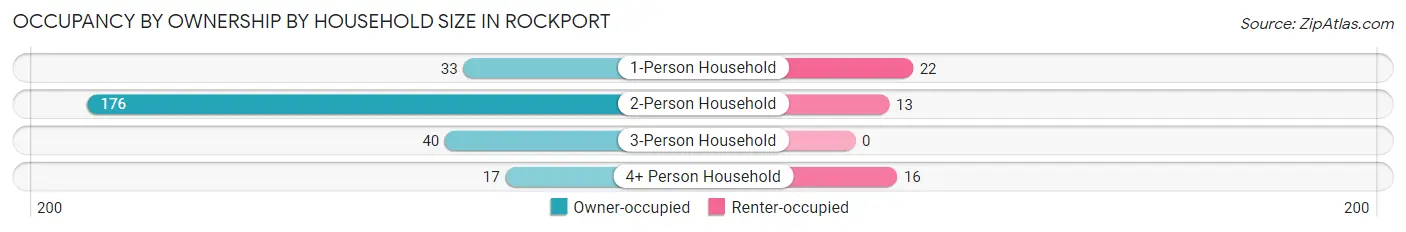
| Household Size | Owner-occupied | Renter-occupied |
| 1-Person Household | 33 (60.0%) | 22 (40.0%) |
| 2-Person Household | 176 (93.1%) | 13 (6.9%) |
| 3-Person Household | 40 (100.0%) | 0 (0.0%) |
| 4+ Person Household | 17 (51.5%) | 16 (48.5%) |
| Total Housing Units | 266 (83.9%) | 51 (16.1%) |
Occupancy by Educational Attainment in Rockport
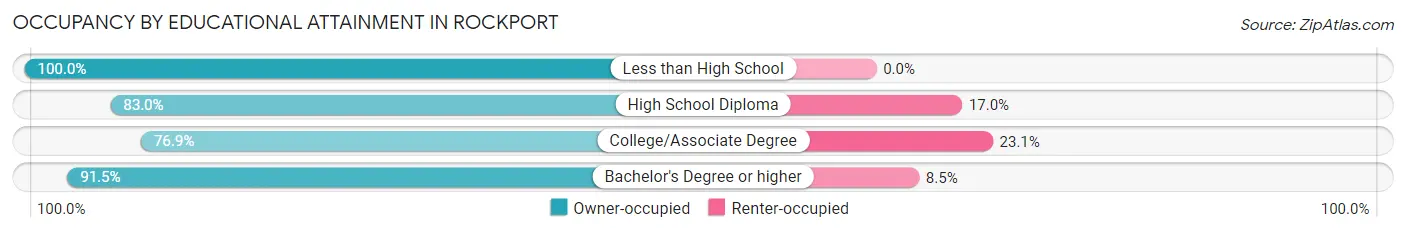
| Household Size | Owner-occupied | Renter-occupied |
| Less than High School | 20 (100.0%) | 0 (0.0%) |
| High School Diploma | 122 (83.0%) | 25 (17.0%) |
| College/Associate Degree | 70 (76.9%) | 21 (23.1%) |
| Bachelor's Degree or higher | 54 (91.5%) | 5 (8.5%) |
Occupancy by Age of Householder in Rockport
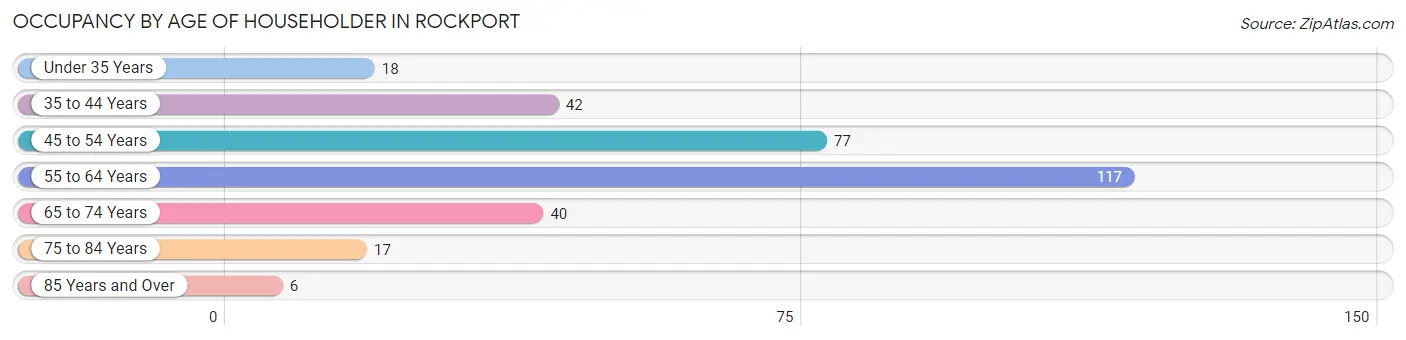
| Age Bracket | # Households | % Households |
| Under 35 Years | 18 | 5.7% |
| 35 to 44 Years | 42 | 13.3% |
| 45 to 54 Years | 77 | 24.3% |
| 55 to 64 Years | 117 | 36.9% |
| 65 to 74 Years | 40 | 12.6% |
| 75 to 84 Years | 17 | 5.4% |
| 85 Years and Over | 6 | 1.9% |
| Total | 317 | 100.0% |
Housing Finances in Rockport
Median Income by Occupancy in Rockport
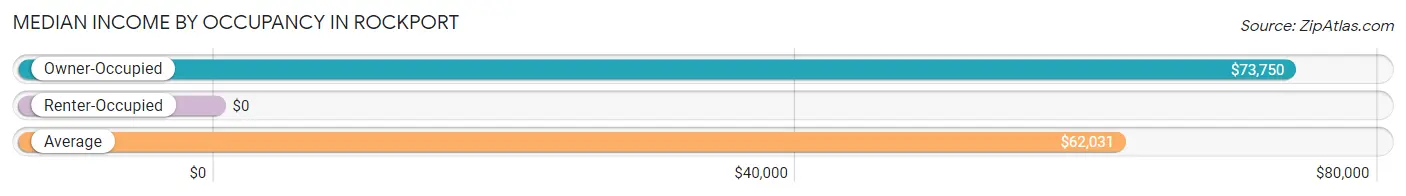
| Occupancy Type | # Households | Median Income |
| Owner-Occupied | 266 (83.9%) | $73,750 |
| Renter-Occupied | 51 (16.1%) | $0 |
| Average | 317 (100.0%) | $62,031 |
Occupancy by Householder Income Bracket in Rockport
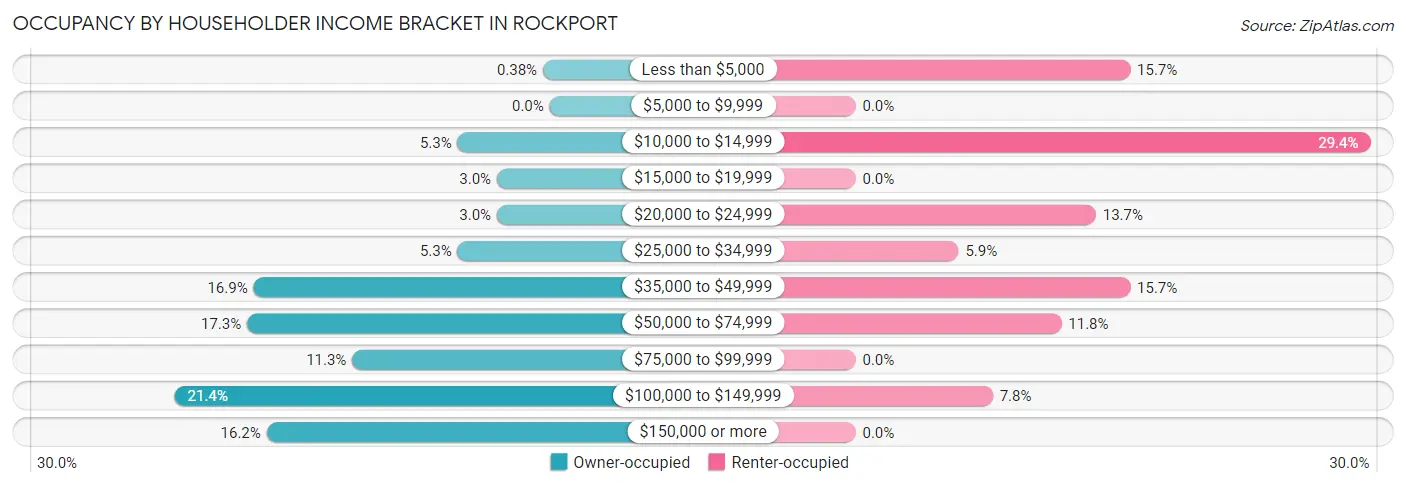
| Income Bracket | Owner-occupied | Renter-occupied |
| Less than $5,000 | 1 (0.4%) | 8 (15.7%) |
| $5,000 to $9,999 | 0 (0.0%) | 0 (0.0%) |
| $10,000 to $14,999 | 14 (5.3%) | 15 (29.4%) |
| $15,000 to $19,999 | 8 (3.0%) | 0 (0.0%) |
| $20,000 to $24,999 | 8 (3.0%) | 7 (13.7%) |
| $25,000 to $34,999 | 14 (5.3%) | 3 (5.9%) |
| $35,000 to $49,999 | 45 (16.9%) | 8 (15.7%) |
| $50,000 to $74,999 | 46 (17.3%) | 6 (11.8%) |
| $75,000 to $99,999 | 30 (11.3%) | 0 (0.0%) |
| $100,000 to $149,999 | 57 (21.4%) | 4 (7.8%) |
| $150,000 or more | 43 (16.2%) | 0 (0.0%) |
| Total | 266 (100.0%) | 51 (100.0%) |
Monthly Housing Cost Tiers in Rockport
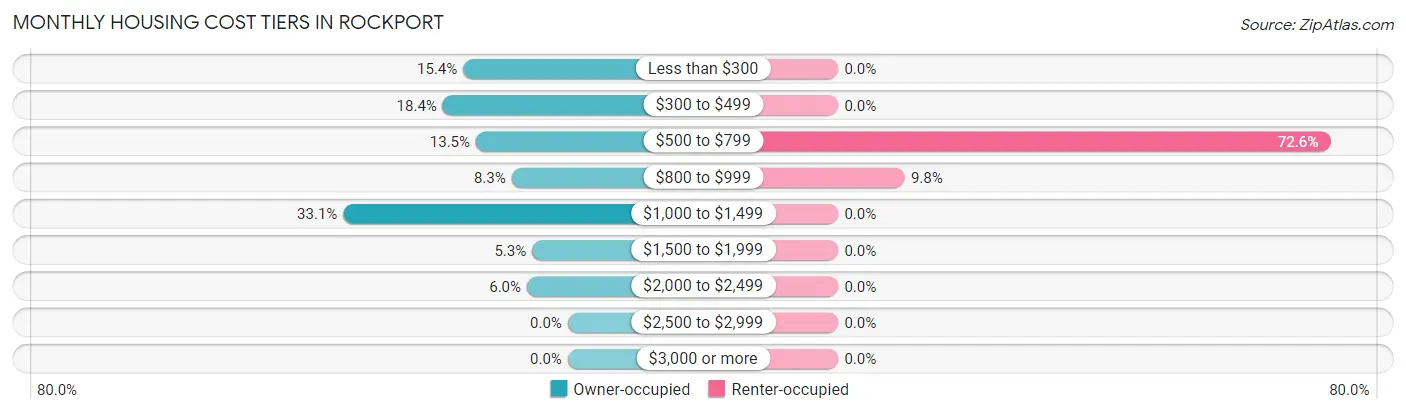
| Monthly Cost | Owner-occupied | Renter-occupied |
| Less than $300 | 41 (15.4%) | 0 (0.0%) |
| $300 to $499 | 49 (18.4%) | 0 (0.0%) |
| $500 to $799 | 36 (13.5%) | 37 (72.6%) |
| $800 to $999 | 22 (8.3%) | 5 (9.8%) |
| $1,000 to $1,499 | 88 (33.1%) | 0 (0.0%) |
| $1,500 to $1,999 | 14 (5.3%) | 0 (0.0%) |
| $2,000 to $2,499 | 16 (6.0%) | 0 (0.0%) |
| $2,500 to $2,999 | 0 (0.0%) | 0 (0.0%) |
| $3,000 or more | 0 (0.0%) | 0 (0.0%) |
| Total | 266 (100.0%) | 51 (100.0%) |
Physical Housing Characteristics in Rockport
Housing Structures in Rockport
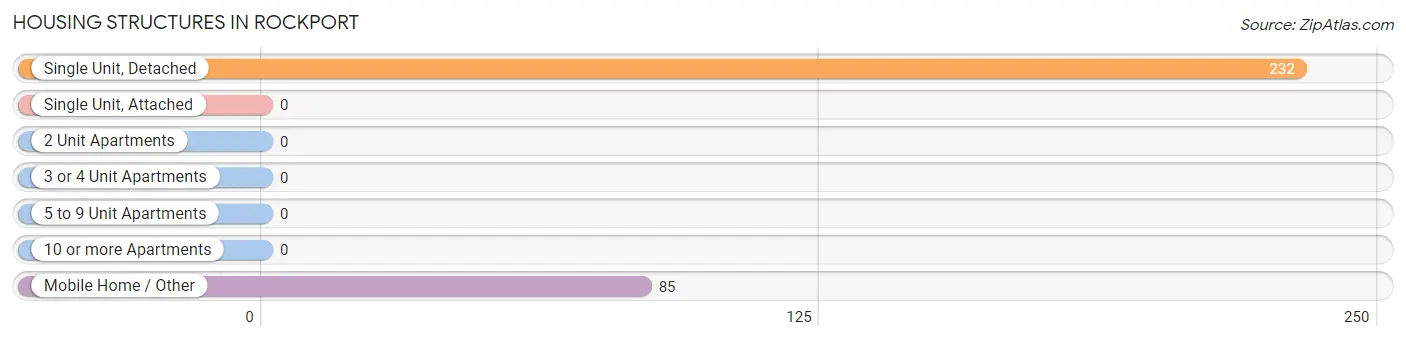
| Structure Type | # Housing Units | % Housing Units |
| Single Unit, Detached | 232 | 73.2% |
| Single Unit, Attached | 0 | 0.0% |
| 2 Unit Apartments | 0 | 0.0% |
| 3 or 4 Unit Apartments | 0 | 0.0% |
| 5 to 9 Unit Apartments | 0 | 0.0% |
| 10 or more Apartments | 0 | 0.0% |
| Mobile Home / Other | 85 | 26.8% |
| Total | 317 | 100.0% |
Housing Structures by Occupancy in Rockport
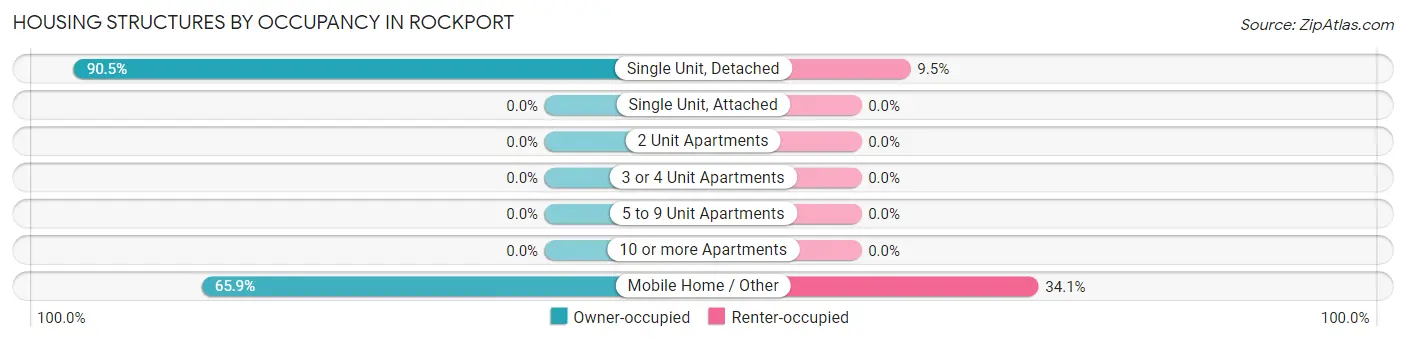
| Structure Type | Owner-occupied | Renter-occupied |
| Single Unit, Detached | 210 (90.5%) | 22 (9.5%) |
| Single Unit, Attached | 0 (0.0%) | 0 (0.0%) |
| 2 Unit Apartments | 0 (0.0%) | 0 (0.0%) |
| 3 or 4 Unit Apartments | 0 (0.0%) | 0 (0.0%) |
| 5 to 9 Unit Apartments | 0 (0.0%) | 0 (0.0%) |
| 10 or more Apartments | 0 (0.0%) | 0 (0.0%) |
| Mobile Home / Other | 56 (65.9%) | 29 (34.1%) |
| Total | 266 (83.9%) | 51 (16.1%) |
Housing Structures by Number of Rooms in Rockport
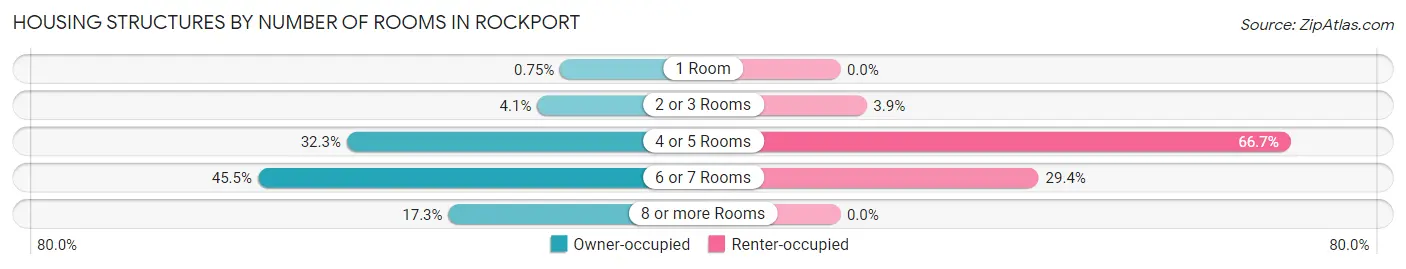
| Number of Rooms | Owner-occupied | Renter-occupied |
| 1 Room | 2 (0.7%) | 0 (0.0%) |
| 2 or 3 Rooms | 11 (4.1%) | 2 (3.9%) |
| 4 or 5 Rooms | 86 (32.3%) | 34 (66.7%) |
| 6 or 7 Rooms | 121 (45.5%) | 15 (29.4%) |
| 8 or more Rooms | 46 (17.3%) | 0 (0.0%) |
| Total | 266 (100.0%) | 51 (100.0%) |
Housing Structure by Heating Type in Rockport
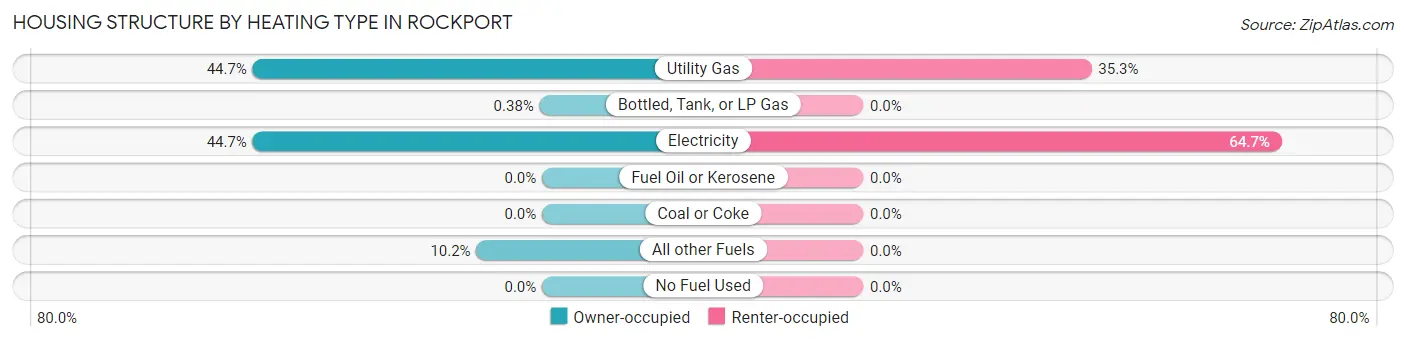
| Heating Type | Owner-occupied | Renter-occupied |
| Utility Gas | 119 (44.7%) | 18 (35.3%) |
| Bottled, Tank, or LP Gas | 1 (0.4%) | 0 (0.0%) |
| Electricity | 119 (44.7%) | 33 (64.7%) |
| Fuel Oil or Kerosene | 0 (0.0%) | 0 (0.0%) |
| Coal or Coke | 0 (0.0%) | 0 (0.0%) |
| All other Fuels | 27 (10.2%) | 0 (0.0%) |
| No Fuel Used | 0 (0.0%) | 0 (0.0%) |
| Total | 266 (100.0%) | 51 (100.0%) |
Household Vehicle Usage in Rockport
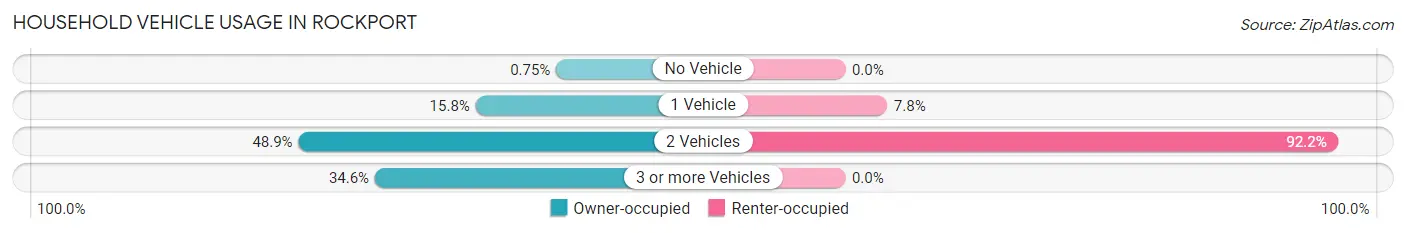
| Vehicles per Household | Owner-occupied | Renter-occupied |
| No Vehicle | 2 (0.7%) | 0 (0.0%) |
| 1 Vehicle | 42 (15.8%) | 4 (7.8%) |
| 2 Vehicles | 130 (48.9%) | 47 (92.2%) |
| 3 or more Vehicles | 92 (34.6%) | 0 (0.0%) |
| Total | 266 (100.0%) | 51 (100.0%) |
Real Estate & Mortgages in Rockport
Real Estate and Mortgage Overview in Rockport
| Characteristic | Without Mortgage | With Mortgage |
| Housing Units | 104 | 162 |
| Median Property Value | $113,900 | $153,100 |
| Median Household Income | $57,778 | $36 |
| Monthly Housing Costs | $346 | $0 |
| Real Estate Taxes | $657 | $3 |
Property Value by Mortgage Status in Rockport
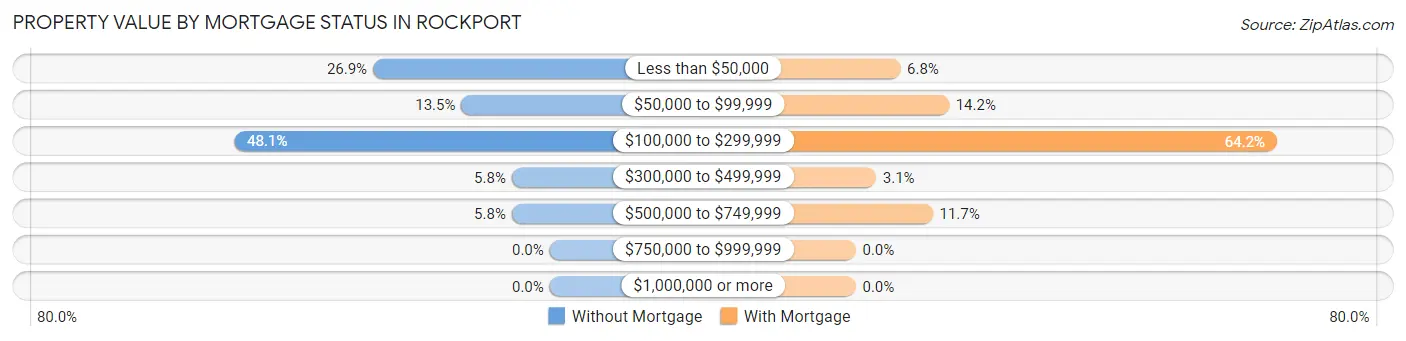
| Property Value | Without Mortgage | With Mortgage |
| Less than $50,000 | 28 (26.9%) | 11 (6.8%) |
| $50,000 to $99,999 | 14 (13.5%) | 23 (14.2%) |
| $100,000 to $299,999 | 50 (48.1%) | 104 (64.2%) |
| $300,000 to $499,999 | 6 (5.8%) | 5 (3.1%) |
| $500,000 to $749,999 | 6 (5.8%) | 19 (11.7%) |
| $750,000 to $999,999 | 0 (0.0%) | 0 (0.0%) |
| $1,000,000 or more | 0 (0.0%) | 0 (0.0%) |
| Total | 104 (100.0%) | 162 (100.0%) |
Household Income by Mortgage Status in Rockport
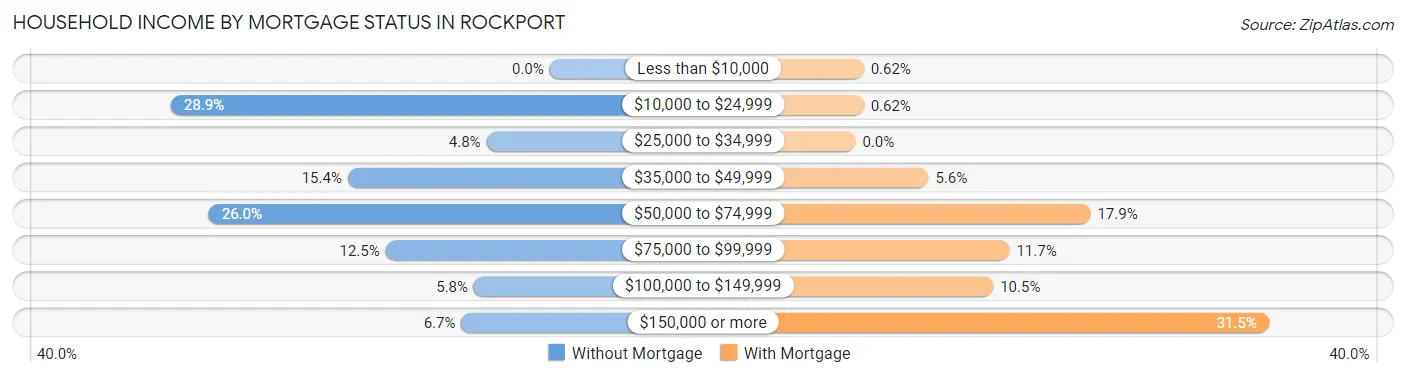
| Household Income | Without Mortgage | With Mortgage |
| Less than $10,000 | 0 (0.0%) | 1 (0.6%) |
| $10,000 to $24,999 | 30 (28.8%) | 1 (0.6%) |
| $25,000 to $34,999 | 5 (4.8%) | 0 (0.0%) |
| $35,000 to $49,999 | 16 (15.4%) | 9 (5.6%) |
| $50,000 to $74,999 | 27 (26.0%) | 29 (17.9%) |
| $75,000 to $99,999 | 13 (12.5%) | 19 (11.7%) |
| $100,000 to $149,999 | 6 (5.8%) | 17 (10.5%) |
| $150,000 or more | 7 (6.7%) | 51 (31.5%) |
| Total | 104 (100.0%) | 162 (100.0%) |
Property Value to Household Income Ratio in Rockport
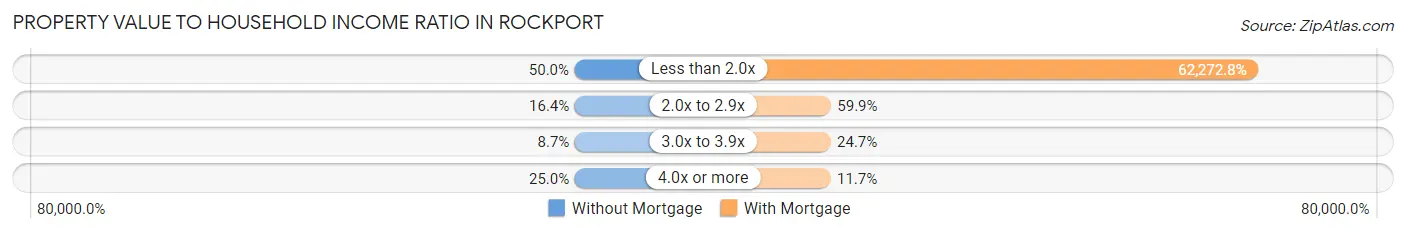
| Value-to-Income Ratio | Without Mortgage | With Mortgage |
| Less than 2.0x | 52 (50.0%) | 100,882 (62,272.8%) |
| 2.0x to 2.9x | 17 (16.4%) | 97 (59.9%) |
| 3.0x to 3.9x | 9 (8.6%) | 40 (24.7%) |
| 4.0x or more | 26 (25.0%) | 19 (11.7%) |
| Total | 104 (100.0%) | 162 (100.0%) |
Real Estate Taxes by Mortgage Status in Rockport
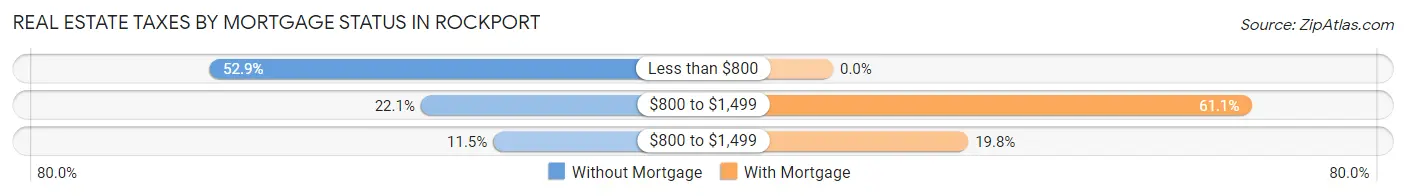
| Property Taxes | Without Mortgage | With Mortgage |
| Less than $800 | 55 (52.9%) | 0 (0.0%) |
| $800 to $1,499 | 23 (22.1%) | 99 (61.1%) |
| $800 to $1,499 | 12 (11.5%) | 32 (19.8%) |
| Total | 104 (100.0%) | 162 (100.0%) |
Health & Disability in Rockport
Health Insurance Coverage by Age in Rockport
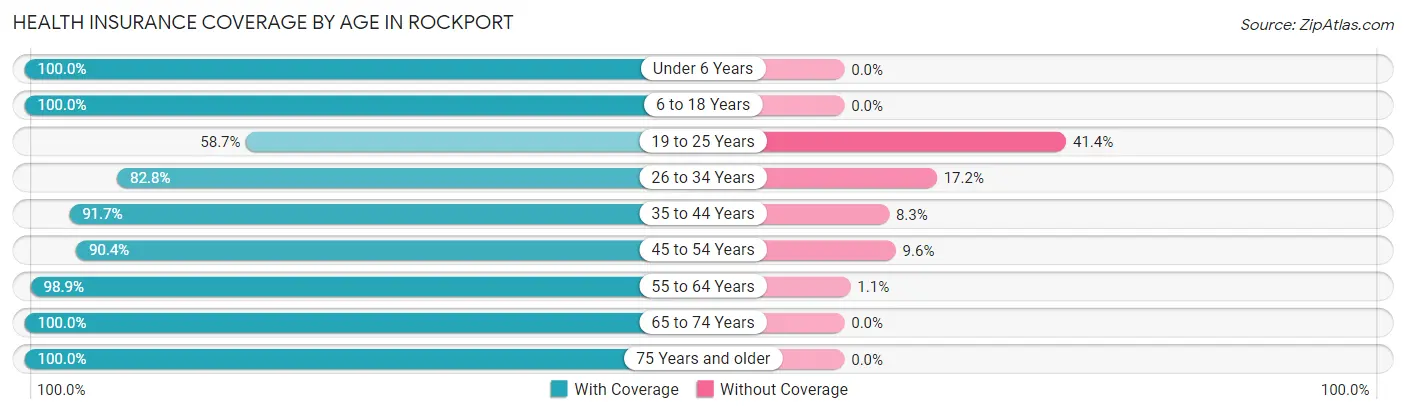
| Age Bracket | With Coverage | Without Coverage |
| Under 6 Years | 53 (100.0%) | 0 (0.0%) |
| 6 to 18 Years | 133 (100.0%) | 0 (0.0%) |
| 19 to 25 Years | 61 (58.7%) | 43 (41.3%) |
| 26 to 34 Years | 24 (82.8%) | 5 (17.2%) |
| 35 to 44 Years | 77 (91.7%) | 7 (8.3%) |
| 45 to 54 Years | 151 (90.4%) | 16 (9.6%) |
| 55 to 64 Years | 173 (98.9%) | 2 (1.1%) |
| 65 to 74 Years | 95 (100.0%) | 0 (0.0%) |
| 75 Years and older | 44 (100.0%) | 0 (0.0%) |
| Total | 811 (91.7%) | 73 (8.3%) |
Health Insurance Coverage by Citizenship Status in Rockport
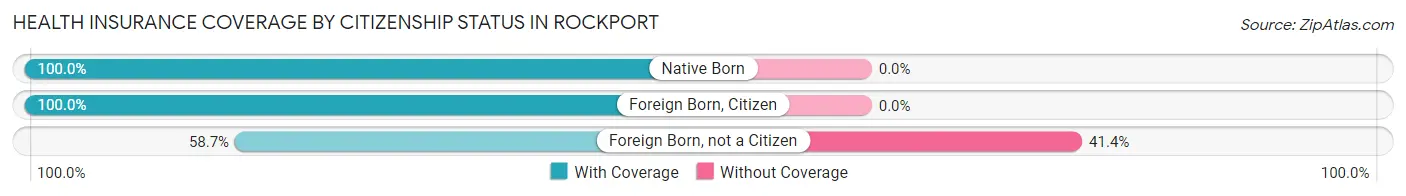
| Citizenship Status | With Coverage | Without Coverage |
| Native Born | 53 (100.0%) | 0 (0.0%) |
| Foreign Born, Citizen | 133 (100.0%) | 0 (0.0%) |
| Foreign Born, not a Citizen | 61 (58.7%) | 43 (41.3%) |
Health Insurance Coverage by Household Income in Rockport
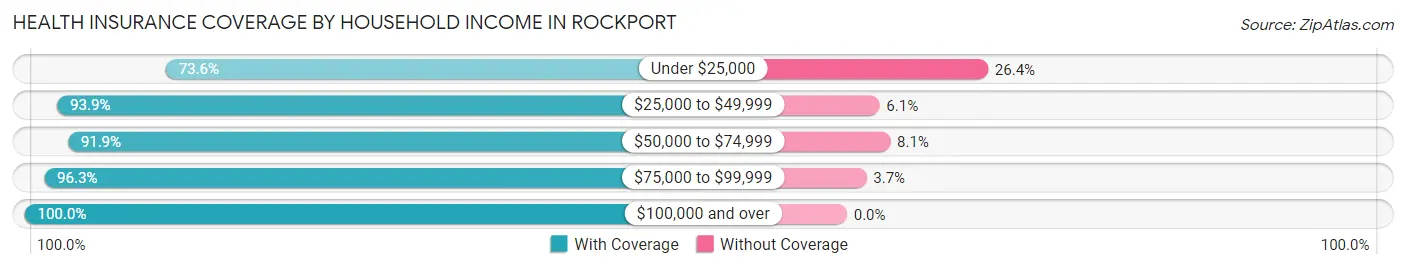
| Household Income | With Coverage | Without Coverage |
| Under $25,000 | 128 (73.6%) | 46 (26.4%) |
| $25,000 to $49,999 | 169 (93.9%) | 11 (6.1%) |
| $50,000 to $74,999 | 136 (91.9%) | 12 (8.1%) |
| $75,000 to $99,999 | 105 (96.3%) | 4 (3.7%) |
| $100,000 and over | 273 (100.0%) | 0 (0.0%) |
Public vs Private Health Insurance Coverage by Age in Rockport
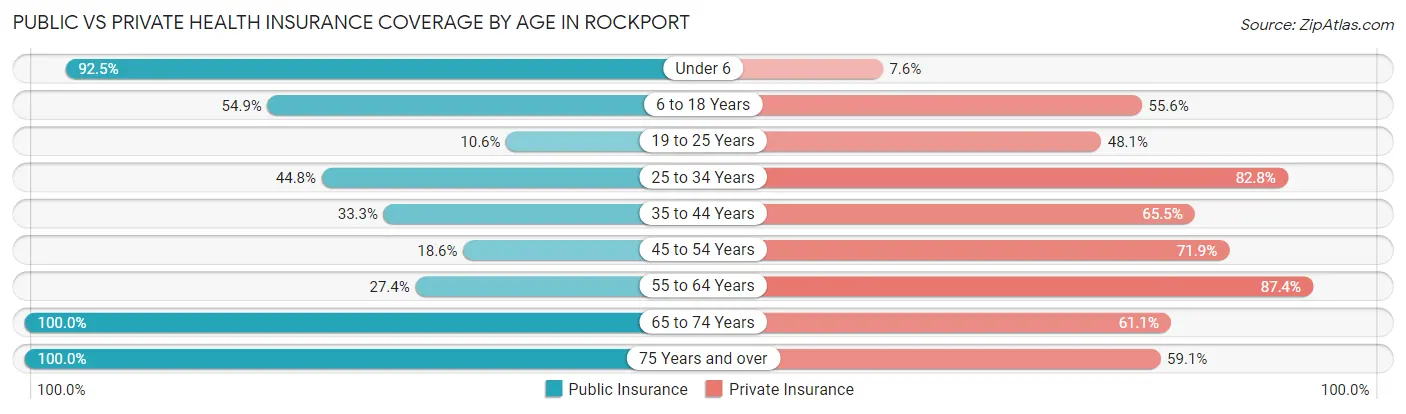
| Age Bracket | Public Insurance | Private Insurance |
| Under 6 | 49 (92.4%) | 4 (7.5%) |
| 6 to 18 Years | 73 (54.9%) | 74 (55.6%) |
| 19 to 25 Years | 11 (10.6%) | 50 (48.1%) |
| 25 to 34 Years | 13 (44.8%) | 24 (82.8%) |
| 35 to 44 Years | 28 (33.3%) | 55 (65.5%) |
| 45 to 54 Years | 31 (18.6%) | 120 (71.9%) |
| 55 to 64 Years | 48 (27.4%) | 153 (87.4%) |
| 65 to 74 Years | 95 (100.0%) | 58 (61.1%) |
| 75 Years and over | 44 (100.0%) | 26 (59.1%) |
| Total | 392 (44.3%) | 564 (63.8%) |
Disability Status by Sex by Age in Rockport
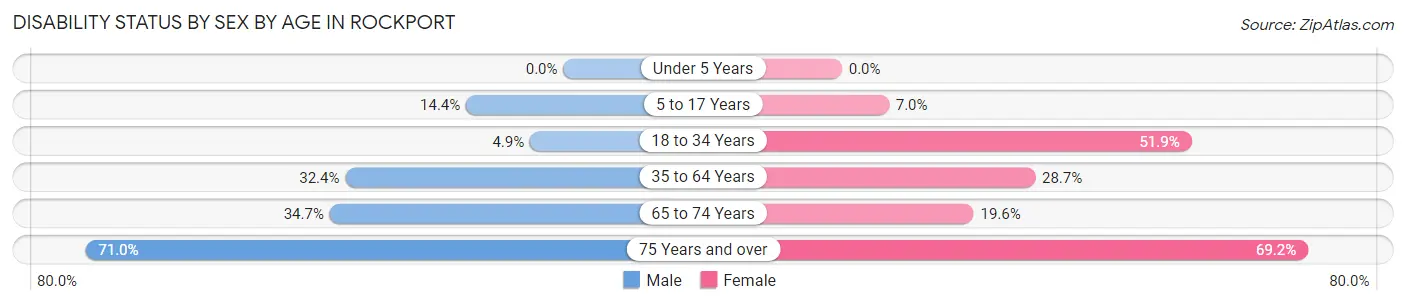
| Age Bracket | Male | Female |
| Under 5 Years | 0 (0.0%) | 0 (0.0%) |
| 5 to 17 Years | 13 (14.4%) | 3 (7.0%) |
| 18 to 34 Years | 4 (4.9%) | 27 (51.9%) |
| 35 to 64 Years | 68 (32.4%) | 62 (28.7%) |
| 65 to 74 Years | 17 (34.7%) | 9 (19.6%) |
| 75 Years and over | 22 (71.0%) | 9 (69.2%) |
Disability Class by Sex by Age in Rockport
Disability Class: Hearing Difficulty
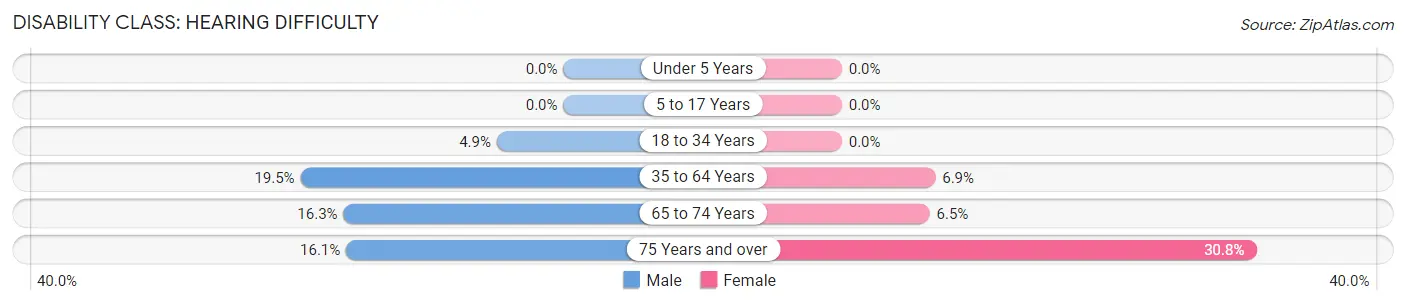
| Age Bracket | Male | Female |
| Under 5 Years | 0 (0.0%) | 0 (0.0%) |
| 5 to 17 Years | 0 (0.0%) | 0 (0.0%) |
| 18 to 34 Years | 4 (4.9%) | 0 (0.0%) |
| 35 to 64 Years | 41 (19.5%) | 15 (6.9%) |
| 65 to 74 Years | 8 (16.3%) | 3 (6.5%) |
| 75 Years and over | 5 (16.1%) | 4 (30.8%) |
Disability Class: Vision Difficulty
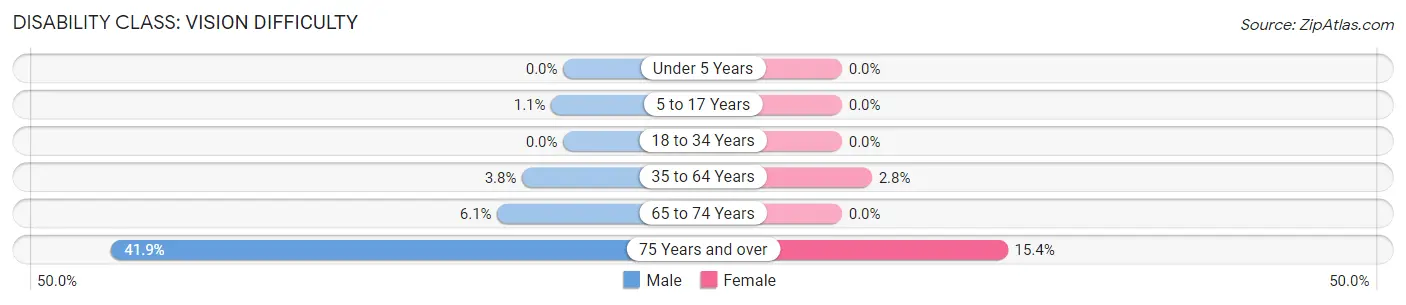
| Age Bracket | Male | Female |
| Under 5 Years | 0 (0.0%) | 0 (0.0%) |
| 5 to 17 Years | 1 (1.1%) | 0 (0.0%) |
| 18 to 34 Years | 0 (0.0%) | 0 (0.0%) |
| 35 to 64 Years | 8 (3.8%) | 6 (2.8%) |
| 65 to 74 Years | 3 (6.1%) | 0 (0.0%) |
| 75 Years and over | 13 (41.9%) | 2 (15.4%) |
Disability Class: Cognitive Difficulty
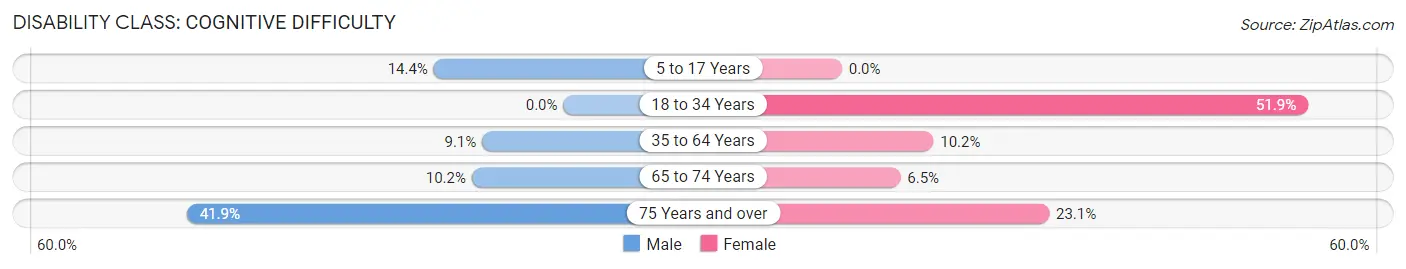
| Age Bracket | Male | Female |
| 5 to 17 Years | 13 (14.4%) | 0 (0.0%) |
| 18 to 34 Years | 0 (0.0%) | 27 (51.9%) |
| 35 to 64 Years | 19 (9.0%) | 22 (10.2%) |
| 65 to 74 Years | 5 (10.2%) | 3 (6.5%) |
| 75 Years and over | 13 (41.9%) | 3 (23.1%) |
Disability Class: Ambulatory Difficulty
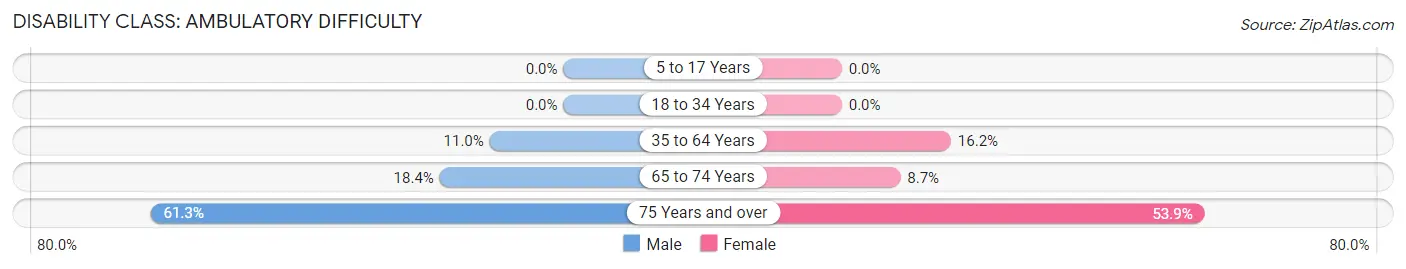
| Age Bracket | Male | Female |
| 5 to 17 Years | 0 (0.0%) | 0 (0.0%) |
| 18 to 34 Years | 0 (0.0%) | 0 (0.0%) |
| 35 to 64 Years | 23 (11.0%) | 35 (16.2%) |
| 65 to 74 Years | 9 (18.4%) | 4 (8.7%) |
| 75 Years and over | 19 (61.3%) | 7 (53.8%) |
Disability Class: Self-Care Difficulty
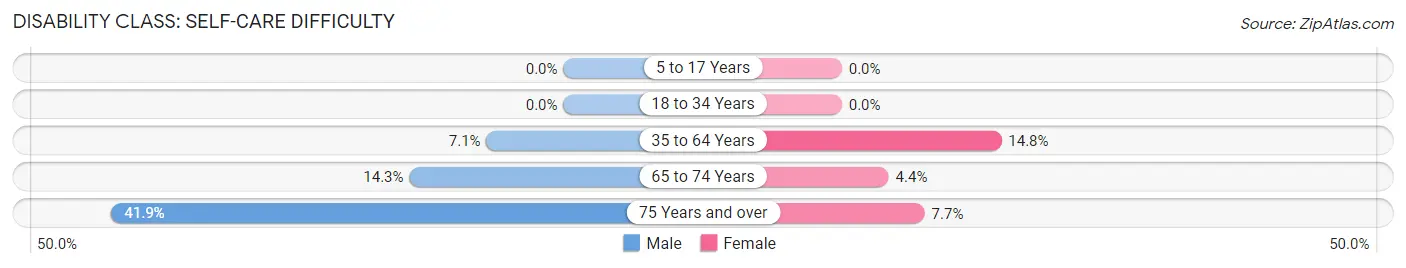
| Age Bracket | Male | Female |
| 5 to 17 Years | 0 (0.0%) | 0 (0.0%) |
| 18 to 34 Years | 0 (0.0%) | 0 (0.0%) |
| 35 to 64 Years | 15 (7.1%) | 32 (14.8%) |
| 65 to 74 Years | 7 (14.3%) | 2 (4.3%) |
| 75 Years and over | 13 (41.9%) | 1 (7.7%) |
Technology Access in Rockport
Computing Device Access in Rockport

| Device Type | # Households | % Households |
| Desktop or Laptop | 220 | 69.4% |
| Smartphone | 265 | 83.6% |
| Tablet | 176 | 55.5% |
| No Computing Device | 40 | 12.6% |
| Total | 317 | 100.0% |
Internet Access in Rockport
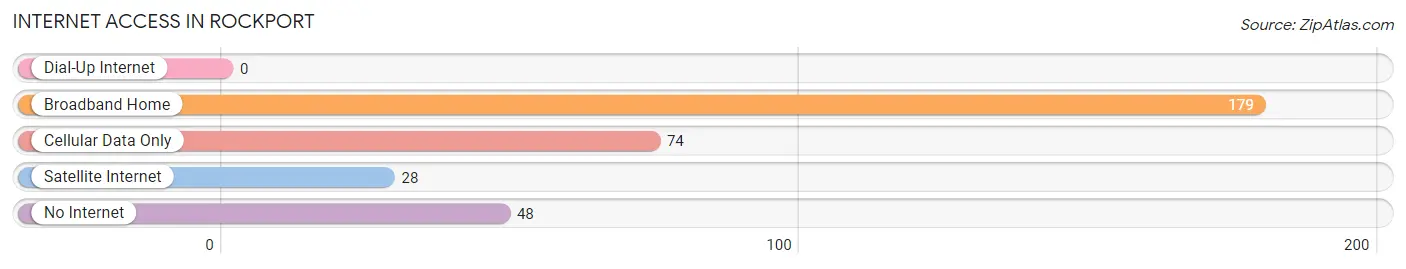
| Internet Type | # Households | % Households |
| Dial-Up Internet | 0 | 0.0% |
| Broadband Home | 179 | 56.5% |
| Cellular Data Only | 74 | 23.3% |
| Satellite Internet | 28 | 8.8% |
| No Internet | 48 | 15.1% |
| Total | 317 | 100.0% |
Rockport Summary
Rockport, Arkansas is a small town located in the northwest corner of the state, near the Oklahoma border. It is situated in the foothills of the Ozark Mountains and is part of the Fort Smith metropolitan area. The town has a population of just over 1,000 people and is known for its rural charm and friendly atmosphere.
History
Rockport was founded in 1876 by a group of settlers from Missouri. The town was named after the nearby Rockport Creek, which was named for the rocky terrain of the area. The town was originally a farming community, but in the early 1900s, the timber industry began to take off in the area. The town was incorporated in 1912 and the first mayor was elected in 1913.
In the 1920s, the town began to experience a period of growth and development. The first bank was established in 1921 and the first school was built in 1923. The town also saw the construction of a number of churches and businesses.
In the 1950s, the town experienced a period of decline as the timber industry began to decline. However, in the late 1960s, the town began to experience a resurgence as the timber industry began to rebound. The town also saw the construction of a number of new businesses and the opening of a new hospital.
Geography
Rockport is located in the northwest corner of Arkansas, near the Oklahoma border. It is situated in the foothills of the Ozark Mountains and is part of the Fort Smith metropolitan area. The town is located on the banks of the Arkansas River and is surrounded by rolling hills and forests. The town has a total area of 1.3 square miles, all of which is land.
Economy
The economy of Rockport is largely based on agriculture and timber. The town is home to a number of farms and ranches, as well as a number of timber companies. The town also has a number of small businesses, including restaurants, retail stores, and service providers.
Demographics
As of the 2010 census, the population of Rockport was 1,072. The racial makeup of the town was 95.3% White, 0.7% African American, 0.3% Native American, 0.2% Asian, 0.1% Pacific Islander, and 3.4% from other races. The median household income was $31,250 and the median family income was $37,500. The per capita income was $17,845.
Conclusion
Rockport, Arkansas is a small town located in the northwest corner of the state, near the Oklahoma border. It is situated in the foothills of the Ozark Mountains and is part of the Fort Smith metropolitan area. The town has a population of just over 1,000 people and is known for its rural charm and friendly atmosphere. The economy of Rockport is largely based on agriculture and timber, and the town is home to a number of farms and ranches, as well as a number of timber companies. The racial makeup of the town is predominantly White, with a small percentage of African American, Native American, Asian, and Pacific Islander residents. The median household income is $31,250 and the median family income is $37,500.
Common Questions
What is Per Capita Income in Rockport?
Per Capita income in Rockport is $30,027.
What is the Median Family Income in Rockport?
Median Family Income in Rockport is $76,250.
What is the Median Household income in Rockport?
Median Household Income in Rockport is $62,031.
What is Income or Wage Gap in Rockport?
Income or Wage Gap in Rockport is 20.5%.
Women in Rockport earn 79.5 cents for every dollar earned by a man.
What is Inequality or Gini Index in Rockport?
Inequality or Gini Index in Rockport is 0.41.
What is the Total Population of Rockport?
Total Population of Rockport is 884.
What is the Total Male Population of Rockport?
Total Male Population of Rockport is 495.
What is the Total Female Population of Rockport?
Total Female Population of Rockport is 389.
What is the Ratio of Males per 100 Females in Rockport?
There are 127.25 Males per 100 Females in Rockport.
What is the Ratio of Females per 100 Males in Rockport?
There are 78.59 Females per 100 Males in Rockport.
What is the Median Population Age in Rockport?
Median Population Age in Rockport is 47.6 Years.
What is the Average Family Size in Rockport
Average Family Size in Rockport is 3.1 People.
What is the Average Household Size in Rockport
Average Household Size in Rockport is 2.8 People.
How Large is the Labor Force in Rockport?
There are 383 People in the Labor Forcein in Rockport.
What is the Percentage of People in the Labor Force in Rockport?
53.6% of People are in the Labor Force in Rockport.
What is the Unemployment Rate in Rockport?
Unemployment Rate in Rockport is 1.3%.