Greenland, AR Map & Demographics
Greenland Map
Greenland Overview
$30,690
PER CAPITA INCOME
$69,000
AVG FAMILY INCOME
$59,638
AVG HOUSEHOLD INCOME
3.1%
WAGE / INCOME GAP [ % ]
96.9¢/ $1
WAGE / INCOME GAP [ $ ]
0.37
INEQUALITY / GINI INDEX
1,424
TOTAL POPULATION
692
MALE POPULATION
732
FEMALE POPULATION
94.54
MALES / 100 FEMALES
105.78
FEMALES / 100 MALES
38.9
MEDIAN AGE
3.0
AVG FAMILY SIZE
2.7
AVG HOUSEHOLD SIZE
853
LABOR FORCE [ PEOPLE ]
70.3%
PERCENT IN LABOR FORCE
3.2%
UNEMPLOYMENT RATE
Greenland Area Codes
Income in Greenland
Income Overview in Greenland
Per Capita Income in Greenland is $30,690, while median incomes of families and households are $69,000 and $59,638 respectively.
| Characteristic | Number | Measure |
| Per Capita Income | 1,424 | $30,690 |
| Median Family Income | 358 | $69,000 |
| Mean Family Income | 358 | $83,441 |
| Median Household Income | 523 | $59,638 |
| Mean Household Income | 523 | $78,107 |
| Income Deficit | 358 | $0 |
| Wage / Income Gap (%) | 1,424 | 3.12% |
| Wage / Income Gap ($) | 1,424 | 96.88¢ per $1 |
| Gini / Inequality Index | 1,424 | 0.37 |
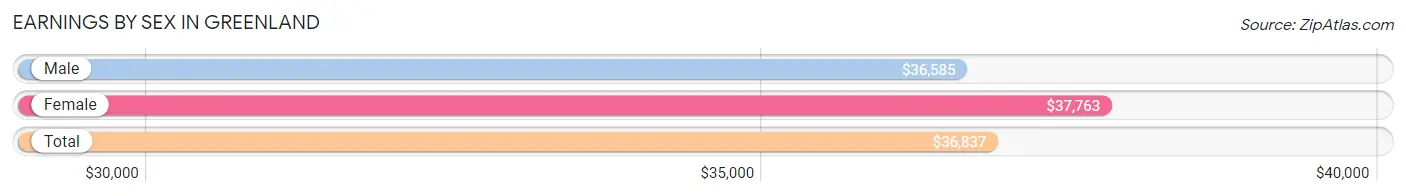
Earnings by Sex in Greenland
Average Earnings in Greenland are $36,837, $36,585 for men and $37,763 for women, a difference of 3.1%.
| Sex | Number | Average Earnings |
| Male | 466 (53.4%) | $36,585 |
| Female | 406 (46.6%) | $37,763 |
| Total | 872 (100.0%) | $36,837 |
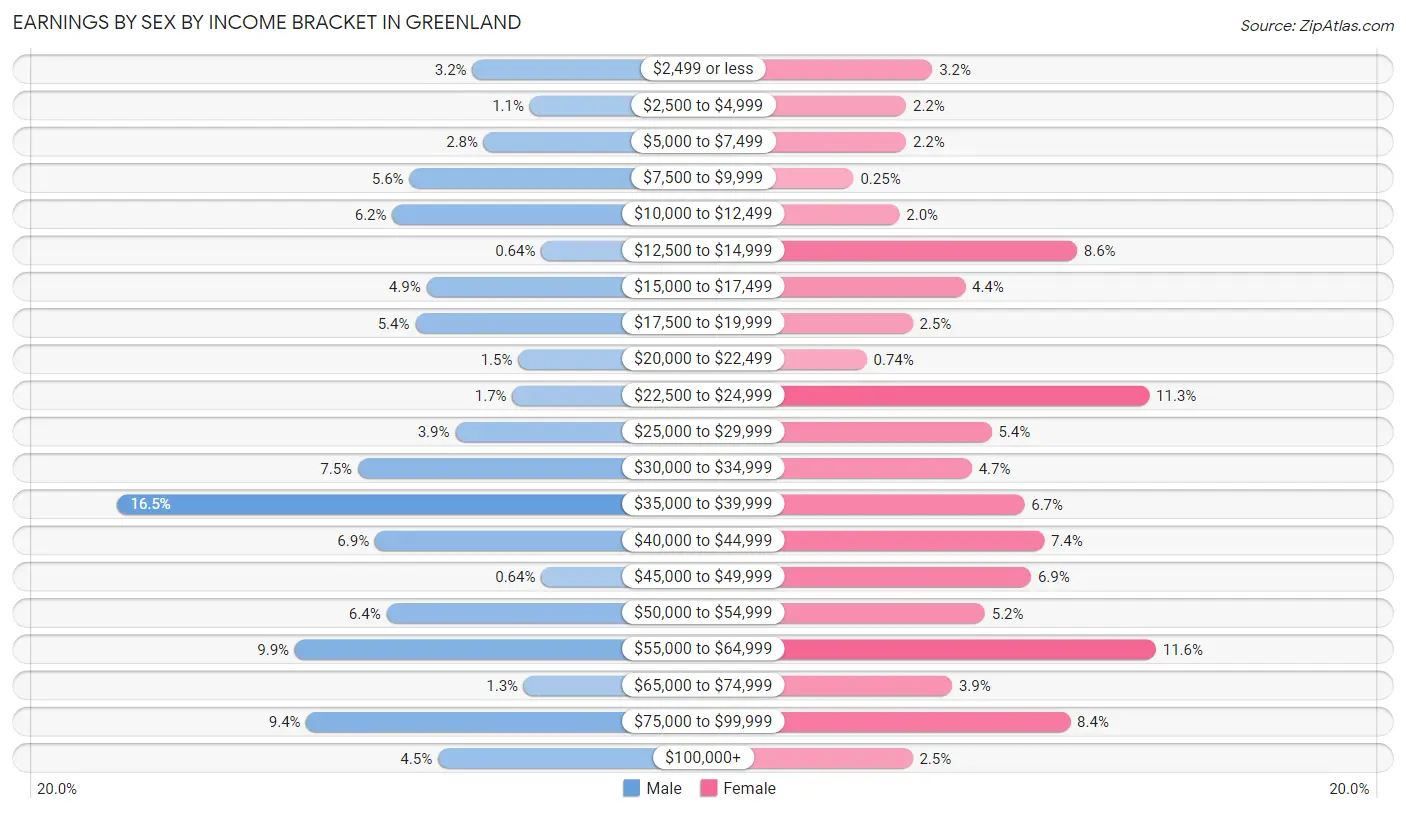
Earnings by Sex by Income Bracket in Greenland
The most common earnings brackets in Greenland are $35,000 to $39,999 for men (77 | 16.5%) and $55,000 to $64,999 for women (47 | 11.6%).
| Income | Male | Female |
| $2,499 or less | 15 (3.2%) | 13 (3.2%) |
| $2,500 to $4,999 | 5 (1.1%) | 9 (2.2%) |
| $5,000 to $7,499 | 13 (2.8%) | 9 (2.2%) |
| $7,500 to $9,999 | 26 (5.6%) | 1 (0.3%) |
| $10,000 to $12,499 | 29 (6.2%) | 8 (2.0%) |
| $12,500 to $14,999 | 3 (0.6%) | 35 (8.6%) |
| $15,000 to $17,499 | 23 (4.9%) | 18 (4.4%) |
| $17,500 to $19,999 | 25 (5.4%) | 10 (2.5%) |
| $20,000 to $22,499 | 7 (1.5%) | 3 (0.7%) |
| $22,500 to $24,999 | 8 (1.7%) | 46 (11.3%) |
| $25,000 to $29,999 | 18 (3.9%) | 22 (5.4%) |
| $30,000 to $34,999 | 35 (7.5%) | 19 (4.7%) |
| $35,000 to $39,999 | 77 (16.5%) | 27 (6.7%) |
| $40,000 to $44,999 | 32 (6.9%) | 30 (7.4%) |
| $45,000 to $49,999 | 3 (0.6%) | 28 (6.9%) |
| $50,000 to $54,999 | 30 (6.4%) | 21 (5.2%) |
| $55,000 to $64,999 | 46 (9.9%) | 47 (11.6%) |
| $65,000 to $74,999 | 6 (1.3%) | 16 (3.9%) |
| $75,000 to $99,999 | 44 (9.4%) | 34 (8.4%) |
| $100,000+ | 21 (4.5%) | 10 (2.5%) |
| Total | 466 (100.0%) | 406 (100.0%) |
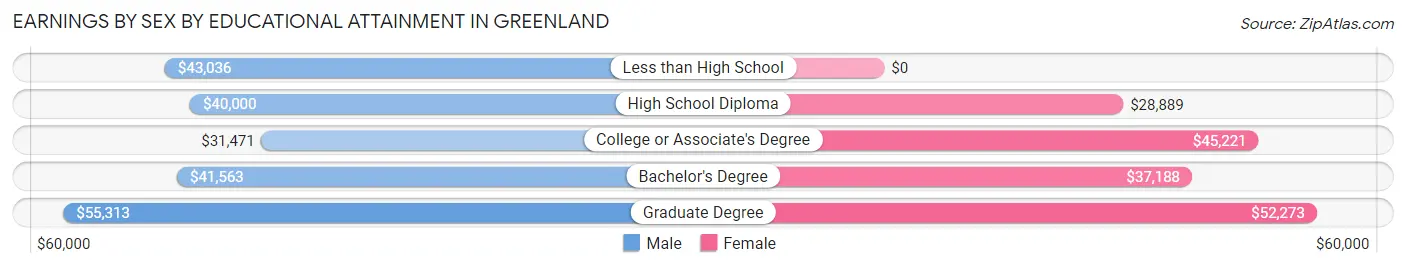
Earnings by Sex by Educational Attainment in Greenland
Average earnings in Greenland are $39,875 for men and $39,539 for women, a difference of 0.8%. Men with an educational attainment of graduate degree enjoy the highest average annual earnings of $55,313, while those with college or associate's degree education earn the least with $31,471. Women with an educational attainment of graduate degree earn the most with the average annual earnings of $52,273, while those with high school diploma education have the smallest earnings of $28,889.
| Educational Attainment | Male Income | Female Income |
| Less than High School | $43,036 | $0 |
| High School Diploma | $40,000 | $28,889 |
| College or Associate's Degree | $31,471 | $45,221 |
| Bachelor's Degree | $41,563 | $37,188 |
| Graduate Degree | $55,313 | $52,273 |
| Total | $39,875 | $39,539 |
Family Income in Greenland
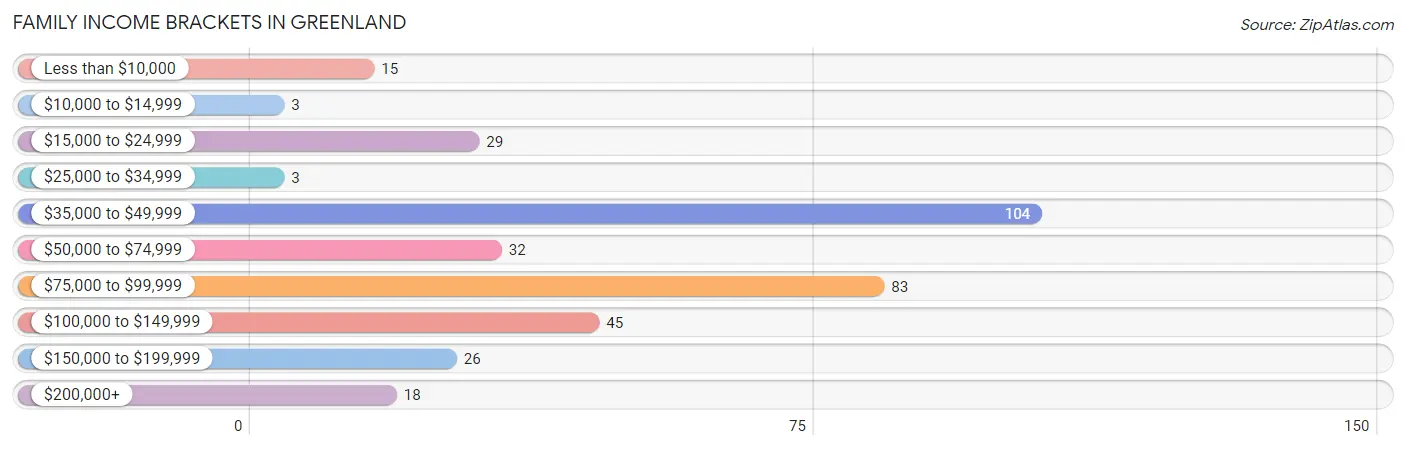
Family Income Brackets in Greenland
According to the Greenland family income data, there are 104 families falling into the $35,000 to $49,999 income range, which is the most common income bracket and makes up 29.0% of all families. Conversely, the $10,000 to $14,999 income bracket is the least frequent group with only 3 families (0.8%) belonging to this category.
| Income Bracket | # Families | % Families |
| Less than $10,000 | 15 | 4.2% |
| $10,000 to $14,999 | 3 | 0.8% |
| $15,000 to $24,999 | 29 | 8.1% |
| $25,000 to $34,999 | 3 | 0.8% |
| $35,000 to $49,999 | 104 | 29.1% |
| $50,000 to $74,999 | 32 | 8.9% |
| $75,000 to $99,999 | 83 | 23.2% |
| $100,000 to $149,999 | 45 | 12.6% |
| $150,000 to $199,999 | 26 | 7.3% |
| $200,000+ | 18 | 5.0% |
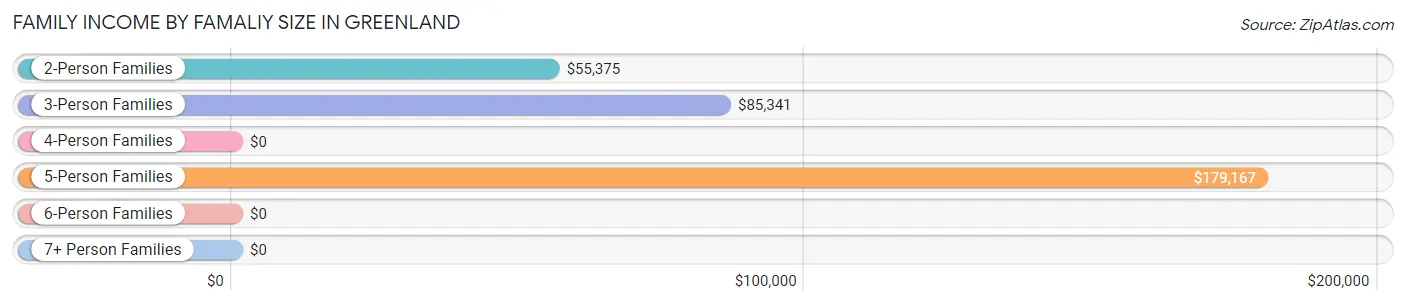
Family Income by Famaliy Size in Greenland
5-person families (34 | 9.5%) account for the highest median family income in Greenland with $179,167 per family, while 5-person families (34 | 9.5%) have the highest median income of $35,833 per family member.
| Income Bracket | # Families | Median Income |
| 2-Person Families | 191 (53.3%) | $55,375 |
| 3-Person Families | 41 (11.5%) | $85,341 |
| 4-Person Families | 92 (25.7%) | $0 |
| 5-Person Families | 34 (9.5%) | $179,167 |
| 6-Person Families | 0 (0.0%) | $0 |
| 7+ Person Families | 0 (0.0%) | $0 |
| Total | 358 (100.0%) | $69,000 |
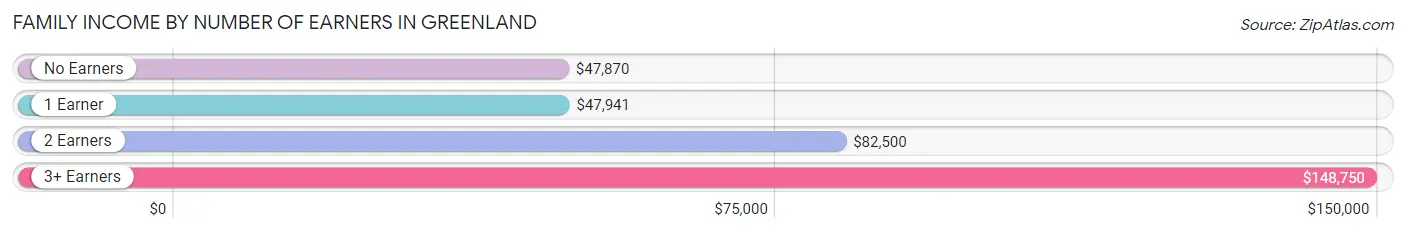
Family Income by Number of Earners in Greenland
The median family income in Greenland is $69,000, with families comprising 3+ earners (38) having the highest median family income of $148,750, while families with no earners (56) have the lowest median family income of $47,870, accounting for 10.6% and 15.6% of families, respectively.
| Number of Earners | # Families | Median Income |
| No Earners | 56 (15.6%) | $47,870 |
| 1 Earner | 94 (26.3%) | $47,941 |
| 2 Earners | 170 (47.5%) | $82,500 |
| 3+ Earners | 38 (10.6%) | $148,750 |
| Total | 358 (100.0%) | $69,000 |
Household Income in Greenland
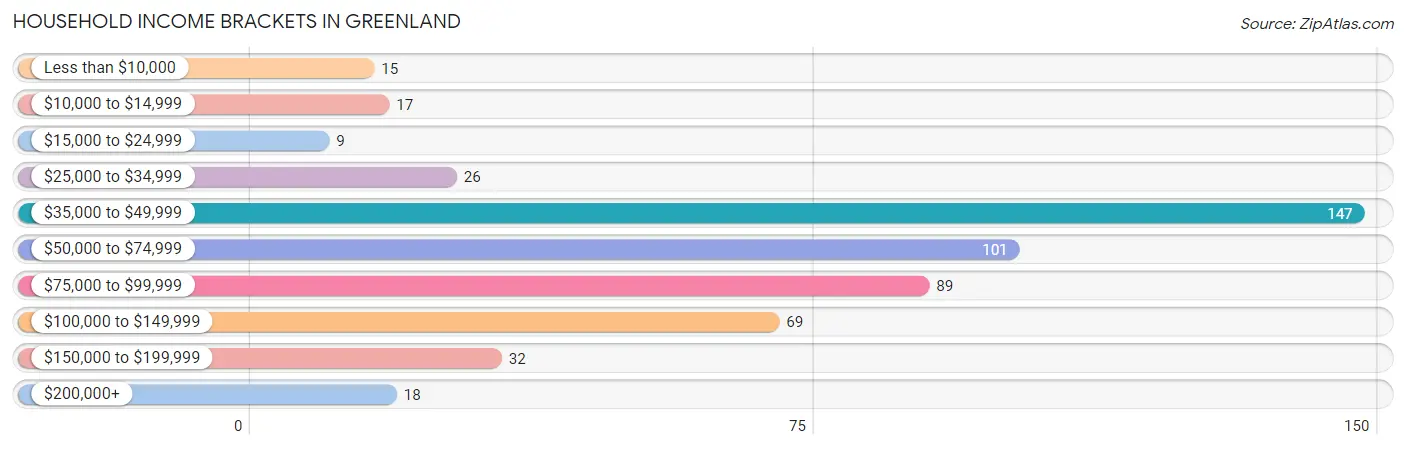
Household Income Brackets in Greenland
With 147 households falling in the category, the $35,000 to $49,999 income range is the most frequent in Greenland, accounting for 28.1% of all households. In contrast, only 9 households (1.7%) fall into the $15,000 to $24,999 income bracket, making it the least populous group.
| Income Bracket | # Households | % Households |
| Less than $10,000 | 15 | 2.9% |
| $10,000 to $14,999 | 17 | 3.3% |
| $15,000 to $24,999 | 9 | 1.7% |
| $25,000 to $34,999 | 26 | 5.0% |
| $35,000 to $49,999 | 147 | 28.1% |
| $50,000 to $74,999 | 101 | 19.3% |
| $75,000 to $99,999 | 89 | 17.0% |
| $100,000 to $149,999 | 69 | 13.2% |
| $150,000 to $199,999 | 32 | 6.1% |
| $200,000+ | 18 | 3.4% |
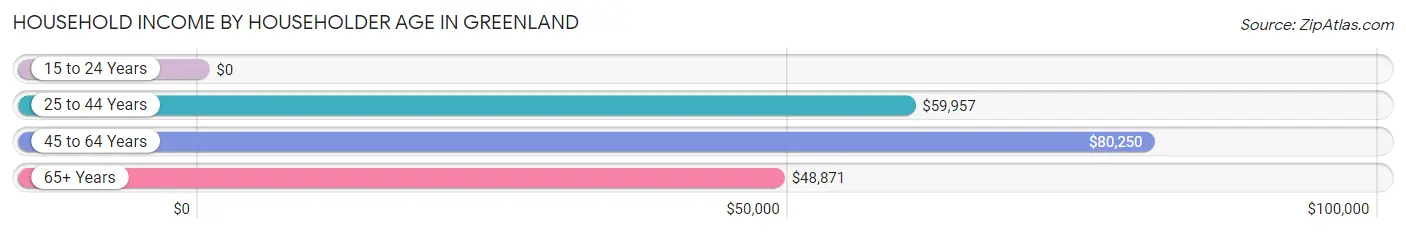
Household Income by Householder Age in Greenland
The median household income in Greenland is $59,638, with the highest median household income of $80,250 found in the 45 to 64 years age bracket for the primary householder. A total of 183 households (35.0%) fall into this category. Meanwhile, the 15 to 24 years age bracket for the primary householder has the lowest median household income of $0, with 33 households (6.3%) in this group.
| Income Bracket | # Households | Median Income |
| 15 to 24 Years | 33 (6.3%) | $0 |
| 25 to 44 Years | 203 (38.8%) | $59,957 |
| 45 to 64 Years | 183 (35.0%) | $80,250 |
| 65+ Years | 104 (19.9%) | $48,871 |
| Total | 523 (100.0%) | $59,638 |
Poverty in Greenland
Income Below Poverty by Sex and Age in Greenland
With 5.7% poverty level for males and 8.9% for females among the residents of Greenland, under 5 year old males and under 5 year old females are the most vulnerable to poverty, with 22 males (36.7%) and 14 females (56.0%) in their respective age groups living below the poverty level.
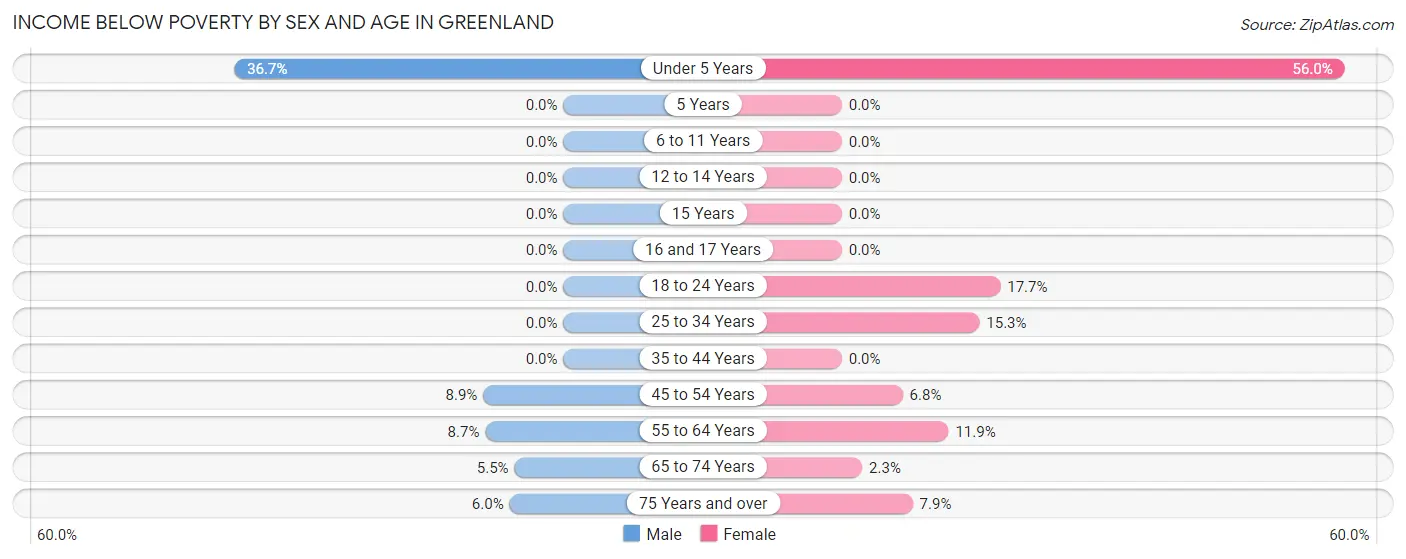
| Age Bracket | Male | Female |
| Under 5 Years | 22 (36.7%) | 14 (56.0%) |
| 5 Years | 0 (0.0%) | 0 (0.0%) |
| 6 to 11 Years | 0 (0.0%) | 0 (0.0%) |
| 12 to 14 Years | 0 (0.0%) | 0 (0.0%) |
| 15 Years | 0 (0.0%) | 0 (0.0%) |
| 16 and 17 Years | 0 (0.0%) | 0 (0.0%) |
| 18 to 24 Years | 0 (0.0%) | 9 (17.6%) |
| 25 to 34 Years | 0 (0.0%) | 17 (15.3%) |
| 35 to 44 Years | 0 (0.0%) | 0 (0.0%) |
| 45 to 54 Years | 5 (8.9%) | 8 (6.8%) |
| 55 to 64 Years | 6 (8.7%) | 12 (11.9%) |
| 65 to 74 Years | 3 (5.4%) | 2 (2.3%) |
| 75 Years and over | 3 (6.0%) | 3 (7.9%) |
| Total | 39 (5.7%) | 65 (8.9%) |
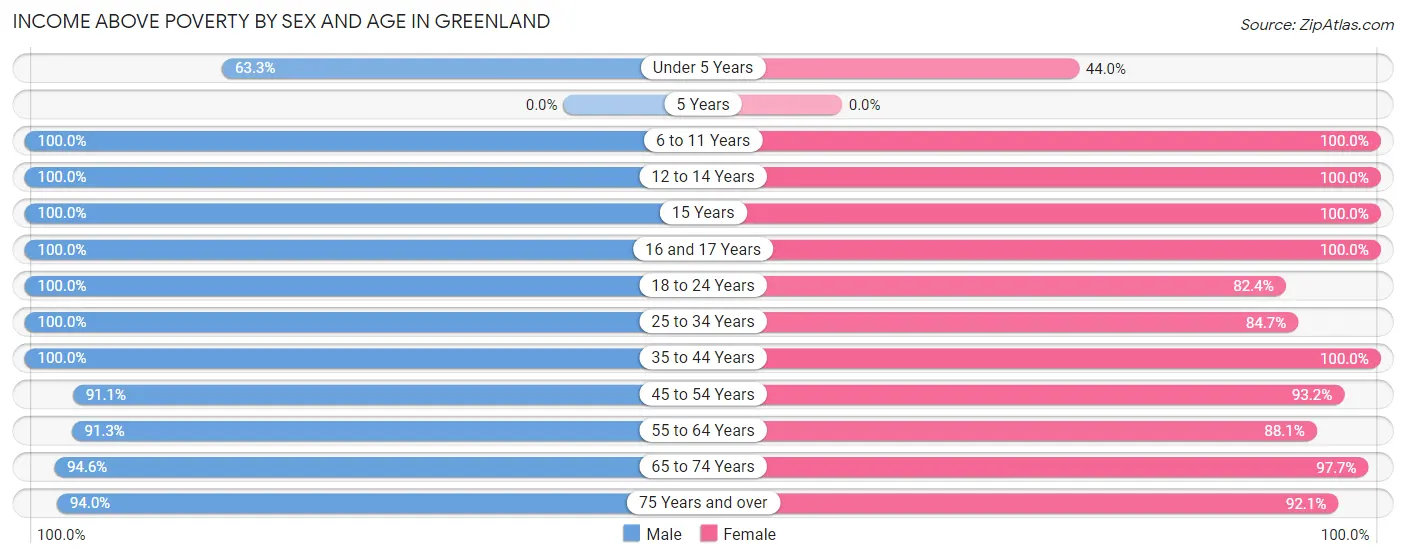
Income Above Poverty by Sex and Age in Greenland
According to the poverty statistics in Greenland, males aged 6 to 11 years and females aged 6 to 11 years are the age groups that are most secure financially, with 100.0% of males and 100.0% of females in these age groups living above the poverty line.
| Age Bracket | Male | Female |
| Under 5 Years | 38 (63.3%) | 11 (44.0%) |
| 5 Years | 0 (0.0%) | 0 (0.0%) |
| 6 to 11 Years | 19 (100.0%) | 28 (100.0%) |
| 12 to 14 Years | 15 (100.0%) | 25 (100.0%) |
| 15 Years | 10 (100.0%) | 12 (100.0%) |
| 16 and 17 Years | 2 (100.0%) | 11 (100.0%) |
| 18 to 24 Years | 142 (100.0%) | 42 (82.4%) |
| 25 to 34 Years | 97 (100.0%) | 94 (84.7%) |
| 35 to 44 Years | 104 (100.0%) | 120 (100.0%) |
| 45 to 54 Years | 51 (91.1%) | 110 (93.2%) |
| 55 to 64 Years | 63 (91.3%) | 89 (88.1%) |
| 65 to 74 Years | 52 (94.6%) | 86 (97.7%) |
| 75 Years and over | 47 (94.0%) | 35 (92.1%) |
| Total | 640 (94.3%) | 663 (91.1%) |
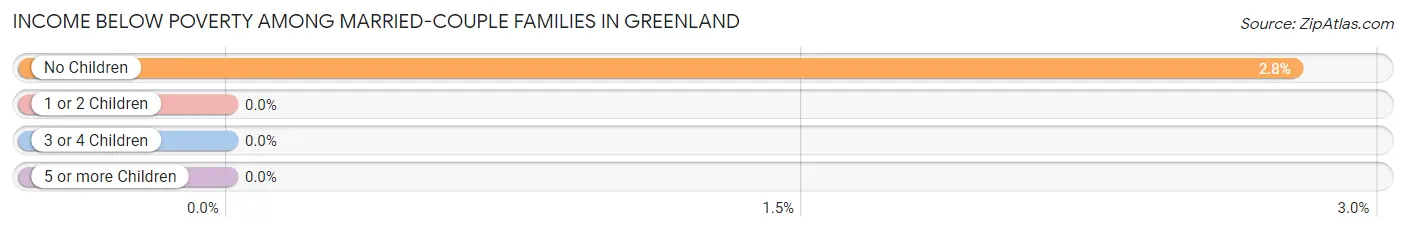
Income Below Poverty Among Married-Couple Families in Greenland
The poverty statistics for married-couple families in Greenland show that 1.9% or 5 of the total 256 families live below the poverty line. Families with no children have the highest poverty rate of 2.8%, comprising of 5 families. On the other hand, families with 1 or 2 children have the lowest poverty rate of 0.0%, which includes 0 families.
| Children | Above Poverty | Below Poverty |
| No Children | 175 (97.2%) | 5 (2.8%) |
| 1 or 2 Children | 68 (100.0%) | 0 (0.0%) |
| 3 or 4 Children | 8 (100.0%) | 0 (0.0%) |
| 5 or more Children | 0 (0.0%) | 0 (0.0%) |
| Total | 251 (98.1%) | 5 (1.9%) |
Income Below Poverty Among Single-Parent Households in Greenland
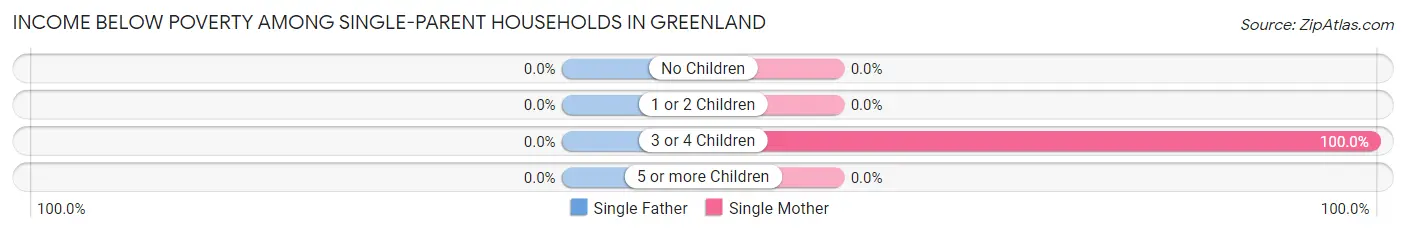
| Children | Single Father | Single Mother |
| No Children | 0 (0.0%) | 0 (0.0%) |
| 1 or 2 Children | 0 (0.0%) | 0 (0.0%) |
| 3 or 4 Children | 0 (0.0%) | 13 (100.0%) |
| 5 or more Children | 0 (0.0%) | 0 (0.0%) |
| Total | 0 (0.0%) | 13 (15.7%) |
Income Below Poverty Among Married-Couple vs Single-Parent Households in Greenland
The poverty data for Greenland shows that 5 of the married-couple family households (1.9%) and 13 of the single-parent households (12.8%) are living below the poverty level. Within the married-couple family households, those with no children have the highest poverty rate, with 5 households (2.8%) falling below the poverty line. Among the single-parent households, those with 3 or 4 children have the highest poverty rate, with 13 household (100.0%) living below poverty.
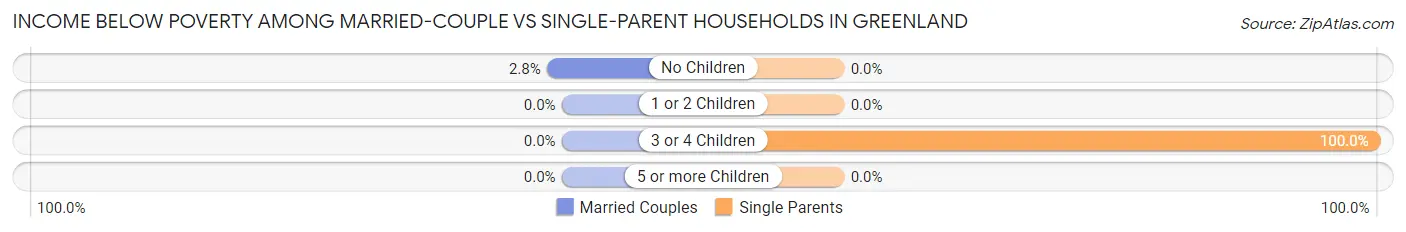
| Children | Married-Couple Families | Single-Parent Households |
| No Children | 5 (2.8%) | 0 (0.0%) |
| 1 or 2 Children | 0 (0.0%) | 0 (0.0%) |
| 3 or 4 Children | 0 (0.0%) | 13 (100.0%) |
| 5 or more Children | 0 (0.0%) | 0 (0.0%) |
| Total | 5 (1.9%) | 13 (12.8%) |
Race in Greenland
The most populous races in Greenland are White / Caucasian (1,170 | 82.2%), Two or more Races (161 | 11.3%), and Black / African American (61 | 4.3%).
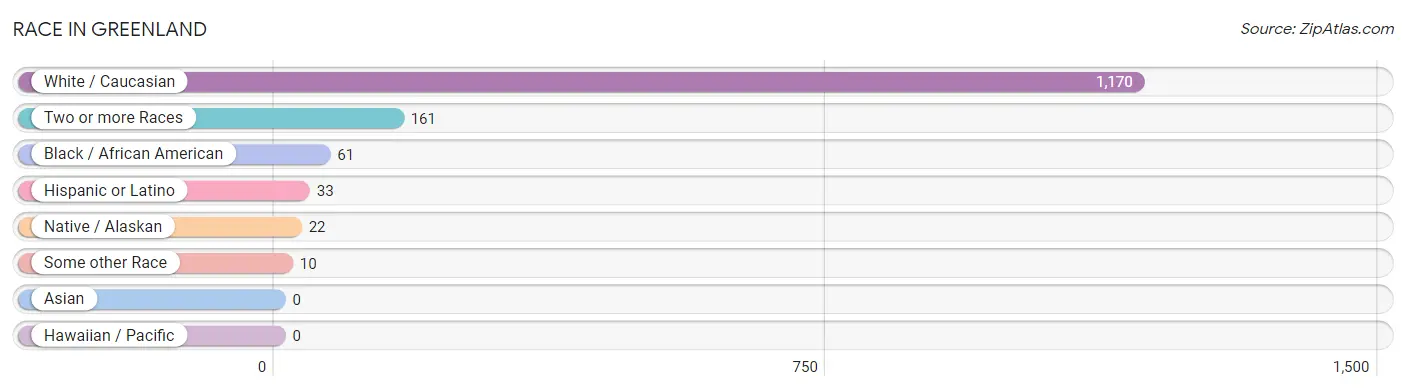
| Race | # Population | % Population |
| Asian | 0 | 0.0% |
| Black / African American | 61 | 4.3% |
| Hawaiian / Pacific | 0 | 0.0% |
| Hispanic or Latino | 33 | 2.3% |
| Native / Alaskan | 22 | 1.5% |
| White / Caucasian | 1,170 | 82.2% |
| Two or more Races | 161 | 11.3% |
| Some other Race | 10 | 0.7% |
| Total | 1,424 | 100.0% |
Ancestry in Greenland
The most populous ancestries reported in Greenland are Irish (253 | 17.8%), German (174 | 12.2%), American (153 | 10.7%), English (124 | 8.7%), and Dutch (56 | 3.9%), together accounting for 53.4% of all Greenland residents.
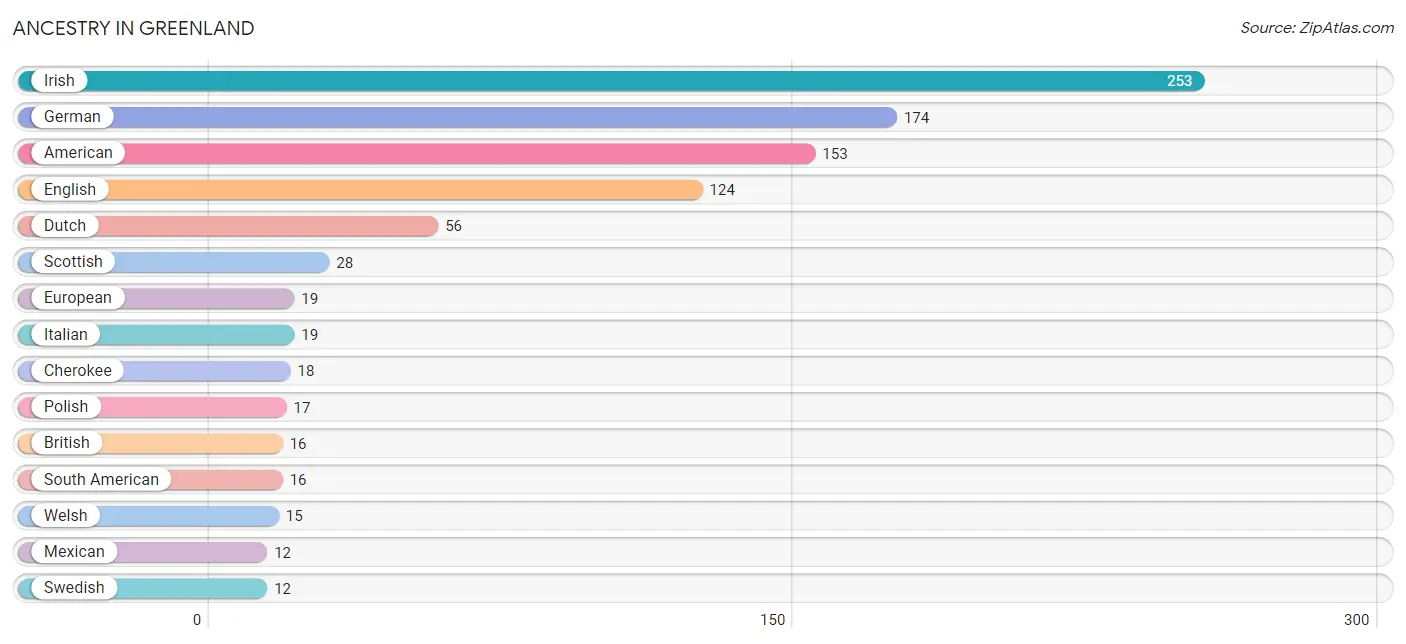
| Ancestry | # Population | % Population |
| African | 7 | 0.5% |
| American | 153 | 10.7% |
| Blackfeet | 3 | 0.2% |
| British | 16 | 1.1% |
| Cherokee | 18 | 1.3% |
| Choctaw | 3 | 0.2% |
| Colombian | 10 | 0.7% |
| Cuban | 3 | 0.2% |
| Czech | 4 | 0.3% |
| Danish | 3 | 0.2% |
| Dutch | 56 | 3.9% |
| English | 124 | 8.7% |
| Estonian | 4 | 0.3% |
| European | 19 | 1.3% |
| French | 6 | 0.4% |
| French Canadian | 3 | 0.2% |
| German | 174 | 12.2% |
| Greek | 4 | 0.3% |
| Irish | 253 | 17.8% |
| Italian | 19 | 1.3% |
| Mexican | 12 | 0.8% |
| Peruvian | 6 | 0.4% |
| Polish | 17 | 1.2% |
| Romanian | 1 | 0.1% |
| Russian | 8 | 0.6% |
| Scotch-Irish | 10 | 0.7% |
| Scottish | 28 | 2.0% |
| Slovak | 11 | 0.8% |
| South American | 16 | 1.1% |
| Subsaharan African | 7 | 0.5% |
| Swedish | 12 | 0.8% |
| Thai | 4 | 0.3% |
| Welsh | 15 | 1.1% | View All 33 Rows |
Immigrants in Greenland
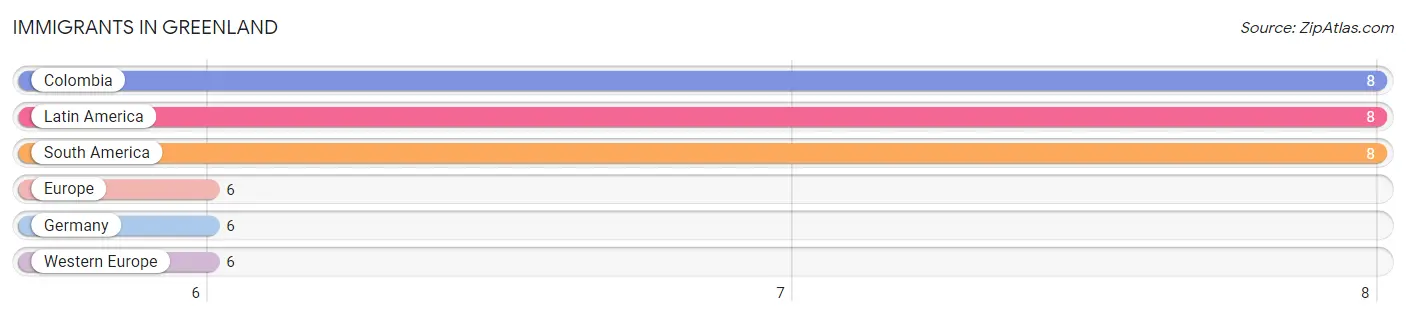
The most numerous immigrant groups reported in Greenland came from Colombia (8 | 0.6%), Latin America (8 | 0.6%), South America (8 | 0.6%), Europe (6 | 0.4%), and Germany (6 | 0.4%), together accounting for 2.5% of all Greenland residents.
| Immigration Origin | # Population | % Population |
| Colombia | 8 | 0.6% |
| Europe | 6 | 0.4% |
| Germany | 6 | 0.4% |
| Latin America | 8 | 0.6% |
| South America | 8 | 0.6% |
| Western Europe | 6 | 0.4% | View All 6 Rows |
Sex and Age in Greenland
Sex and Age in Greenland
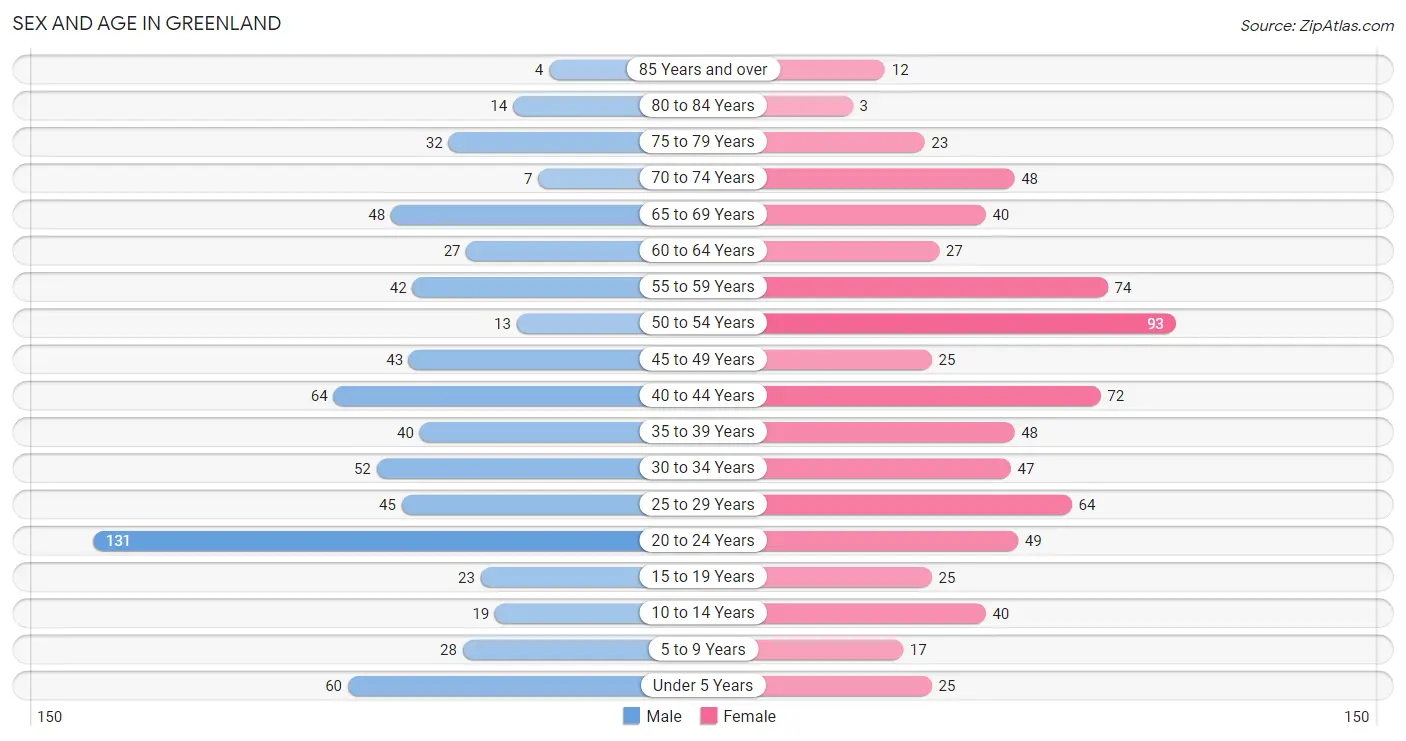
The most populous age groups in Greenland are 20 to 24 Years (131 | 18.9%) for men and 50 to 54 Years (93 | 12.7%) for women.
| Age Bracket | Male | Female |
| Under 5 Years | 60 (8.7%) | 25 (3.4%) |
| 5 to 9 Years | 28 (4.1%) | 17 (2.3%) |
| 10 to 14 Years | 19 (2.8%) | 40 (5.5%) |
| 15 to 19 Years | 23 (3.3%) | 25 (3.4%) |
| 20 to 24 Years | 131 (18.9%) | 49 (6.7%) |
| 25 to 29 Years | 45 (6.5%) | 64 (8.7%) |
| 30 to 34 Years | 52 (7.5%) | 47 (6.4%) |
| 35 to 39 Years | 40 (5.8%) | 48 (6.6%) |
| 40 to 44 Years | 64 (9.2%) | 72 (9.8%) |
| 45 to 49 Years | 43 (6.2%) | 25 (3.4%) |
| 50 to 54 Years | 13 (1.9%) | 93 (12.7%) |
| 55 to 59 Years | 42 (6.1%) | 74 (10.1%) |
| 60 to 64 Years | 27 (3.9%) | 27 (3.7%) |
| 65 to 69 Years | 48 (6.9%) | 40 (5.5%) |
| 70 to 74 Years | 7 (1.0%) | 48 (6.6%) |
| 75 to 79 Years | 32 (4.6%) | 23 (3.1%) |
| 80 to 84 Years | 14 (2.0%) | 3 (0.4%) |
| 85 Years and over | 4 (0.6%) | 12 (1.6%) |
| Total | 692 (100.0%) | 732 (100.0%) |
Families and Households in Greenland
Median Family Size in Greenland
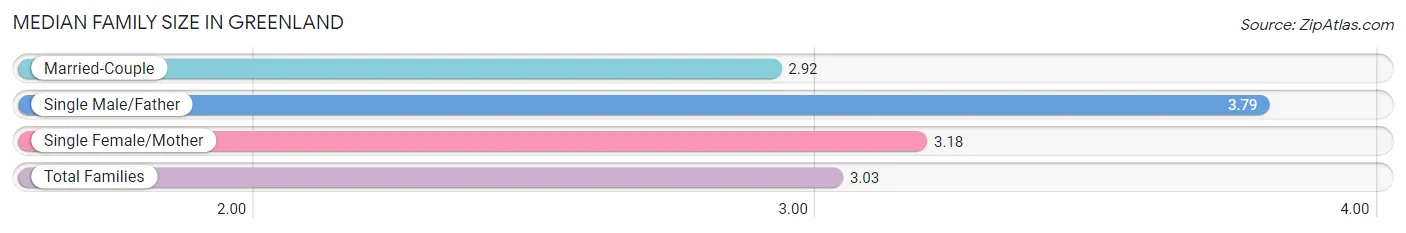
The median family size in Greenland is 3.03 persons per family, with single male/father families (19 | 5.3%) accounting for the largest median family size of 3.79 persons per family. On the other hand, married-couple families (256 | 71.5%) represent the smallest median family size with 2.92 persons per family.
| Family Type | # Families | Family Size |
| Married-Couple | 256 (71.5%) | 2.92 |
| Single Male/Father | 19 (5.3%) | 3.79 |
| Single Female/Mother | 83 (23.2%) | 3.18 |
| Total Families | 358 (100.0%) | 3.03 |
Median Household Size in Greenland
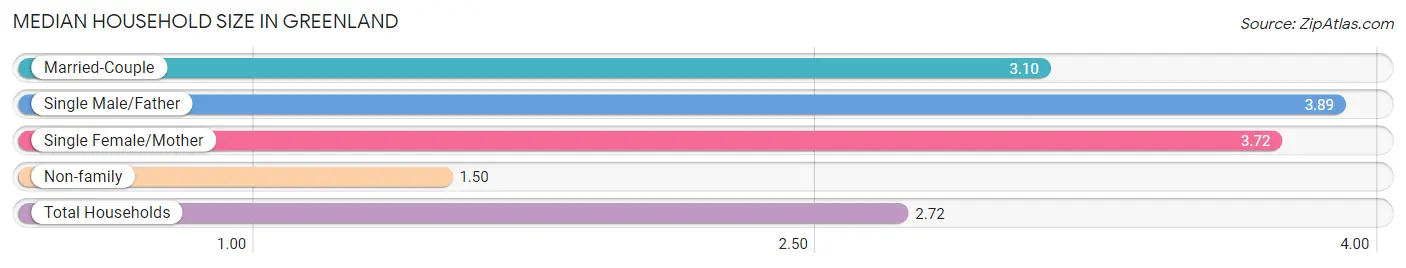
The median household size in Greenland is 2.72 persons per household, with single male/father households (19 | 3.6%) accounting for the largest median household size of 3.89 persons per household. non-family households (165 | 31.6%) represent the smallest median household size with 1.50 persons per household.
| Household Type | # Households | Household Size |
| Married-Couple | 256 (48.9%) | 3.10 |
| Single Male/Father | 19 (3.6%) | 3.89 |
| Single Female/Mother | 83 (15.9%) | 3.72 |
| Non-family | 165 (31.6%) | 1.50 |
| Total Households | 523 (100.0%) | 2.72 |
Household Size by Marriage Status in Greenland
Out of a total of 523 households in Greenland, 358 (68.4%) are family households, while 165 (31.6%) are nonfamily households. The most numerous type of family households are 2-person households, comprising 146, and the most common type of nonfamily households are 1-person households, comprising 119.
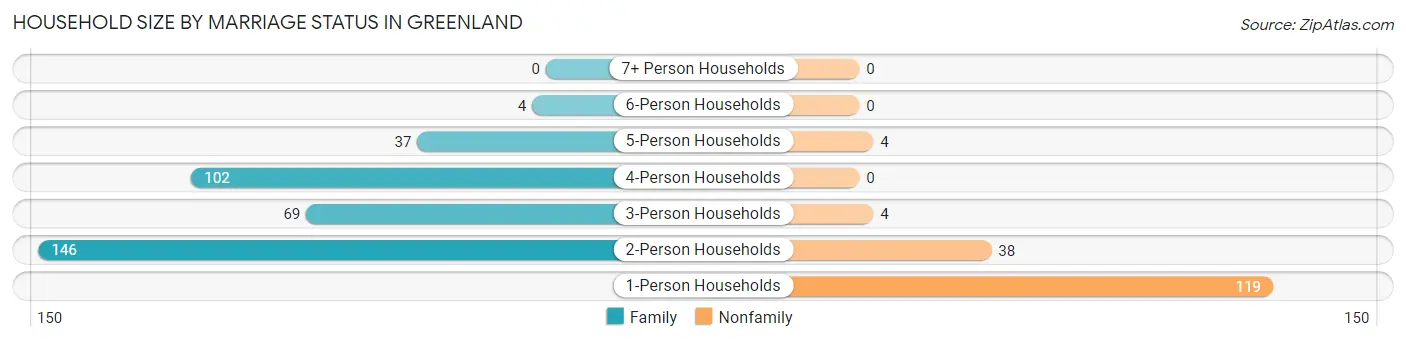
| Household Size | Family Households | Nonfamily Households |
| 1-Person Households | - | 119 (22.8%) |
| 2-Person Households | 146 (27.9%) | 38 (7.3%) |
| 3-Person Households | 69 (13.2%) | 4 (0.8%) |
| 4-Person Households | 102 (19.5%) | 0 (0.0%) |
| 5-Person Households | 37 (7.1%) | 4 (0.8%) |
| 6-Person Households | 4 (0.8%) | 0 (0.0%) |
| 7+ Person Households | 0 (0.0%) | 0 (0.0%) |
| Total | 358 (68.4%) | 165 (31.6%) |
Female Fertility in Greenland
Fertility by Age in Greenland
Average fertility rate in Greenland is 87.0 births per 1,000 women. Women in the age bracket of 20 to 34 years have the highest fertility rate with 188.0 births per 1,000 women. Women in the age bracket of 20 to 34 years acount for 100.0% of all women with births.
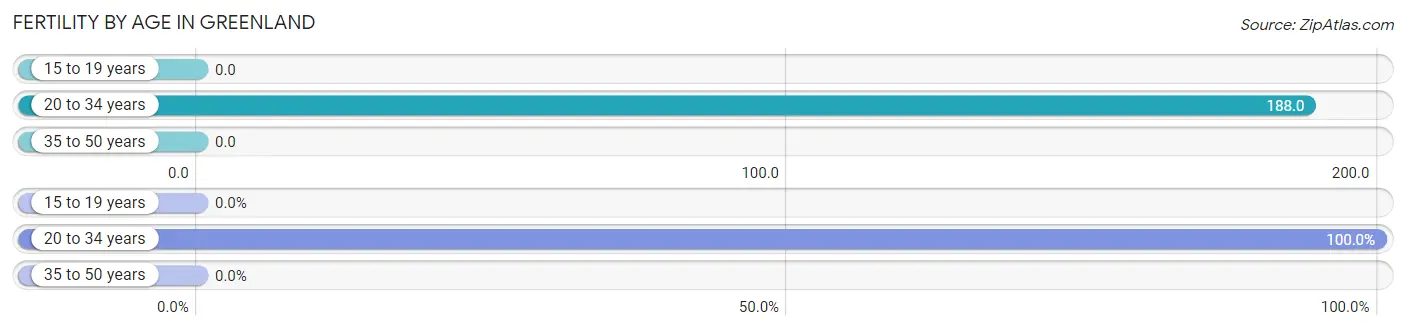
| Age Bracket | Women with Births | Births / 1,000 Women |
| 15 to 19 years | 0 (0.0%) | 0.0 |
| 20 to 34 years | 30 (100.0%) | 188.0 |
| 35 to 50 years | 0 (0.0%) | 0.0 |
| Total | 30 (100.0%) | 87.0 |
Fertility by Age by Marriage Status in Greenland
40.0% of women with births (30) in Greenland are married. The highest percentage of unmarried women with births falls into 20 to 34 years age bracket with 60.0% of them unmarried at the time of birth, while the lowest percentage of unmarried women with births belong to 20 to 34 years age bracket with 60.0% of them unmarried.
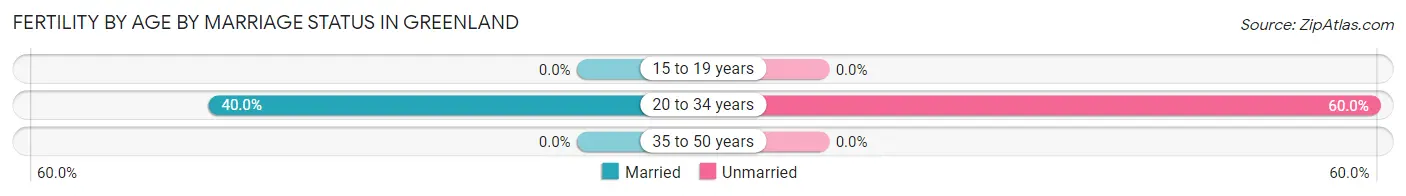
| Age Bracket | Married | Unmarried |
| 15 to 19 years | 0 (0.0%) | 0 (0.0%) |
| 20 to 34 years | 12 (40.0%) | 18 (60.0%) |
| 35 to 50 years | 0 (0.0%) | 0 (0.0%) |
| Total | 12 (40.0%) | 18 (60.0%) |
Fertility by Education in Greenland
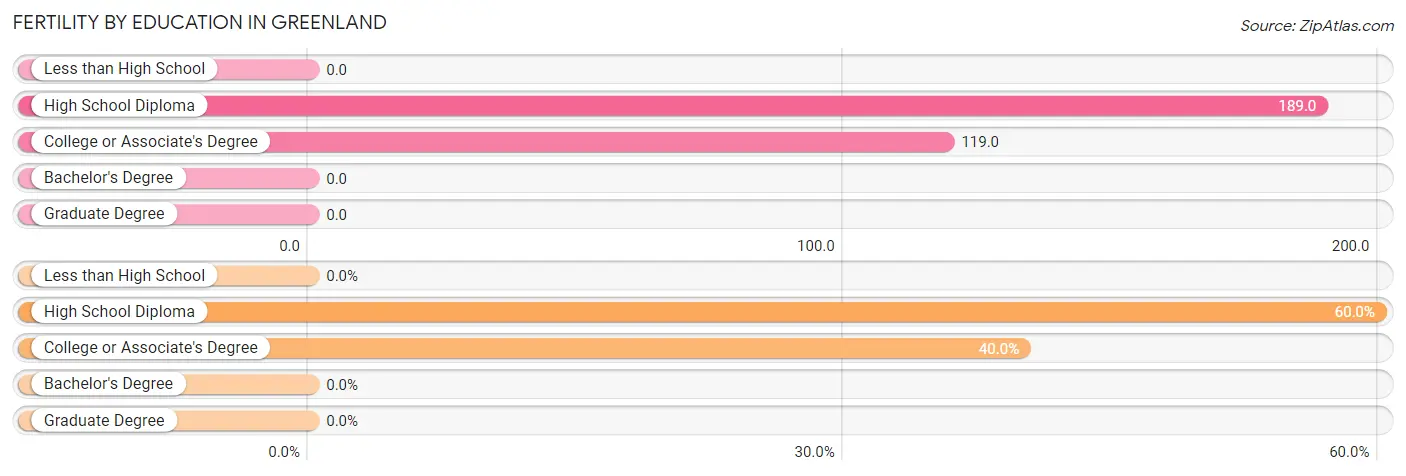
| Educational Attainment | Women with Births | Births / 1,000 Women |
| Less than High School | 0 (0.0%) | 0.0 |
| High School Diploma | 18 (60.0%) | 189.0 |
| College or Associate's Degree | 12 (40.0%) | 119.0 |
| Bachelor's Degree | 0 (0.0%) | 0.0 |
| Graduate Degree | 0 (0.0%) | 0.0 |
| Total | 30 (100.0%) | 87.0 |
Fertility by Education by Marriage Status in Greenland
60.0% of women with births in Greenland are unmarried. Women with the educational attainment of college or associate's degree are most likely to be married with 100.0% of them married at childbirth, while women with the educational attainment of high school diploma are least likely to be married with 100.0% of them unmarried at childbirth.
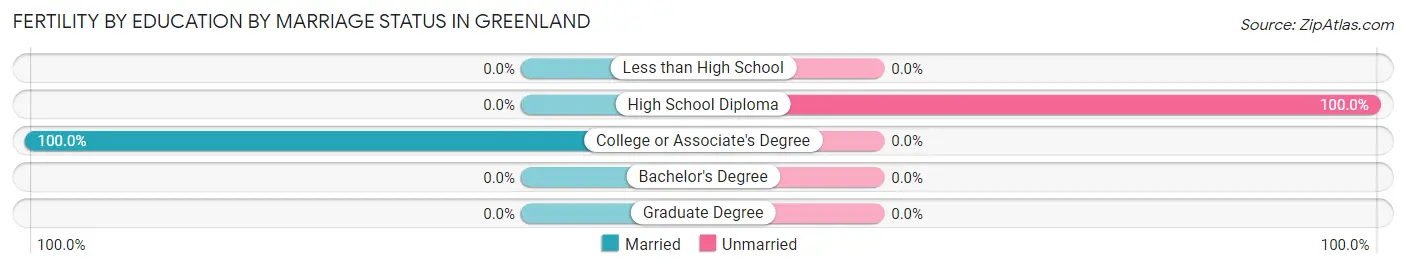
| Educational Attainment | Married | Unmarried |
| Less than High School | 0 (0.0%) | 0 (0.0%) |
| High School Diploma | 0 (0.0%) | 18 (100.0%) |
| College or Associate's Degree | 12 (100.0%) | 0 (0.0%) |
| Bachelor's Degree | 0 (0.0%) | 0 (0.0%) |
| Graduate Degree | 0 (0.0%) | 0 (0.0%) |
| Total | 12 (40.0%) | 18 (60.0%) |
Employment Characteristics in Greenland
Employment by Class of Employer in Greenland
Among the 772 employed individuals in Greenland, private company employees (510 | 66.1%), state government employees (84 | 10.9%), and local government employees (79 | 10.2%) make up the most common classes of employment.
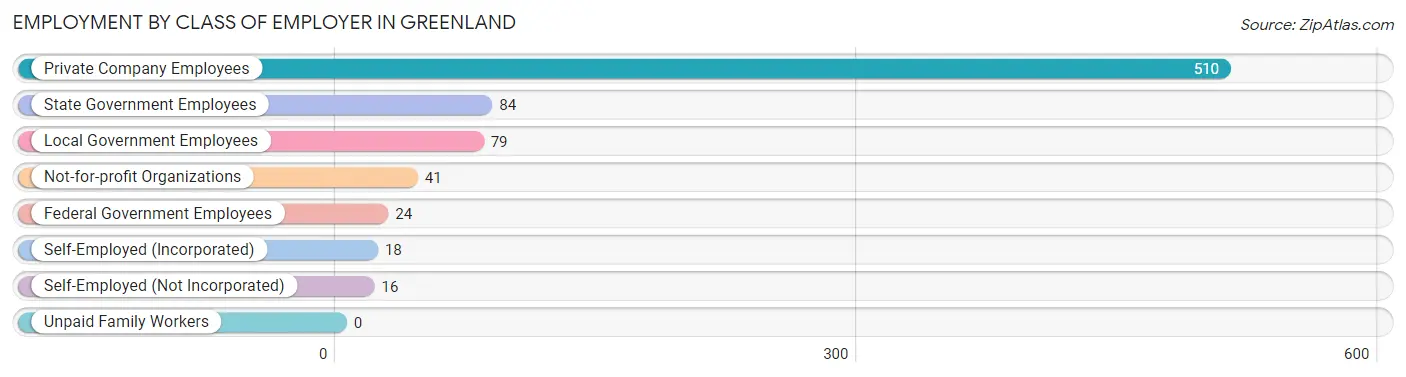
| Employer Class | # Employees | % Employees |
| Private Company Employees | 510 | 66.1% |
| Self-Employed (Incorporated) | 18 | 2.3% |
| Self-Employed (Not Incorporated) | 16 | 2.1% |
| Not-for-profit Organizations | 41 | 5.3% |
| Local Government Employees | 79 | 10.2% |
| State Government Employees | 84 | 10.9% |
| Federal Government Employees | 24 | 3.1% |
| Unpaid Family Workers | 0 | 0.0% |
| Total | 772 | 100.0% |
Employment Status by Age in Greenland
According to the labor force statistics for Greenland, out of the total population over 16 years of age (1,213), 70.3% or 853 individuals are in the labor force, with 3.2% or 27 of them unemployed. The age group with the highest labor force participation rate is 35 to 44 years, with 96.9% or 217 individuals in the labor force. Within the labor force, the 16 to 19 years age range has the highest percentage of unemployed individuals, with 68.8% or 11 of them being unemployed.
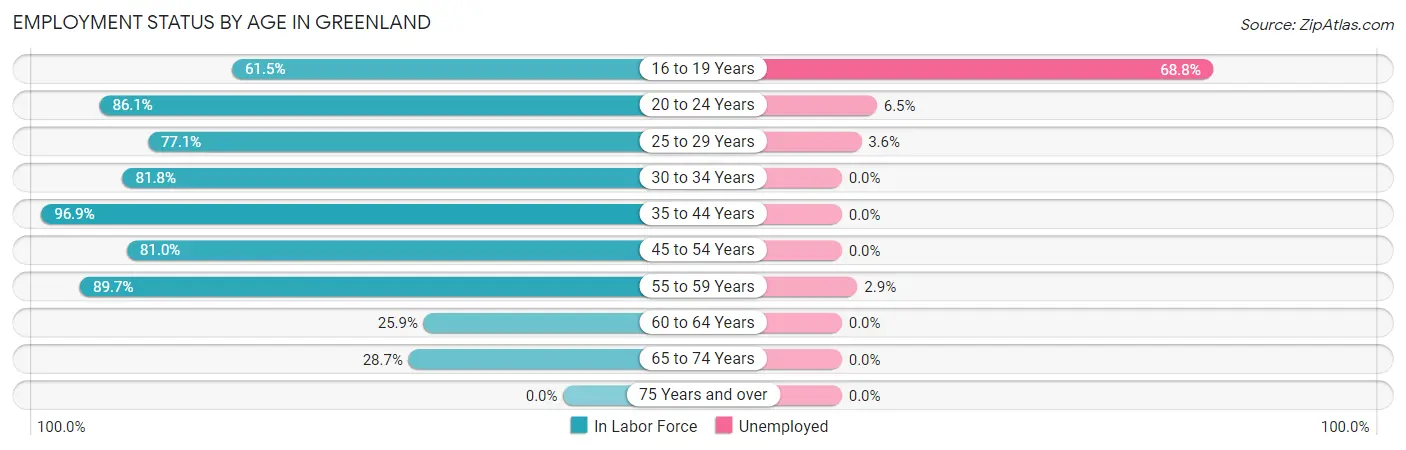
| Age Bracket | In Labor Force | Unemployed |
| 16 to 19 Years | 16 (61.5%) | 11 (68.8%) |
| 20 to 24 Years | 155 (86.1%) | 10 (6.5%) |
| 25 to 29 Years | 84 (77.1%) | 3 (3.6%) |
| 30 to 34 Years | 81 (81.8%) | 0 (0.0%) |
| 35 to 44 Years | 217 (96.9%) | 0 (0.0%) |
| 45 to 54 Years | 141 (81.0%) | 0 (0.0%) |
| 55 to 59 Years | 104 (89.7%) | 3 (2.9%) |
| 60 to 64 Years | 14 (25.9%) | 0 (0.0%) |
| 65 to 74 Years | 41 (28.7%) | 0 (0.0%) |
| 75 Years and over | 0 (0.0%) | 0 (0.0%) |
| Total | 853 (70.3%) | 27 (3.2%) |
Employment Status by Educational Attainment in Greenland
According to labor force statistics for Greenland, 82.6% of individuals (641) out of the total population between 25 and 64 years of age (776) are in the labor force, with 0.9% or 6 of them being unemployed. The group with the highest labor force participation rate are those with the educational attainment of bachelor's degree or higher, with 91.6% or 218 individuals in the labor force. Within the labor force, individuals with high school diploma education have the highest percentage of unemployment, with 1.4% or 3 of them being unemployed.
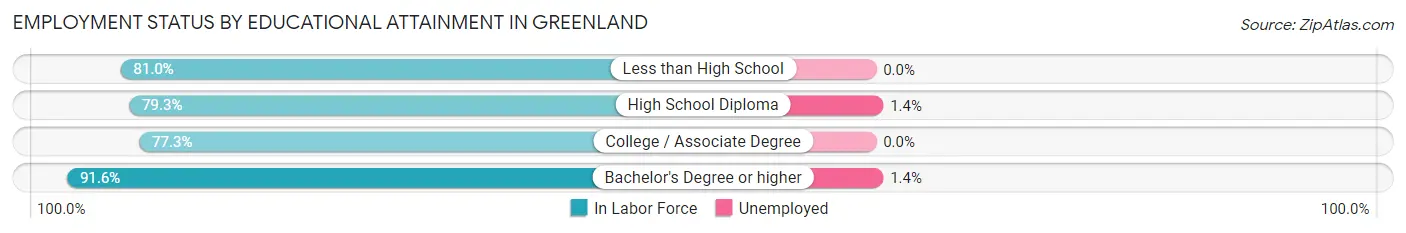
| Educational Attainment | In Labor Force | Unemployed |
| Less than High School | 34 (81.0%) | 0 (0.0%) |
| High School Diploma | 222 (79.3%) | 4 (1.4%) |
| College / Associate Degree | 167 (77.3%) | 0 (0.0%) |
| Bachelor's Degree or higher | 218 (91.6%) | 3 (1.4%) |
| Total | 641 (82.6%) | 7 (0.9%) |
Employment Occupations by Sex in Greenland
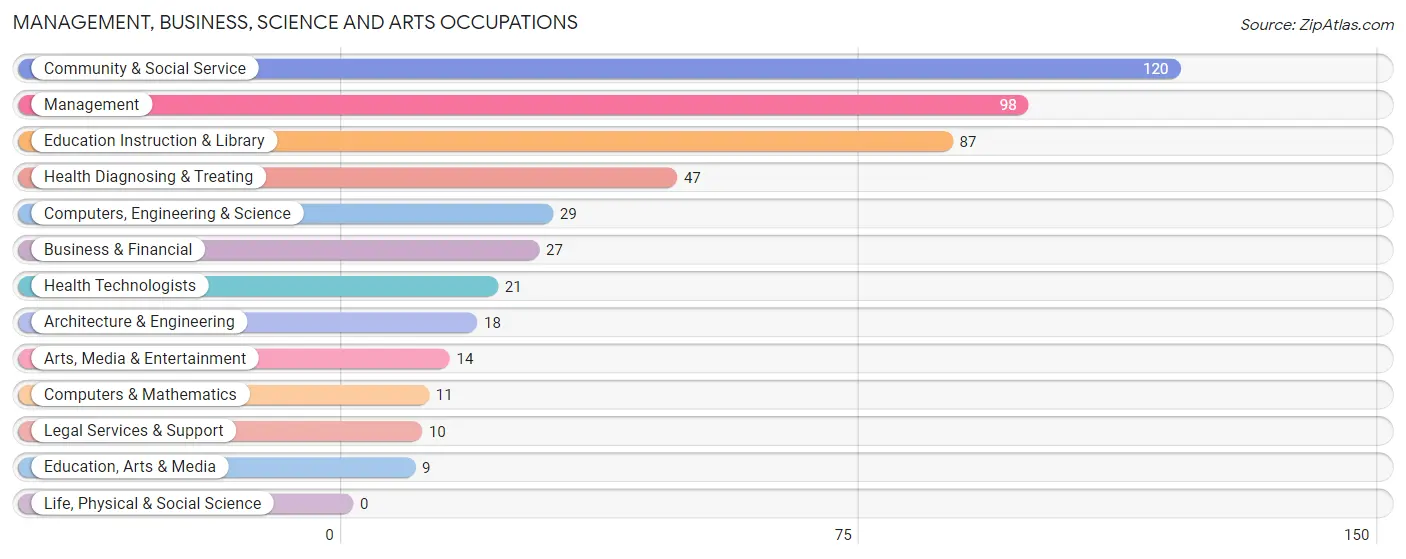
Management, Business, Science and Arts Occupations
The most common Management, Business, Science and Arts occupations in Greenland are Community & Social Service (120 | 14.5%), Management (98 | 11.9%), Education Instruction & Library (87 | 10.5%), Health Diagnosing & Treating (47 | 5.7%), and Computers, Engineering & Science (29 | 3.5%).
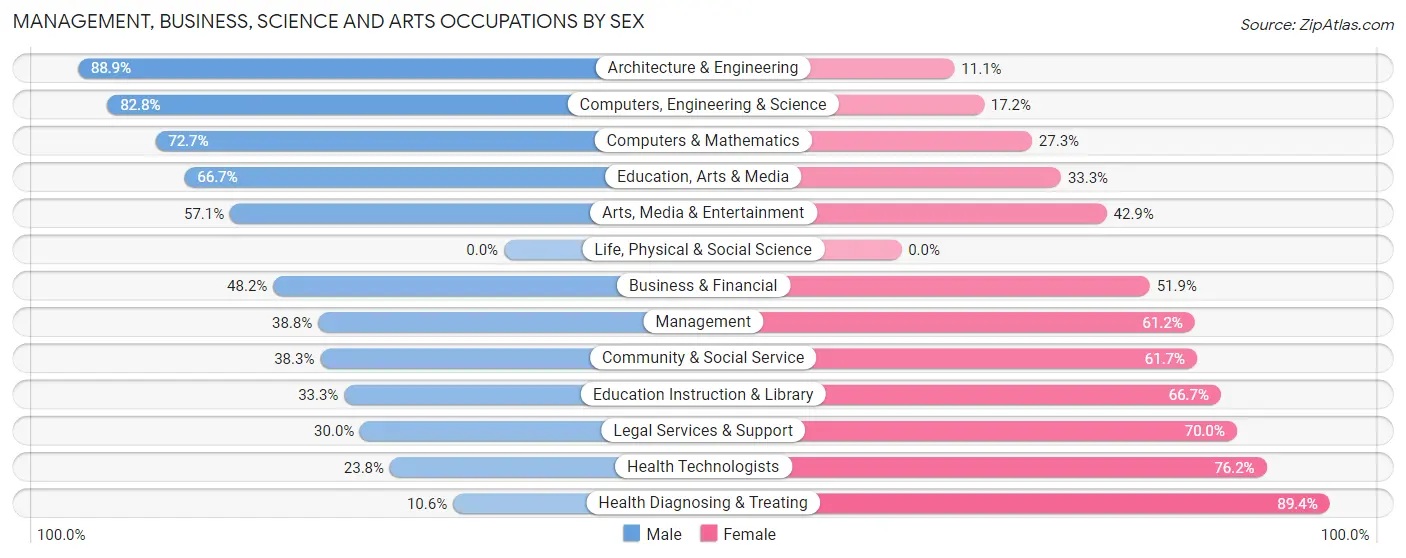
Management, Business, Science and Arts Occupations by Sex
Within the Management, Business, Science and Arts occupations in Greenland, the most male-oriented occupations are Architecture & Engineering (88.9%), Computers, Engineering & Science (82.8%), and Computers & Mathematics (72.7%), while the most female-oriented occupations are Health Diagnosing & Treating (89.4%), Health Technologists (76.2%), and Legal Services & Support (70.0%).
| Occupation | Male | Female |
| Management | 38 (38.8%) | 60 (61.2%) |
| Business & Financial | 13 (48.1%) | 14 (51.8%) |
| Computers, Engineering & Science | 24 (82.8%) | 5 (17.2%) |
| Computers & Mathematics | 8 (72.7%) | 3 (27.3%) |
| Architecture & Engineering | 16 (88.9%) | 2 (11.1%) |
| Life, Physical & Social Science | 0 (0.0%) | 0 (0.0%) |
| Community & Social Service | 46 (38.3%) | 74 (61.7%) |
| Education, Arts & Media | 6 (66.7%) | 3 (33.3%) |
| Legal Services & Support | 3 (30.0%) | 7 (70.0%) |
| Education Instruction & Library | 29 (33.3%) | 58 (66.7%) |
| Arts, Media & Entertainment | 8 (57.1%) | 6 (42.9%) |
| Health Diagnosing & Treating | 5 (10.6%) | 42 (89.4%) |
| Health Technologists | 5 (23.8%) | 16 (76.2%) |
| Total (Category) | 126 (39.3%) | 195 (60.8%) |
| Total (Overall) | 427 (51.7%) | 399 (48.3%) |
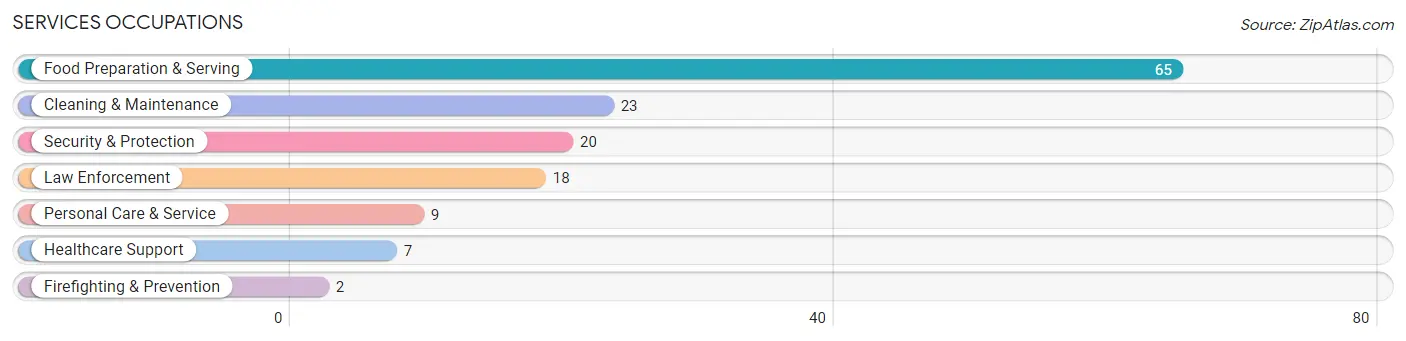
Services Occupations
The most common Services occupations in Greenland are Food Preparation & Serving (65 | 7.9%), Cleaning & Maintenance (23 | 2.8%), Security & Protection (20 | 2.4%), Law Enforcement (18 | 2.2%), and Personal Care & Service (9 | 1.1%).
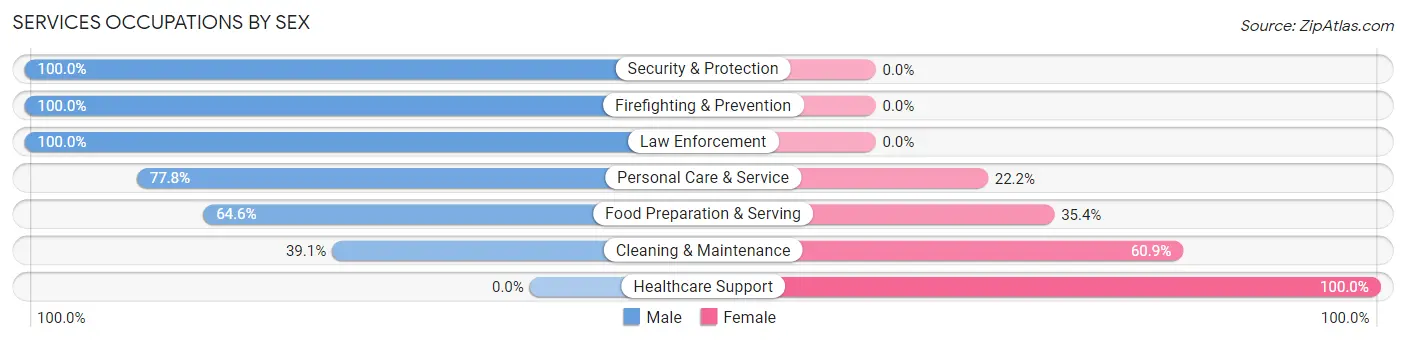
Services Occupations by Sex
Within the Services occupations in Greenland, the most male-oriented occupations are Security & Protection (100.0%), Firefighting & Prevention (100.0%), and Law Enforcement (100.0%), while the most female-oriented occupations are Healthcare Support (100.0%), Cleaning & Maintenance (60.9%), and Food Preparation & Serving (35.4%).
| Occupation | Male | Female |
| Healthcare Support | 0 (0.0%) | 7 (100.0%) |
| Security & Protection | 20 (100.0%) | 0 (0.0%) |
| Firefighting & Prevention | 2 (100.0%) | 0 (0.0%) |
| Law Enforcement | 18 (100.0%) | 0 (0.0%) |
| Food Preparation & Serving | 42 (64.6%) | 23 (35.4%) |
| Cleaning & Maintenance | 9 (39.1%) | 14 (60.9%) |
| Personal Care & Service | 7 (77.8%) | 2 (22.2%) |
| Total (Category) | 78 (62.9%) | 46 (37.1%) |
| Total (Overall) | 427 (51.7%) | 399 (48.3%) |
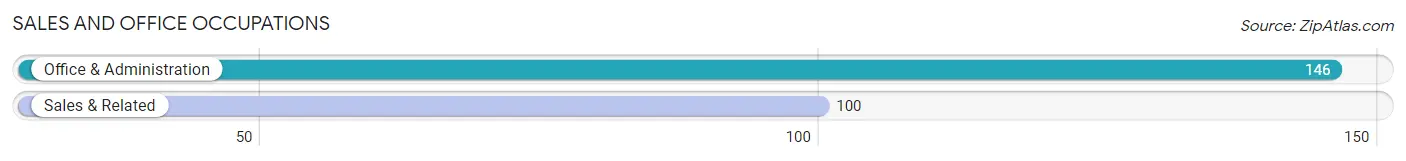
Sales and Office Occupations
The most common Sales and Office occupations in Greenland are Office & Administration (146 | 17.7%), and Sales & Related (100 | 12.1%).
Sales and Office Occupations by Sex
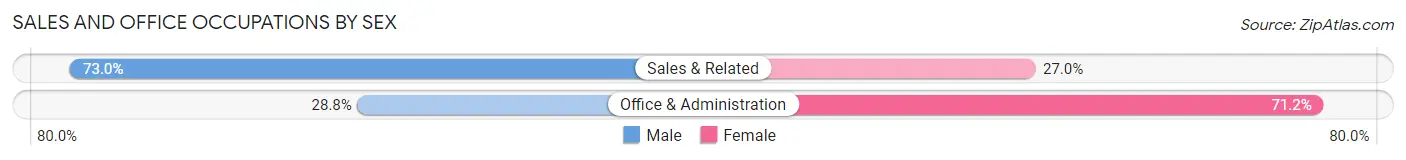
| Occupation | Male | Female |
| Sales & Related | 73 (73.0%) | 27 (27.0%) |
| Office & Administration | 42 (28.8%) | 104 (71.2%) |
| Total (Category) | 115 (46.8%) | 131 (53.2%) |
| Total (Overall) | 427 (51.7%) | 399 (48.3%) |
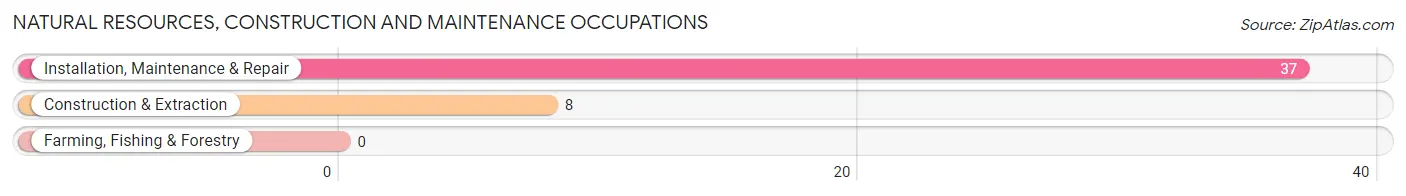
Natural Resources, Construction and Maintenance Occupations
The most common Natural Resources, Construction and Maintenance occupations in Greenland are Installation, Maintenance & Repair (37 | 4.5%), and Construction & Extraction (8 | 1.0%).
Natural Resources, Construction and Maintenance Occupations by Sex
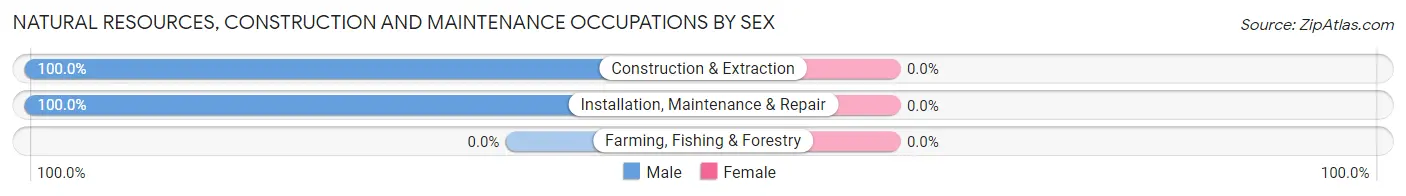
| Occupation | Male | Female |
| Farming, Fishing & Forestry | 0 (0.0%) | 0 (0.0%) |
| Construction & Extraction | 8 (100.0%) | 0 (0.0%) |
| Installation, Maintenance & Repair | 37 (100.0%) | 0 (0.0%) |
| Total (Category) | 45 (100.0%) | 0 (0.0%) |
| Total (Overall) | 427 (51.7%) | 399 (48.3%) |
Production, Transportation and Moving Occupations
The most common Production, Transportation and Moving occupations in Greenland are Material Moving (42 | 5.1%), Production (29 | 3.5%), and Transportation (19 | 2.3%).
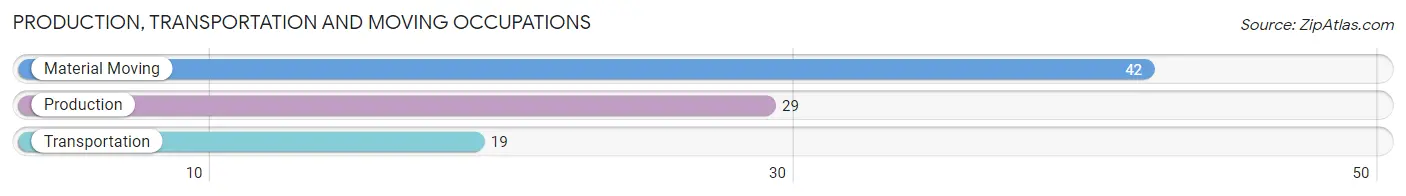
Production, Transportation and Moving Occupations by Sex
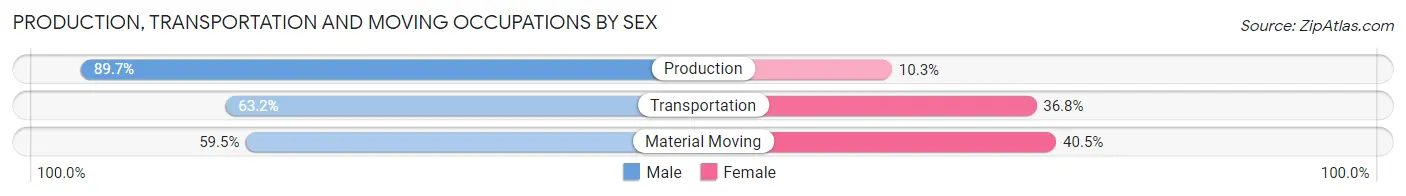
| Occupation | Male | Female |
| Production | 26 (89.7%) | 3 (10.3%) |
| Transportation | 12 (63.2%) | 7 (36.8%) |
| Material Moving | 25 (59.5%) | 17 (40.5%) |
| Total (Category) | 63 (70.0%) | 27 (30.0%) |
| Total (Overall) | 427 (51.7%) | 399 (48.3%) |
Employment Industries by Sex in Greenland
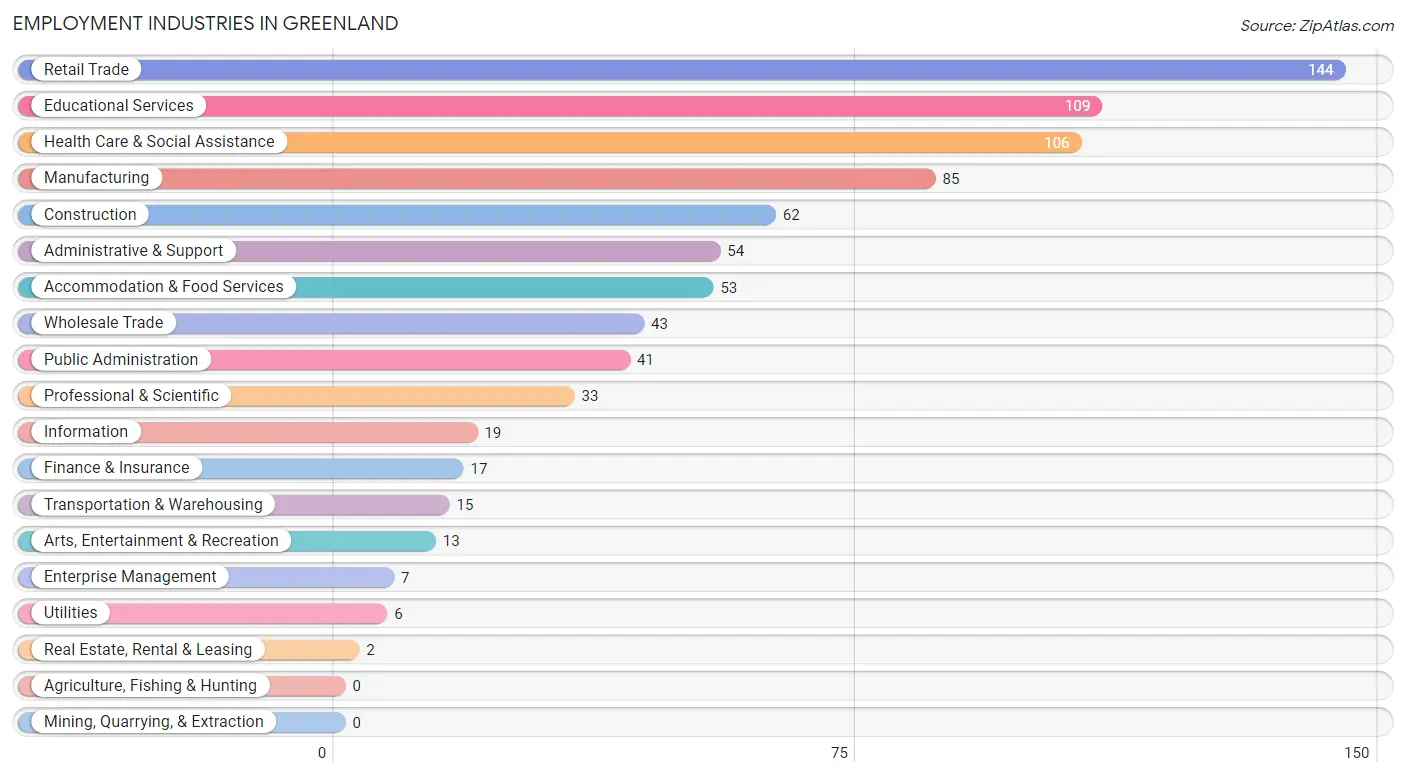
Employment Industries in Greenland
The major employment industries in Greenland include Retail Trade (144 | 17.4%), Educational Services (109 | 13.2%), Health Care & Social Assistance (106 | 12.8%), Manufacturing (85 | 10.3%), and Construction (62 | 7.5%).
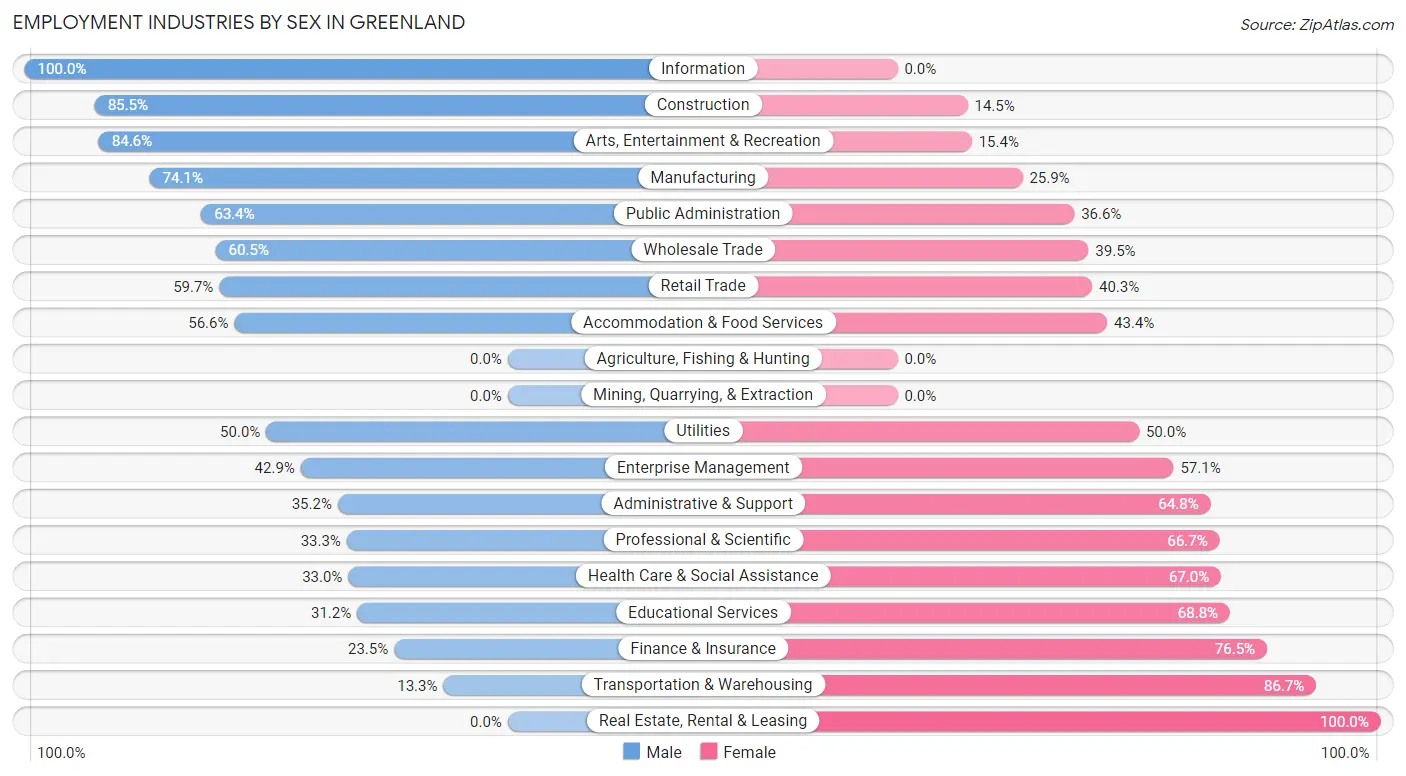
Employment Industries by Sex in Greenland
The Greenland industries that see more men than women are Information (100.0%), Construction (85.5%), and Arts, Entertainment & Recreation (84.6%), whereas the industries that tend to have a higher number of women are Real Estate, Rental & Leasing (100.0%), Transportation & Warehousing (86.7%), and Finance & Insurance (76.5%).
| Industry | Male | Female |
| Agriculture, Fishing & Hunting | 0 (0.0%) | 0 (0.0%) |
| Mining, Quarrying, & Extraction | 0 (0.0%) | 0 (0.0%) |
| Construction | 53 (85.5%) | 9 (14.5%) |
| Manufacturing | 63 (74.1%) | 22 (25.9%) |
| Wholesale Trade | 26 (60.5%) | 17 (39.5%) |
| Retail Trade | 86 (59.7%) | 58 (40.3%) |
| Transportation & Warehousing | 2 (13.3%) | 13 (86.7%) |
| Utilities | 3 (50.0%) | 3 (50.0%) |
| Information | 19 (100.0%) | 0 (0.0%) |
| Finance & Insurance | 4 (23.5%) | 13 (76.5%) |
| Real Estate, Rental & Leasing | 0 (0.0%) | 2 (100.0%) |
| Professional & Scientific | 11 (33.3%) | 22 (66.7%) |
| Enterprise Management | 3 (42.9%) | 4 (57.1%) |
| Administrative & Support | 19 (35.2%) | 35 (64.8%) |
| Educational Services | 34 (31.2%) | 75 (68.8%) |
| Health Care & Social Assistance | 35 (33.0%) | 71 (67.0%) |
| Arts, Entertainment & Recreation | 11 (84.6%) | 2 (15.4%) |
| Accommodation & Food Services | 30 (56.6%) | 23 (43.4%) |
| Public Administration | 26 (63.4%) | 15 (36.6%) |
| Total | 427 (51.7%) | 399 (48.3%) |
Education in Greenland
School Enrollment in Greenland
The most common levels of schooling among the 223 students in Greenland are college / undergraduate (55 | 24.7%), high school (52 | 23.3%), and middle school (41 | 18.4%).
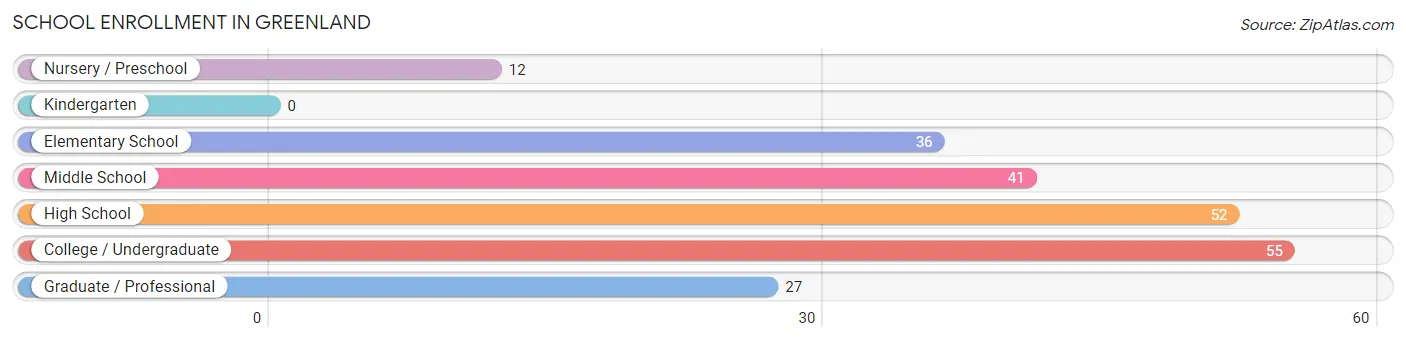
| School Level | # Students | % Students |
| Nursery / Preschool | 12 | 5.4% |
| Kindergarten | 0 | 0.0% |
| Elementary School | 36 | 16.1% |
| Middle School | 41 | 18.4% |
| High School | 52 | 23.3% |
| College / Undergraduate | 55 | 24.7% |
| Graduate / Professional | 27 | 12.1% |
| Total | 223 | 100.0% |
School Enrollment by Age by Funding Source in Greenland
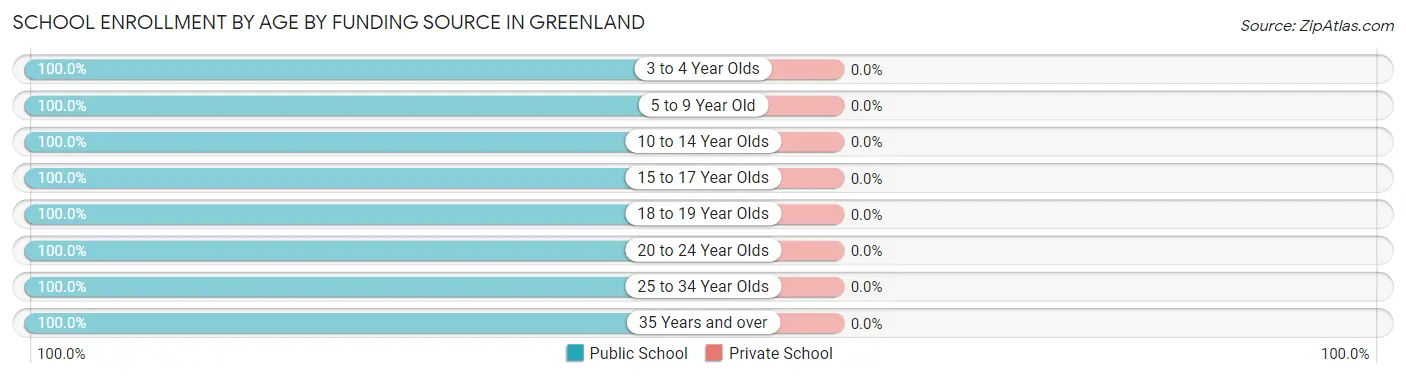
| Age Bracket | Public School | Private School |
| 3 to 4 Year Olds | 3 (100.0%) | 0 (0.0%) |
| 5 to 9 Year Old | 42 (100.0%) | 0 (0.0%) |
| 10 to 14 Year Olds | 59 (100.0%) | 0 (0.0%) |
| 15 to 17 Year Olds | 35 (100.0%) | 0 (0.0%) |
| 18 to 19 Year Olds | 2 (100.0%) | 0 (0.0%) |
| 20 to 24 Year Olds | 24 (100.0%) | 0 (0.0%) |
| 25 to 34 Year Olds | 26 (100.0%) | 0 (0.0%) |
| 35 Years and over | 32 (100.0%) | 0 (0.0%) |
| Total | 223 (100.0%) | 0 (0.0%) |
Educational Attainment by Field of Study in Greenland
Business (54 | 15.8%), education (53 | 15.5%), visual & performing arts (40 | 11.7%), arts & humanities (36 | 10.5%), and literature & languages (29 | 8.5%) are the most common fields of study among 342 individuals in Greenland who have obtained a bachelor's degree or higher.
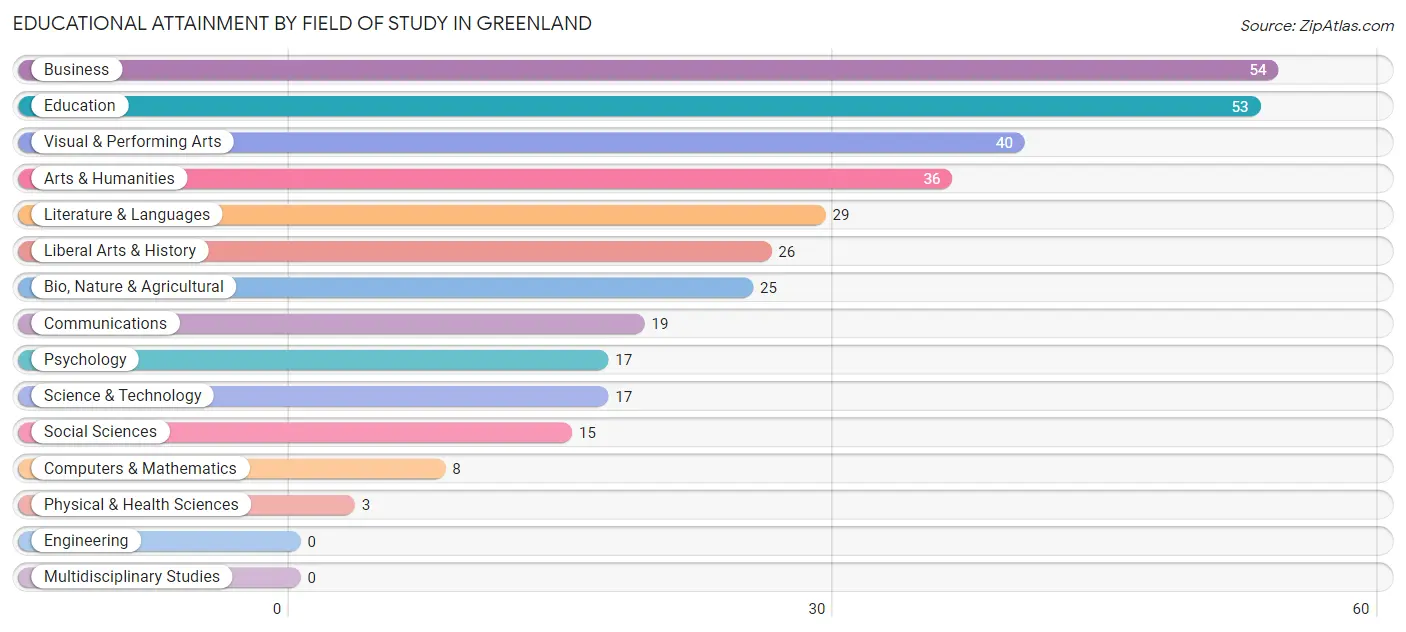
| Field of Study | # Graduates | % Graduates |
| Computers & Mathematics | 8 | 2.3% |
| Bio, Nature & Agricultural | 25 | 7.3% |
| Physical & Health Sciences | 3 | 0.9% |
| Psychology | 17 | 5.0% |
| Social Sciences | 15 | 4.4% |
| Engineering | 0 | 0.0% |
| Multidisciplinary Studies | 0 | 0.0% |
| Science & Technology | 17 | 5.0% |
| Business | 54 | 15.8% |
| Education | 53 | 15.5% |
| Literature & Languages | 29 | 8.5% |
| Liberal Arts & History | 26 | 7.6% |
| Visual & Performing Arts | 40 | 11.7% |
| Communications | 19 | 5.6% |
| Arts & Humanities | 36 | 10.5% |
| Total | 342 | 100.0% |
Transportation & Commute in Greenland
Vehicle Availability by Sex in Greenland
The most prevalent vehicle ownership categories in Greenland are males with 2 vehicles (158, accounting for 39.3%) and females with 2 vehicles (184, making up 42.7%).
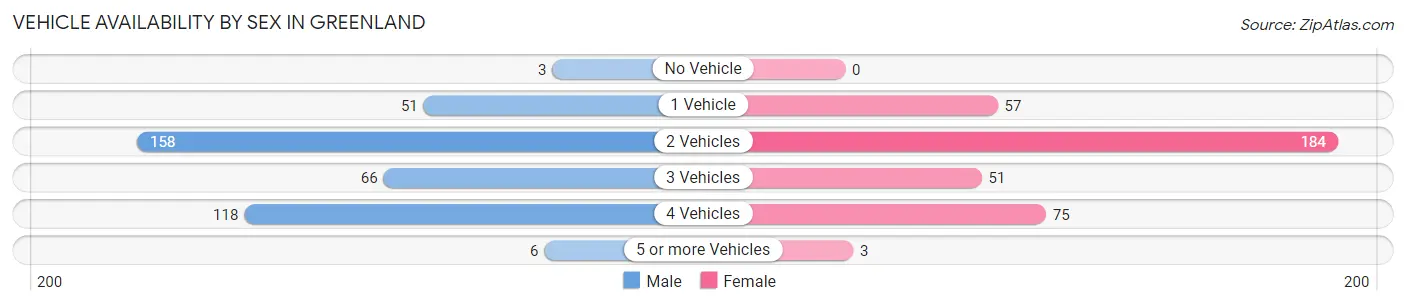
| Vehicles Available | Male | Female |
| No Vehicle | 3 (0.7%) | 0 (0.0%) |
| 1 Vehicle | 51 (12.7%) | 57 (15.4%) |
| 2 Vehicles | 158 (39.3%) | 184 (49.7%) |
| 3 Vehicles | 66 (16.4%) | 51 (13.8%) |
| 4 Vehicles | 118 (29.3%) | 75 (20.3%) |
| 5 or more Vehicles | 6 (1.5%) | 3 (0.8%) |
| Total | 402 (100.0%) | 370 (100.0%) |
Commute Time in Greenland
The most frequently occuring commute durations in Greenland are 15 to 19 minutes (157 commuters, 24.1%), 10 to 14 minutes (133 commuters, 20.4%), and 20 to 24 minutes (92 commuters, 14.1%).
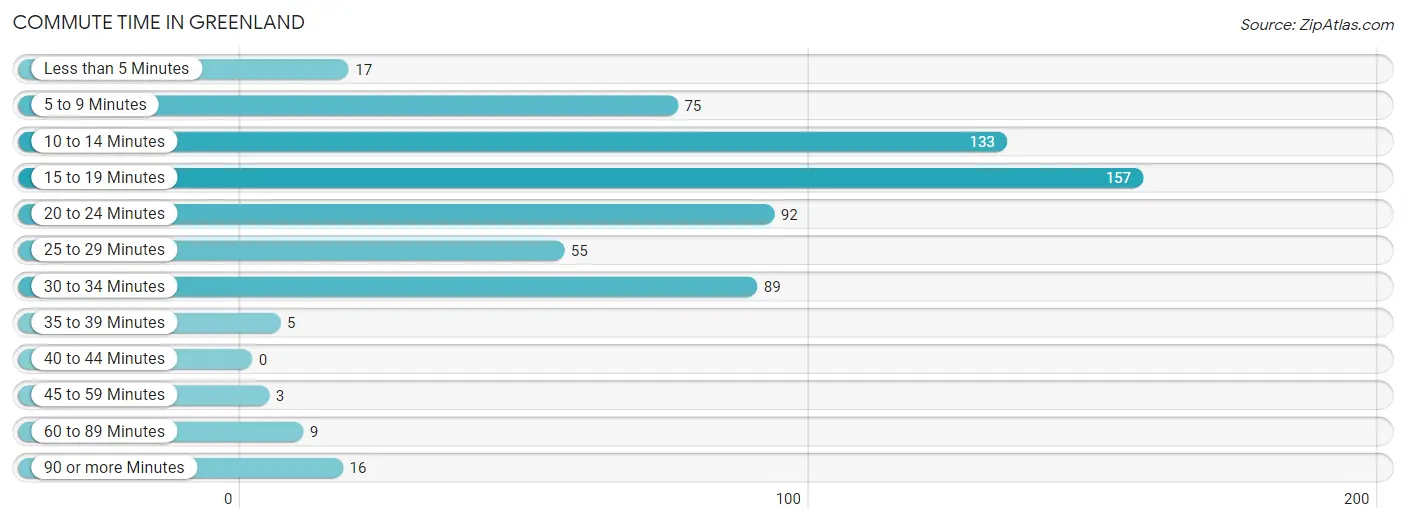
| Commute Time | # Commuters | % Commuters |
| Less than 5 Minutes | 17 | 2.6% |
| 5 to 9 Minutes | 75 | 11.5% |
| 10 to 14 Minutes | 133 | 20.4% |
| 15 to 19 Minutes | 157 | 24.1% |
| 20 to 24 Minutes | 92 | 14.1% |
| 25 to 29 Minutes | 55 | 8.5% |
| 30 to 34 Minutes | 89 | 13.7% |
| 35 to 39 Minutes | 5 | 0.8% |
| 40 to 44 Minutes | 0 | 0.0% |
| 45 to 59 Minutes | 3 | 0.5% |
| 60 to 89 Minutes | 9 | 1.4% |
| 90 or more Minutes | 16 | 2.5% |
Commute Time by Sex in Greenland
The most common commute times in Greenland are 15 to 19 minutes (92 commuters, 27.1%) for males and 10 to 14 minutes (82 commuters, 26.3%) for females.
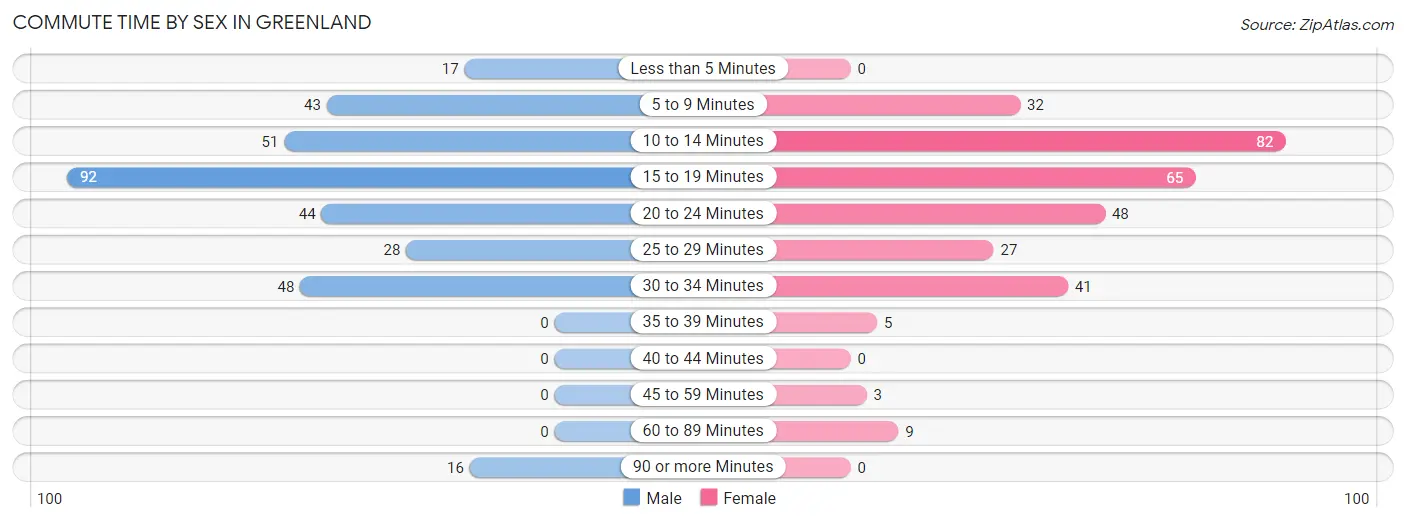
| Commute Time | Male | Female |
| Less than 5 Minutes | 17 (5.0%) | 0 (0.0%) |
| 5 to 9 Minutes | 43 (12.7%) | 32 (10.3%) |
| 10 to 14 Minutes | 51 (15.0%) | 82 (26.3%) |
| 15 to 19 Minutes | 92 (27.1%) | 65 (20.8%) |
| 20 to 24 Minutes | 44 (13.0%) | 48 (15.4%) |
| 25 to 29 Minutes | 28 (8.3%) | 27 (8.6%) |
| 30 to 34 Minutes | 48 (14.2%) | 41 (13.1%) |
| 35 to 39 Minutes | 0 (0.0%) | 5 (1.6%) |
| 40 to 44 Minutes | 0 (0.0%) | 0 (0.0%) |
| 45 to 59 Minutes | 0 (0.0%) | 3 (1.0%) |
| 60 to 89 Minutes | 0 (0.0%) | 9 (2.9%) |
| 90 or more Minutes | 16 (4.7%) | 0 (0.0%) |
Time of Departure to Work by Sex in Greenland
The most frequent times of departure to work in Greenland are 7:30 AM to 7:59 AM (56, 16.5%) for males and 7:30 AM to 7:59 AM (114, 36.5%) for females.
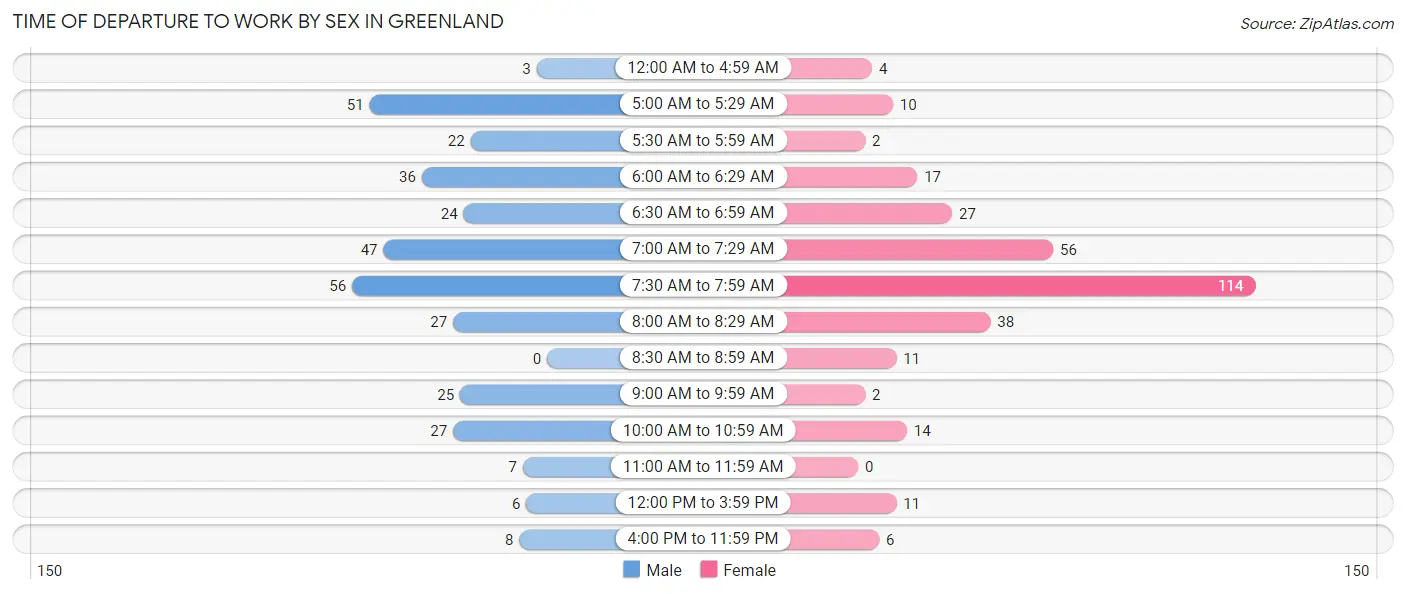
| Time of Departure | Male | Female |
| 12:00 AM to 4:59 AM | 3 (0.9%) | 4 (1.3%) |
| 5:00 AM to 5:29 AM | 51 (15.0%) | 10 (3.2%) |
| 5:30 AM to 5:59 AM | 22 (6.5%) | 2 (0.6%) |
| 6:00 AM to 6:29 AM | 36 (10.6%) | 17 (5.4%) |
| 6:30 AM to 6:59 AM | 24 (7.1%) | 27 (8.6%) |
| 7:00 AM to 7:29 AM | 47 (13.9%) | 56 (17.9%) |
| 7:30 AM to 7:59 AM | 56 (16.5%) | 114 (36.5%) |
| 8:00 AM to 8:29 AM | 27 (8.0%) | 38 (12.2%) |
| 8:30 AM to 8:59 AM | 0 (0.0%) | 11 (3.5%) |
| 9:00 AM to 9:59 AM | 25 (7.4%) | 2 (0.6%) |
| 10:00 AM to 10:59 AM | 27 (8.0%) | 14 (4.5%) |
| 11:00 AM to 11:59 AM | 7 (2.1%) | 0 (0.0%) |
| 12:00 PM to 3:59 PM | 6 (1.8%) | 11 (3.5%) |
| 4:00 PM to 11:59 PM | 8 (2.4%) | 6 (1.9%) |
| Total | 339 (100.0%) | 312 (100.0%) |
Housing Occupancy in Greenland
Occupancy by Ownership in Greenland
Of the total 523 dwellings in Greenland, owner-occupied units account for 382 (73.0%), while renter-occupied units make up 141 (27.0%).
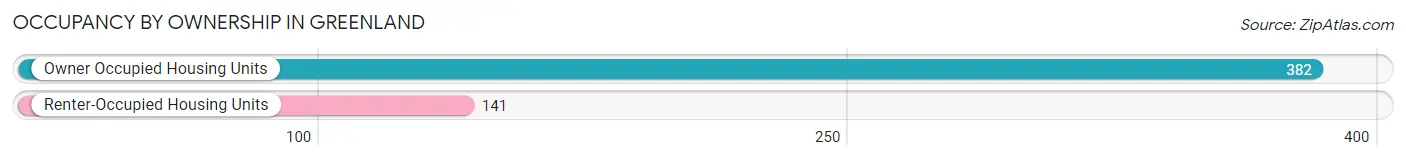
| Occupancy | # Housing Units | % Housing Units |
| Owner Occupied Housing Units | 382 | 73.0% |
| Renter-Occupied Housing Units | 141 | 27.0% |
| Total Occupied Housing Units | 523 | 100.0% |
Occupancy by Household Size in Greenland
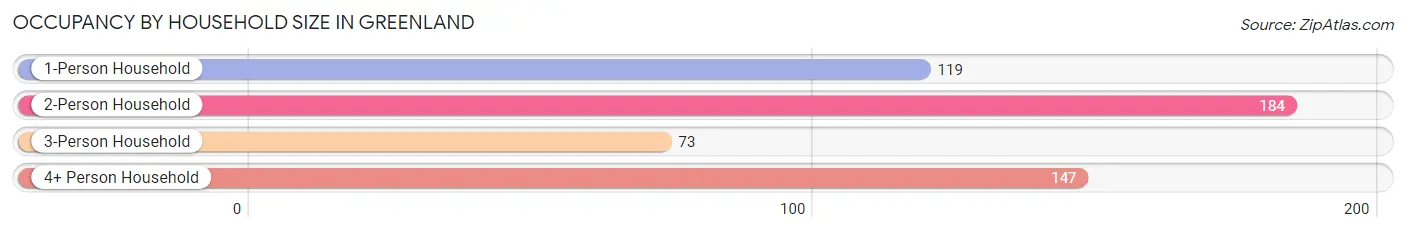
| Household Size | # Housing Units | % Housing Units |
| 1-Person Household | 119 | 22.8% |
| 2-Person Household | 184 | 35.2% |
| 3-Person Household | 73 | 14.0% |
| 4+ Person Household | 147 | 28.1% |
| Total Housing Units | 523 | 100.0% |
Occupancy by Ownership by Household Size in Greenland
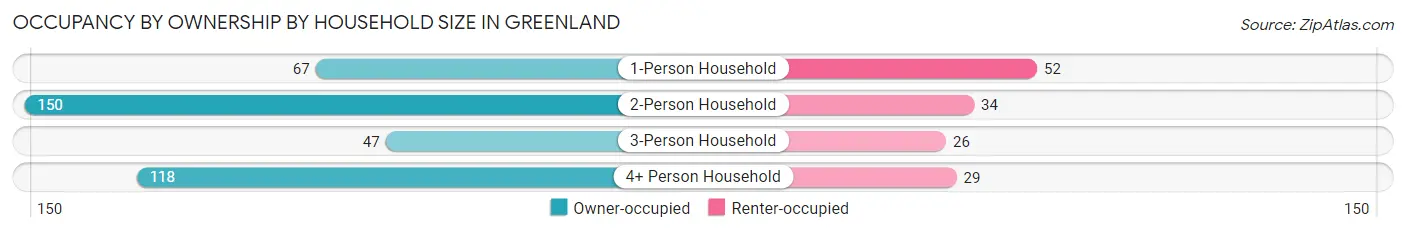
| Household Size | Owner-occupied | Renter-occupied |
| 1-Person Household | 67 (56.3%) | 52 (43.7%) |
| 2-Person Household | 150 (81.5%) | 34 (18.5%) |
| 3-Person Household | 47 (64.4%) | 26 (35.6%) |
| 4+ Person Household | 118 (80.3%) | 29 (19.7%) |
| Total Housing Units | 382 (73.0%) | 141 (27.0%) |
Occupancy by Educational Attainment in Greenland
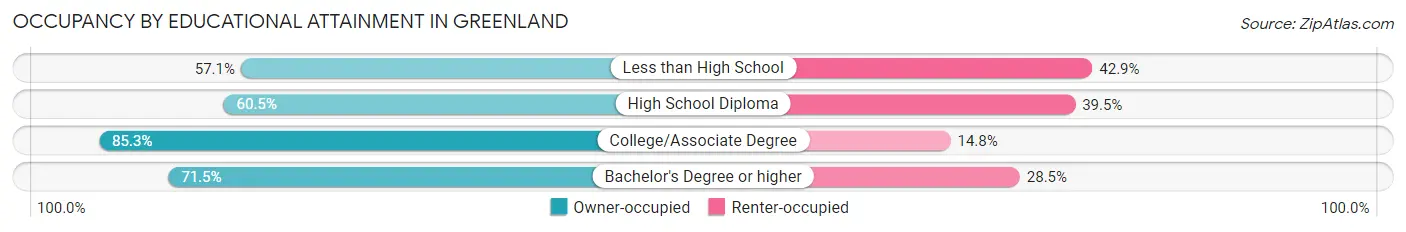
| Household Size | Owner-occupied | Renter-occupied |
| Less than High School | 4 (57.1%) | 3 (42.9%) |
| High School Diploma | 89 (60.5%) | 58 (39.5%) |
| College/Associate Degree | 156 (85.3%) | 27 (14.7%) |
| Bachelor's Degree or higher | 133 (71.5%) | 53 (28.5%) |
Occupancy by Age of Householder in Greenland
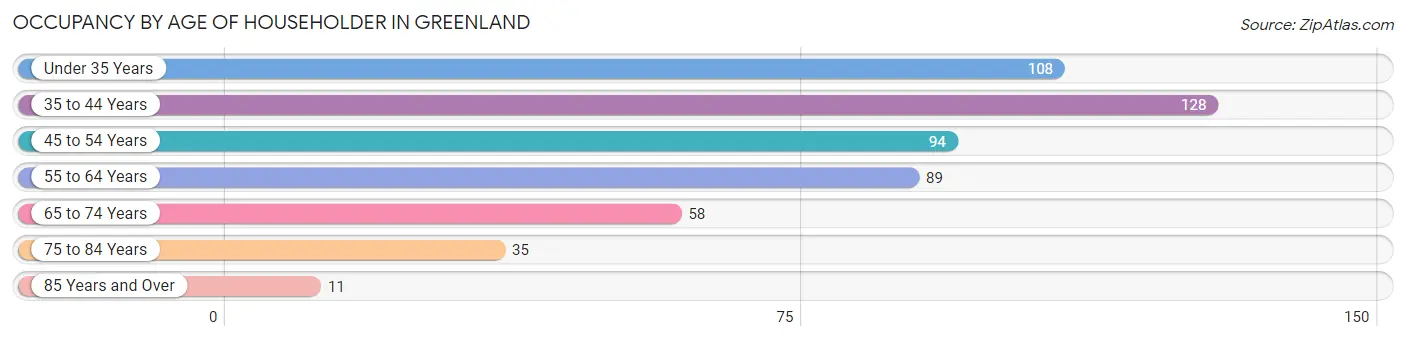
| Age Bracket | # Households | % Households |
| Under 35 Years | 108 | 20.6% |
| 35 to 44 Years | 128 | 24.5% |
| 45 to 54 Years | 94 | 18.0% |
| 55 to 64 Years | 89 | 17.0% |
| 65 to 74 Years | 58 | 11.1% |
| 75 to 84 Years | 35 | 6.7% |
| 85 Years and Over | 11 | 2.1% |
| Total | 523 | 100.0% |
Housing Finances in Greenland
Median Income by Occupancy in Greenland
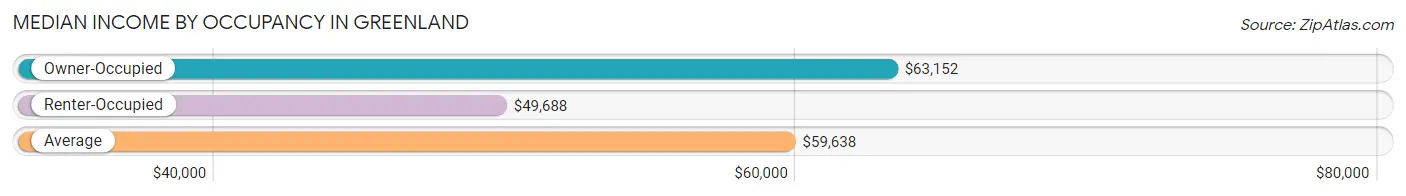
| Occupancy Type | # Households | Median Income |
| Owner-Occupied | 382 (73.0%) | $63,152 |
| Renter-Occupied | 141 (27.0%) | $49,688 |
| Average | 523 (100.0%) | $59,638 |
Occupancy by Householder Income Bracket in Greenland
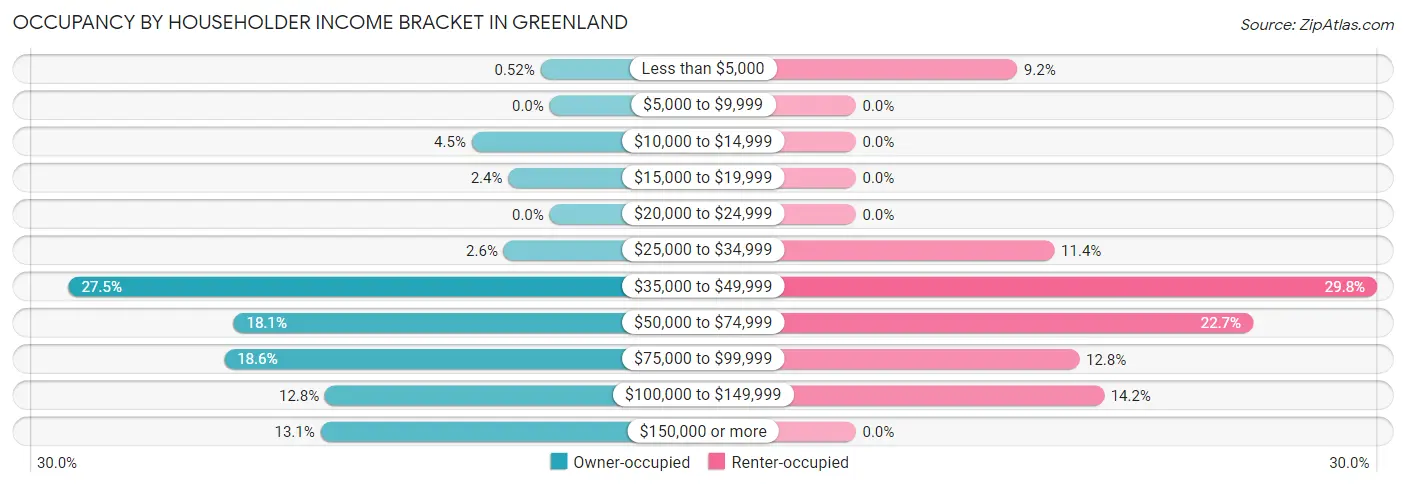
| Income Bracket | Owner-occupied | Renter-occupied |
| Less than $5,000 | 2 (0.5%) | 13 (9.2%) |
| $5,000 to $9,999 | 0 (0.0%) | 0 (0.0%) |
| $10,000 to $14,999 | 17 (4.4%) | 0 (0.0%) |
| $15,000 to $19,999 | 9 (2.4%) | 0 (0.0%) |
| $20,000 to $24,999 | 0 (0.0%) | 0 (0.0%) |
| $25,000 to $34,999 | 10 (2.6%) | 16 (11.4%) |
| $35,000 to $49,999 | 105 (27.5%) | 42 (29.8%) |
| $50,000 to $74,999 | 69 (18.1%) | 32 (22.7%) |
| $75,000 to $99,999 | 71 (18.6%) | 18 (12.8%) |
| $100,000 to $149,999 | 49 (12.8%) | 20 (14.2%) |
| $150,000 or more | 50 (13.1%) | 0 (0.0%) |
| Total | 382 (100.0%) | 141 (100.0%) |
Monthly Housing Cost Tiers in Greenland
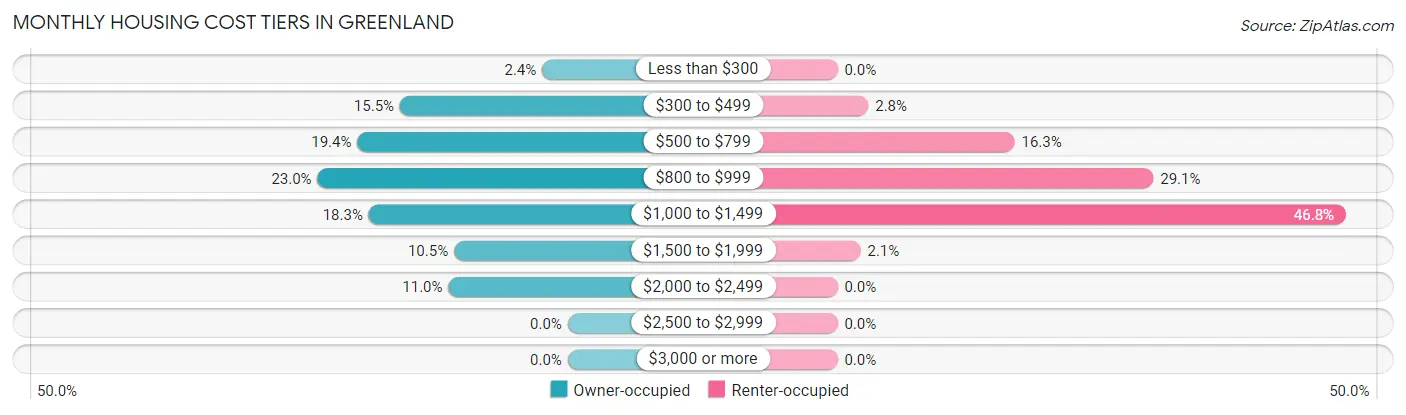
| Monthly Cost | Owner-occupied | Renter-occupied |
| Less than $300 | 9 (2.4%) | 0 (0.0%) |
| $300 to $499 | 59 (15.4%) | 4 (2.8%) |
| $500 to $799 | 74 (19.4%) | 23 (16.3%) |
| $800 to $999 | 88 (23.0%) | 41 (29.1%) |
| $1,000 to $1,499 | 70 (18.3%) | 66 (46.8%) |
| $1,500 to $1,999 | 40 (10.5%) | 3 (2.1%) |
| $2,000 to $2,499 | 42 (11.0%) | 0 (0.0%) |
| $2,500 to $2,999 | 0 (0.0%) | 0 (0.0%) |
| $3,000 or more | 0 (0.0%) | 0 (0.0%) |
| Total | 382 (100.0%) | 141 (100.0%) |
Physical Housing Characteristics in Greenland
Housing Structures in Greenland
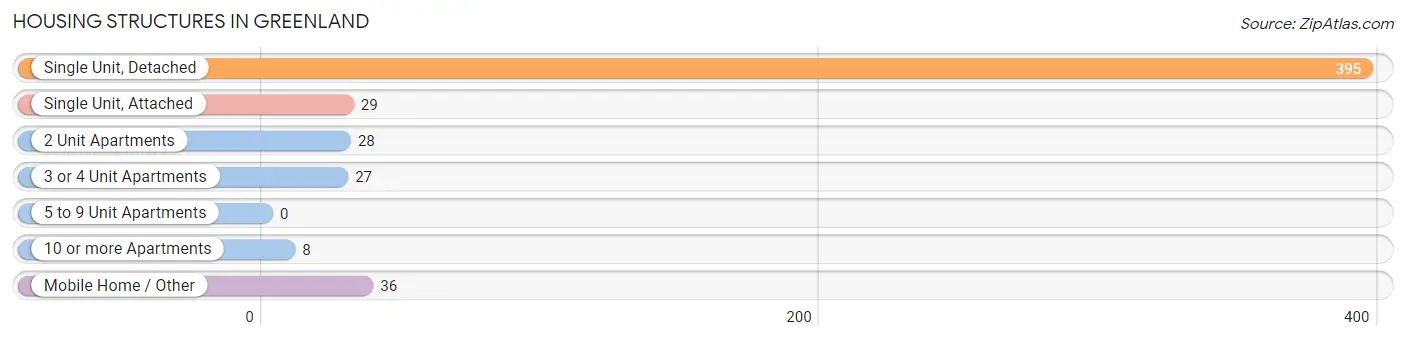
| Structure Type | # Housing Units | % Housing Units |
| Single Unit, Detached | 395 | 75.5% |
| Single Unit, Attached | 29 | 5.5% |
| 2 Unit Apartments | 28 | 5.3% |
| 3 or 4 Unit Apartments | 27 | 5.2% |
| 5 to 9 Unit Apartments | 0 | 0.0% |
| 10 or more Apartments | 8 | 1.5% |
| Mobile Home / Other | 36 | 6.9% |
| Total | 523 | 100.0% |
Housing Structures by Occupancy in Greenland
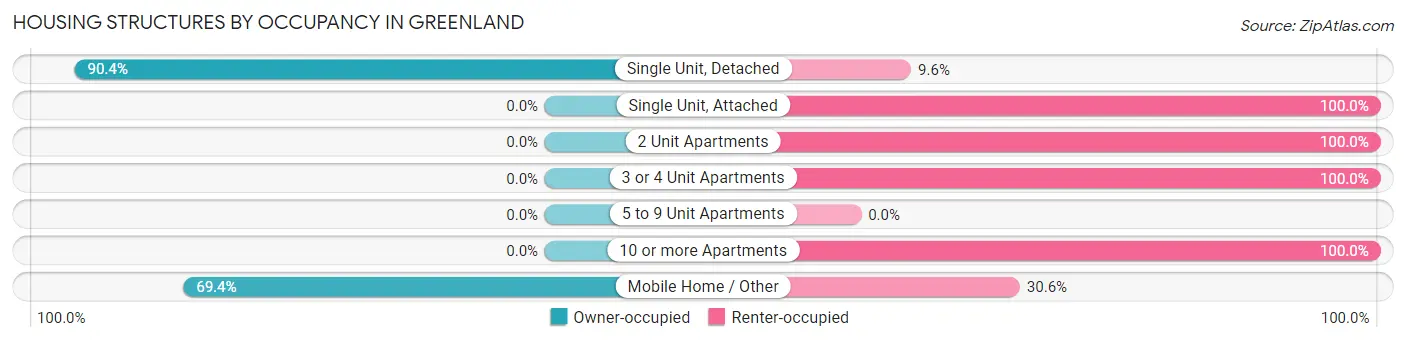
| Structure Type | Owner-occupied | Renter-occupied |
| Single Unit, Detached | 357 (90.4%) | 38 (9.6%) |
| Single Unit, Attached | 0 (0.0%) | 29 (100.0%) |
| 2 Unit Apartments | 0 (0.0%) | 28 (100.0%) |
| 3 or 4 Unit Apartments | 0 (0.0%) | 27 (100.0%) |
| 5 to 9 Unit Apartments | 0 (0.0%) | 0 (0.0%) |
| 10 or more Apartments | 0 (0.0%) | 8 (100.0%) |
| Mobile Home / Other | 25 (69.4%) | 11 (30.6%) |
| Total | 382 (73.0%) | 141 (27.0%) |
Housing Structures by Number of Rooms in Greenland
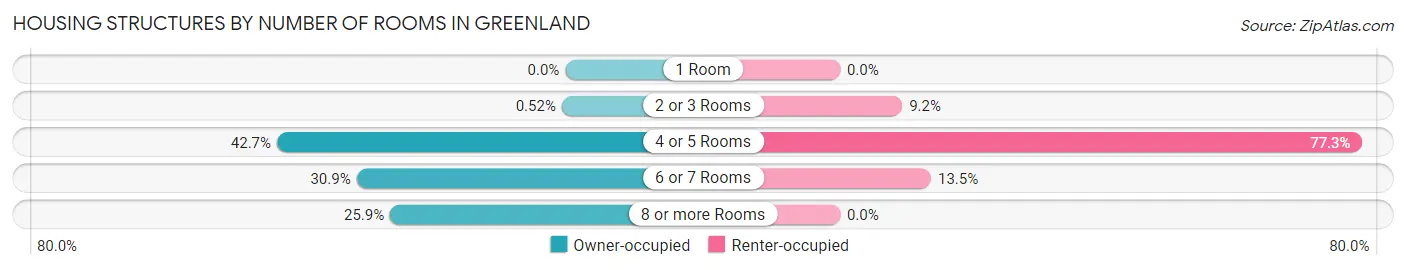
| Number of Rooms | Owner-occupied | Renter-occupied |
| 1 Room | 0 (0.0%) | 0 (0.0%) |
| 2 or 3 Rooms | 2 (0.5%) | 13 (9.2%) |
| 4 or 5 Rooms | 163 (42.7%) | 109 (77.3%) |
| 6 or 7 Rooms | 118 (30.9%) | 19 (13.5%) |
| 8 or more Rooms | 99 (25.9%) | 0 (0.0%) |
| Total | 382 (100.0%) | 141 (100.0%) |
Housing Structure by Heating Type in Greenland
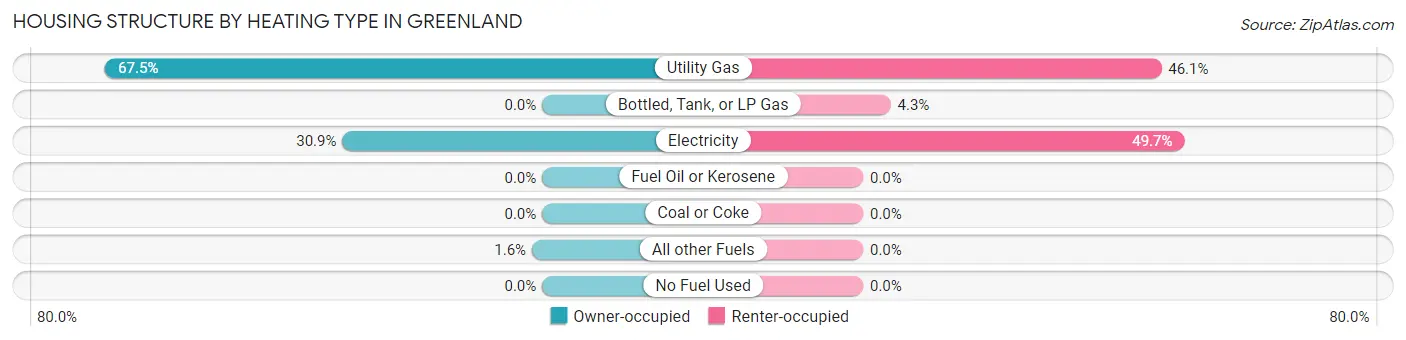
| Heating Type | Owner-occupied | Renter-occupied |
| Utility Gas | 258 (67.5%) | 65 (46.1%) |
| Bottled, Tank, or LP Gas | 0 (0.0%) | 6 (4.3%) |
| Electricity | 118 (30.9%) | 70 (49.6%) |
| Fuel Oil or Kerosene | 0 (0.0%) | 0 (0.0%) |
| Coal or Coke | 0 (0.0%) | 0 (0.0%) |
| All other Fuels | 6 (1.6%) | 0 (0.0%) |
| No Fuel Used | 0 (0.0%) | 0 (0.0%) |
| Total | 382 (100.0%) | 141 (100.0%) |
Household Vehicle Usage in Greenland
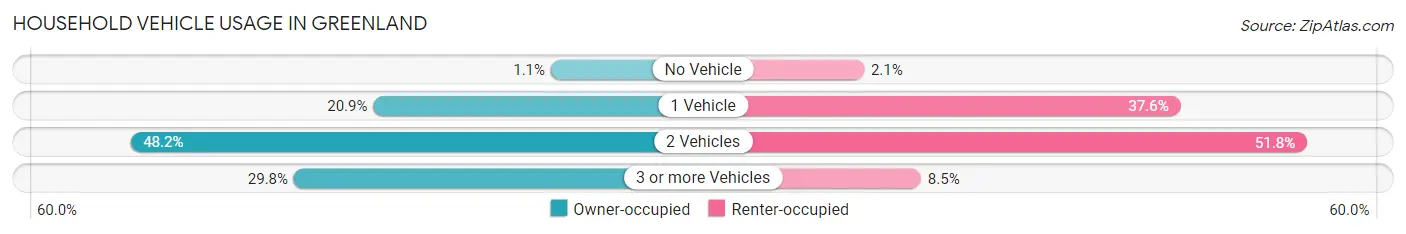
| Vehicles per Household | Owner-occupied | Renter-occupied |
| No Vehicle | 4 (1.1%) | 3 (2.1%) |
| 1 Vehicle | 80 (20.9%) | 53 (37.6%) |
| 2 Vehicles | 184 (48.2%) | 73 (51.8%) |
| 3 or more Vehicles | 114 (29.8%) | 12 (8.5%) |
| Total | 382 (100.0%) | 141 (100.0%) |
Real Estate & Mortgages in Greenland
Real Estate and Mortgage Overview in Greenland
| Characteristic | Without Mortgage | With Mortgage |
| Housing Units | 114 | 268 |
| Median Property Value | $153,900 | $191,100 |
| Median Household Income | $49,125 | $43 |
| Monthly Housing Costs | $427 | $0 |
| Real Estate Taxes | $909 | $35 |
Property Value by Mortgage Status in Greenland
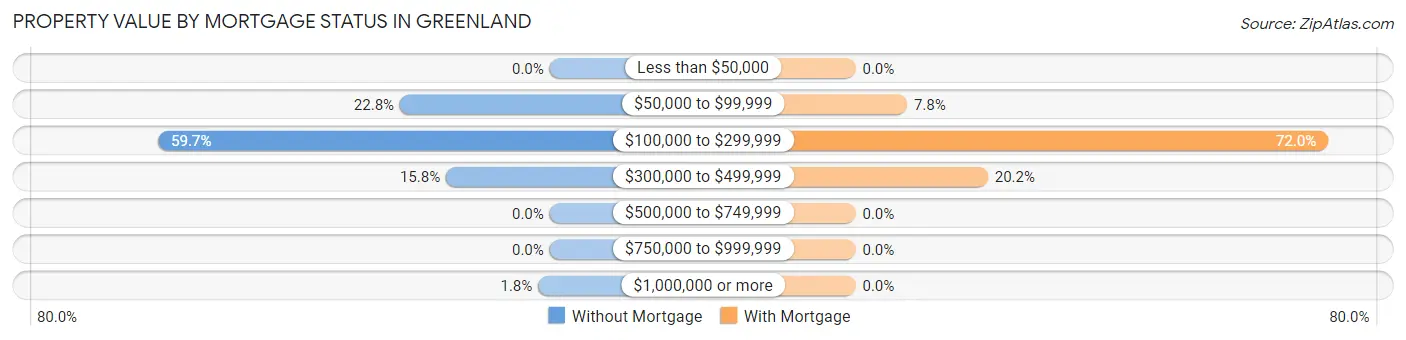
| Property Value | Without Mortgage | With Mortgage |
| Less than $50,000 | 0 (0.0%) | 0 (0.0%) |
| $50,000 to $99,999 | 26 (22.8%) | 21 (7.8%) |
| $100,000 to $299,999 | 68 (59.7%) | 193 (72.0%) |
| $300,000 to $499,999 | 18 (15.8%) | 54 (20.2%) |
| $500,000 to $749,999 | 0 (0.0%) | 0 (0.0%) |
| $750,000 to $999,999 | 0 (0.0%) | 0 (0.0%) |
| $1,000,000 or more | 2 (1.8%) | 0 (0.0%) |
| Total | 114 (100.0%) | 268 (100.0%) |
Household Income by Mortgage Status in Greenland
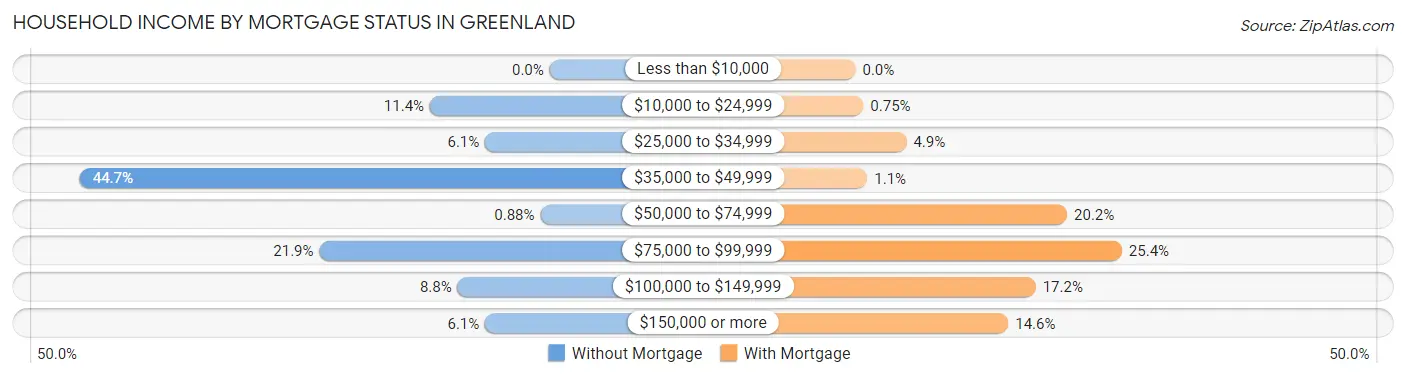
| Household Income | Without Mortgage | With Mortgage |
| Less than $10,000 | 0 (0.0%) | 0 (0.0%) |
| $10,000 to $24,999 | 13 (11.4%) | 2 (0.7%) |
| $25,000 to $34,999 | 7 (6.1%) | 13 (4.9%) |
| $35,000 to $49,999 | 51 (44.7%) | 3 (1.1%) |
| $50,000 to $74,999 | 1 (0.9%) | 54 (20.2%) |
| $75,000 to $99,999 | 25 (21.9%) | 68 (25.4%) |
| $100,000 to $149,999 | 10 (8.8%) | 46 (17.2%) |
| $150,000 or more | 7 (6.1%) | 39 (14.5%) |
| Total | 114 (100.0%) | 268 (100.0%) |
Property Value to Household Income Ratio in Greenland
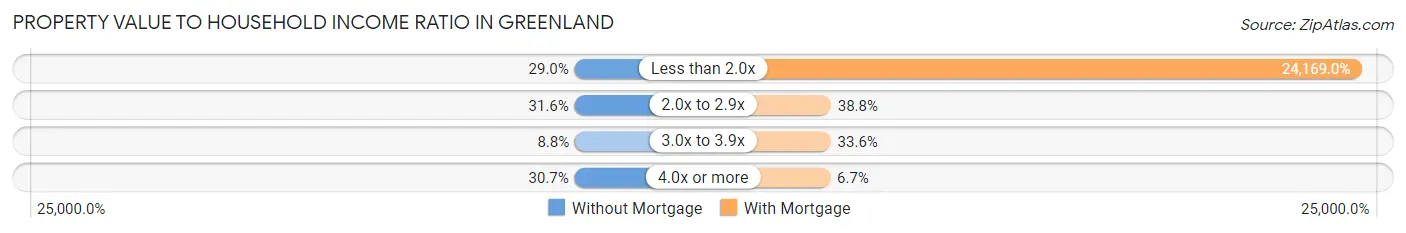
| Value-to-Income Ratio | Without Mortgage | With Mortgage |
| Less than 2.0x | 33 (28.9%) | 64,773 (24,169.0%) |
| 2.0x to 2.9x | 36 (31.6%) | 104 (38.8%) |
| 3.0x to 3.9x | 10 (8.8%) | 90 (33.6%) |
| 4.0x or more | 35 (30.7%) | 18 (6.7%) |
| Total | 114 (100.0%) | 268 (100.0%) |
Real Estate Taxes by Mortgage Status in Greenland
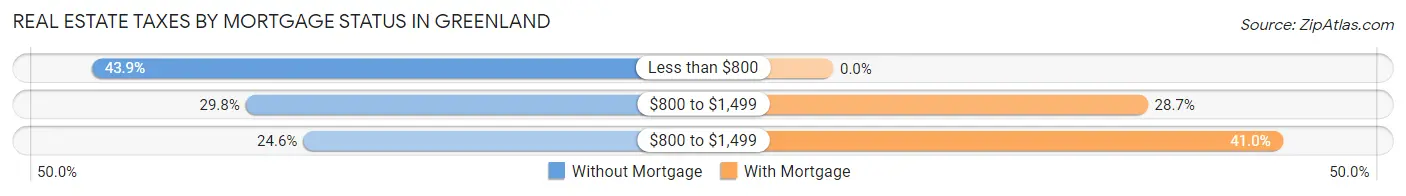
| Property Taxes | Without Mortgage | With Mortgage |
| Less than $800 | 50 (43.9%) | 0 (0.0%) |
| $800 to $1,499 | 34 (29.8%) | 77 (28.7%) |
| $800 to $1,499 | 28 (24.6%) | 110 (41.0%) |
| Total | 114 (100.0%) | 268 (100.0%) |
Health & Disability in Greenland
Health Insurance Coverage by Age in Greenland
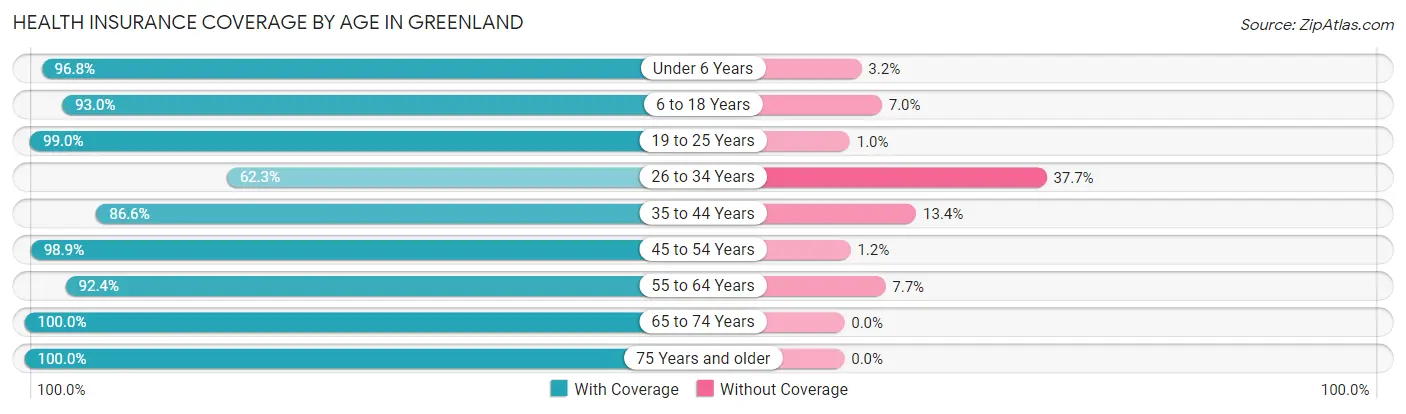
| Age Bracket | With Coverage | Without Coverage |
| Under 6 Years | 91 (96.8%) | 3 (3.2%) |
| 6 to 18 Years | 133 (93.0%) | 10 (7.0%) |
| 19 to 25 Years | 195 (99.0%) | 2 (1.0%) |
| 26 to 34 Years | 119 (62.3%) | 72 (37.7%) |
| 35 to 44 Years | 194 (86.6%) | 30 (13.4%) |
| 45 to 54 Years | 172 (98.9%) | 2 (1.1%) |
| 55 to 64 Years | 157 (92.3%) | 13 (7.6%) |
| 65 to 74 Years | 143 (100.0%) | 0 (0.0%) |
| 75 Years and older | 88 (100.0%) | 0 (0.0%) |
| Total | 1,292 (90.7%) | 132 (9.3%) |
Health Insurance Coverage by Citizenship Status in Greenland
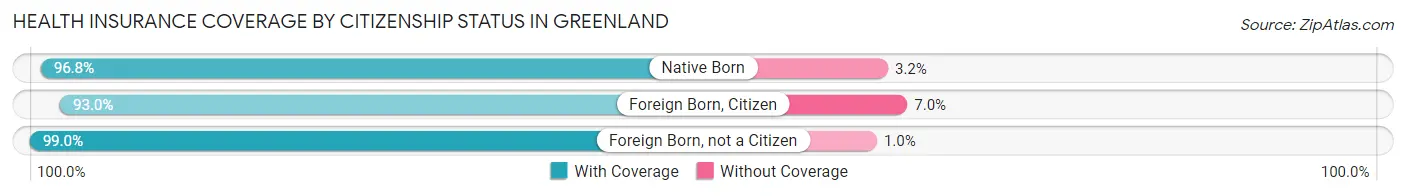
| Citizenship Status | With Coverage | Without Coverage |
| Native Born | 91 (96.8%) | 3 (3.2%) |
| Foreign Born, Citizen | 133 (93.0%) | 10 (7.0%) |
| Foreign Born, not a Citizen | 195 (99.0%) | 2 (1.0%) |
Health Insurance Coverage by Household Income in Greenland
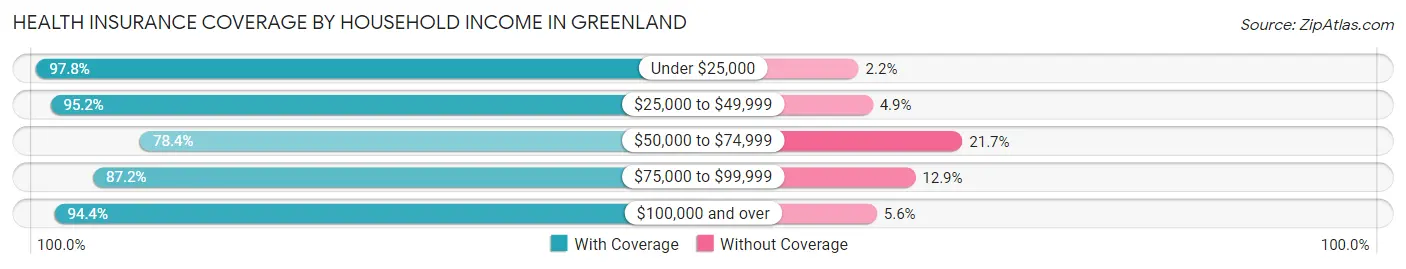
| Household Income | With Coverage | Without Coverage |
| Under $25,000 | 88 (97.8%) | 2 (2.2%) |
| $25,000 to $49,999 | 353 (95.2%) | 18 (4.9%) |
| $50,000 to $74,999 | 181 (78.3%) | 50 (21.6%) |
| $75,000 to $99,999 | 251 (87.2%) | 37 (12.9%) |
| $100,000 and over | 419 (94.4%) | 25 (5.6%) |
Public vs Private Health Insurance Coverage by Age in Greenland
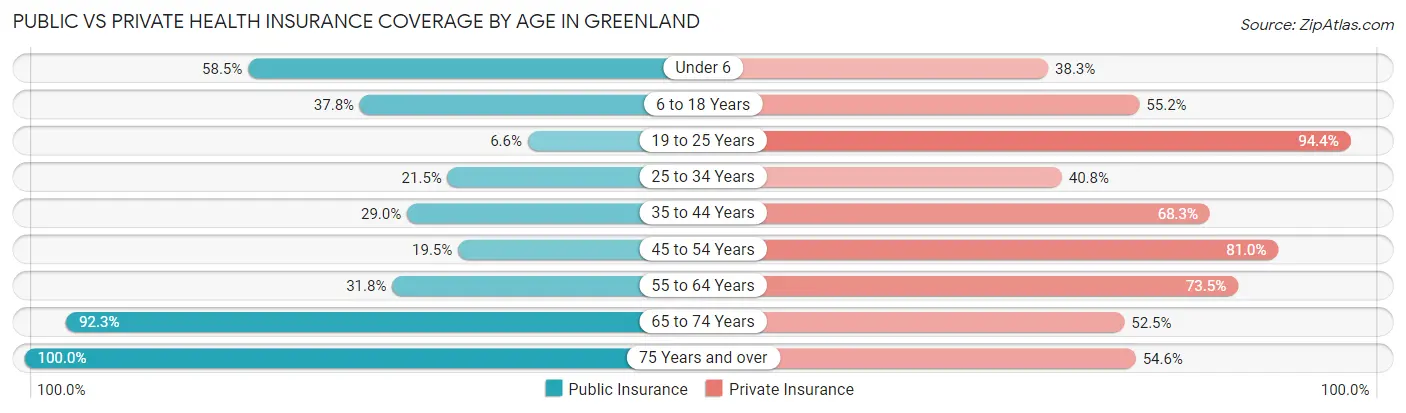
| Age Bracket | Public Insurance | Private Insurance |
| Under 6 | 55 (58.5%) | 36 (38.3%) |
| 6 to 18 Years | 54 (37.8%) | 79 (55.2%) |
| 19 to 25 Years | 13 (6.6%) | 186 (94.4%) |
| 25 to 34 Years | 41 (21.5%) | 78 (40.8%) |
| 35 to 44 Years | 65 (29.0%) | 153 (68.3%) |
| 45 to 54 Years | 34 (19.5%) | 141 (81.0%) |
| 55 to 64 Years | 54 (31.8%) | 125 (73.5%) |
| 65 to 74 Years | 132 (92.3%) | 75 (52.4%) |
| 75 Years and over | 88 (100.0%) | 48 (54.5%) |
| Total | 536 (37.6%) | 921 (64.7%) |
Disability Status by Sex by Age in Greenland
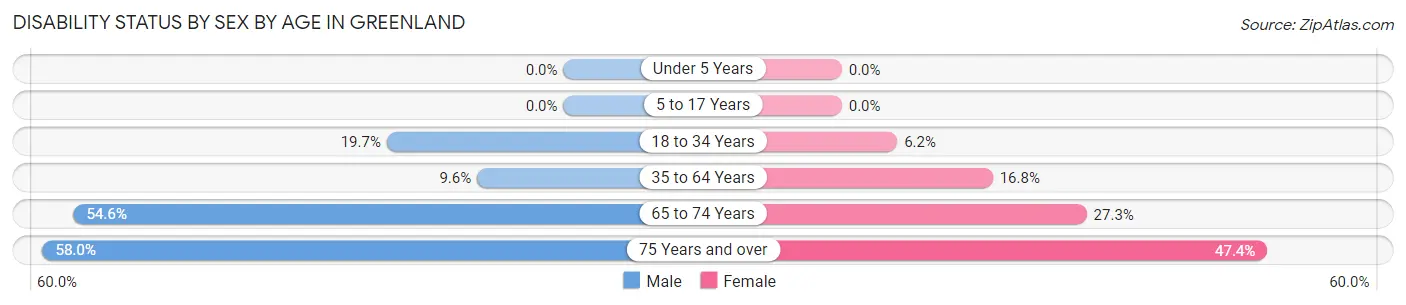
| Age Bracket | Male | Female |
| Under 5 Years | 0 (0.0%) | 0 (0.0%) |
| 5 to 17 Years | 0 (0.0%) | 0 (0.0%) |
| 18 to 34 Years | 47 (19.7%) | 10 (6.2%) |
| 35 to 64 Years | 22 (9.6%) | 57 (16.8%) |
| 65 to 74 Years | 30 (54.5%) | 24 (27.3%) |
| 75 Years and over | 29 (58.0%) | 18 (47.4%) |
Disability Class by Sex by Age in Greenland
Disability Class: Hearing Difficulty
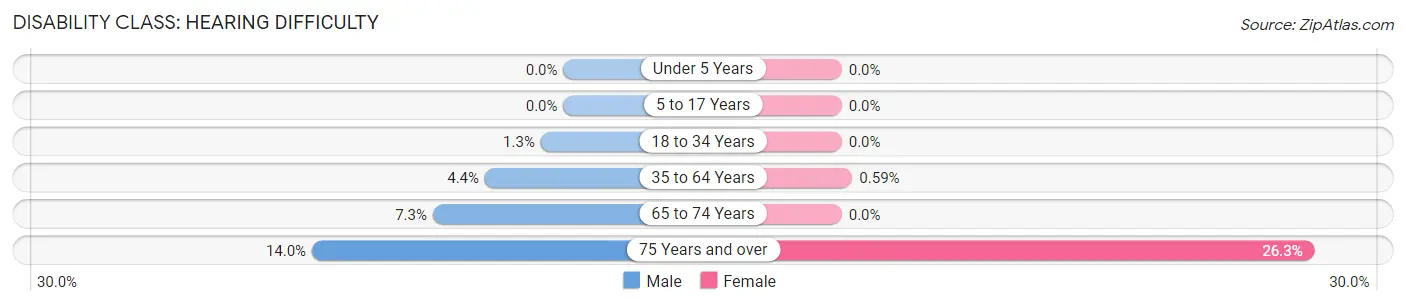
| Age Bracket | Male | Female |
| Under 5 Years | 0 (0.0%) | 0 (0.0%) |
| 5 to 17 Years | 0 (0.0%) | 0 (0.0%) |
| 18 to 34 Years | 3 (1.3%) | 0 (0.0%) |
| 35 to 64 Years | 10 (4.4%) | 2 (0.6%) |
| 65 to 74 Years | 4 (7.3%) | 0 (0.0%) |
| 75 Years and over | 7 (14.0%) | 10 (26.3%) |
Disability Class: Vision Difficulty
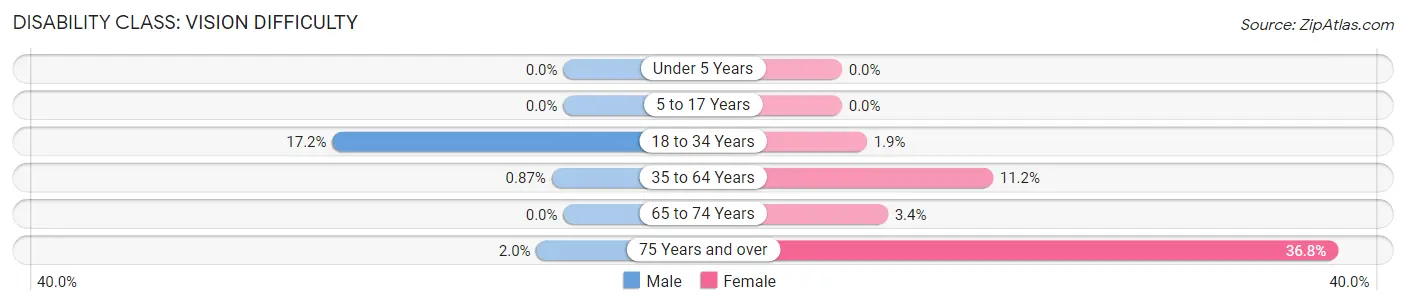
| Age Bracket | Male | Female |
| Under 5 Years | 0 (0.0%) | 0 (0.0%) |
| 5 to 17 Years | 0 (0.0%) | 0 (0.0%) |
| 18 to 34 Years | 41 (17.2%) | 3 (1.8%) |
| 35 to 64 Years | 2 (0.9%) | 38 (11.2%) |
| 65 to 74 Years | 0 (0.0%) | 3 (3.4%) |
| 75 Years and over | 1 (2.0%) | 14 (36.8%) |
Disability Class: Cognitive Difficulty
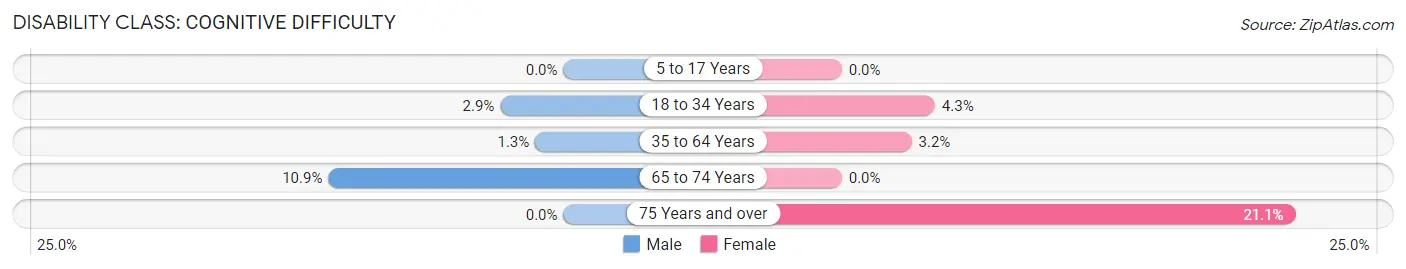
| Age Bracket | Male | Female |
| 5 to 17 Years | 0 (0.0%) | 0 (0.0%) |
| 18 to 34 Years | 7 (2.9%) | 7 (4.3%) |
| 35 to 64 Years | 3 (1.3%) | 11 (3.2%) |
| 65 to 74 Years | 6 (10.9%) | 0 (0.0%) |
| 75 Years and over | 0 (0.0%) | 8 (21.0%) |
Disability Class: Ambulatory Difficulty
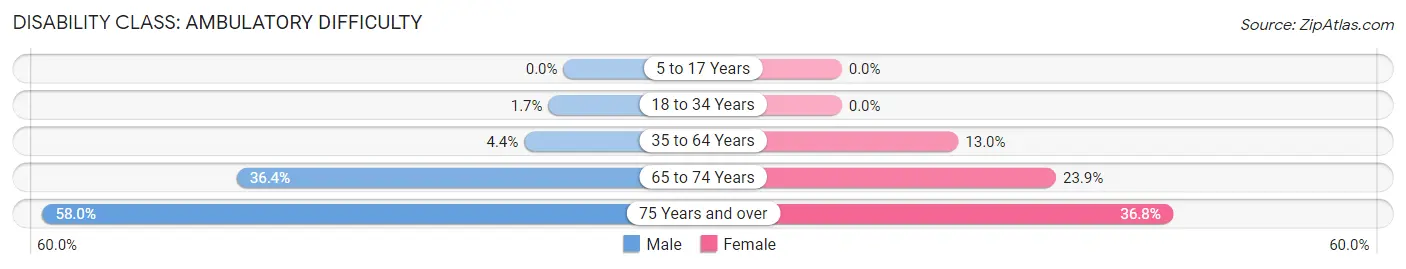
| Age Bracket | Male | Female |
| 5 to 17 Years | 0 (0.0%) | 0 (0.0%) |
| 18 to 34 Years | 4 (1.7%) | 0 (0.0%) |
| 35 to 64 Years | 10 (4.4%) | 44 (13.0%) |
| 65 to 74 Years | 20 (36.4%) | 21 (23.9%) |
| 75 Years and over | 29 (58.0%) | 14 (36.8%) |
Disability Class: Self-Care Difficulty
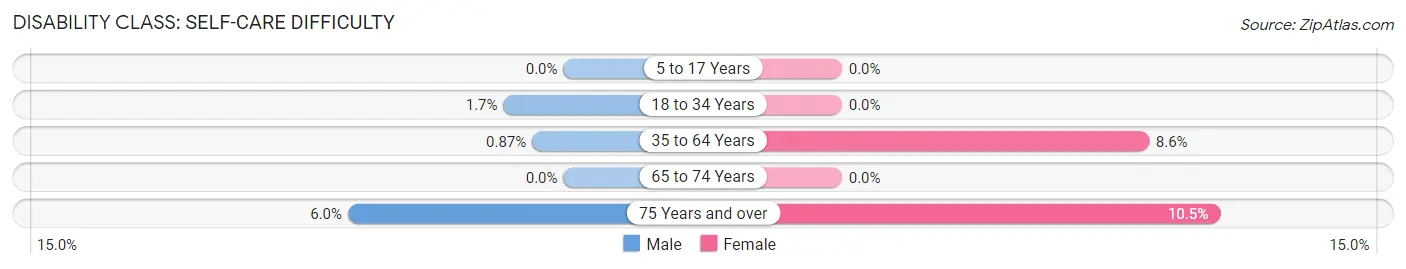
| Age Bracket | Male | Female |
| 5 to 17 Years | 0 (0.0%) | 0 (0.0%) |
| 18 to 34 Years | 4 (1.7%) | 0 (0.0%) |
| 35 to 64 Years | 2 (0.9%) | 29 (8.6%) |
| 65 to 74 Years | 0 (0.0%) | 0 (0.0%) |
| 75 Years and over | 3 (6.0%) | 4 (10.5%) |
Technology Access in Greenland
Computing Device Access in Greenland
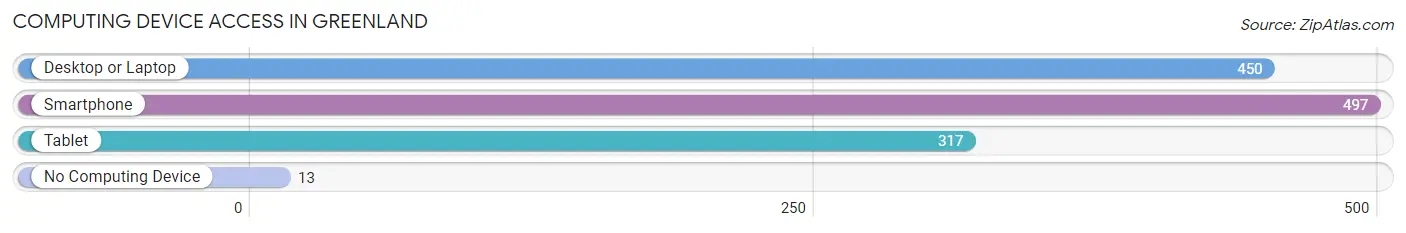
| Device Type | # Households | % Households |
| Desktop or Laptop | 450 | 86.0% |
| Smartphone | 497 | 95.0% |
| Tablet | 317 | 60.6% |
| No Computing Device | 13 | 2.5% |
| Total | 523 | 100.0% |
Internet Access in Greenland
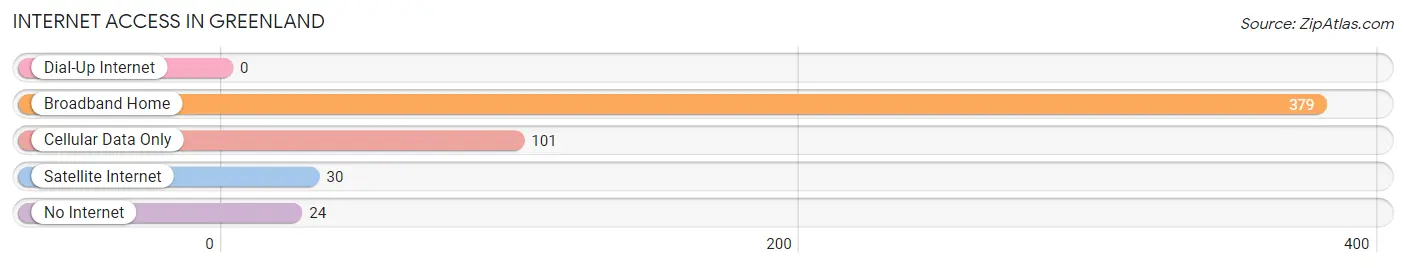
| Internet Type | # Households | % Households |
| Dial-Up Internet | 0 | 0.0% |
| Broadband Home | 379 | 72.5% |
| Cellular Data Only | 101 | 19.3% |
| Satellite Internet | 30 | 5.7% |
| No Internet | 24 | 4.6% |
| Total | 523 | 100.0% |
Greenland Summary
Greenland, Arkansas is a small town located in Washington County in the northwest corner of the state. It is situated on the banks of the White River, and is part of the Fayetteville-Springdale-Rogers Metropolitan Statistical Area. The town has a population of 1,845 as of the 2010 census, and is the second-largest town in Washington County.
History
Greenland was founded in 1871 by a group of settlers from the nearby town of Fayetteville. The town was named after the nearby Greenland Creek, which was named by early settlers who thought the area resembled the landscape of Greenland. The town was incorporated in 1881, and the first post office was established in 1883.
In the early 1900s, Greenland was a thriving agricultural community, with cotton, corn, and wheat being the main crops. The town also had a number of businesses, including a general store, a blacksmith shop, and a hotel.
In the 1950s, the town began to decline as the population shifted to larger cities. The town was nearly abandoned by the 1970s, but in the 1980s, the town began to experience a resurgence. The town was revitalized by the construction of a new school, a new library, and a new city hall.
Geography
Greenland is located in the northwest corner of Arkansas, in Washington County. It is situated on the banks of the White River, and is part of the Fayetteville-Springdale-Rogers Metropolitan Statistical Area. The town has a total area of 1.3 square miles, all of which is land.
The town is located in the Ozark Mountains, and is surrounded by rolling hills and forests. The climate is humid subtropical, with hot, humid summers and mild winters.
Economy
Greenland’s economy is largely based on agriculture and tourism. The town is home to a number of farms, which produce a variety of crops, including cotton, corn, and wheat. The town also has a number of small businesses, including restaurants, shops, and a hotel.
The town is also a popular tourist destination, with visitors coming to enjoy the town’s natural beauty and outdoor activities. The town is home to a number of parks and trails, as well as a number of historic sites.
Demographics
As of the 2010 census, Greenland had a population of 1,845. The racial makeup of the town was 95.3% White, 0.7% African American, 0.3% Native American, 0.2% Asian, 0.1% Pacific Islander, and 3.4% from other races. Hispanic or Latino of any race were 2.2% of the population.
The median household income in Greenland was $37,917, and the median family income was $45,625. The per capita income was $19,945. About 11.3% of families and 14.2% of the population were below the poverty line, including 19.2% of those under age 18 and 8.3% of those age 65 or over.
Common Questions
What is Per Capita Income in Greenland?
Per Capita income in Greenland is $30,690.
What is the Median Family Income in Greenland?
Median Family Income in Greenland is $69,000.
What is the Median Household income in Greenland?
Median Household Income in Greenland is $59,638.
What is Income or Wage Gap in Greenland?
Income or Wage Gap in Greenland is 3.1%.
Women in Greenland earn 96.9 cents for every dollar earned by a man.
What is Inequality or Gini Index in Greenland?
Inequality or Gini Index in Greenland is 0.37.
What is the Total Population of Greenland?
Total Population of Greenland is 1,424.
What is the Total Male Population of Greenland?
Total Male Population of Greenland is 692.
What is the Total Female Population of Greenland?
Total Female Population of Greenland is 732.
What is the Ratio of Males per 100 Females in Greenland?
There are 94.54 Males per 100 Females in Greenland.
What is the Ratio of Females per 100 Males in Greenland?
There are 105.78 Females per 100 Males in Greenland.
What is the Median Population Age in Greenland?
Median Population Age in Greenland is 38.9 Years.
What is the Average Family Size in Greenland
Average Family Size in Greenland is 3.0 People.
What is the Average Household Size in Greenland
Average Household Size in Greenland is 2.7 People.
How Large is the Labor Force in Greenland?
There are 853 People in the Labor Forcein in Greenland.
What is the Percentage of People in the Labor Force in Greenland?
70.3% of People are in the Labor Force in Greenland.
What is the Unemployment Rate in Greenland?
Unemployment Rate in Greenland is 3.2%.