Clarkedale, AR Map & Demographics
Clarkedale Map
Clarkedale Overview
$47,355
PER CAPITA INCOME
$128,333
AVG FAMILY INCOME
$119,271
AVG HOUSEHOLD INCOME
11.0%
WAGE / INCOME GAP [ % ]
89.0¢/ $1
WAGE / INCOME GAP [ $ ]
0.28
INEQUALITY / GINI INDEX
446
TOTAL POPULATION
226
MALE POPULATION
220
FEMALE POPULATION
102.73
MALES / 100 FEMALES
97.35
FEMALES / 100 MALES
44.4
MEDIAN AGE
3.4
AVG FAMILY SIZE
3.2
AVG HOUSEHOLD SIZE
250
LABOR FORCE [ PEOPLE ]
69.6%
PERCENT IN LABOR FORCE
2.4%
UNEMPLOYMENT RATE
Clarkedale Zip Codes
Clarkedale Area Codes
Income in Clarkedale
Income Overview in Clarkedale
Per Capita Income in Clarkedale is $47,355, while median incomes of families and households are $128,333 and $119,271 respectively.
| Characteristic | Number | Measure |
| Per Capita Income | 446 | $47,355 |
| Median Family Income | 128 | $128,333 |
| Mean Family Income | 128 | $146,148 |
| Median Household Income | 139 | $119,271 |
| Mean Household Income | 139 | $139,418 |
| Income Deficit | 128 | $0 |
| Wage / Income Gap (%) | 446 | 11.00% |
| Wage / Income Gap ($) | 446 | 89.00¢ per $1 |
| Gini / Inequality Index | 446 | 0.28 |
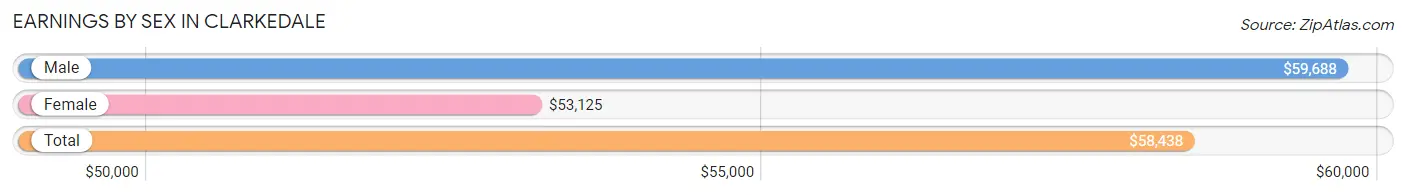
Earnings by Sex in Clarkedale
Average Earnings in Clarkedale are $58,438, $59,688 for men and $53,125 for women, a difference of 11.0%.
| Sex | Number | Average Earnings |
| Male | 146 (54.9%) | $59,688 |
| Female | 120 (45.1%) | $53,125 |
| Total | 266 (100.0%) | $58,438 |
Earnings by Sex by Income Bracket in Clarkedale
The most common earnings brackets in Clarkedale are $100,000+ for men (36 | 24.7%) and $100,000+ for women (25 | 20.8%).
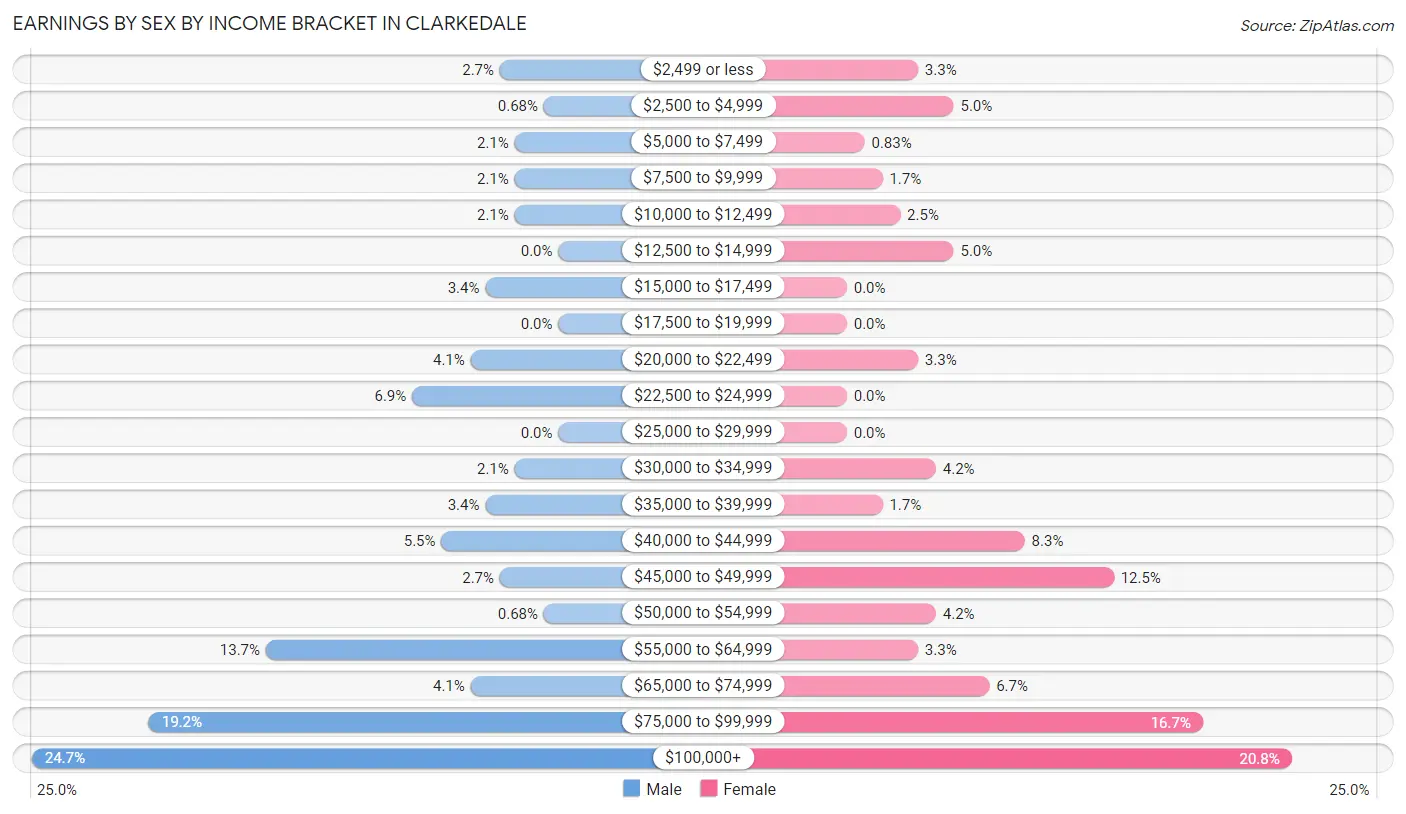
| Income | Male | Female |
| $2,499 or less | 4 (2.7%) | 4 (3.3%) |
| $2,500 to $4,999 | 1 (0.7%) | 6 (5.0%) |
| $5,000 to $7,499 | 3 (2.1%) | 1 (0.8%) |
| $7,500 to $9,999 | 3 (2.1%) | 2 (1.7%) |
| $10,000 to $12,499 | 3 (2.1%) | 3 (2.5%) |
| $12,500 to $14,999 | 0 (0.0%) | 6 (5.0%) |
| $15,000 to $17,499 | 5 (3.4%) | 0 (0.0%) |
| $17,500 to $19,999 | 0 (0.0%) | 0 (0.0%) |
| $20,000 to $22,499 | 6 (4.1%) | 4 (3.3%) |
| $22,500 to $24,999 | 10 (6.9%) | 0 (0.0%) |
| $25,000 to $29,999 | 0 (0.0%) | 0 (0.0%) |
| $30,000 to $34,999 | 3 (2.1%) | 5 (4.2%) |
| $35,000 to $39,999 | 5 (3.4%) | 2 (1.7%) |
| $40,000 to $44,999 | 8 (5.5%) | 10 (8.3%) |
| $45,000 to $49,999 | 4 (2.7%) | 15 (12.5%) |
| $50,000 to $54,999 | 1 (0.7%) | 5 (4.2%) |
| $55,000 to $64,999 | 20 (13.7%) | 4 (3.3%) |
| $65,000 to $74,999 | 6 (4.1%) | 8 (6.7%) |
| $75,000 to $99,999 | 28 (19.2%) | 20 (16.7%) |
| $100,000+ | 36 (24.7%) | 25 (20.8%) |
| Total | 146 (100.0%) | 120 (100.0%) |
Earnings by Sex by Educational Attainment in Clarkedale
Average earnings in Clarkedale are $75,625 for men and $66,250 for women, a difference of 12.4%. Men with an educational attainment of bachelor's degree enjoy the highest average annual earnings of $126,250, while those with less than high school education earn the least with $44,583. Women with an educational attainment of bachelor's degree earn the most with the average annual earnings of $103,750, while those with less than high school education have the smallest earnings of $34,375.
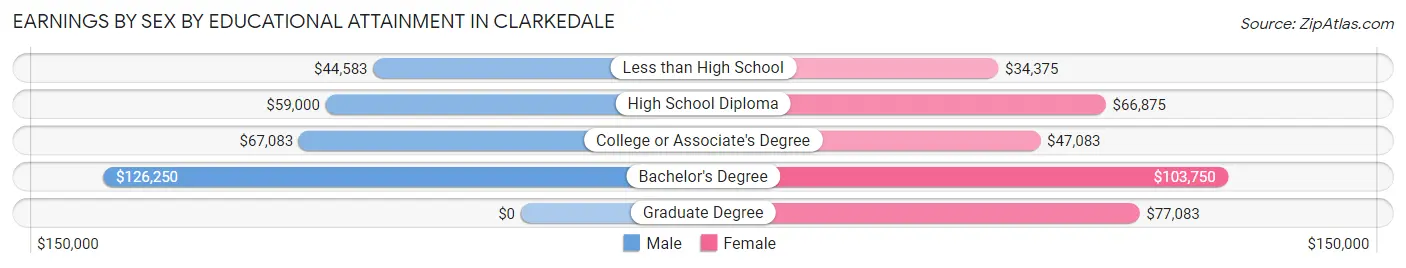
| Educational Attainment | Male Income | Female Income |
| Less than High School | $44,583 | $34,375 |
| High School Diploma | $59,000 | $66,875 |
| College or Associate's Degree | $67,083 | $47,083 |
| Bachelor's Degree | $126,250 | $103,750 |
| Graduate Degree | - | - |
| Total | $75,625 | $66,250 |
Family Income in Clarkedale
Family Income Brackets in Clarkedale
According to the Clarkedale family income data, there are 57 families falling into the $100,000 to $149,999 income range, which is the most common income bracket and makes up 44.5% of all families.
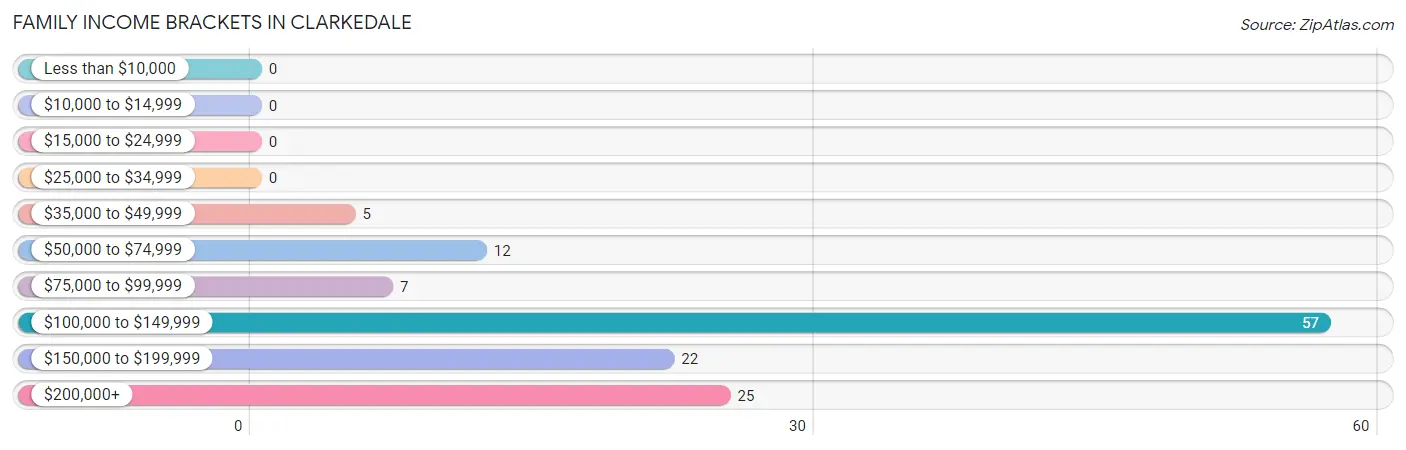
| Income Bracket | # Families | % Families |
| Less than $10,000 | 0 | 0.0% |
| $10,000 to $14,999 | 0 | 0.0% |
| $15,000 to $24,999 | 0 | 0.0% |
| $25,000 to $34,999 | 0 | 0.0% |
| $35,000 to $49,999 | 5 | 3.9% |
| $50,000 to $74,999 | 12 | 9.4% |
| $75,000 to $99,999 | 7 | 5.5% |
| $100,000 to $149,999 | 57 | 44.5% |
| $150,000 to $199,999 | 22 | 17.2% |
| $200,000+ | 25 | 19.5% |
Family Income by Famaliy Size in Clarkedale
4-person families (44 | 34.4%) account for the highest median family income in Clarkedale with $133,750 per family, while 2-person families (52 | 40.6%) have the highest median income of $55,938 per family member.
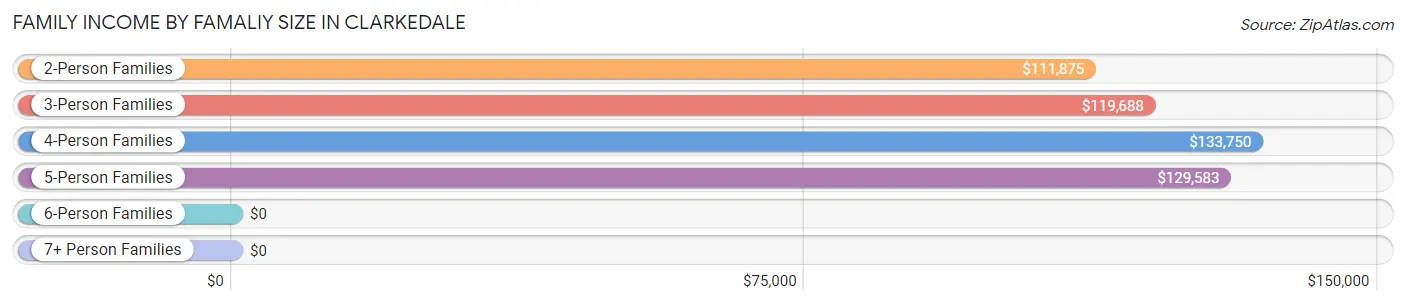
| Income Bracket | # Families | Median Income |
| 2-Person Families | 52 (40.6%) | $111,875 |
| 3-Person Families | 19 (14.8%) | $119,688 |
| 4-Person Families | 44 (34.4%) | $133,750 |
| 5-Person Families | 11 (8.6%) | $129,583 |
| 6-Person Families | 2 (1.6%) | $0 |
| 7+ Person Families | 0 (0.0%) | $0 |
| Total | 128 (100.0%) | $128,333 |
Family Income by Number of Earners in Clarkedale
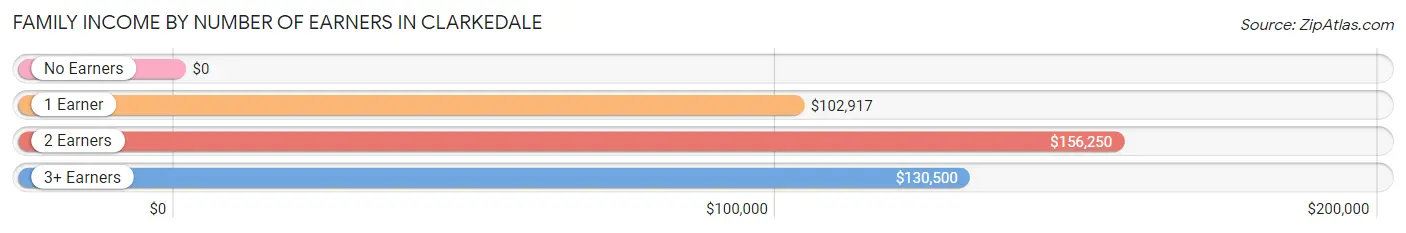
| Number of Earners | # Families | Median Income |
| No Earners | 3 (2.3%) | $0 |
| 1 Earner | 39 (30.5%) | $102,917 |
| 2 Earners | 60 (46.9%) | $156,250 |
| 3+ Earners | 26 (20.3%) | $130,500 |
| Total | 128 (100.0%) | $128,333 |
Household Income in Clarkedale
Household Income Brackets in Clarkedale
With 59 households falling in the category, the $100,000 to $149,999 income range is the most frequent in Clarkedale, accounting for 42.4% of all households.
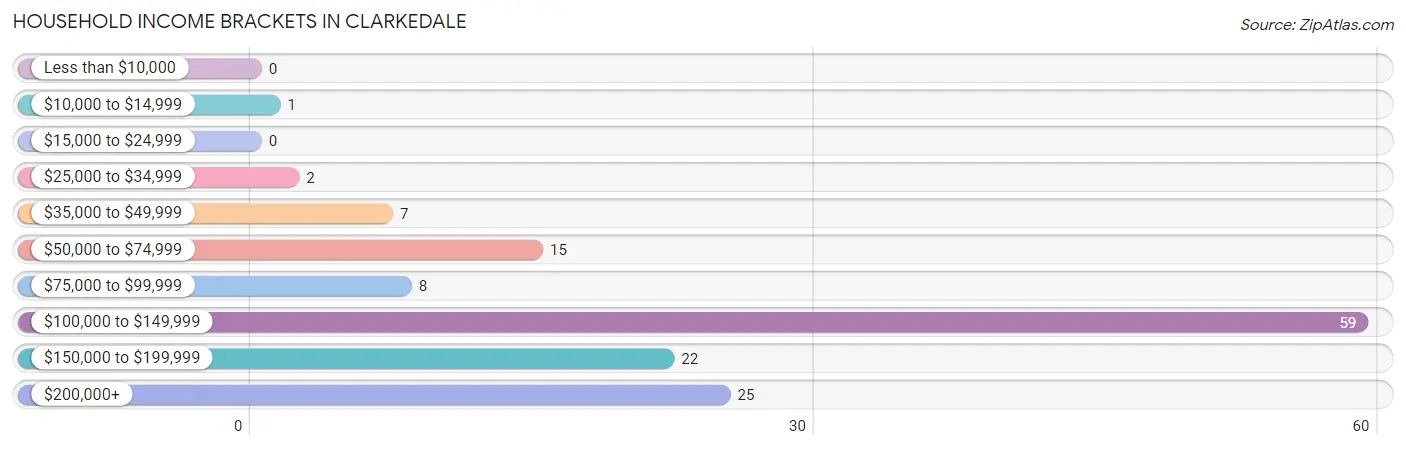
| Income Bracket | # Households | % Households |
| Less than $10,000 | 0 | 0.0% |
| $10,000 to $14,999 | 1 | 0.7% |
| $15,000 to $24,999 | 0 | 0.0% |
| $25,000 to $34,999 | 2 | 1.4% |
| $35,000 to $49,999 | 7 | 5.0% |
| $50,000 to $74,999 | 15 | 10.8% |
| $75,000 to $99,999 | 8 | 5.8% |
| $100,000 to $149,999 | 59 | 42.4% |
| $150,000 to $199,999 | 22 | 15.8% |
| $200,000+ | 25 | 18.0% |
Household Income by Householder Age in Clarkedale
The median household income in Clarkedale is $119,271, with the highest median household income of $133,000 found in the 45 to 64 years age bracket for the primary householder. A total of 80 households (57.6%) fall into this category. Meanwhile, the 15 to 24 years age bracket for the primary householder has the lowest median household income of $0, with 1 households (0.7%) in this group.
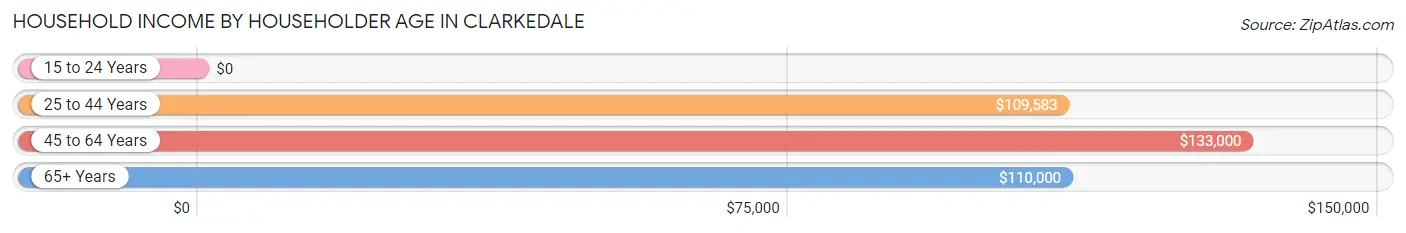
| Income Bracket | # Households | Median Income |
| 15 to 24 Years | 1 (0.7%) | $0 |
| 25 to 44 Years | 28 (20.1%) | $109,583 |
| 45 to 64 Years | 80 (57.6%) | $133,000 |
| 65+ Years | 30 (21.6%) | $110,000 |
| Total | 139 (100.0%) | $119,271 |
Poverty in Clarkedale
Income Below Poverty by Sex and Age in Clarkedale
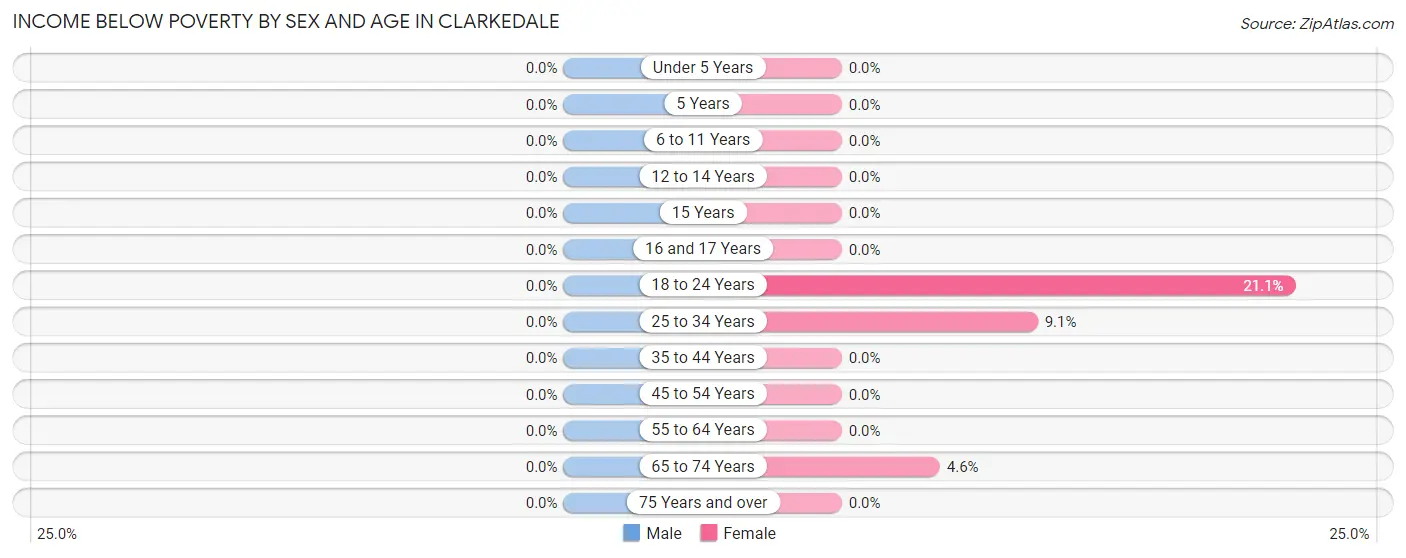
| Age Bracket | Male | Female |
| Under 5 Years | 0 (0.0%) | 0 (0.0%) |
| 5 Years | 0 (0.0%) | 0 (0.0%) |
| 6 to 11 Years | 0 (0.0%) | 0 (0.0%) |
| 12 to 14 Years | 0 (0.0%) | 0 (0.0%) |
| 15 Years | 0 (0.0%) | 0 (0.0%) |
| 16 and 17 Years | 0 (0.0%) | 0 (0.0%) |
| 18 to 24 Years | 0 (0.0%) | 4 (21.0%) |
| 25 to 34 Years | 0 (0.0%) | 1 (9.1%) |
| 35 to 44 Years | 0 (0.0%) | 0 (0.0%) |
| 45 to 54 Years | 0 (0.0%) | 0 (0.0%) |
| 55 to 64 Years | 0 (0.0%) | 0 (0.0%) |
| 65 to 74 Years | 0 (0.0%) | 1 (4.5%) |
| 75 Years and over | 0 (0.0%) | 0 (0.0%) |
| Total | 0 (0.0%) | 6 (2.7%) |
Income Above Poverty by Sex and Age in Clarkedale
According to the poverty statistics in Clarkedale, males aged under 5 years and females aged under 5 years are the age groups that are most secure financially, with 100.0% of males and 100.0% of females in these age groups living above the poverty line.
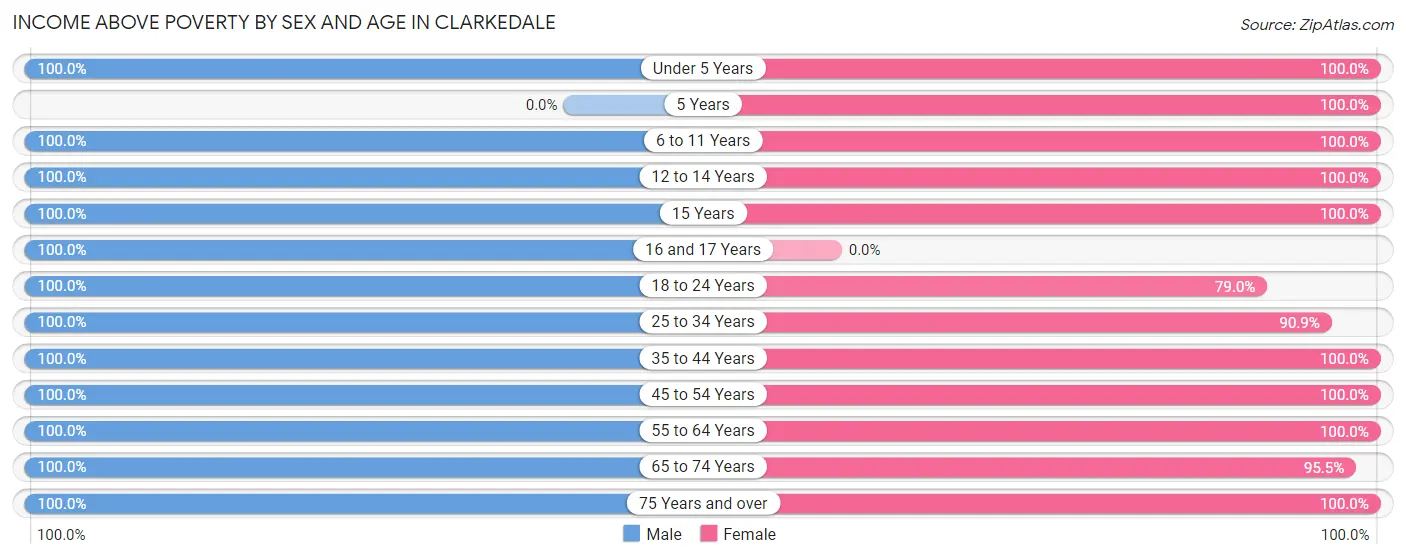
| Age Bracket | Male | Female |
| Under 5 Years | 5 (100.0%) | 4 (100.0%) |
| 5 Years | 0 (0.0%) | 2 (100.0%) |
| 6 to 11 Years | 16 (100.0%) | 13 (100.0%) |
| 12 to 14 Years | 19 (100.0%) | 9 (100.0%) |
| 15 Years | 6 (100.0%) | 12 (100.0%) |
| 16 and 17 Years | 11 (100.0%) | 0 (0.0%) |
| 18 to 24 Years | 32 (100.0%) | 15 (78.9%) |
| 25 to 34 Years | 5 (100.0%) | 10 (90.9%) |
| 35 to 44 Years | 25 (100.0%) | 42 (100.0%) |
| 45 to 54 Years | 45 (100.0%) | 50 (100.0%) |
| 55 to 64 Years | 33 (100.0%) | 27 (100.0%) |
| 65 to 74 Years | 17 (100.0%) | 21 (95.5%) |
| 75 Years and over | 12 (100.0%) | 8 (100.0%) |
| Total | 226 (100.0%) | 213 (97.3%) |
Income Below Poverty Among Married-Couple Families in Clarkedale
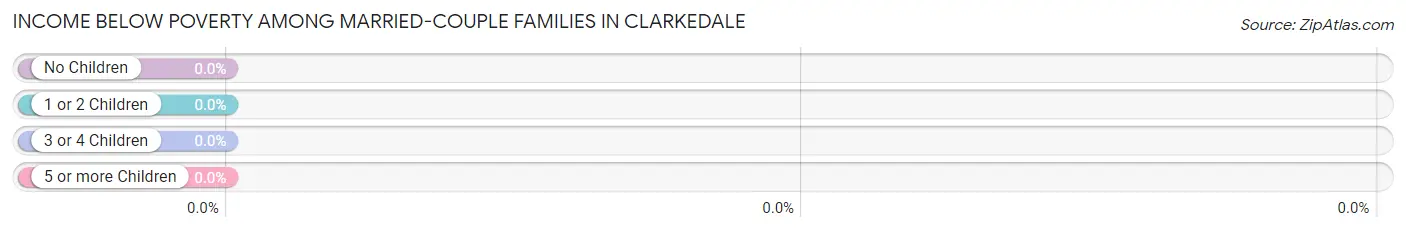
| Children | Above Poverty | Below Poverty |
| No Children | 63 (100.0%) | 0 (0.0%) |
| 1 or 2 Children | 44 (100.0%) | 0 (0.0%) |
| 3 or 4 Children | 6 (100.0%) | 0 (0.0%) |
| 5 or more Children | 0 (0.0%) | 0 (0.0%) |
| Total | 113 (100.0%) | 0 (0.0%) |
Income Below Poverty Among Single-Parent Households in Clarkedale
| Children | Single Father | Single Mother |
| No Children | 0 (0.0%) | 0 (0.0%) |
| 1 or 2 Children | 0 (0.0%) | 0 (0.0%) |
| 3 or 4 Children | 0 (0.0%) | 0 (0.0%) |
| 5 or more Children | 0 (0.0%) | 0 (0.0%) |
| Total | 0 (0.0%) | 0 (0.0%) |
Income Below Poverty Among Married-Couple vs Single-Parent Households in Clarkedale
| Children | Married-Couple Families | Single-Parent Households |
| No Children | 0 (0.0%) | 0 (0.0%) |
| 1 or 2 Children | 0 (0.0%) | 0 (0.0%) |
| 3 or 4 Children | 0 (0.0%) | 0 (0.0%) |
| 5 or more Children | 0 (0.0%) | 0 (0.0%) |
| Total | 0 (0.0%) | 0 (0.0%) |
Race in Clarkedale
The most populous races in Clarkedale are White / Caucasian (343 | 76.9%), Two or more Races (79 | 17.7%), and Hispanic or Latino (25 | 5.6%).
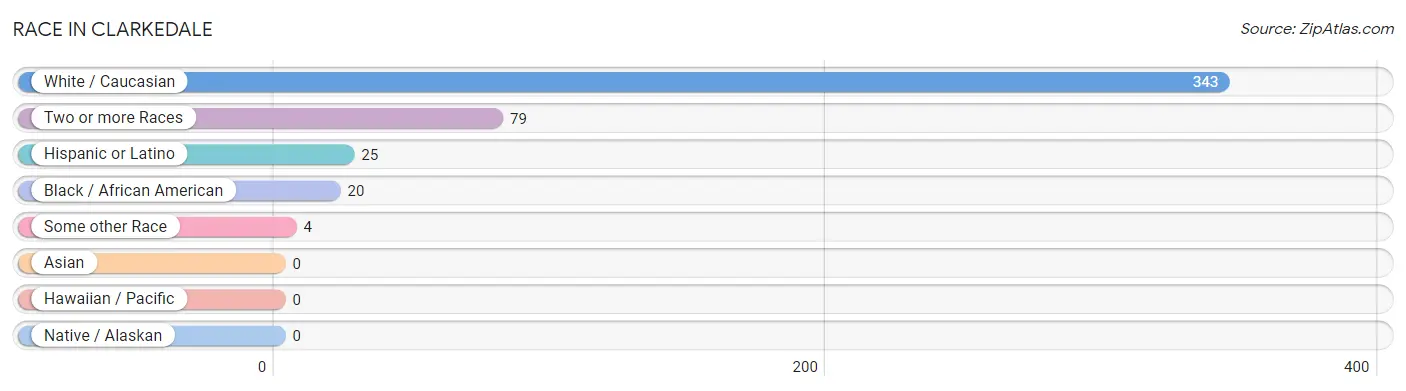
| Race | # Population | % Population |
| Asian | 0 | 0.0% |
| Black / African American | 20 | 4.5% |
| Hawaiian / Pacific | 0 | 0.0% |
| Hispanic or Latino | 25 | 5.6% |
| Native / Alaskan | 0 | 0.0% |
| White / Caucasian | 343 | 76.9% |
| Two or more Races | 79 | 17.7% |
| Some other Race | 4 | 0.9% |
| Total | 446 | 100.0% |
Ancestry in Clarkedale
The most populous ancestries reported in Clarkedale are Irish (87 | 19.5%), English (78 | 17.5%), American (63 | 14.1%), Cherokee (52 | 11.7%), and German (27 | 6.0%), together accounting for 68.8% of all Clarkedale residents.
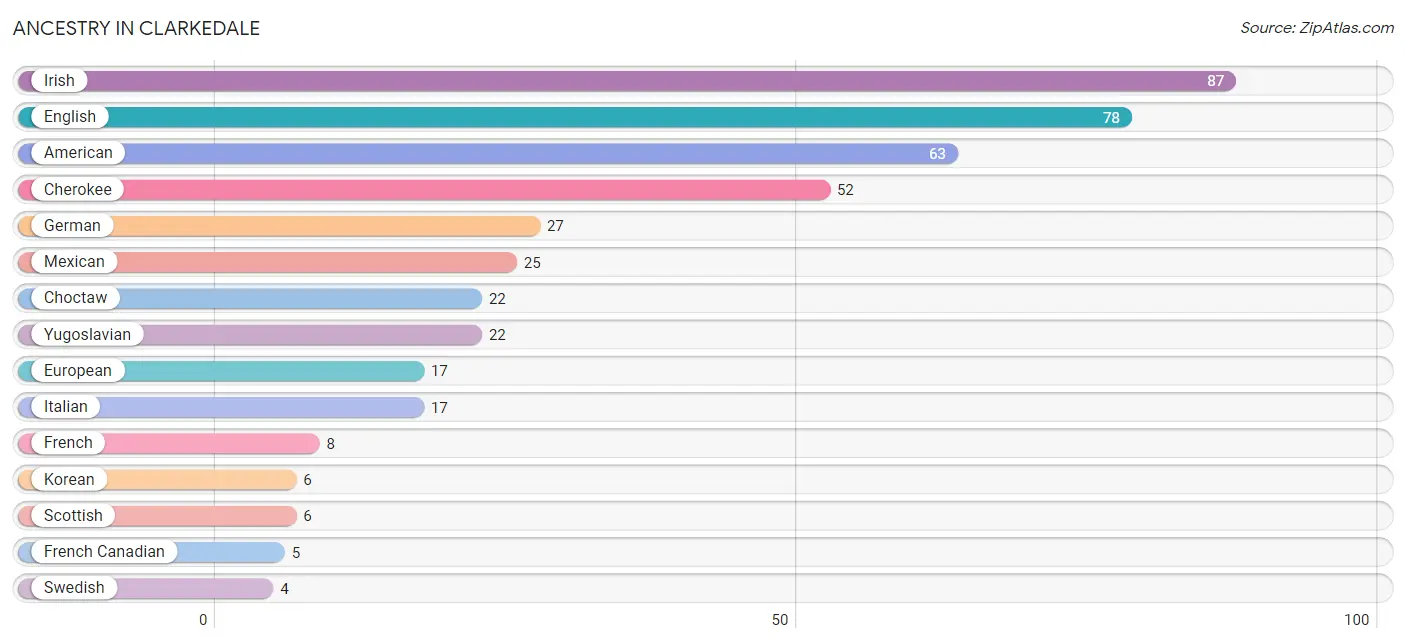
| Ancestry | # Population | % Population |
| American | 63 | 14.1% |
| Blackfeet | 3 | 0.7% |
| Cherokee | 52 | 11.7% |
| Choctaw | 22 | 4.9% |
| Crow | 3 | 0.7% |
| Dutch | 2 | 0.4% |
| English | 78 | 17.5% |
| European | 17 | 3.8% |
| French | 8 | 1.8% |
| French Canadian | 5 | 1.1% |
| German | 27 | 6.0% |
| Irish | 87 | 19.5% |
| Italian | 17 | 3.8% |
| Korean | 6 | 1.3% |
| Mexican | 25 | 5.6% |
| Scotch-Irish | 2 | 0.4% |
| Scottish | 6 | 1.3% |
| Swedish | 4 | 0.9% |
| Yugoslavian | 22 | 4.9% | View All 19 Rows |
Immigrants in Clarkedale
The most numerous immigrant groups reported in Clarkedale came from Central America (6 | 1.3%), Latin America (6 | 1.3%), and Mexico (6 | 1.3%), together accounting for 4.1% of all Clarkedale residents.
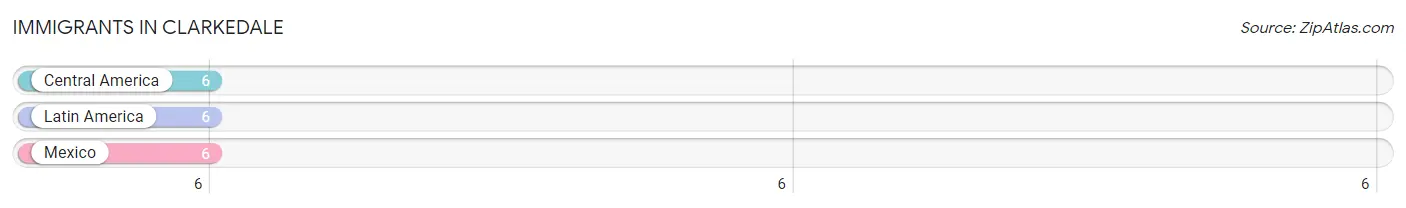
| Immigration Origin | # Population | % Population |
| Central America | 6 | 1.3% |
| Latin America | 6 | 1.3% |
| Mexico | 6 | 1.3% | View All 3 Rows |
Sex and Age in Clarkedale
Sex and Age in Clarkedale
The most populous age groups in Clarkedale are 15 to 19 Years (36 | 15.9%) for men and 50 to 54 Years (26 | 11.8%) for women.
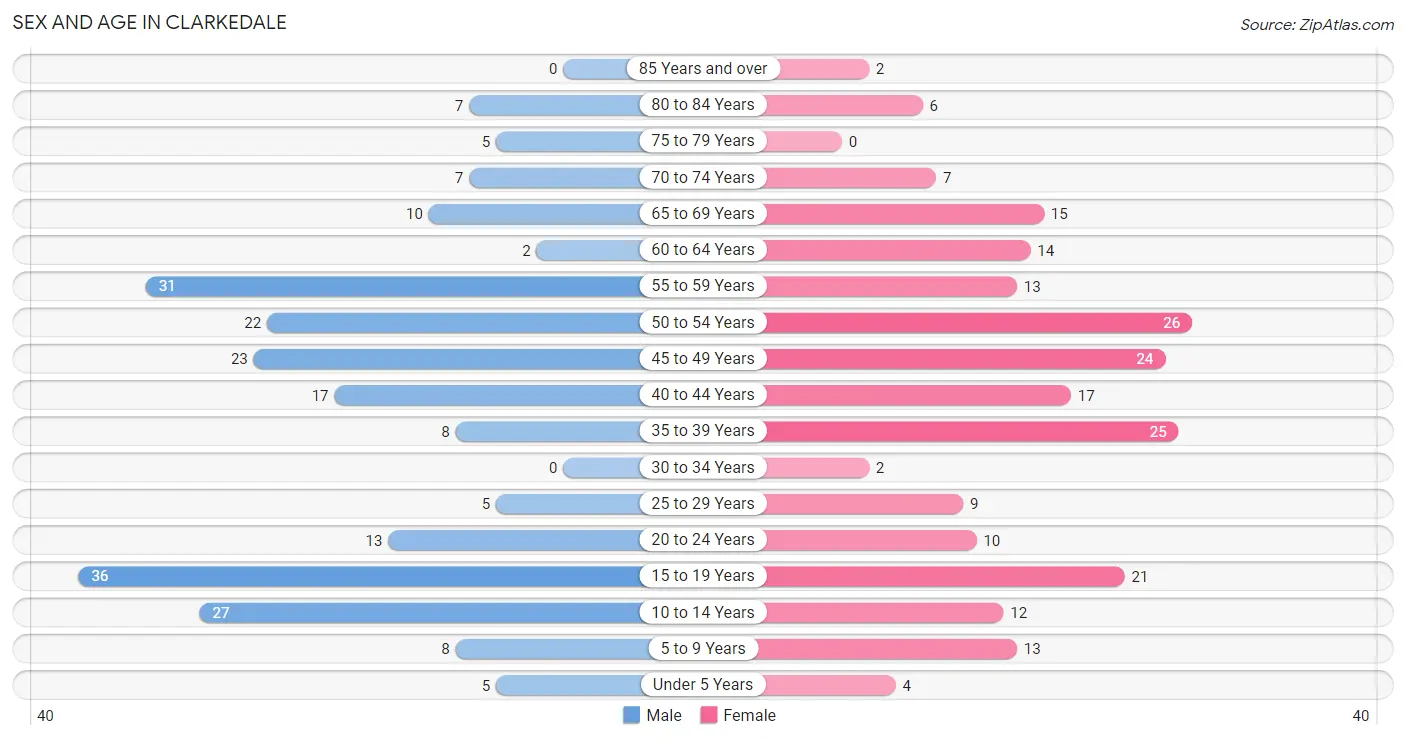
| Age Bracket | Male | Female |
| Under 5 Years | 5 (2.2%) | 4 (1.8%) |
| 5 to 9 Years | 8 (3.5%) | 13 (5.9%) |
| 10 to 14 Years | 27 (11.9%) | 12 (5.4%) |
| 15 to 19 Years | 36 (15.9%) | 21 (9.6%) |
| 20 to 24 Years | 13 (5.8%) | 10 (4.5%) |
| 25 to 29 Years | 5 (2.2%) | 9 (4.1%) |
| 30 to 34 Years | 0 (0.0%) | 2 (0.9%) |
| 35 to 39 Years | 8 (3.5%) | 25 (11.4%) |
| 40 to 44 Years | 17 (7.5%) | 17 (7.7%) |
| 45 to 49 Years | 23 (10.2%) | 24 (10.9%) |
| 50 to 54 Years | 22 (9.7%) | 26 (11.8%) |
| 55 to 59 Years | 31 (13.7%) | 13 (5.9%) |
| 60 to 64 Years | 2 (0.9%) | 14 (6.4%) |
| 65 to 69 Years | 10 (4.4%) | 15 (6.8%) |
| 70 to 74 Years | 7 (3.1%) | 7 (3.2%) |
| 75 to 79 Years | 5 (2.2%) | 0 (0.0%) |
| 80 to 84 Years | 7 (3.1%) | 6 (2.7%) |
| 85 Years and over | 0 (0.0%) | 2 (0.9%) |
| Total | 226 (100.0%) | 220 (100.0%) |
Families and Households in Clarkedale
Median Family Size in Clarkedale
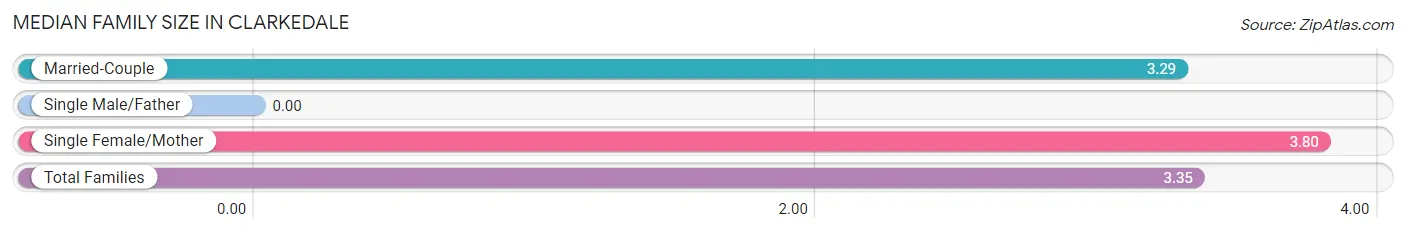
| Family Type | # Families | Family Size |
| Married-Couple | 113 (88.3%) | 3.29 |
| Single Male/Father | 0 (0.0%) | - |
| Single Female/Mother | 15 (11.7%) | 3.80 |
| Total Families | 128 (100.0%) | 3.35 |
Median Household Size in Clarkedale
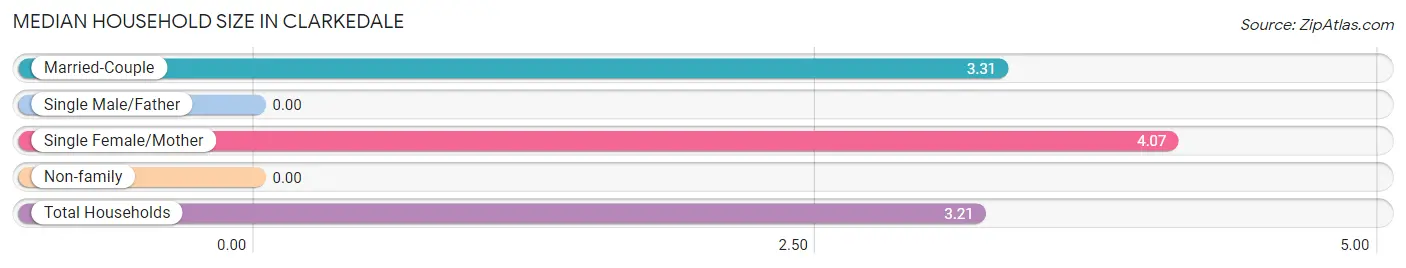
| Household Type | # Households | Household Size |
| Married-Couple | 113 (81.3%) | 3.31 |
| Single Male/Father | 0 (0.0%) | - |
| Single Female/Mother | 15 (10.8%) | 4.07 |
| Non-family | 11 (7.9%) | - |
| Total Households | 139 (100.0%) | 3.21 |
Household Size by Marriage Status in Clarkedale
Out of a total of 139 households in Clarkedale, 128 (92.1%) are family households, while 11 (7.9%) are nonfamily households. The most numerous type of family households are 2-person households, comprising 52, and the most common type of nonfamily households are 1-person households, comprising 11.
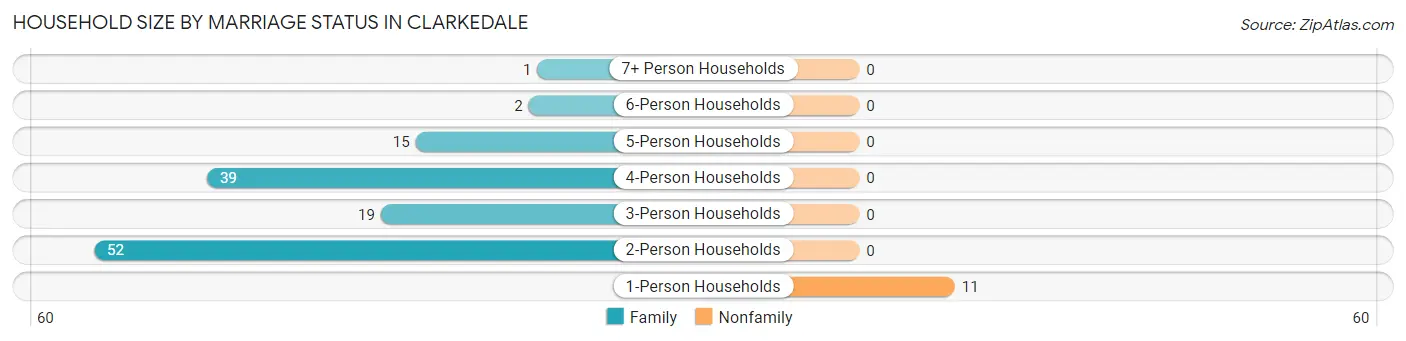
| Household Size | Family Households | Nonfamily Households |
| 1-Person Households | - | 11 (7.9%) |
| 2-Person Households | 52 (37.4%) | 0 (0.0%) |
| 3-Person Households | 19 (13.7%) | 0 (0.0%) |
| 4-Person Households | 39 (28.1%) | 0 (0.0%) |
| 5-Person Households | 15 (10.8%) | 0 (0.0%) |
| 6-Person Households | 2 (1.4%) | 0 (0.0%) |
| 7+ Person Households | 1 (0.7%) | 0 (0.0%) |
| Total | 128 (92.1%) | 11 (7.9%) |
Female Fertility in Clarkedale
Fertility by Age in Clarkedale
Average fertility rate in Clarkedale is 9.0 births per 1,000 women. Women in the age bracket of 20 to 34 years have the highest fertility rate with 48.0 births per 1,000 women. Women in the age bracket of 20 to 34 years acount for 100.0% of all women with births.
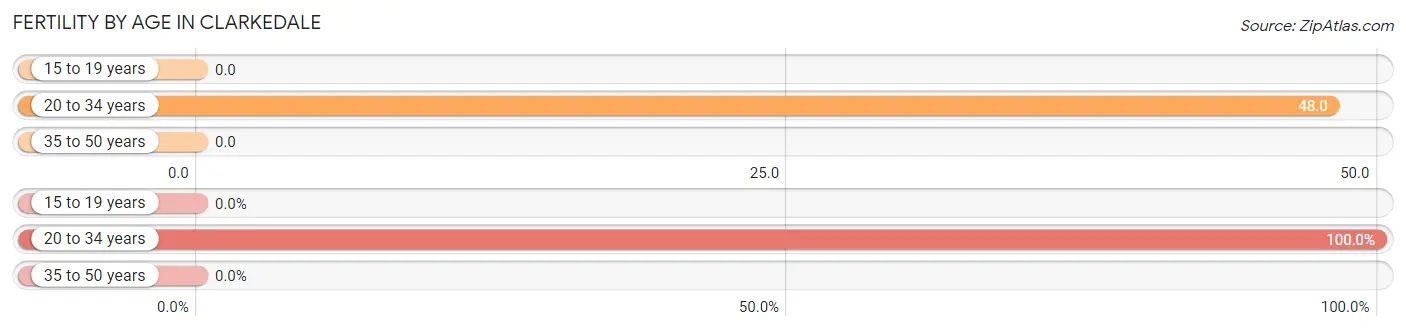
| Age Bracket | Women with Births | Births / 1,000 Women |
| 15 to 19 years | 0 (0.0%) | 0.0 |
| 20 to 34 years | 1 (100.0%) | 48.0 |
| 35 to 50 years | 0 (0.0%) | 0.0 |
| Total | 1 (100.0%) | 9.0 |
Fertility by Age by Marriage Status in Clarkedale
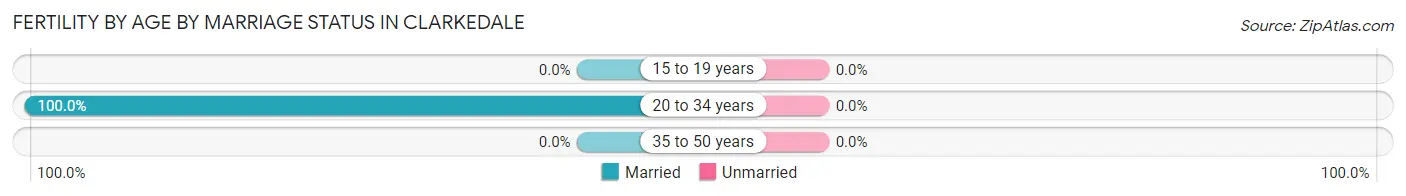
| Age Bracket | Married | Unmarried |
| 15 to 19 years | 0 (0.0%) | 0 (0.0%) |
| 20 to 34 years | 1 (100.0%) | 0 (0.0%) |
| 35 to 50 years | 0 (0.0%) | 0 (0.0%) |
| Total | 1 (100.0%) | 0 (0.0%) |
Fertility by Education in Clarkedale
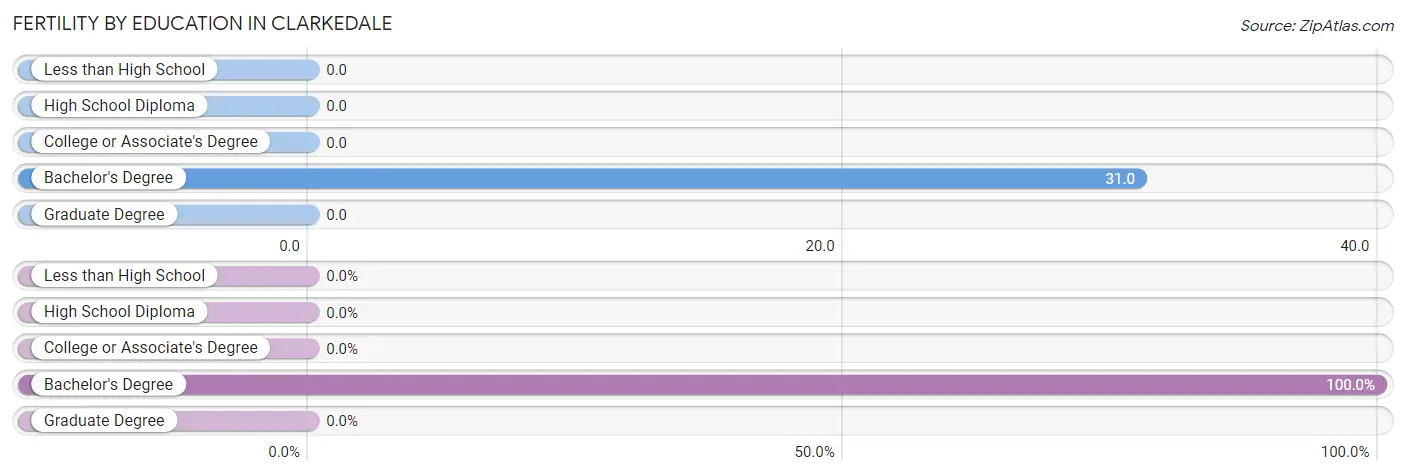
| Educational Attainment | Women with Births | Births / 1,000 Women |
| Less than High School | 0 (0.0%) | 0.0 |
| High School Diploma | 0 (0.0%) | 0.0 |
| College or Associate's Degree | 0 (0.0%) | 0.0 |
| Bachelor's Degree | 1 (100.0%) | 31.0 |
| Graduate Degree | 0 (0.0%) | 0.0 |
| Total | 1 (100.0%) | 9.0 |
Fertility by Education by Marriage Status in Clarkedale
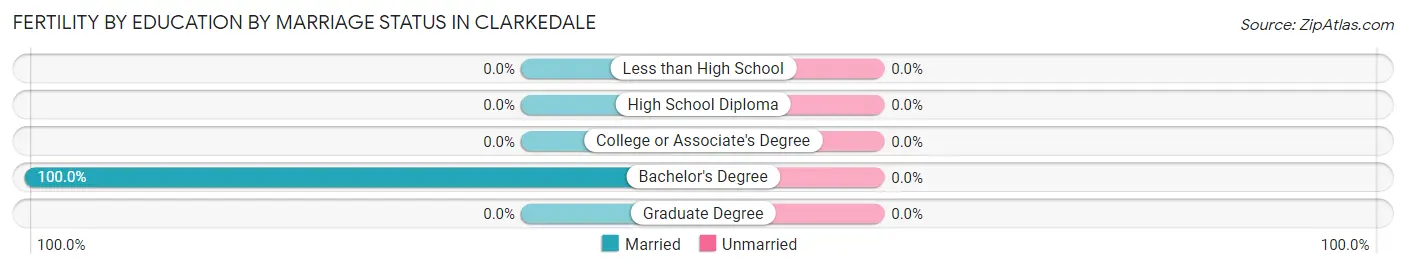
| Educational Attainment | Married | Unmarried |
| Less than High School | 0 (0.0%) | 0 (0.0%) |
| High School Diploma | 0 (0.0%) | 0 (0.0%) |
| College or Associate's Degree | 0 (0.0%) | 0 (0.0%) |
| Bachelor's Degree | 1 (100.0%) | 0 (0.0%) |
| Graduate Degree | 0 (0.0%) | 0 (0.0%) |
| Total | 1 (100.0%) | 0 (0.0%) |
Employment Characteristics in Clarkedale
Employment by Class of Employer in Clarkedale
Among the 244 employed individuals in Clarkedale, private company employees (160 | 65.6%), self-employed (not incorporated) (34 | 13.9%), and not-for-profit organizations (15 | 6.1%) make up the most common classes of employment.
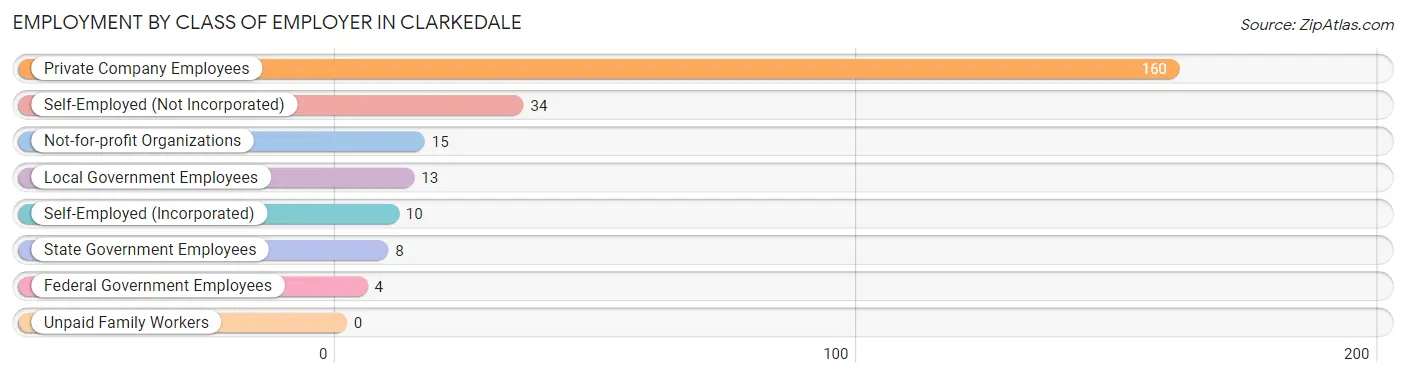
| Employer Class | # Employees | % Employees |
| Private Company Employees | 160 | 65.6% |
| Self-Employed (Incorporated) | 10 | 4.1% |
| Self-Employed (Not Incorporated) | 34 | 13.9% |
| Not-for-profit Organizations | 15 | 6.1% |
| Local Government Employees | 13 | 5.3% |
| State Government Employees | 8 | 3.3% |
| Federal Government Employees | 4 | 1.6% |
| Unpaid Family Workers | 0 | 0.0% |
| Total | 244 | 100.0% |
Employment Status by Age in Clarkedale
According to the labor force statistics for Clarkedale, out of the total population over 16 years of age (359), 69.6% or 250 individuals are in the labor force, with 2.4% or 6 of them unemployed. The age group with the highest labor force participation rate is 30 to 34 years, with 100.0% or 2 individuals in the labor force. Within the labor force, the 20 to 24 years age range has the highest percentage of unemployed individuals, with 20.0% or 4 of them being unemployed.
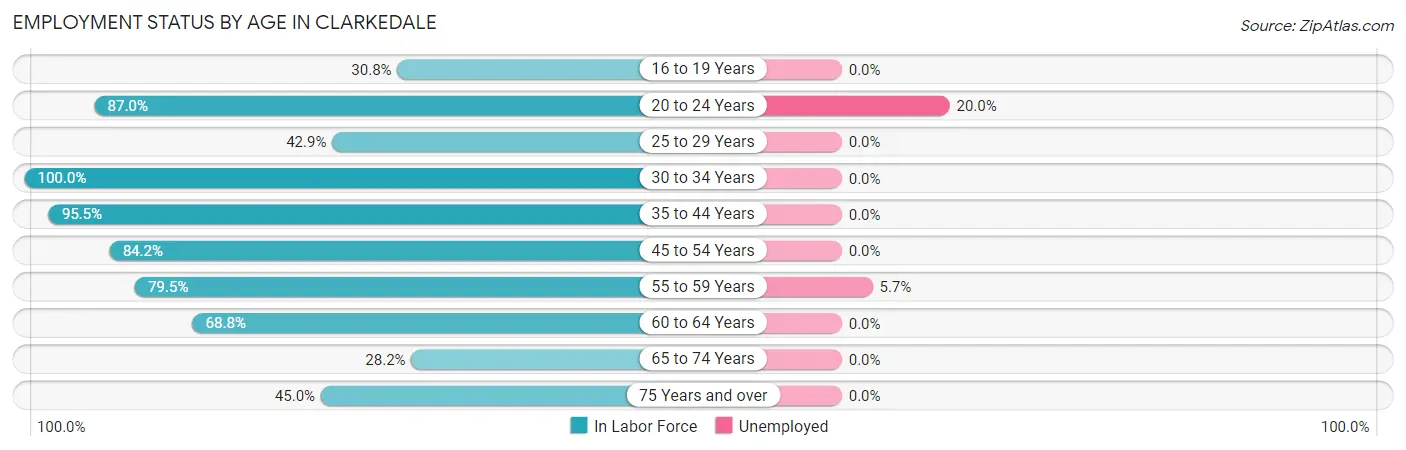
| Age Bracket | In Labor Force | Unemployed |
| 16 to 19 Years | 12 (30.8%) | 0 (0.0%) |
| 20 to 24 Years | 20 (87.0%) | 4 (20.0%) |
| 25 to 29 Years | 6 (42.9%) | 0 (0.0%) |
| 30 to 34 Years | 2 (100.0%) | 0 (0.0%) |
| 35 to 44 Years | 64 (95.5%) | 0 (0.0%) |
| 45 to 54 Years | 80 (84.2%) | 0 (0.0%) |
| 55 to 59 Years | 35 (79.5%) | 2 (5.7%) |
| 60 to 64 Years | 11 (68.8%) | 0 (0.0%) |
| 65 to 74 Years | 11 (28.2%) | 0 (0.0%) |
| 75 Years and over | 9 (45.0%) | 0 (0.0%) |
| Total | 250 (69.6%) | 6 (2.4%) |
Employment Status by Educational Attainment in Clarkedale
According to labor force statistics for Clarkedale, 83.2% of individuals (198) out of the total population between 25 and 64 years of age (238) are in the labor force, with 1.0% or 2 of them being unemployed. The group with the highest labor force participation rate are those with the educational attainment of bachelor's degree or higher, with 91.9% or 79 individuals in the labor force. Within the labor force, individuals with high school diploma education have the highest percentage of unemployment, with 6.1% or 2 of them being unemployed.
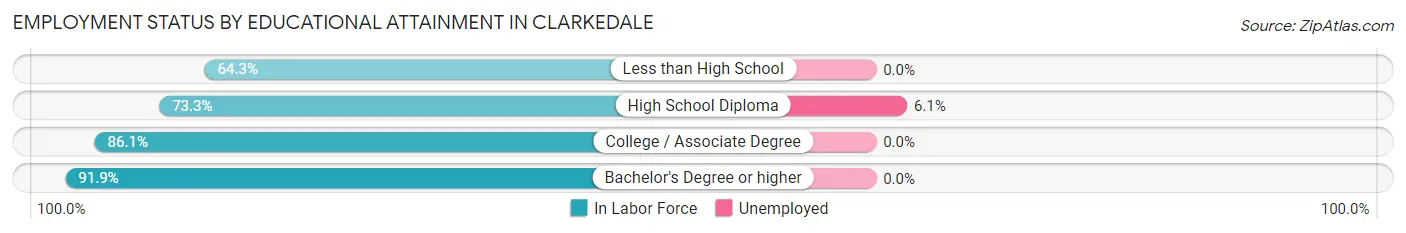
| Educational Attainment | In Labor Force | Unemployed |
| Less than High School | 18 (64.3%) | 0 (0.0%) |
| High School Diploma | 33 (73.3%) | 3 (6.1%) |
| College / Associate Degree | 68 (86.1%) | 0 (0.0%) |
| Bachelor's Degree or higher | 79 (91.9%) | 0 (0.0%) |
| Total | 198 (83.2%) | 2 (1.0%) |
Employment Occupations by Sex in Clarkedale
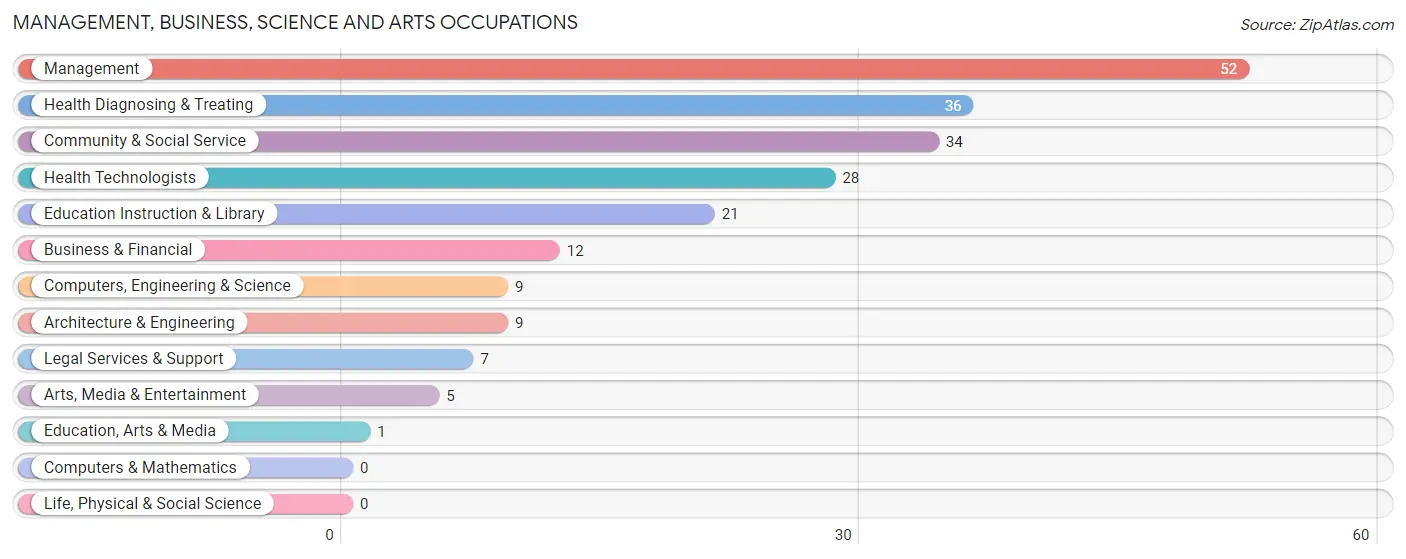
Management, Business, Science and Arts Occupations
The most common Management, Business, Science and Arts occupations in Clarkedale are Management (52 | 21.3%), Health Diagnosing & Treating (36 | 14.7%), Community & Social Service (34 | 13.9%), Health Technologists (28 | 11.5%), and Education Instruction & Library (21 | 8.6%).
Management, Business, Science and Arts Occupations by Sex
Within the Management, Business, Science and Arts occupations in Clarkedale, the most male-oriented occupations are Legal Services & Support (100.0%), Arts, Media & Entertainment (100.0%), and Computers, Engineering & Science (66.7%), while the most female-oriented occupations are Education, Arts & Media (100.0%), Health Technologists (67.9%), and Education Instruction & Library (66.7%).
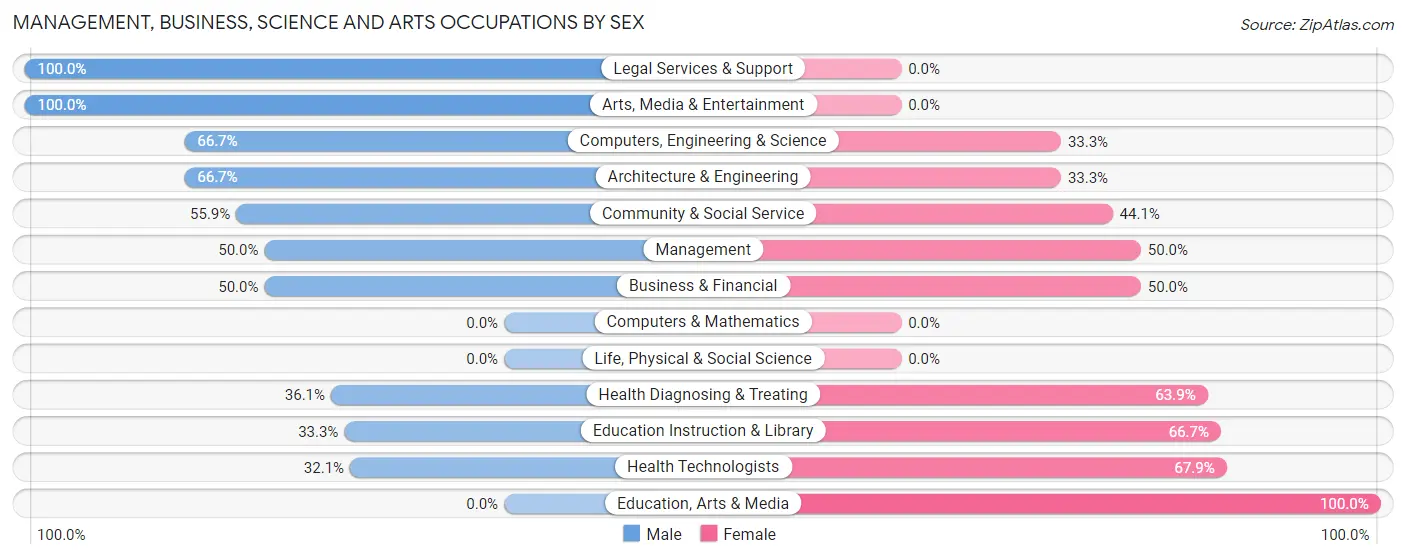
| Occupation | Male | Female |
| Management | 26 (50.0%) | 26 (50.0%) |
| Business & Financial | 6 (50.0%) | 6 (50.0%) |
| Computers, Engineering & Science | 6 (66.7%) | 3 (33.3%) |
| Computers & Mathematics | 0 (0.0%) | 0 (0.0%) |
| Architecture & Engineering | 6 (66.7%) | 3 (33.3%) |
| Life, Physical & Social Science | 0 (0.0%) | 0 (0.0%) |
| Community & Social Service | 19 (55.9%) | 15 (44.1%) |
| Education, Arts & Media | 0 (0.0%) | 1 (100.0%) |
| Legal Services & Support | 7 (100.0%) | 0 (0.0%) |
| Education Instruction & Library | 7 (33.3%) | 14 (66.7%) |
| Arts, Media & Entertainment | 5 (100.0%) | 0 (0.0%) |
| Health Diagnosing & Treating | 13 (36.1%) | 23 (63.9%) |
| Health Technologists | 9 (32.1%) | 19 (67.9%) |
| Total (Category) | 70 (48.9%) | 73 (51.0%) |
| Total (Overall) | 137 (56.1%) | 107 (43.9%) |
Services Occupations
The most common Services occupations in Clarkedale are Personal Care & Service (9 | 3.7%), Cleaning & Maintenance (5 | 2.1%), Food Preparation & Serving (3 | 1.2%), and Healthcare Support (2 | 0.8%).
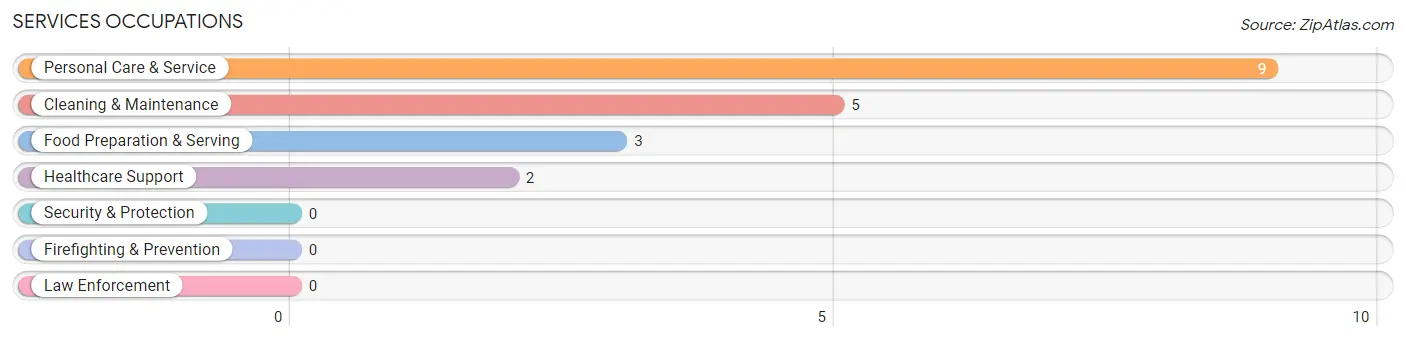
Services Occupations by Sex
Within the Services occupations in Clarkedale, the most male-oriented occupations are Food Preparation & Serving (100.0%), and Cleaning & Maintenance (100.0%), while the most female-oriented occupations are Healthcare Support (100.0%), and Personal Care & Service (100.0%).
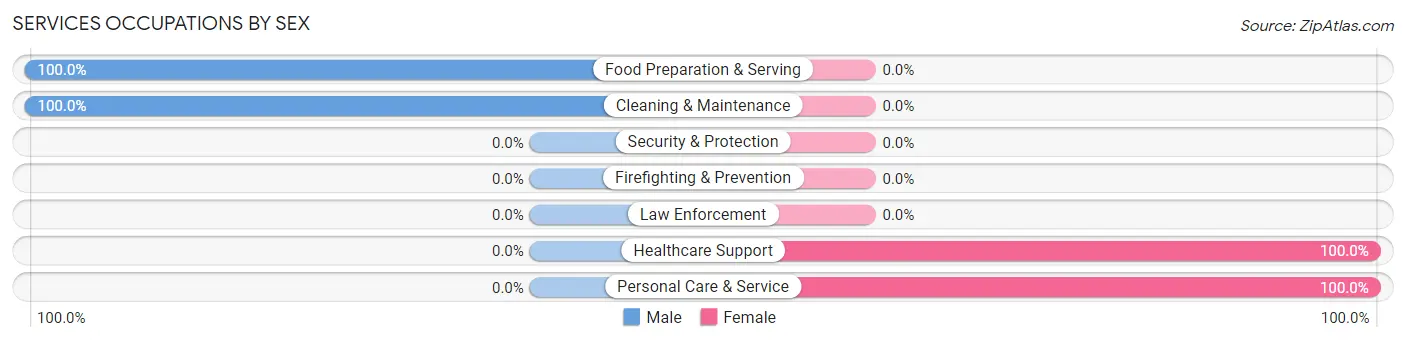
| Occupation | Male | Female |
| Healthcare Support | 0 (0.0%) | 2 (100.0%) |
| Security & Protection | 0 (0.0%) | 0 (0.0%) |
| Firefighting & Prevention | 0 (0.0%) | 0 (0.0%) |
| Law Enforcement | 0 (0.0%) | 0 (0.0%) |
| Food Preparation & Serving | 3 (100.0%) | 0 (0.0%) |
| Cleaning & Maintenance | 5 (100.0%) | 0 (0.0%) |
| Personal Care & Service | 0 (0.0%) | 9 (100.0%) |
| Total (Category) | 8 (42.1%) | 11 (57.9%) |
| Total (Overall) | 137 (56.1%) | 107 (43.9%) |
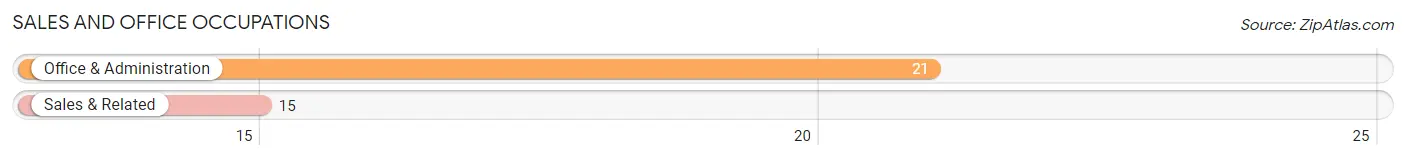
Sales and Office Occupations
The most common Sales and Office occupations in Clarkedale are Office & Administration (21 | 8.6%), and Sales & Related (15 | 6.1%).
Sales and Office Occupations by Sex
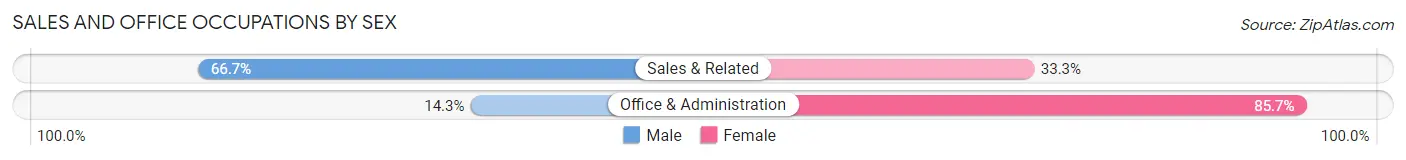
| Occupation | Male | Female |
| Sales & Related | 10 (66.7%) | 5 (33.3%) |
| Office & Administration | 3 (14.3%) | 18 (85.7%) |
| Total (Category) | 13 (36.1%) | 23 (63.9%) |
| Total (Overall) | 137 (56.1%) | 107 (43.9%) |
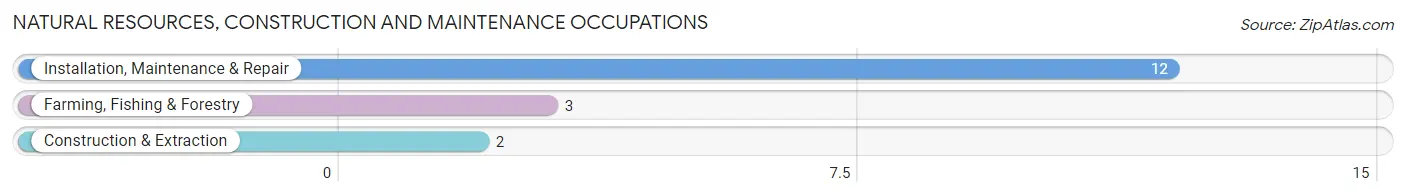
Natural Resources, Construction and Maintenance Occupations
The most common Natural Resources, Construction and Maintenance occupations in Clarkedale are Installation, Maintenance & Repair (12 | 4.9%), Farming, Fishing & Forestry (3 | 1.2%), and Construction & Extraction (2 | 0.8%).
Natural Resources, Construction and Maintenance Occupations by Sex
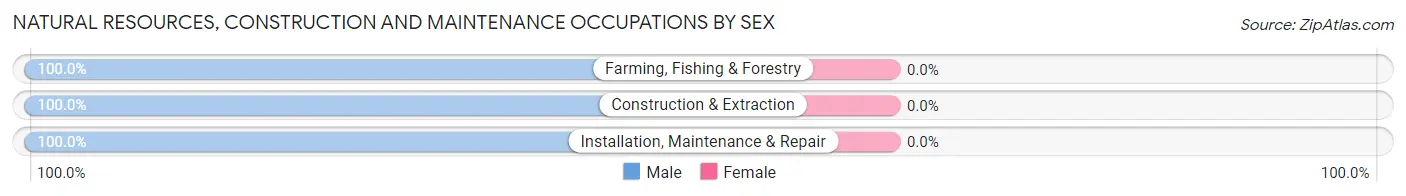
| Occupation | Male | Female |
| Farming, Fishing & Forestry | 3 (100.0%) | 0 (0.0%) |
| Construction & Extraction | 2 (100.0%) | 0 (0.0%) |
| Installation, Maintenance & Repair | 12 (100.0%) | 0 (0.0%) |
| Total (Category) | 17 (100.0%) | 0 (0.0%) |
| Total (Overall) | 137 (56.1%) | 107 (43.9%) |
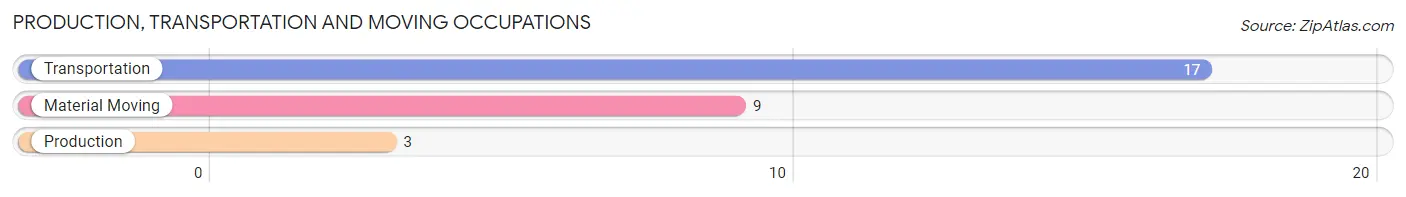
Production, Transportation and Moving Occupations
The most common Production, Transportation and Moving occupations in Clarkedale are Transportation (17 | 7.0%), Material Moving (9 | 3.7%), and Production (3 | 1.2%).
Production, Transportation and Moving Occupations by Sex
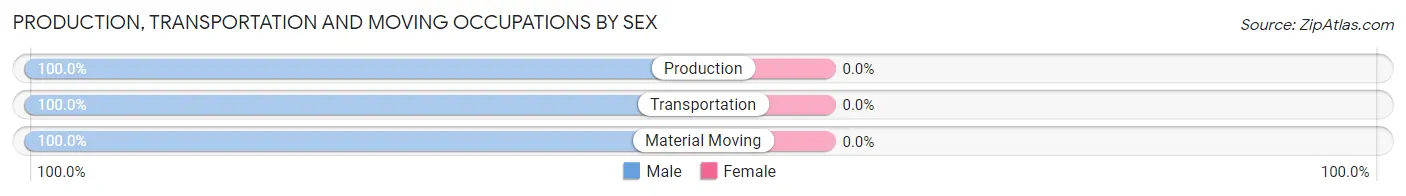
| Occupation | Male | Female |
| Production | 3 (100.0%) | 0 (0.0%) |
| Transportation | 17 (100.0%) | 0 (0.0%) |
| Material Moving | 9 (100.0%) | 0 (0.0%) |
| Total (Category) | 29 (100.0%) | 0 (0.0%) |
| Total (Overall) | 137 (56.1%) | 107 (43.9%) |
Employment Industries by Sex in Clarkedale
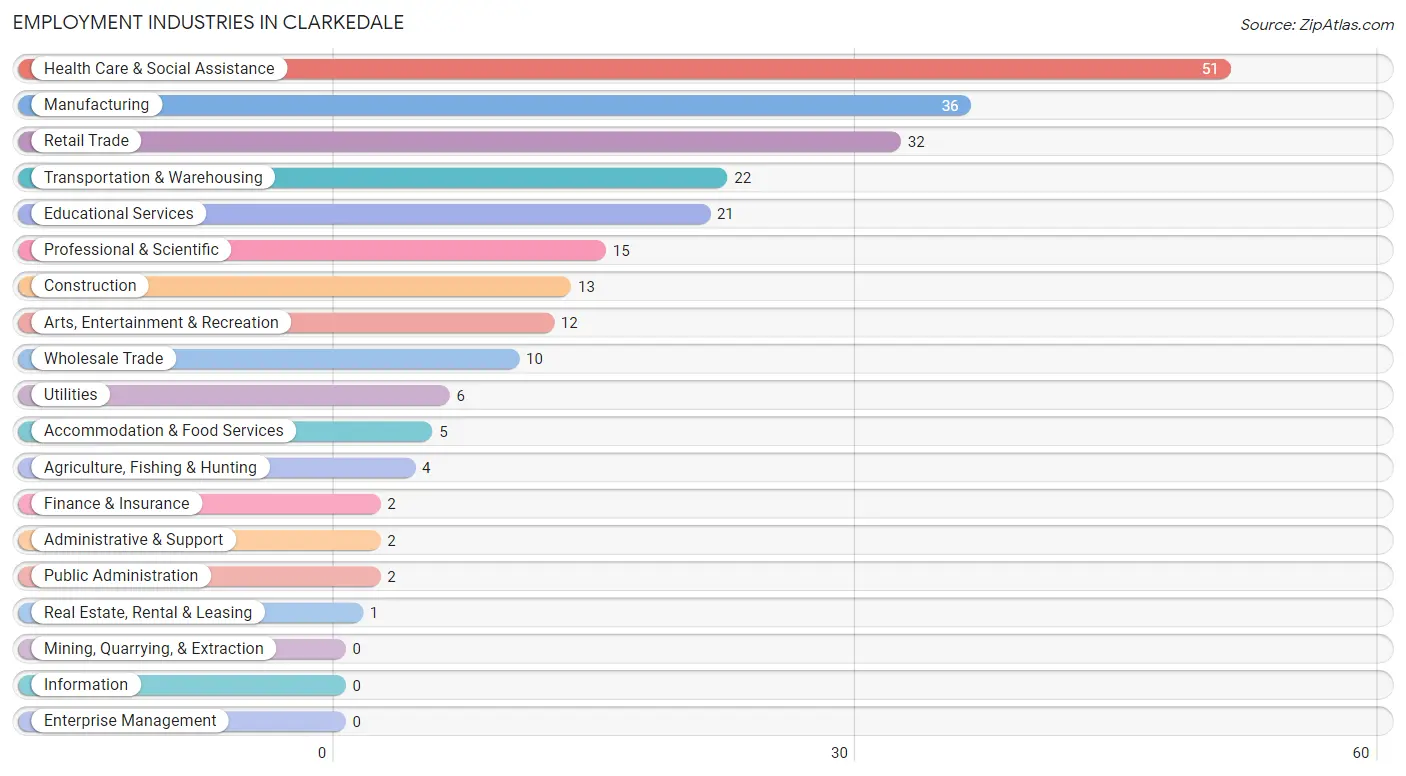
Employment Industries in Clarkedale
The major employment industries in Clarkedale include Health Care & Social Assistance (51 | 20.9%), Manufacturing (36 | 14.7%), Retail Trade (32 | 13.1%), Transportation & Warehousing (22 | 9.0%), and Educational Services (21 | 8.6%).
Employment Industries by Sex in Clarkedale
The Clarkedale industries that see more men than women are Wholesale Trade (100.0%), Transportation & Warehousing (100.0%), and Utilities (100.0%), whereas the industries that tend to have a higher number of women are Finance & Insurance (100.0%), Educational Services (90.5%), and Health Care & Social Assistance (62.7%).
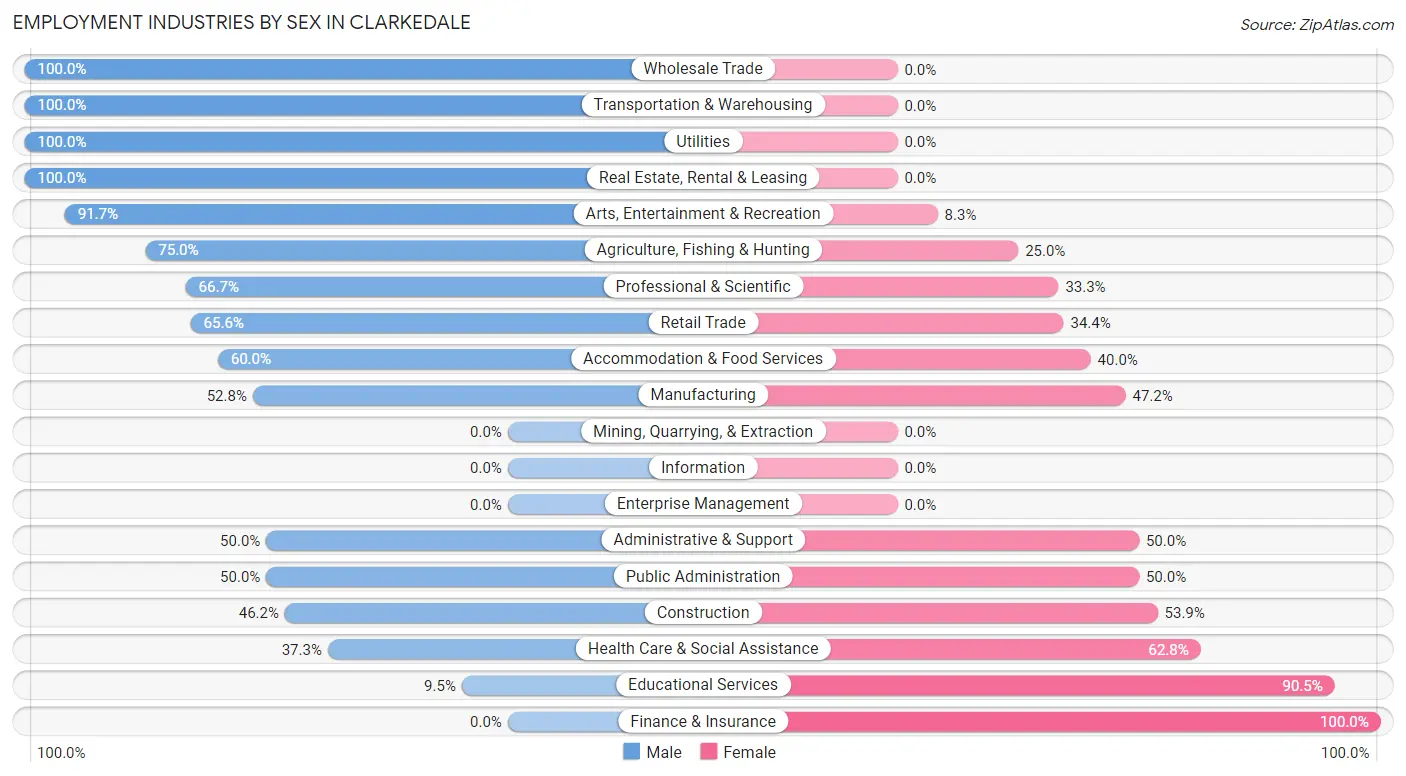
| Industry | Male | Female |
| Agriculture, Fishing & Hunting | 3 (75.0%) | 1 (25.0%) |
| Mining, Quarrying, & Extraction | 0 (0.0%) | 0 (0.0%) |
| Construction | 6 (46.2%) | 7 (53.8%) |
| Manufacturing | 19 (52.8%) | 17 (47.2%) |
| Wholesale Trade | 10 (100.0%) | 0 (0.0%) |
| Retail Trade | 21 (65.6%) | 11 (34.4%) |
| Transportation & Warehousing | 22 (100.0%) | 0 (0.0%) |
| Utilities | 6 (100.0%) | 0 (0.0%) |
| Information | 0 (0.0%) | 0 (0.0%) |
| Finance & Insurance | 0 (0.0%) | 2 (100.0%) |
| Real Estate, Rental & Leasing | 1 (100.0%) | 0 (0.0%) |
| Professional & Scientific | 10 (66.7%) | 5 (33.3%) |
| Enterprise Management | 0 (0.0%) | 0 (0.0%) |
| Administrative & Support | 1 (50.0%) | 1 (50.0%) |
| Educational Services | 2 (9.5%) | 19 (90.5%) |
| Health Care & Social Assistance | 19 (37.2%) | 32 (62.7%) |
| Arts, Entertainment & Recreation | 11 (91.7%) | 1 (8.3%) |
| Accommodation & Food Services | 3 (60.0%) | 2 (40.0%) |
| Public Administration | 1 (50.0%) | 1 (50.0%) |
| Total | 137 (56.1%) | 107 (43.9%) |
Education in Clarkedale
School Enrollment in Clarkedale
The most common levels of schooling among the 136 students in Clarkedale are high school (46 | 33.8%), middle school (31 | 22.8%), and college / undergraduate (29 | 21.3%).
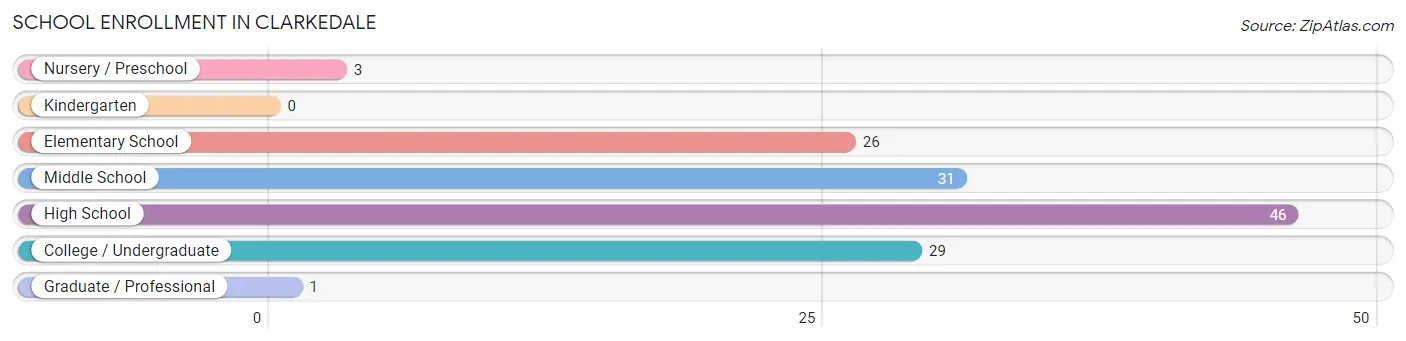
| School Level | # Students | % Students |
| Nursery / Preschool | 3 | 2.2% |
| Kindergarten | 0 | 0.0% |
| Elementary School | 26 | 19.1% |
| Middle School | 31 | 22.8% |
| High School | 46 | 33.8% |
| College / Undergraduate | 29 | 21.3% |
| Graduate / Professional | 1 | 0.7% |
| Total | 136 | 100.0% |
School Enrollment by Age by Funding Source in Clarkedale
Out of a total of 136 students who are enrolled in schools in Clarkedale, 39 (28.7%) attend a private institution, while the remaining 97 (71.3%) are enrolled in public schools. The age group of 3 to 4 year olds has the highest likelihood of being enrolled in private schools, with 3 (100.0% in the age bracket) enrolled. Conversely, the age group of 35 years and over has the lowest likelihood of being enrolled in a private school, with 1 (100.0% in the age bracket) attending a public institution.
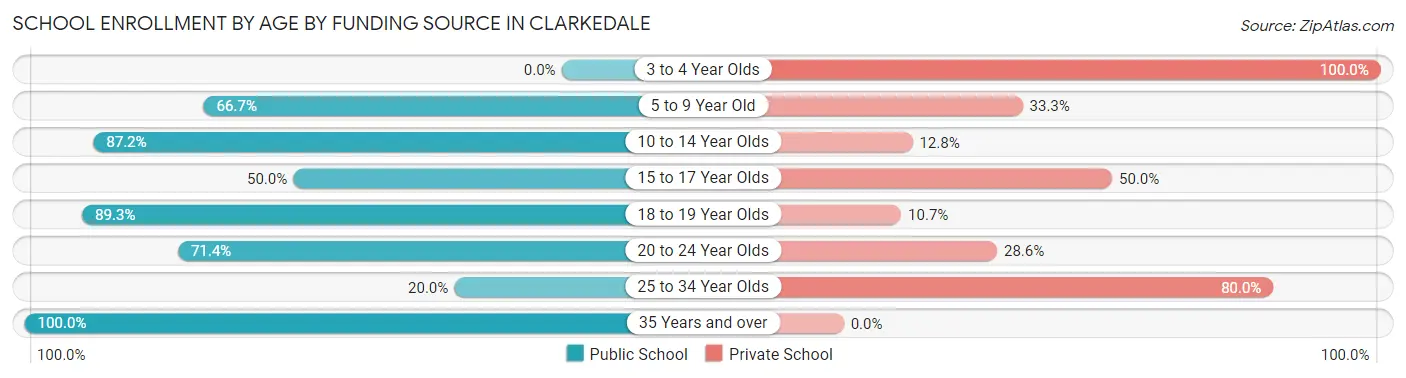
| Age Bracket | Public School | Private School |
| 3 to 4 Year Olds | 0 (0.0%) | 3 (100.0%) |
| 5 to 9 Year Old | 12 (66.7%) | 6 (33.3%) |
| 10 to 14 Year Olds | 34 (87.2%) | 5 (12.8%) |
| 15 to 17 Year Olds | 14 (50.0%) | 14 (50.0%) |
| 18 to 19 Year Olds | 25 (89.3%) | 3 (10.7%) |
| 20 to 24 Year Olds | 10 (71.4%) | 4 (28.6%) |
| 25 to 34 Year Olds | 1 (20.0%) | 4 (80.0%) |
| 35 Years and over | 1 (100.0%) | 0 (0.0%) |
| Total | 97 (71.3%) | 39 (28.7%) |
Educational Attainment by Field of Study in Clarkedale
Business (36 | 34.9%), education (21 | 20.4%), science & technology (16 | 15.5%), bio, nature & agricultural (13 | 12.6%), and engineering (9 | 8.7%) are the most common fields of study among 103 individuals in Clarkedale who have obtained a bachelor's degree or higher.
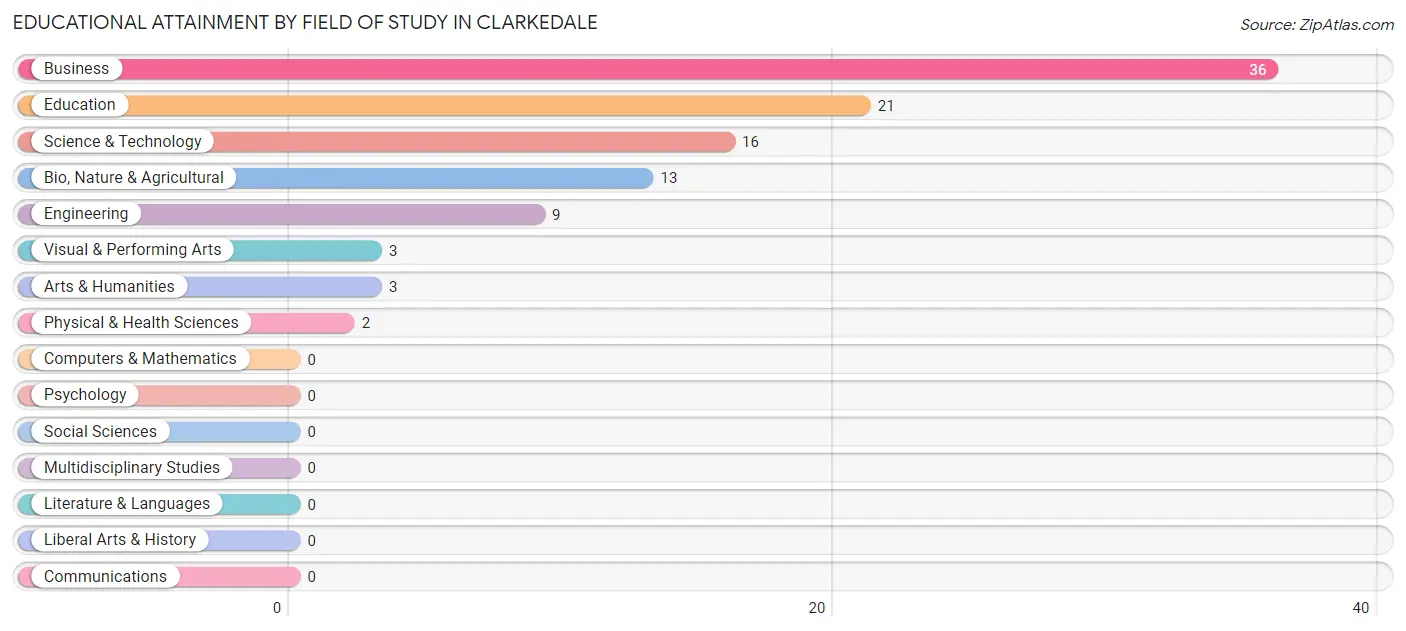
| Field of Study | # Graduates | % Graduates |
| Computers & Mathematics | 0 | 0.0% |
| Bio, Nature & Agricultural | 13 | 12.6% |
| Physical & Health Sciences | 2 | 1.9% |
| Psychology | 0 | 0.0% |
| Social Sciences | 0 | 0.0% |
| Engineering | 9 | 8.7% |
| Multidisciplinary Studies | 0 | 0.0% |
| Science & Technology | 16 | 15.5% |
| Business | 36 | 34.9% |
| Education | 21 | 20.4% |
| Literature & Languages | 0 | 0.0% |
| Liberal Arts & History | 0 | 0.0% |
| Visual & Performing Arts | 3 | 2.9% |
| Communications | 0 | 0.0% |
| Arts & Humanities | 3 | 2.9% |
| Total | 103 | 100.0% |
Transportation & Commute in Clarkedale
Vehicle Availability by Sex in Clarkedale
The most prevalent vehicle ownership categories in Clarkedale are males with 3 vehicles (43, accounting for 31.4%) and females with 3 vehicles (34, making up 40.2%).
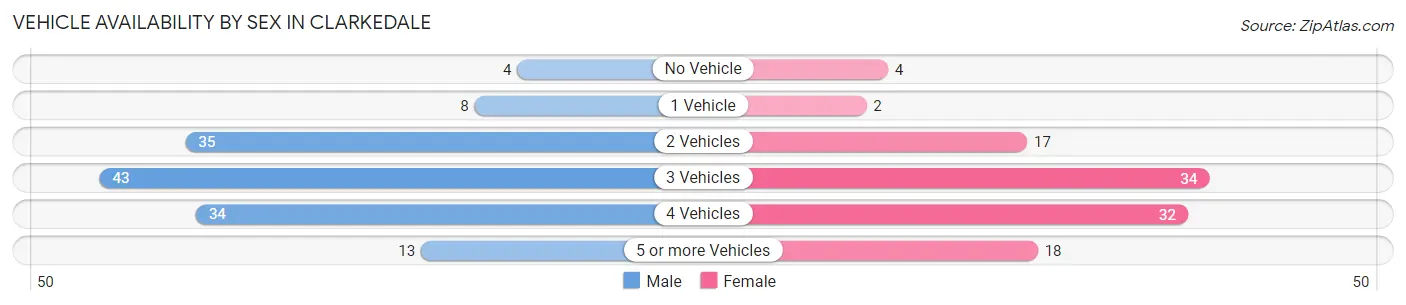
| Vehicles Available | Male | Female |
| No Vehicle | 4 (2.9%) | 4 (3.7%) |
| 1 Vehicle | 8 (5.8%) | 2 (1.9%) |
| 2 Vehicles | 35 (25.6%) | 17 (15.9%) |
| 3 Vehicles | 43 (31.4%) | 34 (31.8%) |
| 4 Vehicles | 34 (24.8%) | 32 (29.9%) |
| 5 or more Vehicles | 13 (9.5%) | 18 (16.8%) |
| Total | 137 (100.0%) | 107 (100.0%) |
Commute Time in Clarkedale
The most frequently occuring commute durations in Clarkedale are 30 to 34 minutes (37 commuters, 16.4%), 5 to 9 minutes (27 commuters, 12.0%), and 40 to 44 minutes (25 commuters, 11.1%).
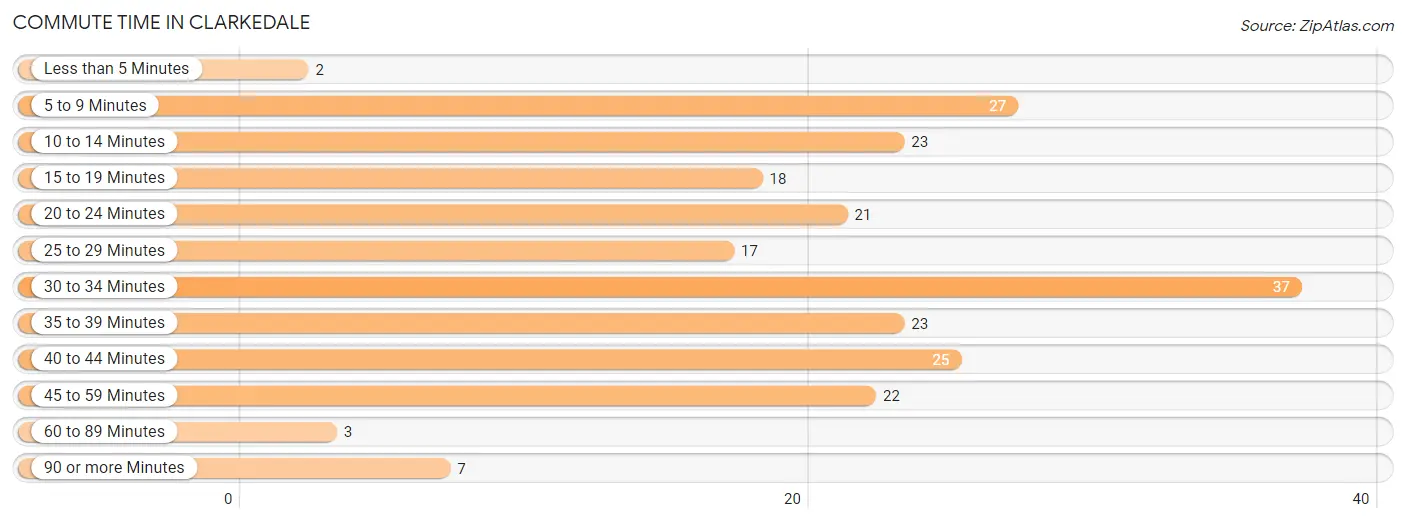
| Commute Time | # Commuters | % Commuters |
| Less than 5 Minutes | 2 | 0.9% |
| 5 to 9 Minutes | 27 | 12.0% |
| 10 to 14 Minutes | 23 | 10.2% |
| 15 to 19 Minutes | 18 | 8.0% |
| 20 to 24 Minutes | 21 | 9.3% |
| 25 to 29 Minutes | 17 | 7.6% |
| 30 to 34 Minutes | 37 | 16.4% |
| 35 to 39 Minutes | 23 | 10.2% |
| 40 to 44 Minutes | 25 | 11.1% |
| 45 to 59 Minutes | 22 | 9.8% |
| 60 to 89 Minutes | 3 | 1.3% |
| 90 or more Minutes | 7 | 3.1% |
Commute Time by Sex in Clarkedale
The most common commute times in Clarkedale are 30 to 34 minutes (22 commuters, 17.5%) for males and 35 to 39 minutes (19 commuters, 19.2%) for females.
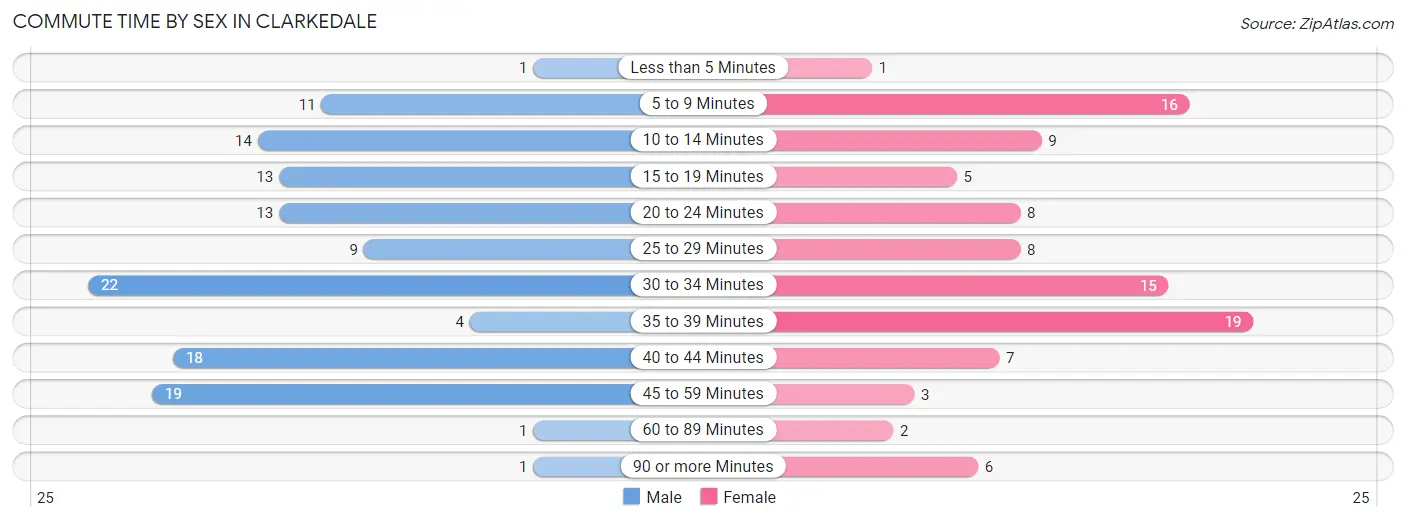
| Commute Time | Male | Female |
| Less than 5 Minutes | 1 (0.8%) | 1 (1.0%) |
| 5 to 9 Minutes | 11 (8.7%) | 16 (16.2%) |
| 10 to 14 Minutes | 14 (11.1%) | 9 (9.1%) |
| 15 to 19 Minutes | 13 (10.3%) | 5 (5.1%) |
| 20 to 24 Minutes | 13 (10.3%) | 8 (8.1%) |
| 25 to 29 Minutes | 9 (7.1%) | 8 (8.1%) |
| 30 to 34 Minutes | 22 (17.5%) | 15 (15.1%) |
| 35 to 39 Minutes | 4 (3.2%) | 19 (19.2%) |
| 40 to 44 Minutes | 18 (14.3%) | 7 (7.1%) |
| 45 to 59 Minutes | 19 (15.1%) | 3 (3.0%) |
| 60 to 89 Minutes | 1 (0.8%) | 2 (2.0%) |
| 90 or more Minutes | 1 (0.8%) | 6 (6.1%) |
Time of Departure to Work by Sex in Clarkedale
The most frequent times of departure to work in Clarkedale are 8:00 AM to 8:29 AM (31, 24.6%) for males and 7:00 AM to 7:29 AM (31, 31.3%) for females.
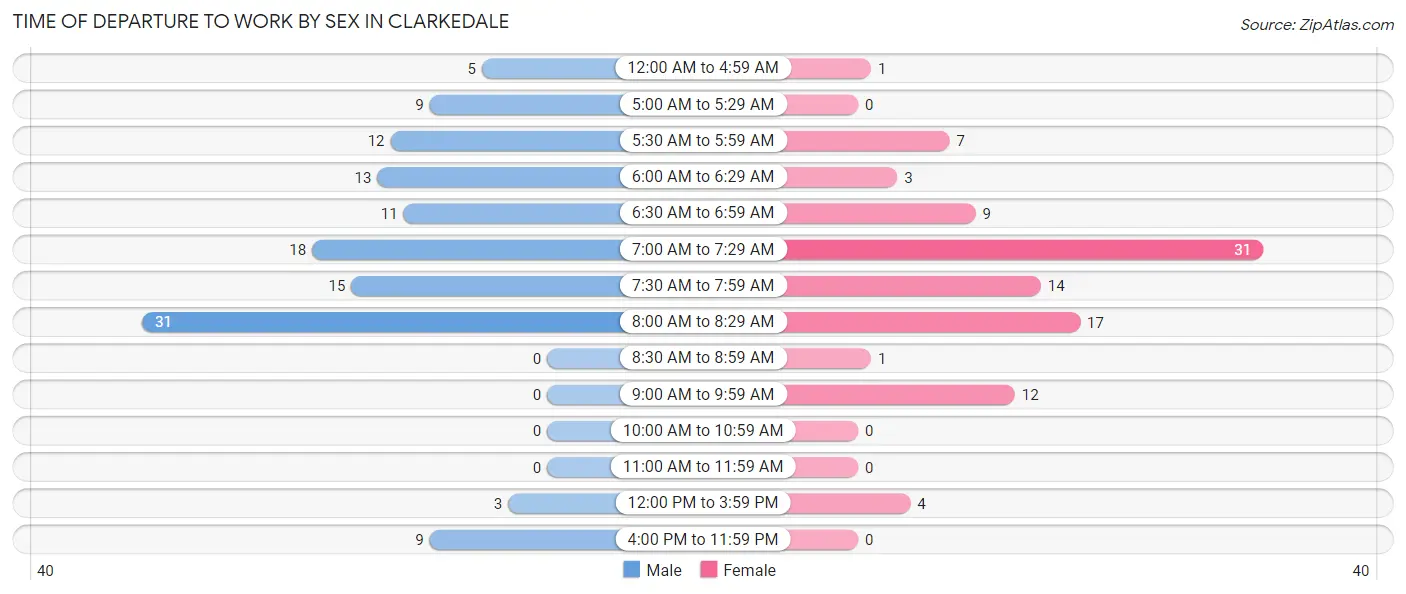
| Time of Departure | Male | Female |
| 12:00 AM to 4:59 AM | 5 (4.0%) | 1 (1.0%) |
| 5:00 AM to 5:29 AM | 9 (7.1%) | 0 (0.0%) |
| 5:30 AM to 5:59 AM | 12 (9.5%) | 7 (7.1%) |
| 6:00 AM to 6:29 AM | 13 (10.3%) | 3 (3.0%) |
| 6:30 AM to 6:59 AM | 11 (8.7%) | 9 (9.1%) |
| 7:00 AM to 7:29 AM | 18 (14.3%) | 31 (31.3%) |
| 7:30 AM to 7:59 AM | 15 (11.9%) | 14 (14.1%) |
| 8:00 AM to 8:29 AM | 31 (24.6%) | 17 (17.2%) |
| 8:30 AM to 8:59 AM | 0 (0.0%) | 1 (1.0%) |
| 9:00 AM to 9:59 AM | 0 (0.0%) | 12 (12.1%) |
| 10:00 AM to 10:59 AM | 0 (0.0%) | 0 (0.0%) |
| 11:00 AM to 11:59 AM | 0 (0.0%) | 0 (0.0%) |
| 12:00 PM to 3:59 PM | 3 (2.4%) | 4 (4.0%) |
| 4:00 PM to 11:59 PM | 9 (7.1%) | 0 (0.0%) |
| Total | 126 (100.0%) | 99 (100.0%) |
Housing Occupancy in Clarkedale
Occupancy by Ownership in Clarkedale
Of the total 139 dwellings in Clarkedale, owner-occupied units account for 137 (98.6%), while renter-occupied units make up 2 (1.4%).
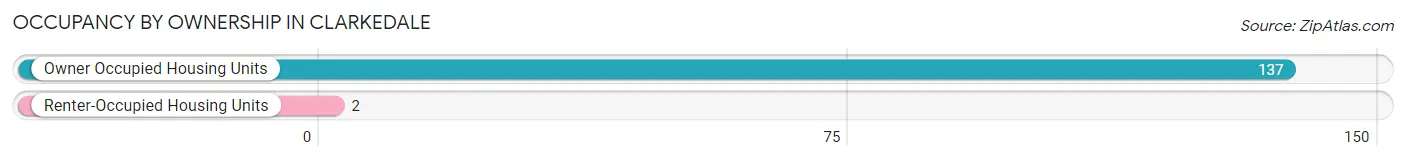
| Occupancy | # Housing Units | % Housing Units |
| Owner Occupied Housing Units | 137 | 98.6% |
| Renter-Occupied Housing Units | 2 | 1.4% |
| Total Occupied Housing Units | 139 | 100.0% |
Occupancy by Household Size in Clarkedale
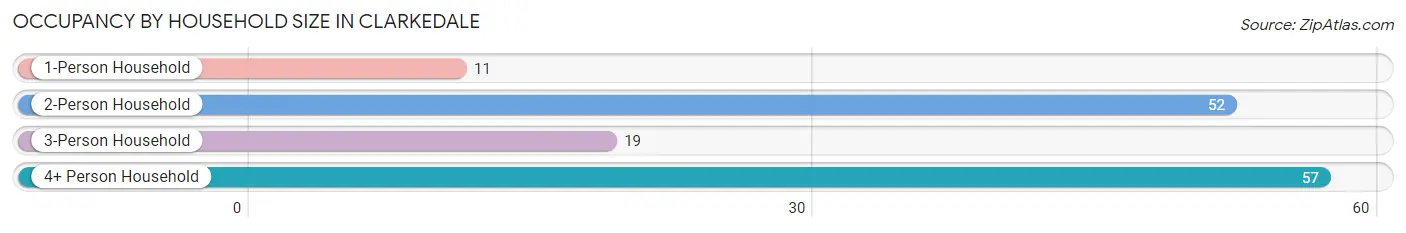
| Household Size | # Housing Units | % Housing Units |
| 1-Person Household | 11 | 7.9% |
| 2-Person Household | 52 | 37.4% |
| 3-Person Household | 19 | 13.7% |
| 4+ Person Household | 57 | 41.0% |
| Total Housing Units | 139 | 100.0% |
Occupancy by Ownership by Household Size in Clarkedale
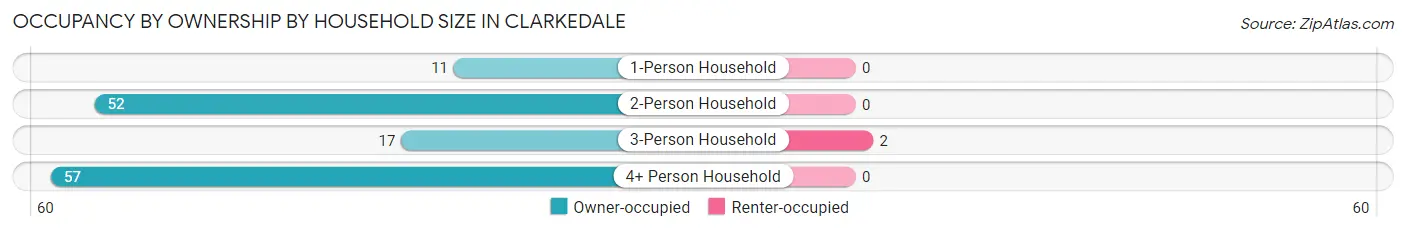
| Household Size | Owner-occupied | Renter-occupied |
| 1-Person Household | 11 (100.0%) | 0 (0.0%) |
| 2-Person Household | 52 (100.0%) | 0 (0.0%) |
| 3-Person Household | 17 (89.5%) | 2 (10.5%) |
| 4+ Person Household | 57 (100.0%) | 0 (0.0%) |
| Total Housing Units | 137 (98.6%) | 2 (1.4%) |
Occupancy by Educational Attainment in Clarkedale
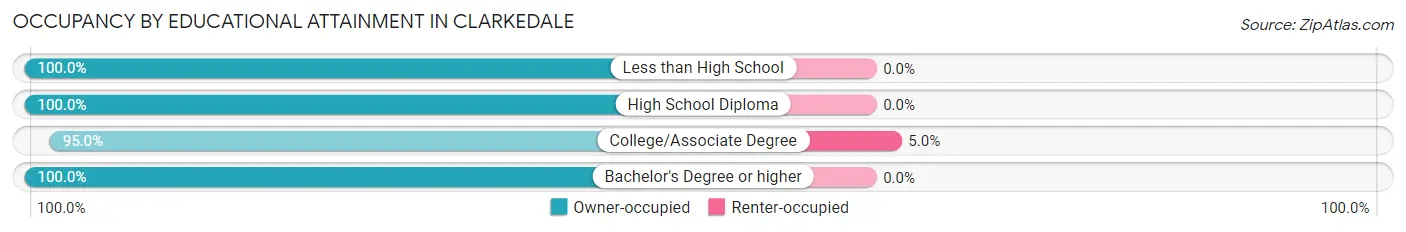
| Household Size | Owner-occupied | Renter-occupied |
| Less than High School | 5 (100.0%) | 0 (0.0%) |
| High School Diploma | 36 (100.0%) | 0 (0.0%) |
| College/Associate Degree | 38 (95.0%) | 2 (5.0%) |
| Bachelor's Degree or higher | 58 (100.0%) | 0 (0.0%) |
Occupancy by Age of Householder in Clarkedale
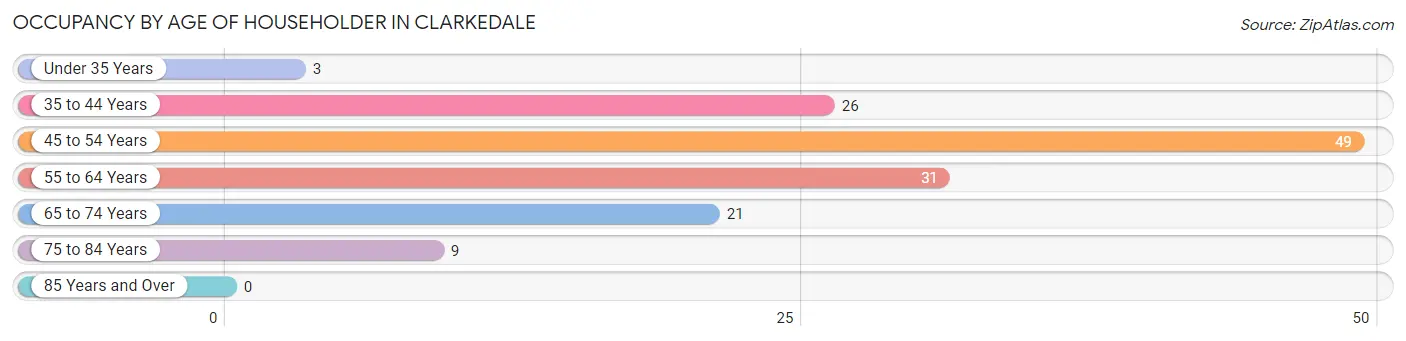
| Age Bracket | # Households | % Households |
| Under 35 Years | 3 | 2.2% |
| 35 to 44 Years | 26 | 18.7% |
| 45 to 54 Years | 49 | 35.2% |
| 55 to 64 Years | 31 | 22.3% |
| 65 to 74 Years | 21 | 15.1% |
| 75 to 84 Years | 9 | 6.5% |
| 85 Years and Over | 0 | 0.0% |
| Total | 139 | 100.0% |
Housing Finances in Clarkedale
Median Income by Occupancy in Clarkedale
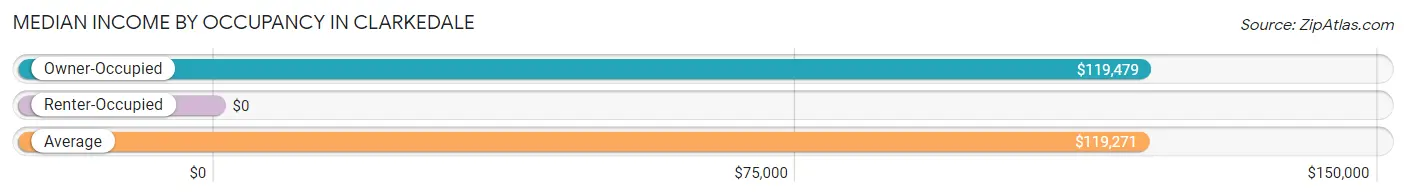
| Occupancy Type | # Households | Median Income |
| Owner-Occupied | 137 (98.6%) | $119,479 |
| Renter-Occupied | 2 (1.4%) | $0 |
| Average | 139 (100.0%) | $119,271 |
Occupancy by Householder Income Bracket in Clarkedale
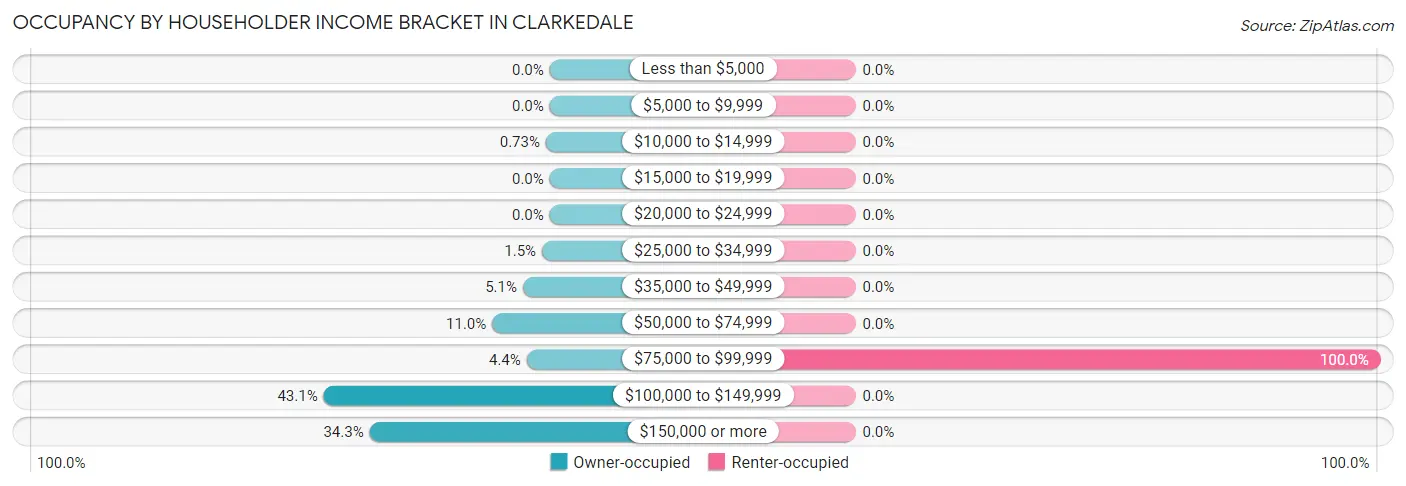
| Income Bracket | Owner-occupied | Renter-occupied |
| Less than $5,000 | 0 (0.0%) | 0 (0.0%) |
| $5,000 to $9,999 | 0 (0.0%) | 0 (0.0%) |
| $10,000 to $14,999 | 1 (0.7%) | 0 (0.0%) |
| $15,000 to $19,999 | 0 (0.0%) | 0 (0.0%) |
| $20,000 to $24,999 | 0 (0.0%) | 0 (0.0%) |
| $25,000 to $34,999 | 2 (1.5%) | 0 (0.0%) |
| $35,000 to $49,999 | 7 (5.1%) | 0 (0.0%) |
| $50,000 to $74,999 | 15 (11.0%) | 0 (0.0%) |
| $75,000 to $99,999 | 6 (4.4%) | 2 (100.0%) |
| $100,000 to $149,999 | 59 (43.1%) | 0 (0.0%) |
| $150,000 or more | 47 (34.3%) | 0 (0.0%) |
| Total | 137 (100.0%) | 2 (100.0%) |
Monthly Housing Cost Tiers in Clarkedale
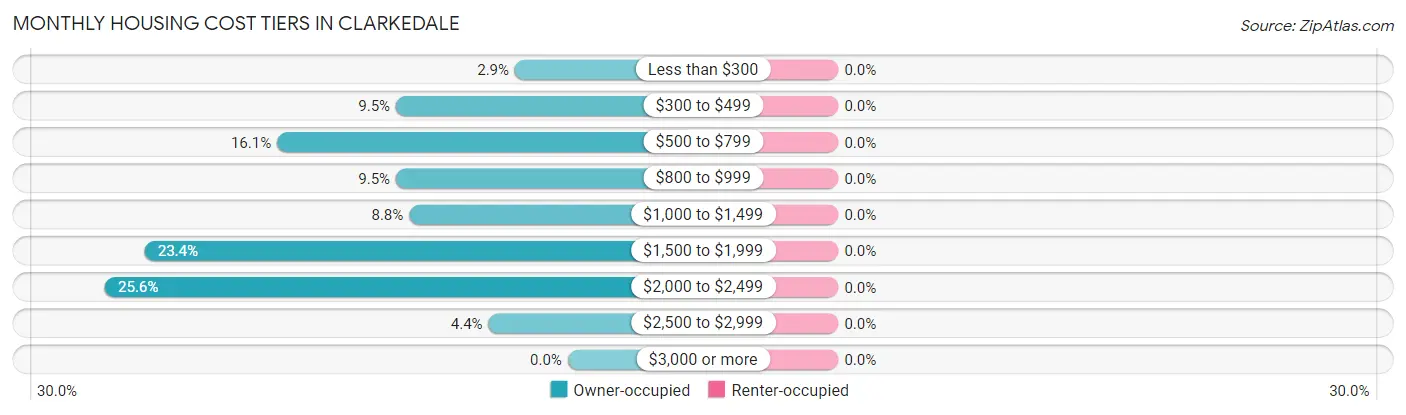
| Monthly Cost | Owner-occupied | Renter-occupied |
| Less than $300 | 4 (2.9%) | 0 (0.0%) |
| $300 to $499 | 13 (9.5%) | 0 (0.0%) |
| $500 to $799 | 22 (16.1%) | 0 (0.0%) |
| $800 to $999 | 13 (9.5%) | 0 (0.0%) |
| $1,000 to $1,499 | 12 (8.8%) | 0 (0.0%) |
| $1,500 to $1,999 | 32 (23.4%) | 0 (0.0%) |
| $2,000 to $2,499 | 35 (25.6%) | 0 (0.0%) |
| $2,500 to $2,999 | 6 (4.4%) | 0 (0.0%) |
| $3,000 or more | 0 (0.0%) | 0 (0.0%) |
| Total | 137 (100.0%) | 2 (100.0%) |
Physical Housing Characteristics in Clarkedale
Housing Structures in Clarkedale
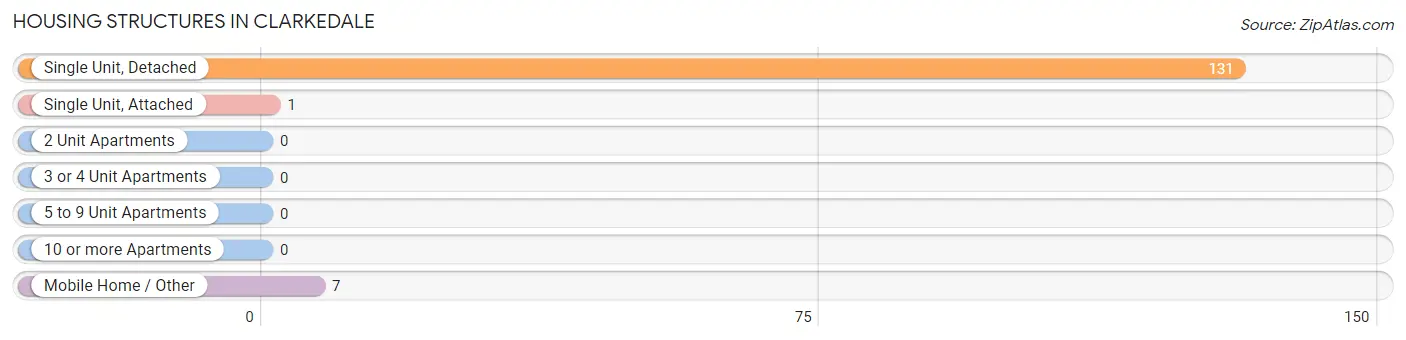
| Structure Type | # Housing Units | % Housing Units |
| Single Unit, Detached | 131 | 94.2% |
| Single Unit, Attached | 1 | 0.7% |
| 2 Unit Apartments | 0 | 0.0% |
| 3 or 4 Unit Apartments | 0 | 0.0% |
| 5 to 9 Unit Apartments | 0 | 0.0% |
| 10 or more Apartments | 0 | 0.0% |
| Mobile Home / Other | 7 | 5.0% |
| Total | 139 | 100.0% |
Housing Structures by Occupancy in Clarkedale
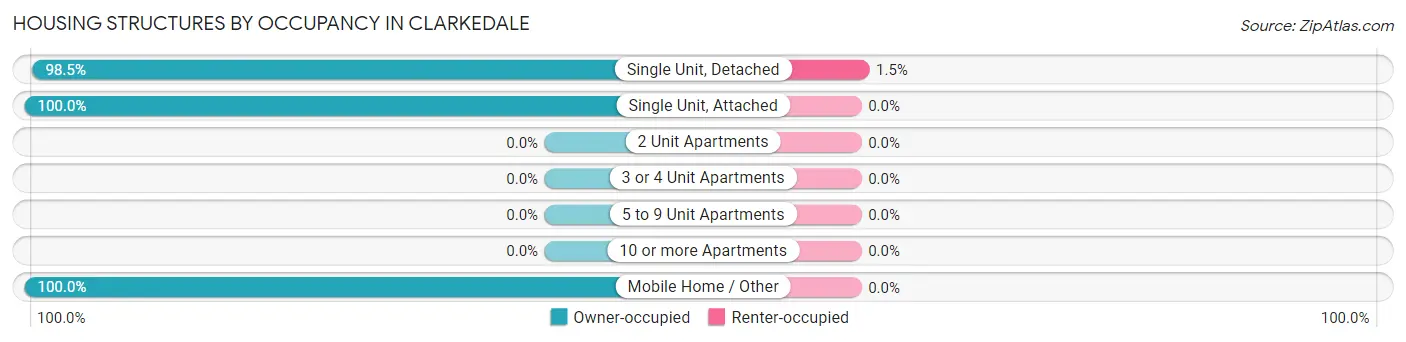
| Structure Type | Owner-occupied | Renter-occupied |
| Single Unit, Detached | 129 (98.5%) | 2 (1.5%) |
| Single Unit, Attached | 1 (100.0%) | 0 (0.0%) |
| 2 Unit Apartments | 0 (0.0%) | 0 (0.0%) |
| 3 or 4 Unit Apartments | 0 (0.0%) | 0 (0.0%) |
| 5 to 9 Unit Apartments | 0 (0.0%) | 0 (0.0%) |
| 10 or more Apartments | 0 (0.0%) | 0 (0.0%) |
| Mobile Home / Other | 7 (100.0%) | 0 (0.0%) |
| Total | 137 (98.6%) | 2 (1.4%) |
Housing Structures by Number of Rooms in Clarkedale
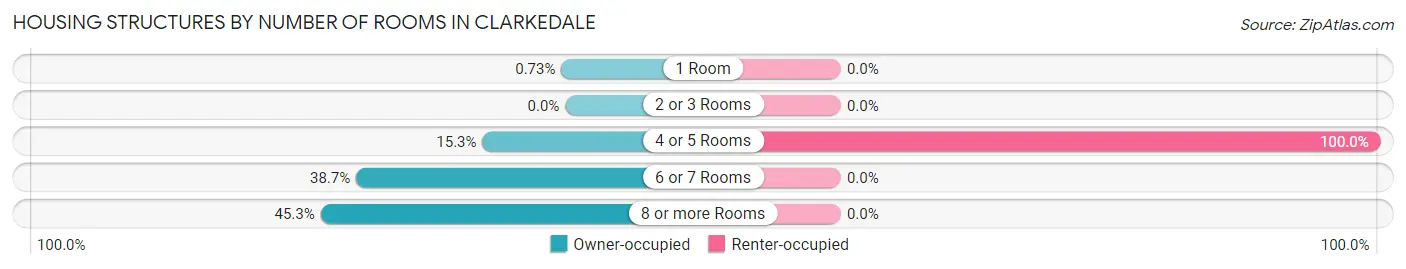
| Number of Rooms | Owner-occupied | Renter-occupied |
| 1 Room | 1 (0.7%) | 0 (0.0%) |
| 2 or 3 Rooms | 0 (0.0%) | 0 (0.0%) |
| 4 or 5 Rooms | 21 (15.3%) | 2 (100.0%) |
| 6 or 7 Rooms | 53 (38.7%) | 0 (0.0%) |
| 8 or more Rooms | 62 (45.3%) | 0 (0.0%) |
| Total | 137 (100.0%) | 2 (100.0%) |
Housing Structure by Heating Type in Clarkedale
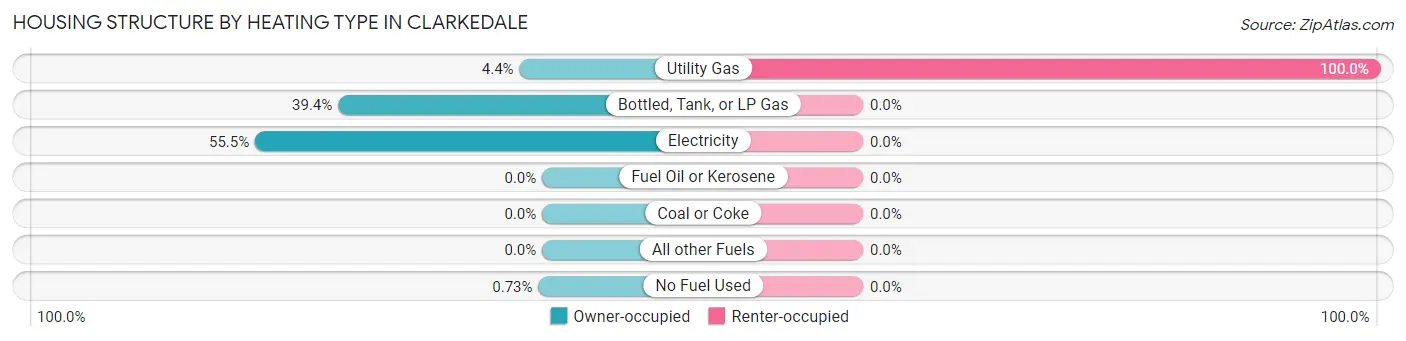
| Heating Type | Owner-occupied | Renter-occupied |
| Utility Gas | 6 (4.4%) | 2 (100.0%) |
| Bottled, Tank, or LP Gas | 54 (39.4%) | 0 (0.0%) |
| Electricity | 76 (55.5%) | 0 (0.0%) |
| Fuel Oil or Kerosene | 0 (0.0%) | 0 (0.0%) |
| Coal or Coke | 0 (0.0%) | 0 (0.0%) |
| All other Fuels | 0 (0.0%) | 0 (0.0%) |
| No Fuel Used | 1 (0.7%) | 0 (0.0%) |
| Total | 137 (100.0%) | 2 (100.0%) |
Household Vehicle Usage in Clarkedale
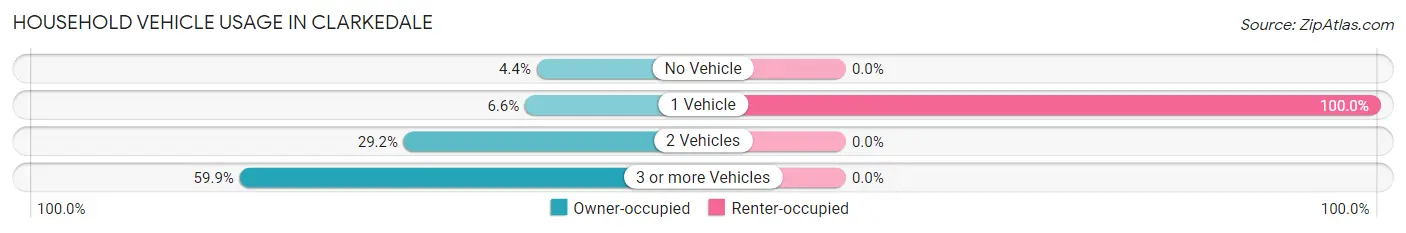
| Vehicles per Household | Owner-occupied | Renter-occupied |
| No Vehicle | 6 (4.4%) | 0 (0.0%) |
| 1 Vehicle | 9 (6.6%) | 2 (100.0%) |
| 2 Vehicles | 40 (29.2%) | 0 (0.0%) |
| 3 or more Vehicles | 82 (59.9%) | 0 (0.0%) |
| Total | 137 (100.0%) | 2 (100.0%) |
Real Estate & Mortgages in Clarkedale
Real Estate and Mortgage Overview in Clarkedale
| Characteristic | Without Mortgage | With Mortgage |
| Housing Units | 50 | 87 |
| Median Property Value | $221,400 | $275,000 |
| Median Household Income | $103,438 | $36 |
| Monthly Housing Costs | $638 | $0 |
| Real Estate Taxes | $1,500 | $5 |
Property Value by Mortgage Status in Clarkedale
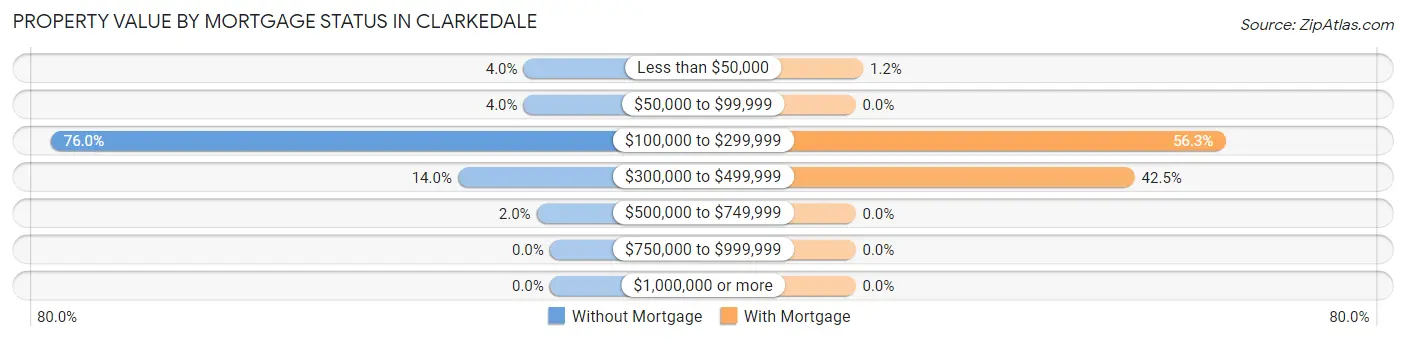
| Property Value | Without Mortgage | With Mortgage |
| Less than $50,000 | 2 (4.0%) | 1 (1.1%) |
| $50,000 to $99,999 | 2 (4.0%) | 0 (0.0%) |
| $100,000 to $299,999 | 38 (76.0%) | 49 (56.3%) |
| $300,000 to $499,999 | 7 (14.0%) | 37 (42.5%) |
| $500,000 to $749,999 | 1 (2.0%) | 0 (0.0%) |
| $750,000 to $999,999 | 0 (0.0%) | 0 (0.0%) |
| $1,000,000 or more | 0 (0.0%) | 0 (0.0%) |
| Total | 50 (100.0%) | 87 (100.0%) |
Household Income by Mortgage Status in Clarkedale
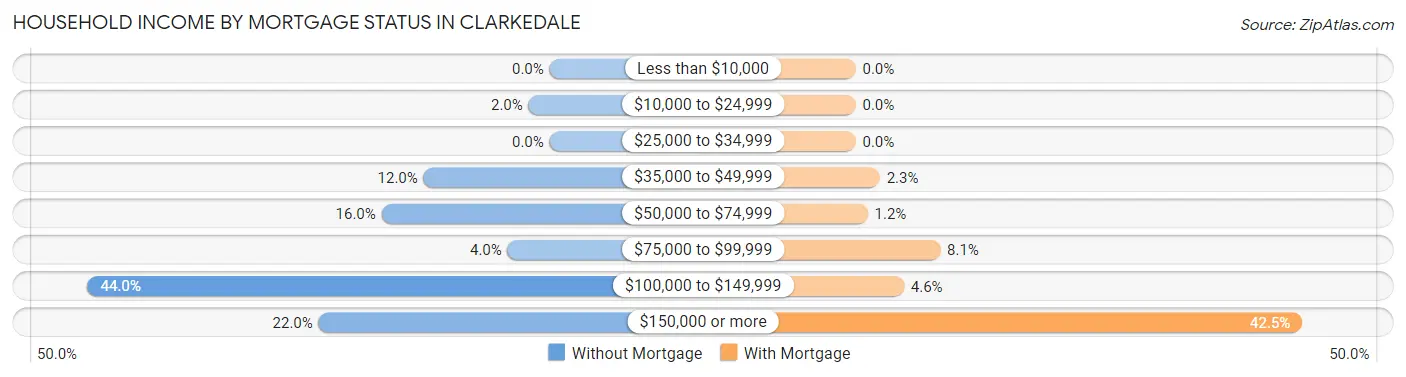
| Household Income | Without Mortgage | With Mortgage |
| Less than $10,000 | 0 (0.0%) | 0 (0.0%) |
| $10,000 to $24,999 | 1 (2.0%) | 0 (0.0%) |
| $25,000 to $34,999 | 0 (0.0%) | 0 (0.0%) |
| $35,000 to $49,999 | 6 (12.0%) | 2 (2.3%) |
| $50,000 to $74,999 | 8 (16.0%) | 1 (1.1%) |
| $75,000 to $99,999 | 2 (4.0%) | 7 (8.1%) |
| $100,000 to $149,999 | 22 (44.0%) | 4 (4.6%) |
| $150,000 or more | 11 (22.0%) | 37 (42.5%) |
| Total | 50 (100.0%) | 87 (100.0%) |
Property Value to Household Income Ratio in Clarkedale
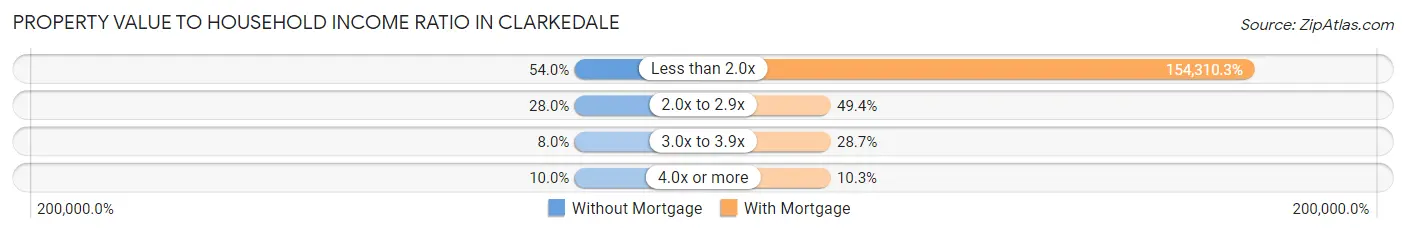
| Value-to-Income Ratio | Without Mortgage | With Mortgage |
| Less than 2.0x | 27 (54.0%) | 134,250 (154,310.3%) |
| 2.0x to 2.9x | 14 (28.0%) | 43 (49.4%) |
| 3.0x to 3.9x | 4 (8.0%) | 25 (28.7%) |
| 4.0x or more | 5 (10.0%) | 9 (10.3%) |
| Total | 50 (100.0%) | 87 (100.0%) |
Real Estate Taxes by Mortgage Status in Clarkedale
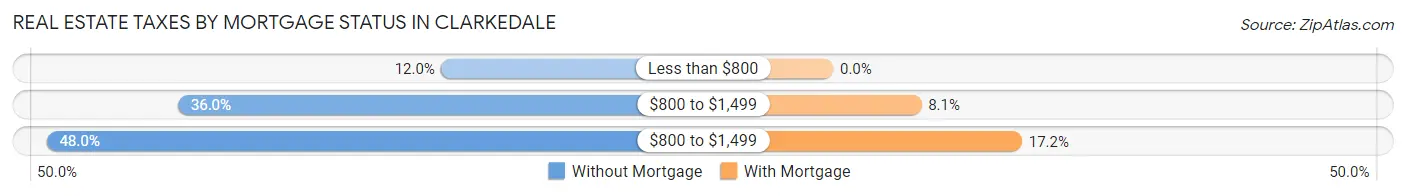
| Property Taxes | Without Mortgage | With Mortgage |
| Less than $800 | 6 (12.0%) | 0 (0.0%) |
| $800 to $1,499 | 18 (36.0%) | 7 (8.1%) |
| $800 to $1,499 | 24 (48.0%) | 15 (17.2%) |
| Total | 50 (100.0%) | 87 (100.0%) |
Health & Disability in Clarkedale
Health Insurance Coverage by Age in Clarkedale
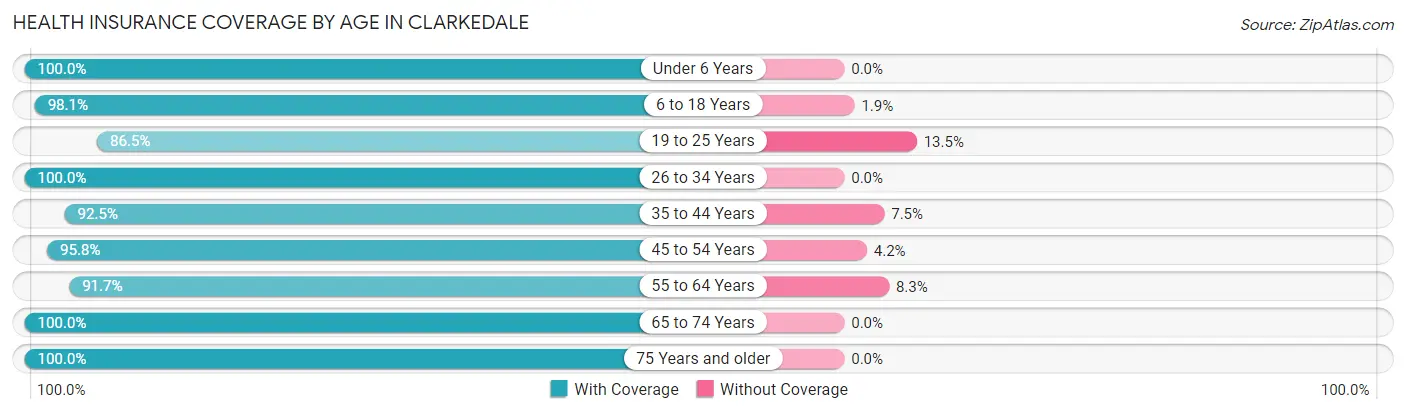
| Age Bracket | With Coverage | Without Coverage |
| Under 6 Years | 12 (100.0%) | 0 (0.0%) |
| 6 to 18 Years | 103 (98.1%) | 2 (1.9%) |
| 19 to 25 Years | 32 (86.5%) | 5 (13.5%) |
| 26 to 34 Years | 11 (100.0%) | 0 (0.0%) |
| 35 to 44 Years | 62 (92.5%) | 5 (7.5%) |
| 45 to 54 Years | 91 (95.8%) | 4 (4.2%) |
| 55 to 64 Years | 55 (91.7%) | 5 (8.3%) |
| 65 to 74 Years | 39 (100.0%) | 0 (0.0%) |
| 75 Years and older | 20 (100.0%) | 0 (0.0%) |
| Total | 425 (95.3%) | 21 (4.7%) |
Health Insurance Coverage by Citizenship Status in Clarkedale
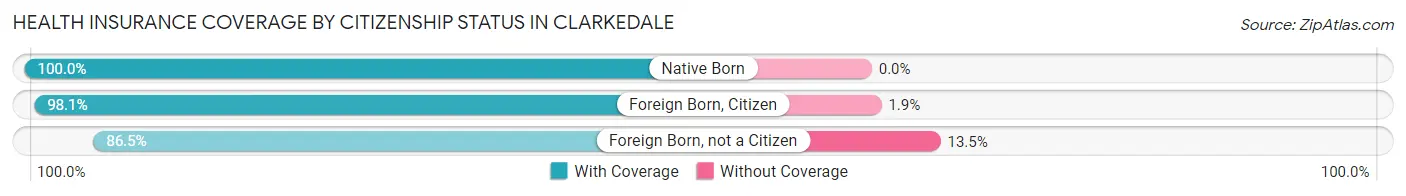
| Citizenship Status | With Coverage | Without Coverage |
| Native Born | 12 (100.0%) | 0 (0.0%) |
| Foreign Born, Citizen | 103 (98.1%) | 2 (1.9%) |
| Foreign Born, not a Citizen | 32 (86.5%) | 5 (13.5%) |
Health Insurance Coverage by Household Income in Clarkedale
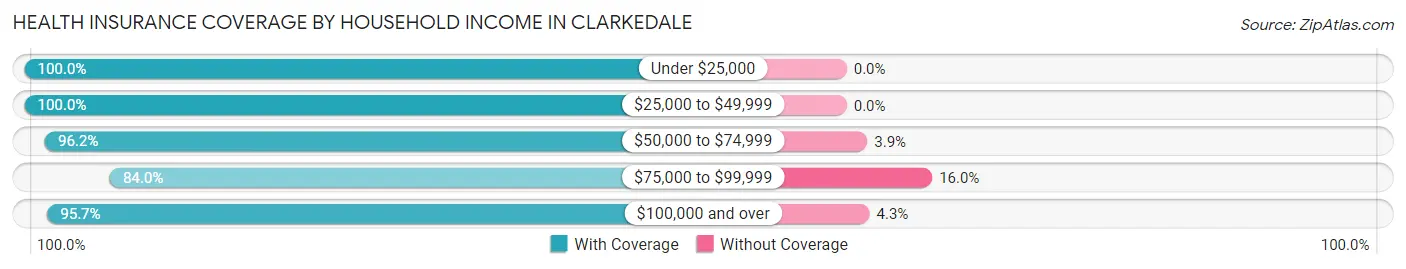
| Household Income | With Coverage | Without Coverage |
| Under $25,000 | 1 (100.0%) | 0 (0.0%) |
| $25,000 to $49,999 | 19 (100.0%) | 0 (0.0%) |
| $50,000 to $74,999 | 25 (96.2%) | 1 (3.8%) |
| $75,000 to $99,999 | 21 (84.0%) | 4 (16.0%) |
| $100,000 and over | 359 (95.7%) | 16 (4.3%) |
Public vs Private Health Insurance Coverage by Age in Clarkedale
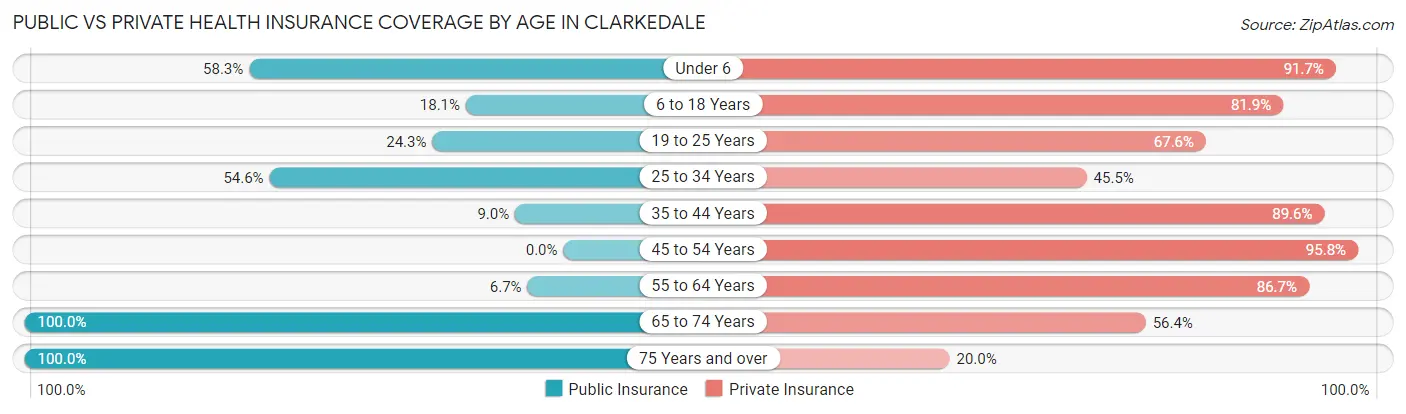
| Age Bracket | Public Insurance | Private Insurance |
| Under 6 | 7 (58.3%) | 11 (91.7%) |
| 6 to 18 Years | 19 (18.1%) | 86 (81.9%) |
| 19 to 25 Years | 9 (24.3%) | 25 (67.6%) |
| 25 to 34 Years | 6 (54.5%) | 5 (45.5%) |
| 35 to 44 Years | 6 (9.0%) | 60 (89.5%) |
| 45 to 54 Years | 0 (0.0%) | 91 (95.8%) |
| 55 to 64 Years | 4 (6.7%) | 52 (86.7%) |
| 65 to 74 Years | 39 (100.0%) | 22 (56.4%) |
| 75 Years and over | 20 (100.0%) | 4 (20.0%) |
| Total | 110 (24.7%) | 356 (79.8%) |
Disability Status by Sex by Age in Clarkedale
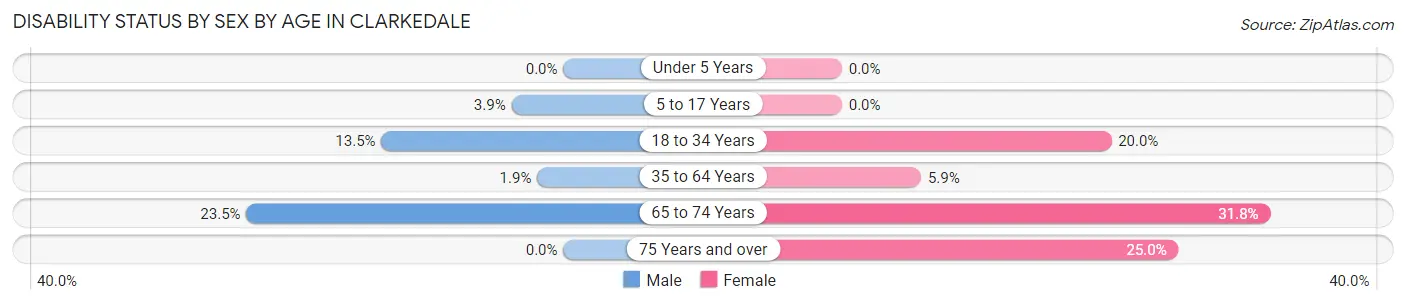
| Age Bracket | Male | Female |
| Under 5 Years | 0 (0.0%) | 0 (0.0%) |
| 5 to 17 Years | 2 (3.8%) | 0 (0.0%) |
| 18 to 34 Years | 5 (13.5%) | 6 (20.0%) |
| 35 to 64 Years | 2 (1.9%) | 7 (5.9%) |
| 65 to 74 Years | 4 (23.5%) | 7 (31.8%) |
| 75 Years and over | 0 (0.0%) | 2 (25.0%) |
Disability Class by Sex by Age in Clarkedale
Disability Class: Hearing Difficulty
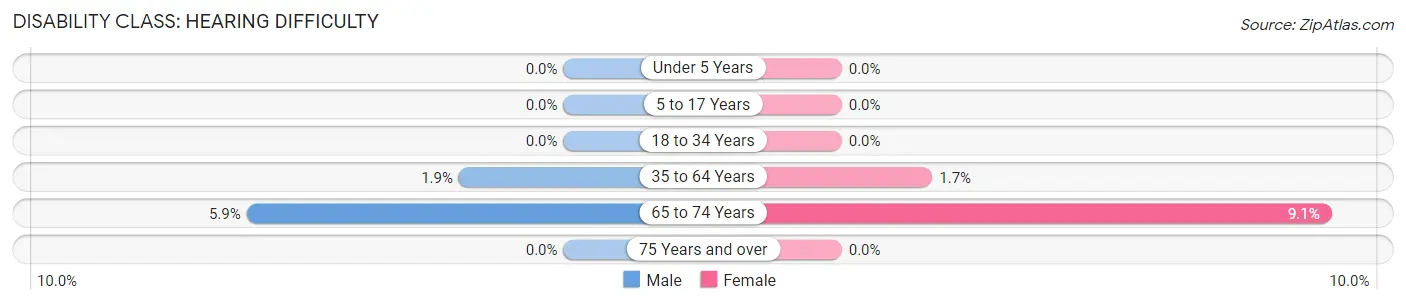
| Age Bracket | Male | Female |
| Under 5 Years | 0 (0.0%) | 0 (0.0%) |
| 5 to 17 Years | 0 (0.0%) | 0 (0.0%) |
| 18 to 34 Years | 0 (0.0%) | 0 (0.0%) |
| 35 to 64 Years | 2 (1.9%) | 2 (1.7%) |
| 65 to 74 Years | 1 (5.9%) | 2 (9.1%) |
| 75 Years and over | 0 (0.0%) | 0 (0.0%) |
Disability Class: Vision Difficulty
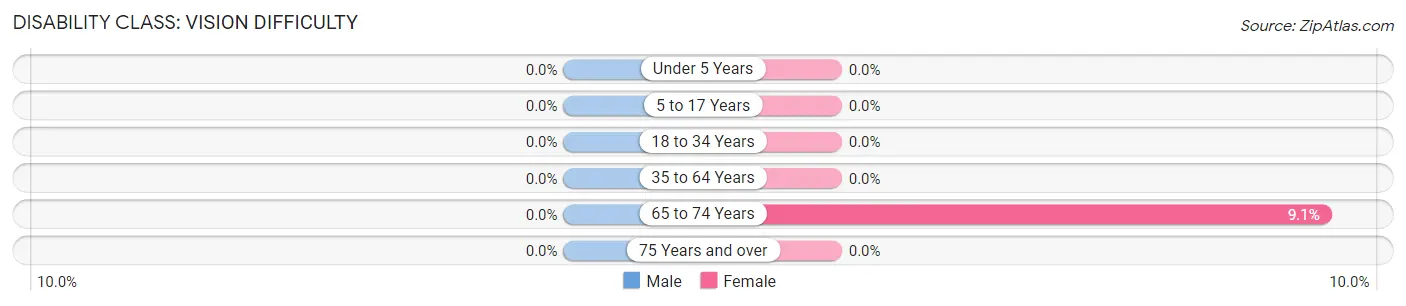
| Age Bracket | Male | Female |
| Under 5 Years | 0 (0.0%) | 0 (0.0%) |
| 5 to 17 Years | 0 (0.0%) | 0 (0.0%) |
| 18 to 34 Years | 0 (0.0%) | 0 (0.0%) |
| 35 to 64 Years | 0 (0.0%) | 0 (0.0%) |
| 65 to 74 Years | 0 (0.0%) | 2 (9.1%) |
| 75 Years and over | 0 (0.0%) | 0 (0.0%) |
Disability Class: Cognitive Difficulty
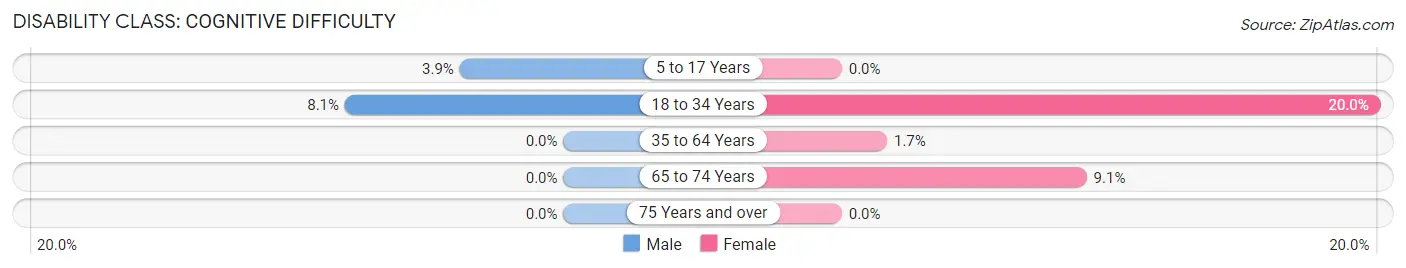
| Age Bracket | Male | Female |
| 5 to 17 Years | 2 (3.8%) | 0 (0.0%) |
| 18 to 34 Years | 3 (8.1%) | 6 (20.0%) |
| 35 to 64 Years | 0 (0.0%) | 2 (1.7%) |
| 65 to 74 Years | 0 (0.0%) | 2 (9.1%) |
| 75 Years and over | 0 (0.0%) | 0 (0.0%) |
Disability Class: Ambulatory Difficulty
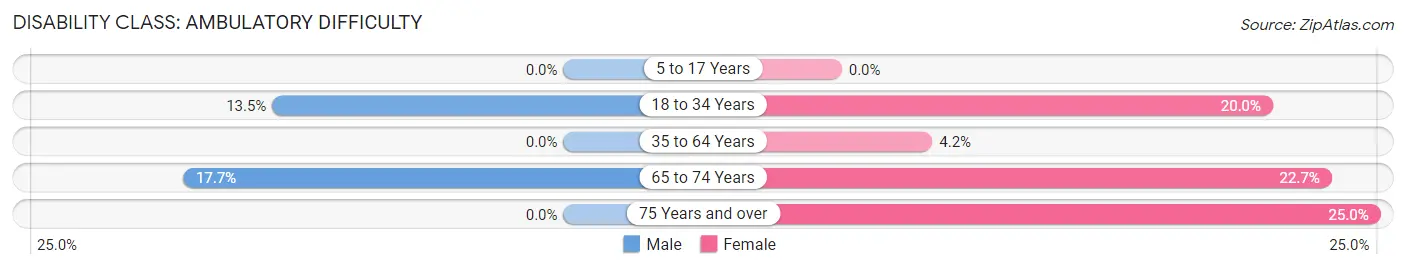
| Age Bracket | Male | Female |
| 5 to 17 Years | 0 (0.0%) | 0 (0.0%) |
| 18 to 34 Years | 5 (13.5%) | 6 (20.0%) |
| 35 to 64 Years | 0 (0.0%) | 5 (4.2%) |
| 65 to 74 Years | 3 (17.6%) | 5 (22.7%) |
| 75 Years and over | 0 (0.0%) | 2 (25.0%) |
Disability Class: Self-Care Difficulty
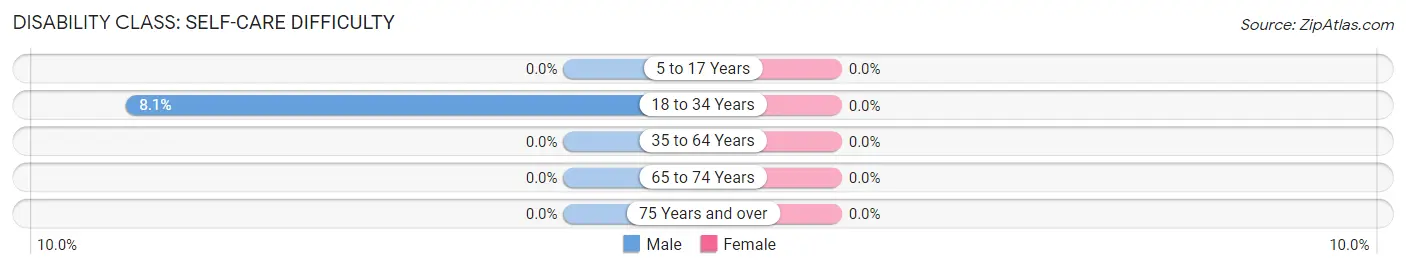
| Age Bracket | Male | Female |
| 5 to 17 Years | 0 (0.0%) | 0 (0.0%) |
| 18 to 34 Years | 3 (8.1%) | 0 (0.0%) |
| 35 to 64 Years | 0 (0.0%) | 0 (0.0%) |
| 65 to 74 Years | 0 (0.0%) | 0 (0.0%) |
| 75 Years and over | 0 (0.0%) | 0 (0.0%) |
Technology Access in Clarkedale
Computing Device Access in Clarkedale
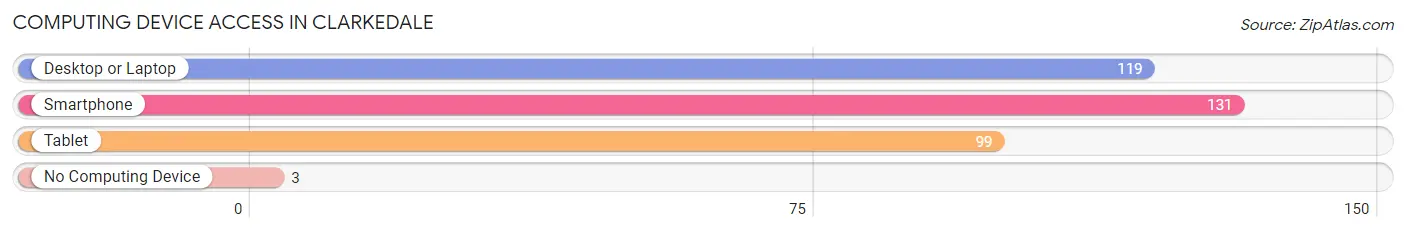
| Device Type | # Households | % Households |
| Desktop or Laptop | 119 | 85.6% |
| Smartphone | 131 | 94.2% |
| Tablet | 99 | 71.2% |
| No Computing Device | 3 | 2.2% |
| Total | 139 | 100.0% |
Internet Access in Clarkedale
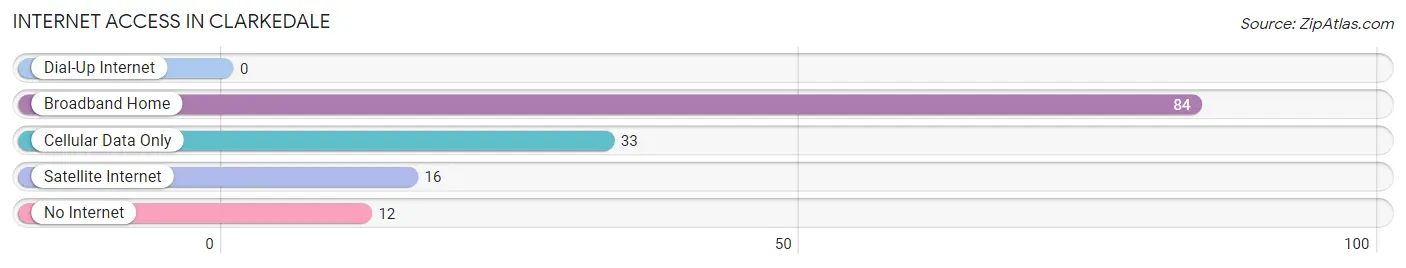
| Internet Type | # Households | % Households |
| Dial-Up Internet | 0 | 0.0% |
| Broadband Home | 84 | 60.4% |
| Cellular Data Only | 33 | 23.7% |
| Satellite Internet | 16 | 11.5% |
| No Internet | 12 | 8.6% |
| Total | 139 | 100.0% |
Clarkedale Summary
Clarkedale is a small town located in Crittenden County, Arkansas. It is situated on the banks of the Mississippi River, just south of Memphis, Tennessee. The town was founded in 1883 and has a population of approximately 1,000 people.
History
The town of Clarkedale was founded in 1883 by William Clark, a former Confederate soldier. Clark had served in the Civil War and was looking for a place to settle down after the war. He chose the area because of its proximity to the Mississippi River and the abundance of timber in the area. The town was named after him and was incorporated in 1887.
The town grew slowly but steadily over the years, and by the early 1900s, it had become a thriving community. The town was home to several businesses, including a sawmill, a cotton gin, and a general store. The town also had a school, a post office, and a church.
In the 1920s, the town began to decline as the timber industry began to decline. The Great Depression also had a negative impact on the town, and many of the businesses closed. The town was able to survive, however, and by the 1950s, it had begun to experience a resurgence.
Geography
Clarkedale is located in the northwest corner of Crittenden County, Arkansas. It is situated on the banks of the Mississippi River, just south of Memphis, Tennessee. The town is located in the Mississippi Delta region, which is known for its flat terrain and fertile soil. The town is surrounded by farmland and is home to several small lakes.
The climate in Clarkedale is humid subtropical, with hot, humid summers and mild winters. The average annual temperature is around 70 degrees Fahrenheit, and the average annual precipitation is around 50 inches.
Economy
The economy of Clarkedale is largely based on agriculture. The town is home to several farms, which produce a variety of crops, including cotton, soybeans, corn, and wheat. The town also has a few small businesses, including a grocery store, a hardware store, and a few restaurants.
Demographics
As of the 2010 census, the population of Clarkedale was 1,000 people. The racial makeup of the town was 95.2% White, 2.2% African American, 0.2% Native American, 0.2% Asian, and 2.2% from other races. The median household income was $30,000, and the median home value was $90,000.
Conclusion
Clarkedale is a small town located in Crittenden County, Arkansas. It was founded in 1883 and has a population of approximately 1,000 people. The town is situated on the banks of the Mississippi River and is surrounded by farmland. The economy of Clarkedale is largely based on agriculture, and the town is home to several small businesses. The population of Clarkedale is mostly White, with a small percentage of African Americans, Native Americans, and Asians.
Common Questions
What is Per Capita Income in Clarkedale?
Per Capita income in Clarkedale is $47,355.
What is the Median Family Income in Clarkedale?
Median Family Income in Clarkedale is $128,333.
What is the Median Household income in Clarkedale?
Median Household Income in Clarkedale is $119,271.
What is Income or Wage Gap in Clarkedale?
Income or Wage Gap in Clarkedale is 11.0%.
Women in Clarkedale earn 89.0 cents for every dollar earned by a man.
What is Inequality or Gini Index in Clarkedale?
Inequality or Gini Index in Clarkedale is 0.28.
What is the Total Population of Clarkedale?
Total Population of Clarkedale is 446.
What is the Total Male Population of Clarkedale?
Total Male Population of Clarkedale is 226.
What is the Total Female Population of Clarkedale?
Total Female Population of Clarkedale is 220.
What is the Ratio of Males per 100 Females in Clarkedale?
There are 102.73 Males per 100 Females in Clarkedale.
What is the Ratio of Females per 100 Males in Clarkedale?
There are 97.35 Females per 100 Males in Clarkedale.
What is the Median Population Age in Clarkedale?
Median Population Age in Clarkedale is 44.4 Years.
What is the Average Family Size in Clarkedale
Average Family Size in Clarkedale is 3.4 People.
What is the Average Household Size in Clarkedale
Average Household Size in Clarkedale is 3.2 People.
How Large is the Labor Force in Clarkedale?
There are 250 People in the Labor Forcein in Clarkedale.
What is the Percentage of People in the Labor Force in Clarkedale?
69.6% of People are in the Labor Force in Clarkedale.
What is the Unemployment Rate in Clarkedale?
Unemployment Rate in Clarkedale is 2.4%.