Little Flock, AR Map & Demographics
Little Flock Map
Little Flock Overview
$37,423
PER CAPITA INCOME
$79,265
AVG FAMILY INCOME
$55,035
AVG HOUSEHOLD INCOME
15.8%
WAGE / INCOME GAP [ % ]
84.2¢/ $1
WAGE / INCOME GAP [ $ ]
0.46
INEQUALITY / GINI INDEX
3,019
TOTAL POPULATION
1,553
MALE POPULATION
1,466
FEMALE POPULATION
105.93
MALES / 100 FEMALES
94.40
FEMALES / 100 MALES
32.4
MEDIAN AGE
3.0
AVG FAMILY SIZE
2.3
AVG HOUSEHOLD SIZE
1,832
LABOR FORCE [ PEOPLE ]
73.2%
PERCENT IN LABOR FORCE
8.6%
UNEMPLOYMENT RATE
Little Flock Area Codes
Income in Little Flock
Income Overview in Little Flock
Per Capita Income in Little Flock is $37,423, while median incomes of families and households are $79,265 and $55,035 respectively.
| Characteristic | Number | Measure |
| Per Capita Income | 3,019 | $37,423 |
| Median Family Income | 710 | $79,265 |
| Mean Family Income | 710 | $111,897 |
| Median Household Income | 1,291 | $55,035 |
| Mean Household Income | 1,291 | $84,981 |
| Income Deficit | 710 | $0 |
| Wage / Income Gap (%) | 3,019 | 15.84% |
| Wage / Income Gap ($) | 3,019 | 84.16¢ per $1 |
| Gini / Inequality Index | 3,019 | 0.46 |
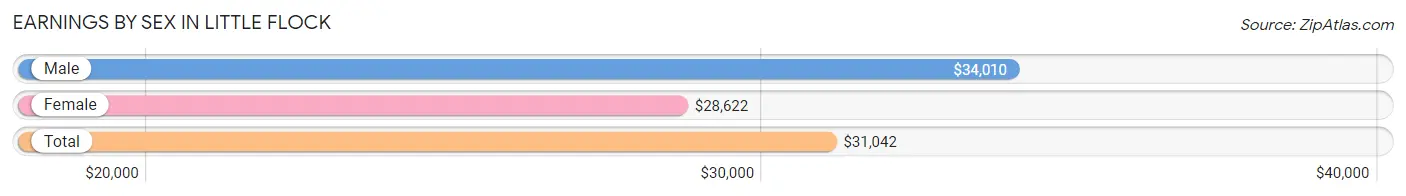
Earnings by Sex in Little Flock
Average Earnings in Little Flock are $31,042, $34,010 for men and $28,622 for women, a difference of 15.8%.
| Sex | Number | Average Earnings |
| Male | 1,023 (53.3%) | $34,010 |
| Female | 897 (46.7%) | $28,622 |
| Total | 1,920 (100.0%) | $31,042 |
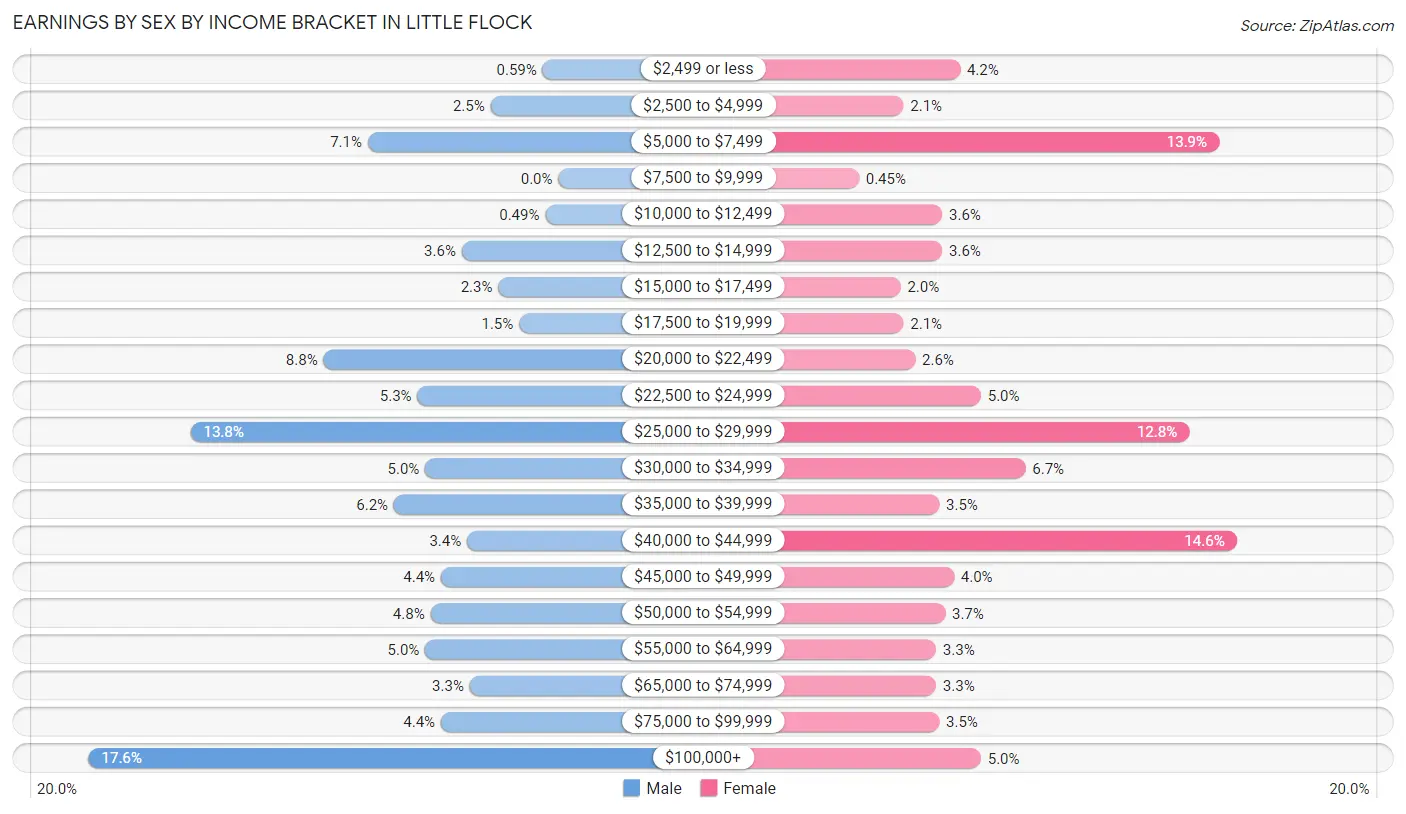
Earnings by Sex by Income Bracket in Little Flock
The most common earnings brackets in Little Flock are $100,000+ for men (180 | 17.6%) and $40,000 to $44,999 for women (131 | 14.6%).
| Income | Male | Female |
| $2,499 or less | 6 (0.6%) | 38 (4.2%) |
| $2,500 to $4,999 | 26 (2.5%) | 19 (2.1%) |
| $5,000 to $7,499 | 73 (7.1%) | 125 (13.9%) |
| $7,500 to $9,999 | 0 (0.0%) | 4 (0.4%) |
| $10,000 to $12,499 | 5 (0.5%) | 32 (3.6%) |
| $12,500 to $14,999 | 37 (3.6%) | 32 (3.6%) |
| $15,000 to $17,499 | 23 (2.2%) | 18 (2.0%) |
| $17,500 to $19,999 | 15 (1.5%) | 19 (2.1%) |
| $20,000 to $22,499 | 90 (8.8%) | 23 (2.6%) |
| $22,500 to $24,999 | 54 (5.3%) | 45 (5.0%) |
| $25,000 to $29,999 | 141 (13.8%) | 115 (12.8%) |
| $30,000 to $34,999 | 51 (5.0%) | 60 (6.7%) |
| $35,000 to $39,999 | 63 (6.2%) | 31 (3.5%) |
| $40,000 to $44,999 | 35 (3.4%) | 131 (14.6%) |
| $45,000 to $49,999 | 45 (4.4%) | 36 (4.0%) |
| $50,000 to $54,999 | 49 (4.8%) | 33 (3.7%) |
| $55,000 to $64,999 | 51 (5.0%) | 30 (3.3%) |
| $65,000 to $74,999 | 34 (3.3%) | 30 (3.3%) |
| $75,000 to $99,999 | 45 (4.4%) | 31 (3.5%) |
| $100,000+ | 180 (17.6%) | 45 (5.0%) |
| Total | 1,023 (100.0%) | 897 (100.0%) |
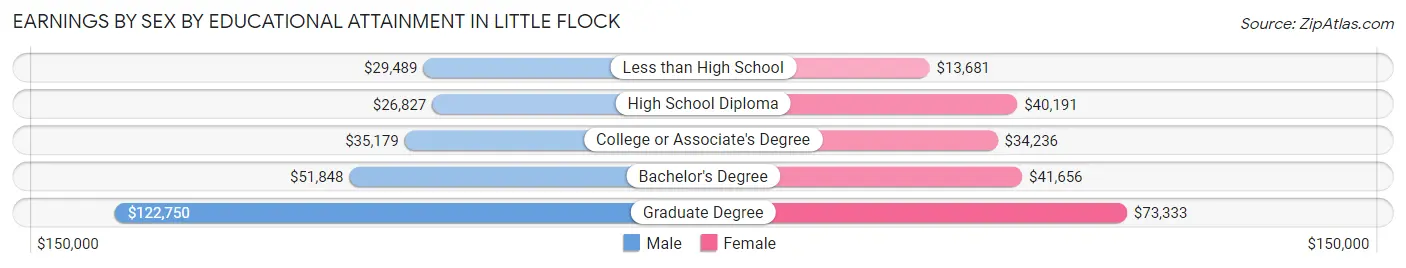
Earnings by Sex by Educational Attainment in Little Flock
Average earnings in Little Flock are $39,063 for men and $40,042 for women, a difference of 2.4%. Men with an educational attainment of graduate degree enjoy the highest average annual earnings of $122,750, while those with high school diploma education earn the least with $26,827. Women with an educational attainment of graduate degree earn the most with the average annual earnings of $73,333, while those with less than high school education have the smallest earnings of $13,681.
| Educational Attainment | Male Income | Female Income |
| Less than High School | $29,489 | $13,681 |
| High School Diploma | $26,827 | $40,191 |
| College or Associate's Degree | $35,179 | $34,236 |
| Bachelor's Degree | $51,848 | $41,656 |
| Graduate Degree | $122,750 | $73,333 |
| Total | $39,063 | $40,042 |
Family Income in Little Flock
Family Income Brackets in Little Flock
According to the Little Flock family income data, there are 177 families falling into the $35,000 to $49,999 income range, which is the most common income bracket and makes up 24.9% of all families. Conversely, the $10,000 to $14,999 income bracket is the least frequent group with only 4 families (0.6%) belonging to this category.
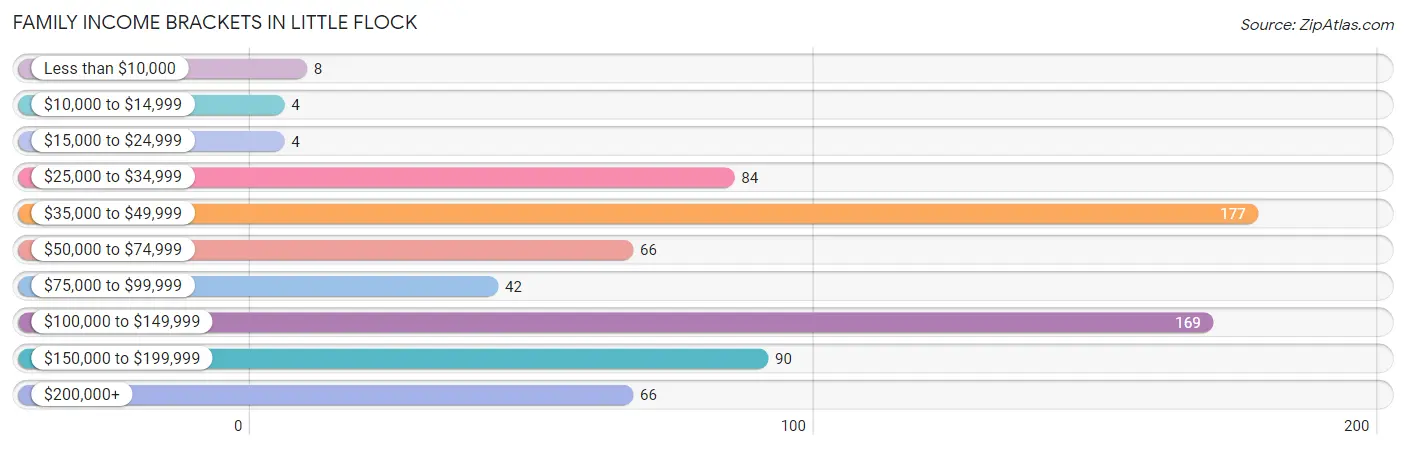
| Income Bracket | # Families | % Families |
| Less than $10,000 | 8 | 1.1% |
| $10,000 to $14,999 | 4 | 0.6% |
| $15,000 to $24,999 | 4 | 0.6% |
| $25,000 to $34,999 | 84 | 11.8% |
| $35,000 to $49,999 | 177 | 24.9% |
| $50,000 to $74,999 | 66 | 9.3% |
| $75,000 to $99,999 | 42 | 5.9% |
| $100,000 to $149,999 | 169 | 23.8% |
| $150,000 to $199,999 | 90 | 12.7% |
| $200,000+ | 66 | 9.3% |
Family Income by Famaliy Size in Little Flock
2-person families (357 | 50.3%) account for the highest median family income in Little Flock with $127,531 per family, while 2-person families (357 | 50.3%) have the highest median income of $63,766 per family member.
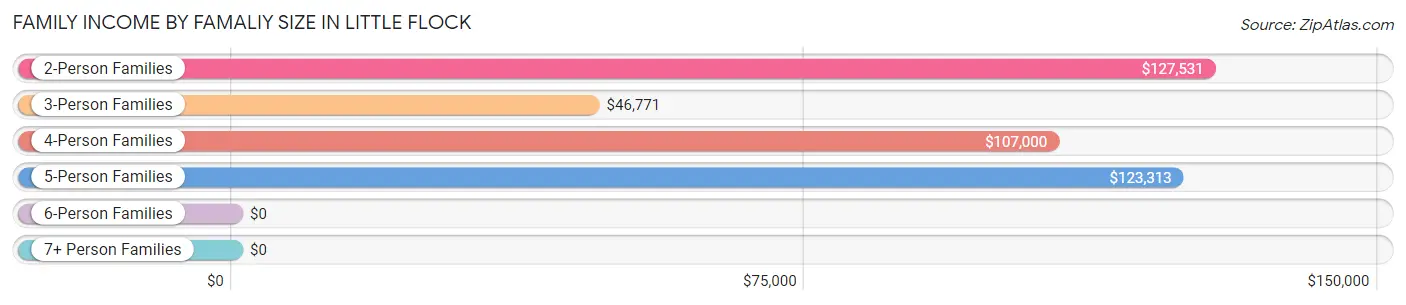
| Income Bracket | # Families | Median Income |
| 2-Person Families | 357 (50.3%) | $127,531 |
| 3-Person Families | 169 (23.8%) | $46,771 |
| 4-Person Families | 72 (10.1%) | $107,000 |
| 5-Person Families | 33 (4.6%) | $123,313 |
| 6-Person Families | 59 (8.3%) | $0 |
| 7+ Person Families | 20 (2.8%) | $0 |
| Total | 710 (100.0%) | $79,265 |
Family Income by Number of Earners in Little Flock
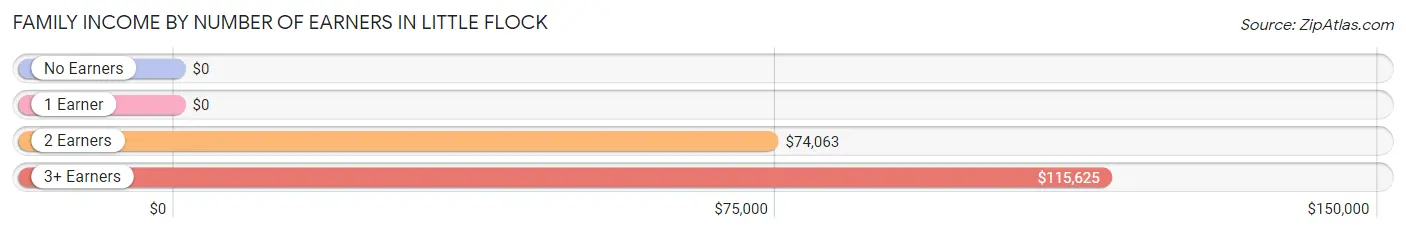
| Number of Earners | # Families | Median Income |
| No Earners | 11 (1.5%) | $0 |
| 1 Earner | 321 (45.2%) | $0 |
| 2 Earners | 337 (47.5%) | $74,063 |
| 3+ Earners | 41 (5.8%) | $115,625 |
| Total | 710 (100.0%) | $79,265 |
Household Income in Little Flock
Household Income Brackets in Little Flock
With 254 households falling in the category, the $50,000 to $74,999 income range is the most frequent in Little Flock, accounting for 19.7% of all households. In contrast, only 19 households (1.5%) fall into the $10,000 to $14,999 income bracket, making it the least populous group.
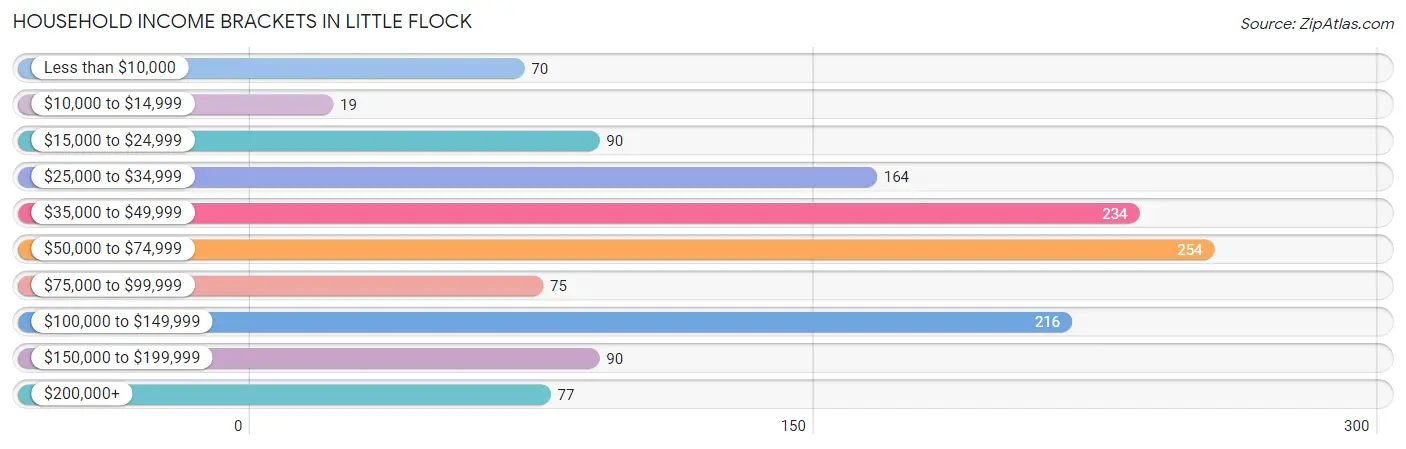
| Income Bracket | # Households | % Households |
| Less than $10,000 | 70 | 5.4% |
| $10,000 to $14,999 | 19 | 1.5% |
| $15,000 to $24,999 | 90 | 7.0% |
| $25,000 to $34,999 | 164 | 12.7% |
| $35,000 to $49,999 | 234 | 18.1% |
| $50,000 to $74,999 | 254 | 19.7% |
| $75,000 to $99,999 | 75 | 5.8% |
| $100,000 to $149,999 | 216 | 16.7% |
| $150,000 to $199,999 | 90 | 7.0% |
| $200,000+ | 77 | 6.0% |
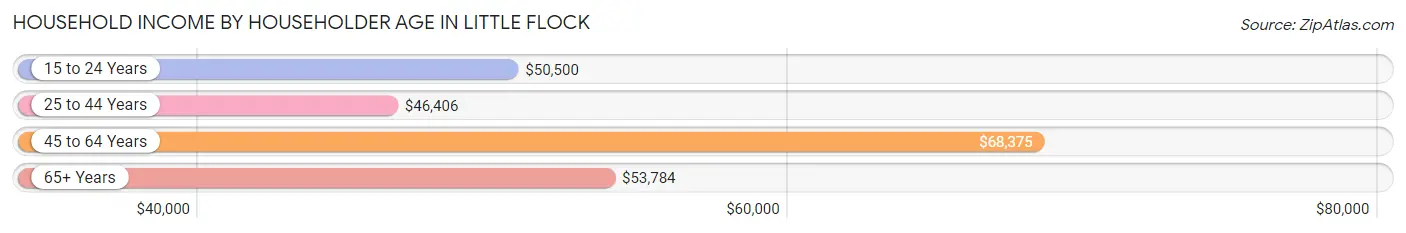
Household Income by Householder Age in Little Flock
The median household income in Little Flock is $55,035, with the highest median household income of $68,375 found in the 45 to 64 years age bracket for the primary householder. A total of 519 households (40.2%) fall into this category. Meanwhile, the 25 to 44 years age bracket for the primary householder has the lowest median household income of $46,406, with 466 households (36.1%) in this group.
| Income Bracket | # Households | Median Income |
| 15 to 24 Years | 124 (9.6%) | $50,500 |
| 25 to 44 Years | 466 (36.1%) | $46,406 |
| 45 to 64 Years | 519 (40.2%) | $68,375 |
| 65+ Years | 182 (14.1%) | $53,784 |
| Total | 1,291 (100.0%) | $55,035 |
Poverty in Little Flock
Income Below Poverty by Sex and Age in Little Flock
With 11.2% poverty level for males and 23.9% for females among the residents of Little Flock, 5 year old males and 12 to 14 year old females are the most vulnerable to poverty, with 17 males (100.0%) and 36 females (58.1%) in their respective age groups living below the poverty level.
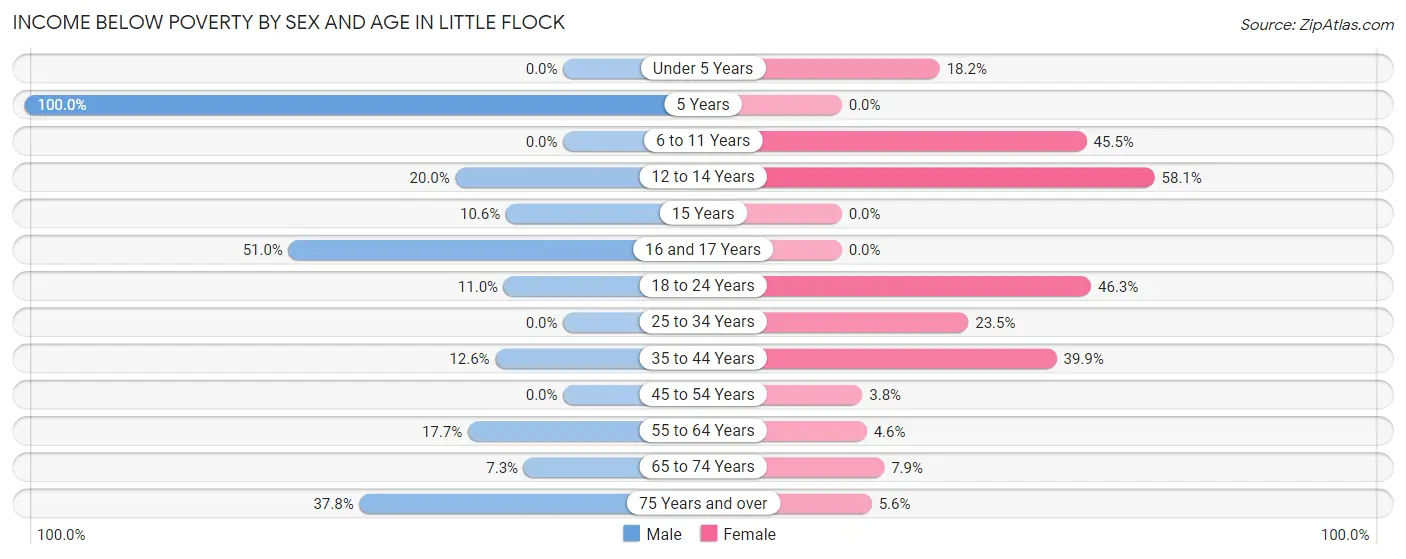
| Age Bracket | Male | Female |
| Under 5 Years | 0 (0.0%) | 16 (18.2%) |
| 5 Years | 17 (100.0%) | 0 (0.0%) |
| 6 to 11 Years | 0 (0.0%) | 25 (45.5%) |
| 12 to 14 Years | 17 (20.0%) | 36 (58.1%) |
| 15 Years | 5 (10.6%) | 0 (0.0%) |
| 16 and 17 Years | 26 (51.0%) | 0 (0.0%) |
| 18 to 24 Years | 16 (11.0%) | 137 (46.3%) |
| 25 to 34 Years | 0 (0.0%) | 54 (23.5%) |
| 35 to 44 Years | 30 (12.6%) | 55 (39.9%) |
| 45 to 54 Years | 0 (0.0%) | 5 (3.8%) |
| 55 to 64 Years | 40 (17.7%) | 12 (4.6%) |
| 65 to 74 Years | 9 (7.3%) | 7 (7.9%) |
| 75 Years and over | 14 (37.8%) | 3 (5.6%) |
| Total | 174 (11.2%) | 350 (23.9%) |
Income Above Poverty by Sex and Age in Little Flock
According to the poverty statistics in Little Flock, males aged under 5 years and females aged 5 years are the age groups that are most secure financially, with 100.0% of males and 100.0% of females in these age groups living above the poverty line.
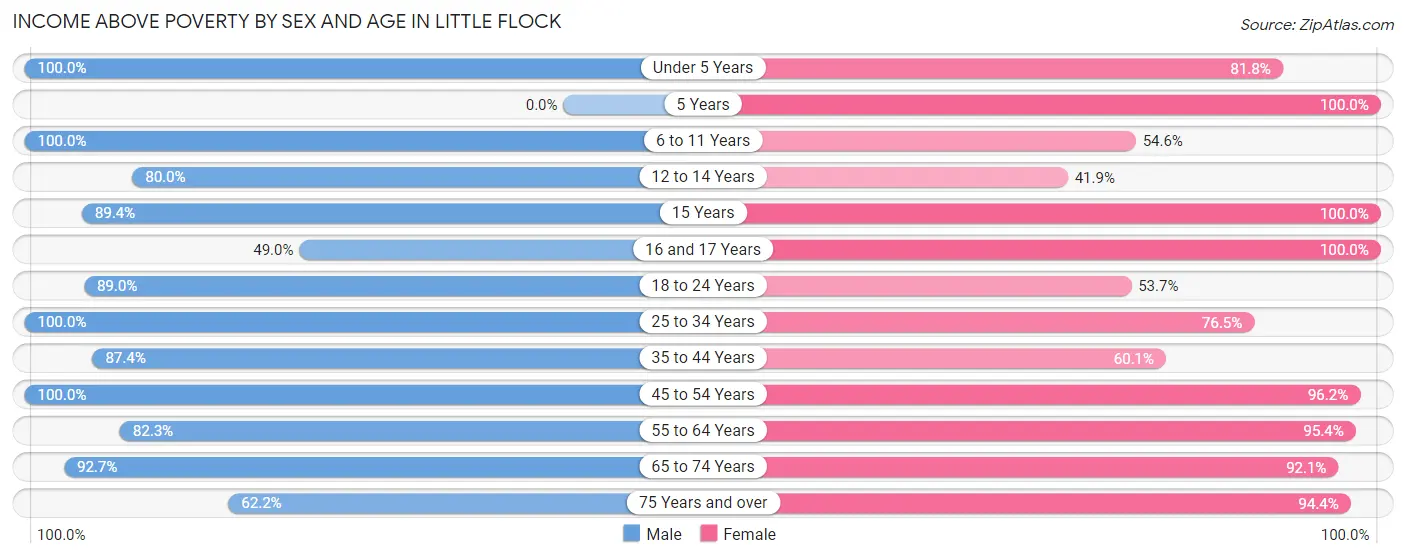
| Age Bracket | Male | Female |
| Under 5 Years | 86 (100.0%) | 72 (81.8%) |
| 5 Years | 0 (0.0%) | 22 (100.0%) |
| 6 to 11 Years | 43 (100.0%) | 30 (54.5%) |
| 12 to 14 Years | 68 (80.0%) | 26 (41.9%) |
| 15 Years | 42 (89.4%) | 11 (100.0%) |
| 16 and 17 Years | 25 (49.0%) | 31 (100.0%) |
| 18 to 24 Years | 129 (89.0%) | 159 (53.7%) |
| 25 to 34 Years | 280 (100.0%) | 176 (76.5%) |
| 35 to 44 Years | 208 (87.4%) | 83 (60.1%) |
| 45 to 54 Years | 175 (100.0%) | 126 (96.2%) |
| 55 to 64 Years | 186 (82.3%) | 247 (95.4%) |
| 65 to 74 Years | 114 (92.7%) | 82 (92.1%) |
| 75 Years and over | 23 (62.2%) | 51 (94.4%) |
| Total | 1,379 (88.8%) | 1,116 (76.1%) |
Income Below Poverty Among Married-Couple Families in Little Flock
The poverty statistics for married-couple families in Little Flock show that 4.6% or 22 of the total 475 families live below the poverty line. Families with 3 or 4 children have the highest poverty rate of 34.6%, comprising of 18 families. On the other hand, families with 1 or 2 children have the lowest poverty rate of 0.0%, which includes 0 families.
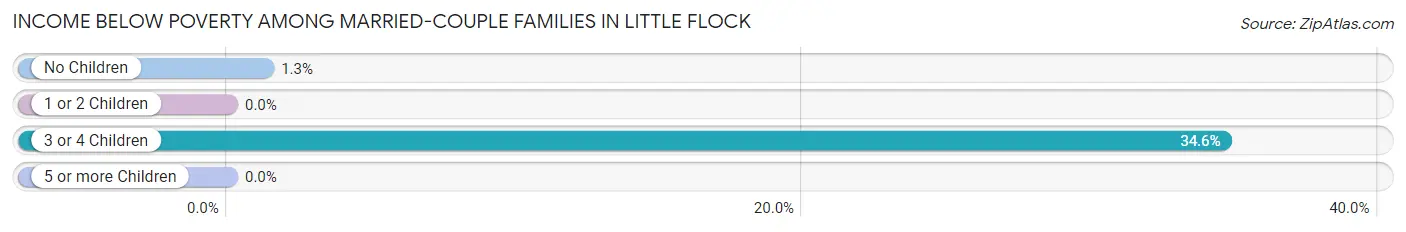
| Children | Above Poverty | Below Poverty |
| No Children | 314 (98.7%) | 4 (1.3%) |
| 1 or 2 Children | 103 (100.0%) | 0 (0.0%) |
| 3 or 4 Children | 34 (65.4%) | 18 (34.6%) |
| 5 or more Children | 2 (100.0%) | 0 (0.0%) |
| Total | 453 (95.4%) | 22 (4.6%) |
Income Below Poverty Among Single-Parent Households in Little Flock
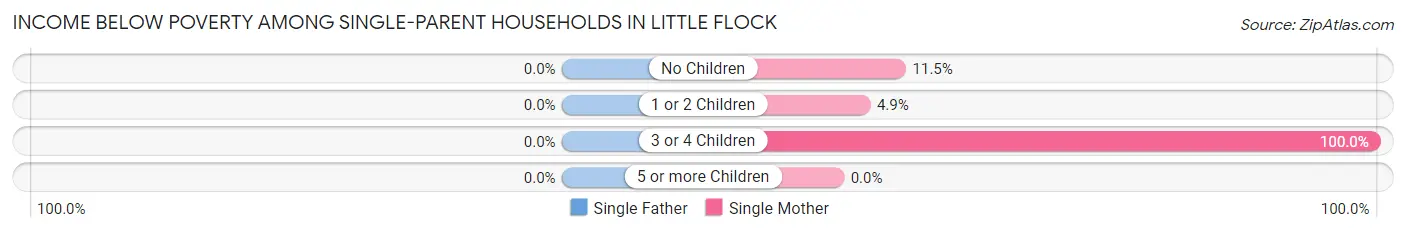
| Children | Single Father | Single Mother |
| No Children | 0 (0.0%) | 3 (11.5%) |
| 1 or 2 Children | 0 (0.0%) | 5 (4.9%) |
| 3 or 4 Children | 0 (0.0%) | 37 (100.0%) |
| 5 or more Children | 0 (0.0%) | 0 (0.0%) |
| Total | 0 (0.0%) | 45 (27.3%) |
Income Below Poverty Among Married-Couple vs Single-Parent Households in Little Flock
The poverty data for Little Flock shows that 22 of the married-couple family households (4.6%) and 45 of the single-parent households (19.2%) are living below the poverty level. Within the married-couple family households, those with 3 or 4 children have the highest poverty rate, with 18 households (34.6%) falling below the poverty line. Among the single-parent households, those with 3 or 4 children have the highest poverty rate, with 37 household (100.0%) living below poverty.
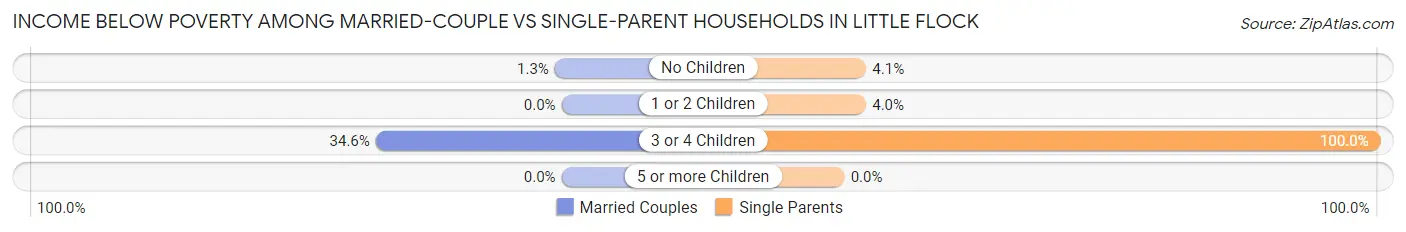
| Children | Married-Couple Families | Single-Parent Households |
| No Children | 4 (1.3%) | 3 (4.1%) |
| 1 or 2 Children | 0 (0.0%) | 5 (4.0%) |
| 3 or 4 Children | 18 (34.6%) | 37 (100.0%) |
| 5 or more Children | 0 (0.0%) | 0 (0.0%) |
| Total | 22 (4.6%) | 45 (19.2%) |
Race in Little Flock
The most populous races in Little Flock are White / Caucasian (2,613 | 86.6%), Hispanic or Latino (659 | 21.8%), and Two or more Races (208 | 6.9%).
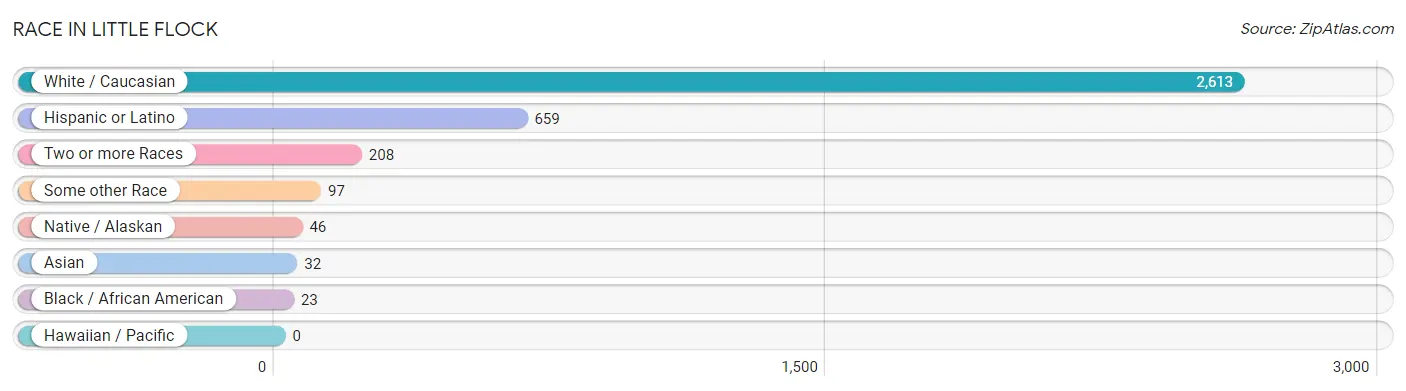
| Race | # Population | % Population |
| Asian | 32 | 1.1% |
| Black / African American | 23 | 0.8% |
| Hawaiian / Pacific | 0 | 0.0% |
| Hispanic or Latino | 659 | 21.8% |
| Native / Alaskan | 46 | 1.5% |
| White / Caucasian | 2,613 | 86.6% |
| Two or more Races | 208 | 6.9% |
| Some other Race | 97 | 3.2% |
| Total | 3,019 | 100.0% |
Ancestry in Little Flock
The most populous ancestries reported in Little Flock are Mexican (490 | 16.2%), German (391 | 13.0%), English (299 | 9.9%), Irish (209 | 6.9%), and Italian (155 | 5.1%), together accounting for 51.1% of all Little Flock residents.
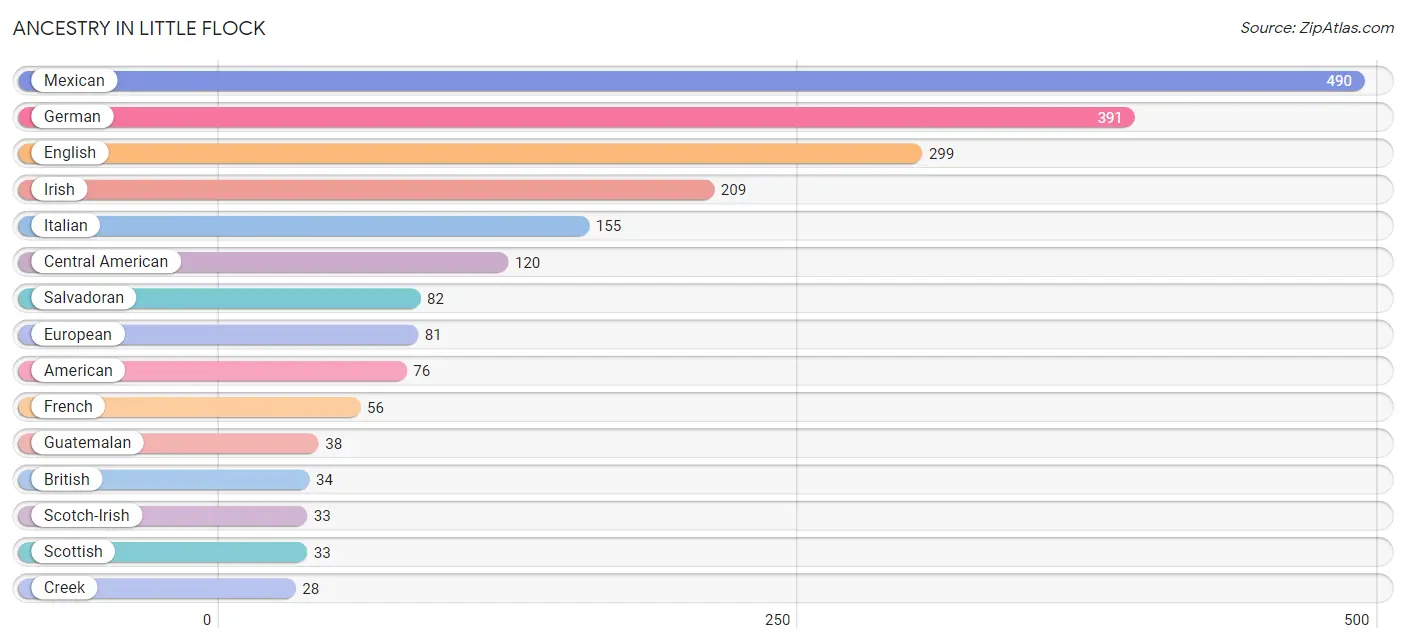
| Ancestry | # Population | % Population |
| American | 76 | 2.5% |
| British | 34 | 1.1% |
| Central American | 120 | 4.0% |
| Choctaw | 2 | 0.1% |
| Creek | 28 | 0.9% |
| Czech | 10 | 0.3% |
| Dutch | 6 | 0.2% |
| Ecuadorian | 23 | 0.8% |
| English | 299 | 9.9% |
| European | 81 | 2.7% |
| Finnish | 9 | 0.3% |
| French | 56 | 1.8% |
| French Canadian | 6 | 0.2% |
| German | 391 | 13.0% |
| Guatemalan | 38 | 1.3% |
| Hopi | 1 | 0.0% |
| Hungarian | 3 | 0.1% |
| Indian (Asian) | 7 | 0.2% |
| Iranian | 5 | 0.2% |
| Irish | 209 | 6.9% |
| Italian | 155 | 5.1% |
| Mexican | 490 | 16.2% |
| Norwegian | 8 | 0.3% |
| Polish | 22 | 0.7% |
| Puerto Rican | 14 | 0.5% |
| Romanian | 5 | 0.2% |
| Salvadoran | 82 | 2.7% |
| Scandinavian | 19 | 0.6% |
| Scotch-Irish | 33 | 1.1% |
| Scottish | 33 | 1.1% |
| Sioux | 12 | 0.4% |
| Slovak | 6 | 0.2% |
| South American | 23 | 0.8% |
| Swedish | 8 | 0.3% |
| Thai | 25 | 0.8% | View All 35 Rows |
Immigrants in Little Flock
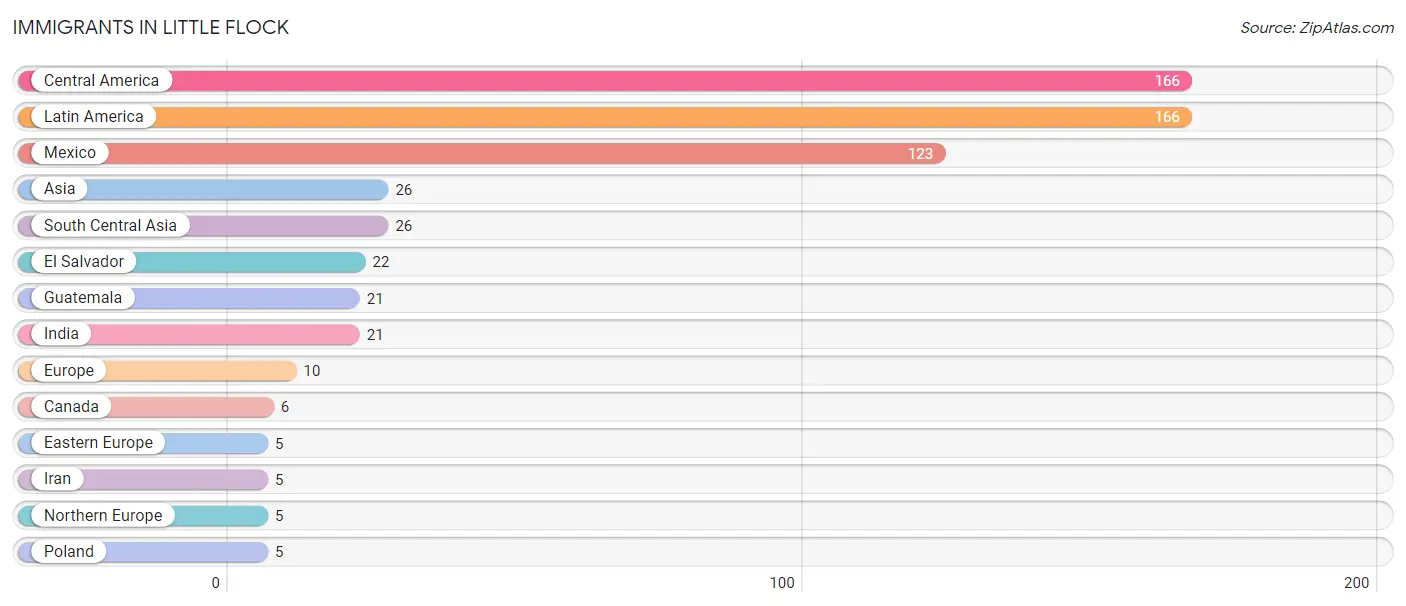
The most numerous immigrant groups reported in Little Flock came from Central America (166 | 5.5%), Latin America (166 | 5.5%), Mexico (123 | 4.1%), Asia (26 | 0.9%), and South Central Asia (26 | 0.9%), together accounting for 16.8% of all Little Flock residents.
| Immigration Origin | # Population | % Population |
| Asia | 26 | 0.9% |
| Canada | 6 | 0.2% |
| Central America | 166 | 5.5% |
| Eastern Europe | 5 | 0.2% |
| El Salvador | 22 | 0.7% |
| Europe | 10 | 0.3% |
| Guatemala | 21 | 0.7% |
| India | 21 | 0.7% |
| Iran | 5 | 0.2% |
| Latin America | 166 | 5.5% |
| Mexico | 123 | 4.1% |
| Northern Europe | 5 | 0.2% |
| Poland | 5 | 0.2% |
| South Central Asia | 26 | 0.9% | View All 14 Rows |
Sex and Age in Little Flock
Sex and Age in Little Flock
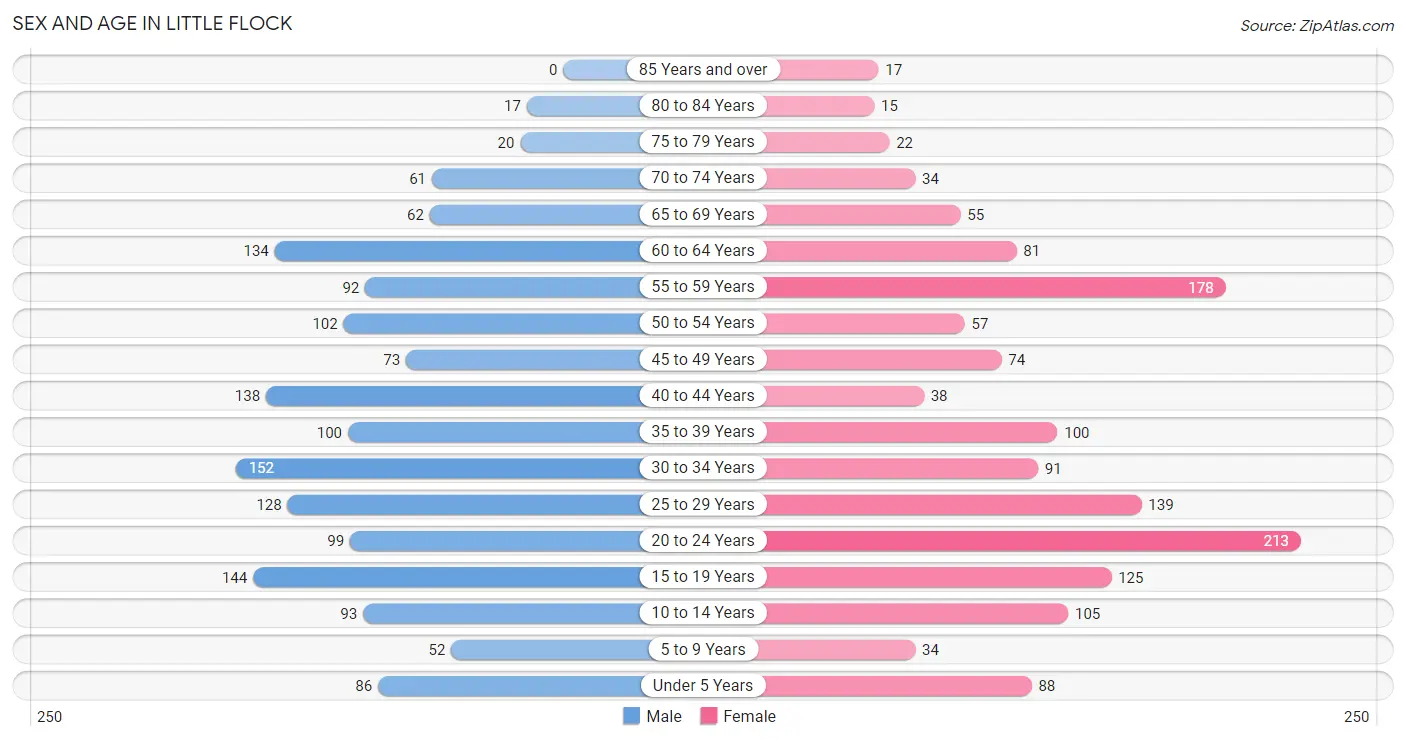
The most populous age groups in Little Flock are 30 to 34 Years (152 | 9.8%) for men and 20 to 24 Years (213 | 14.5%) for women.
| Age Bracket | Male | Female |
| Under 5 Years | 86 (5.5%) | 88 (6.0%) |
| 5 to 9 Years | 52 (3.4%) | 34 (2.3%) |
| 10 to 14 Years | 93 (6.0%) | 105 (7.2%) |
| 15 to 19 Years | 144 (9.3%) | 125 (8.5%) |
| 20 to 24 Years | 99 (6.4%) | 213 (14.5%) |
| 25 to 29 Years | 128 (8.2%) | 139 (9.5%) |
| 30 to 34 Years | 152 (9.8%) | 91 (6.2%) |
| 35 to 39 Years | 100 (6.4%) | 100 (6.8%) |
| 40 to 44 Years | 138 (8.9%) | 38 (2.6%) |
| 45 to 49 Years | 73 (4.7%) | 74 (5.1%) |
| 50 to 54 Years | 102 (6.6%) | 57 (3.9%) |
| 55 to 59 Years | 92 (5.9%) | 178 (12.1%) |
| 60 to 64 Years | 134 (8.6%) | 81 (5.5%) |
| 65 to 69 Years | 62 (4.0%) | 55 (3.7%) |
| 70 to 74 Years | 61 (3.9%) | 34 (2.3%) |
| 75 to 79 Years | 20 (1.3%) | 22 (1.5%) |
| 80 to 84 Years | 17 (1.1%) | 15 (1.0%) |
| 85 Years and over | 0 (0.0%) | 17 (1.2%) |
| Total | 1,553 (100.0%) | 1,466 (100.0%) |
Families and Households in Little Flock
Median Family Size in Little Flock
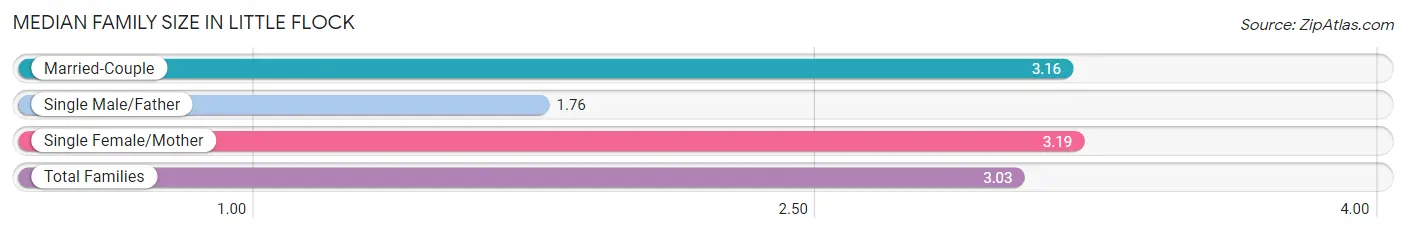
The median family size in Little Flock is 3.03 persons per family, with single female/mother families (165 | 23.2%) accounting for the largest median family size of 3.19 persons per family. On the other hand, single male/father families (70 | 9.9%) represent the smallest median family size with 1.76 persons per family.
| Family Type | # Families | Family Size |
| Married-Couple | 475 (66.9%) | 3.16 |
| Single Male/Father | 70 (9.9%) | 1.76 |
| Single Female/Mother | 165 (23.2%) | 3.19 |
| Total Families | 710 (100.0%) | 3.03 |
Median Household Size in Little Flock
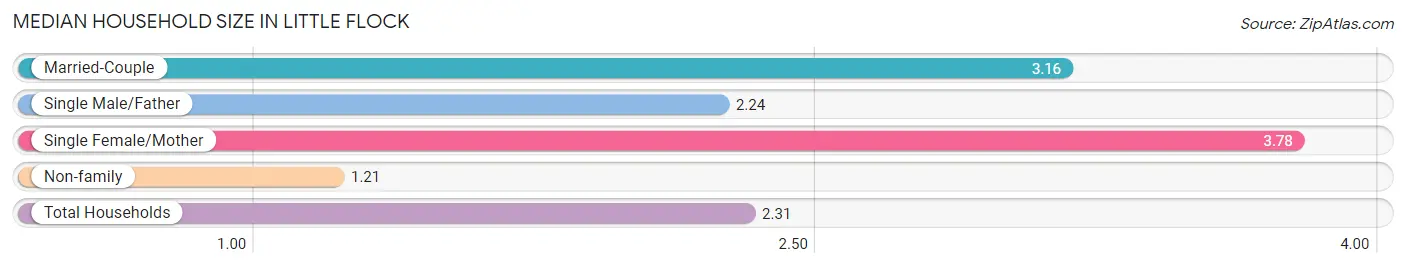
The median household size in Little Flock is 2.31 persons per household, with single female/mother households (165 | 12.8%) accounting for the largest median household size of 3.78 persons per household. non-family households (581 | 45.0%) represent the smallest median household size with 1.21 persons per household.
| Household Type | # Households | Household Size |
| Married-Couple | 475 (36.8%) | 3.16 |
| Single Male/Father | 70 (5.4%) | 2.24 |
| Single Female/Mother | 165 (12.8%) | 3.78 |
| Non-family | 581 (45.0%) | 1.21 |
| Total Households | 1,291 (100.0%) | 2.31 |
Household Size by Marriage Status in Little Flock
Out of a total of 1,291 households in Little Flock, 710 (55.0%) are family households, while 581 (45.0%) are nonfamily households. The most numerous type of family households are 2-person households, comprising 329, and the most common type of nonfamily households are 1-person households, comprising 474.
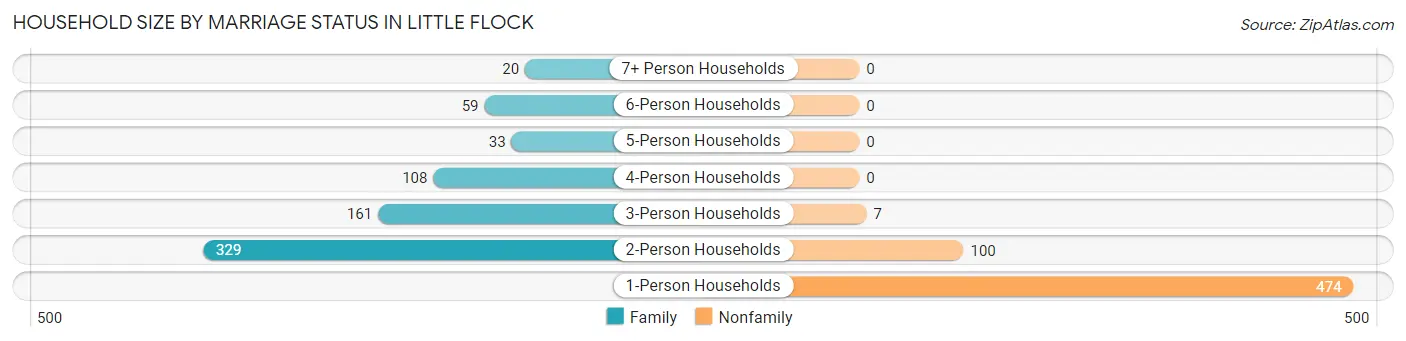
| Household Size | Family Households | Nonfamily Households |
| 1-Person Households | - | 474 (36.7%) |
| 2-Person Households | 329 (25.5%) | 100 (7.7%) |
| 3-Person Households | 161 (12.5%) | 7 (0.5%) |
| 4-Person Households | 108 (8.4%) | 0 (0.0%) |
| 5-Person Households | 33 (2.6%) | 0 (0.0%) |
| 6-Person Households | 59 (4.6%) | 0 (0.0%) |
| 7+ Person Households | 20 (1.5%) | 0 (0.0%) |
| Total | 710 (55.0%) | 581 (45.0%) |
Female Fertility in Little Flock
Fertility by Age in Little Flock
Average fertility rate in Little Flock is 172.0 births per 1,000 women. Women in the age bracket of 20 to 34 years have the highest fertility rate with 262.0 births per 1,000 women. Women in the age bracket of 20 to 34 years acount for 86.6% of all women with births.
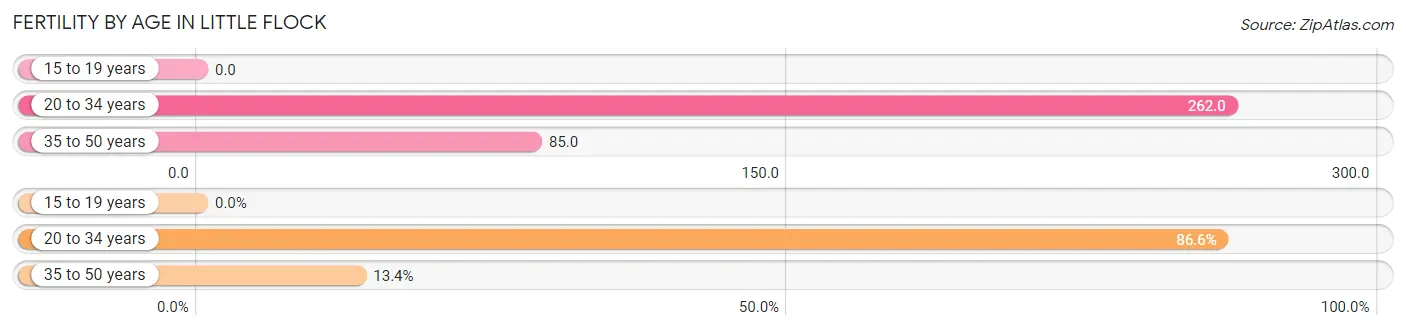
| Age Bracket | Women with Births | Births / 1,000 Women |
| 15 to 19 years | 0 (0.0%) | 0.0 |
| 20 to 34 years | 116 (86.6%) | 262.0 |
| 35 to 50 years | 18 (13.4%) | 85.0 |
| Total | 134 (100.0%) | 172.0 |
Fertility by Age by Marriage Status in Little Flock
28.4% of women with births (134) in Little Flock are married. The highest percentage of unmarried women with births falls into 20 to 34 years age bracket with 82.8% of them unmarried at the time of birth, while the lowest percentage of unmarried women with births belong to 35 to 50 years age bracket with 0.0% of them unmarried.
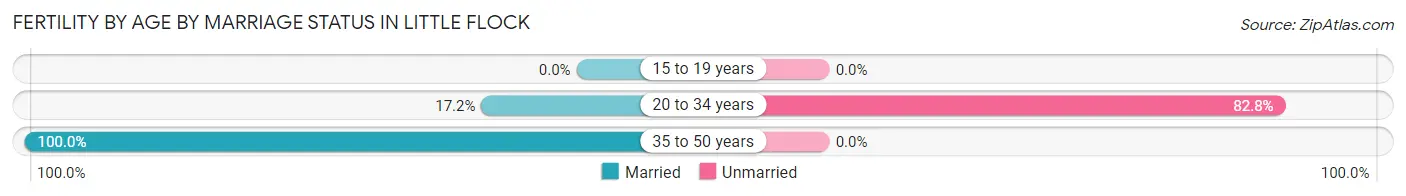
| Age Bracket | Married | Unmarried |
| 15 to 19 years | 0 (0.0%) | 0 (0.0%) |
| 20 to 34 years | 20 (17.2%) | 96 (82.8%) |
| 35 to 50 years | 18 (100.0%) | 0 (0.0%) |
| Total | 38 (28.4%) | 96 (71.6%) |
Fertility by Education in Little Flock
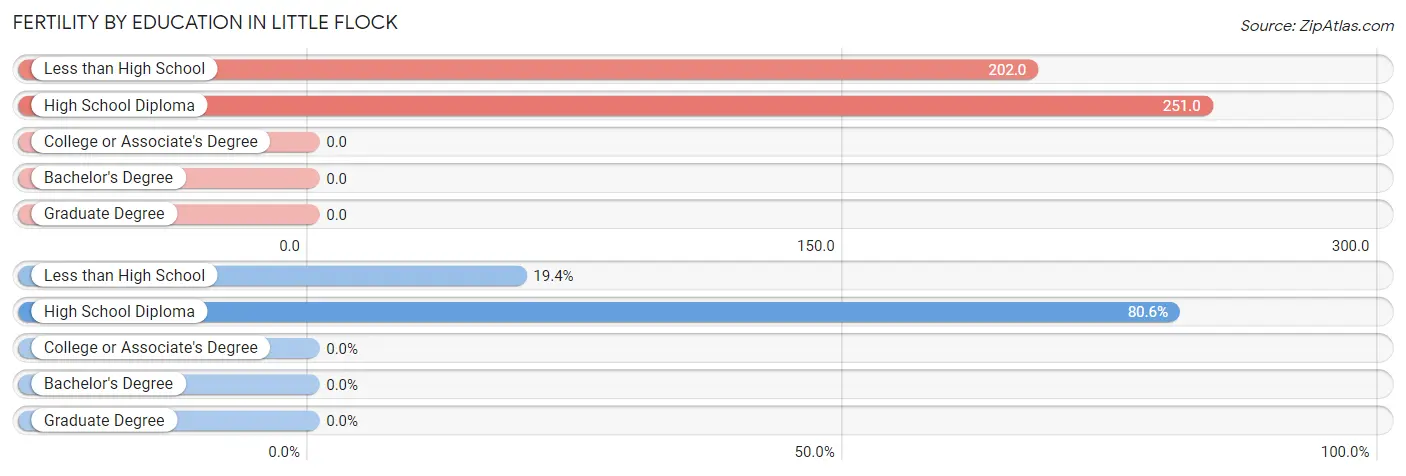
| Educational Attainment | Women with Births | Births / 1,000 Women |
| Less than High School | 26 (19.4%) | 202.0 |
| High School Diploma | 108 (80.6%) | 251.0 |
| College or Associate's Degree | 0 (0.0%) | 0.0 |
| Bachelor's Degree | 0 (0.0%) | 0.0 |
| Graduate Degree | 0 (0.0%) | 0.0 |
| Total | 134 (100.0%) | 172.0 |
Fertility by Education by Marriage Status in Little Flock
71.6% of women with births in Little Flock are unmarried. Women with the educational attainment of less than high school are most likely to be married with 100.0% of them married at childbirth, while women with the educational attainment of high school diploma are least likely to be married with 88.9% of them unmarried at childbirth.
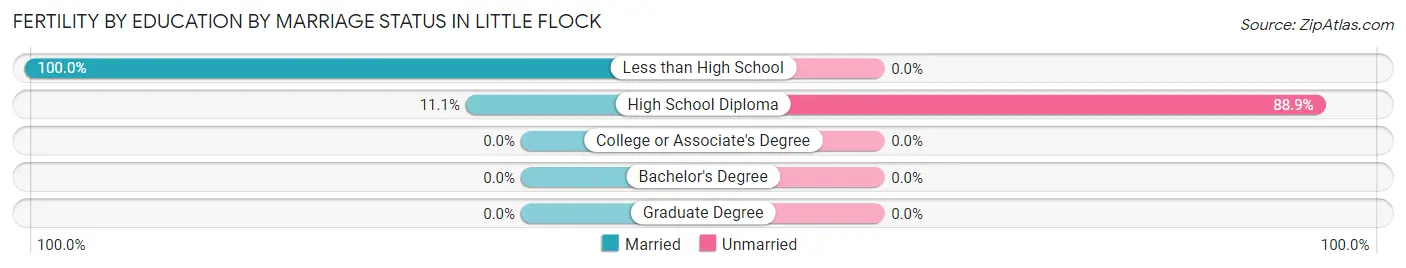
| Educational Attainment | Married | Unmarried |
| Less than High School | 26 (100.0%) | 0 (0.0%) |
| High School Diploma | 12 (11.1%) | 96 (88.9%) |
| College or Associate's Degree | 0 (0.0%) | 0 (0.0%) |
| Bachelor's Degree | 0 (0.0%) | 0 (0.0%) |
| Graduate Degree | 0 (0.0%) | 0 (0.0%) |
| Total | 38 (28.4%) | 96 (71.6%) |
Employment Characteristics in Little Flock
Employment by Class of Employer in Little Flock
Among the 1,669 employed individuals in Little Flock, private company employees (1,115 | 66.8%), not-for-profit organizations (131 | 7.9%), and local government employees (124 | 7.4%) make up the most common classes of employment.
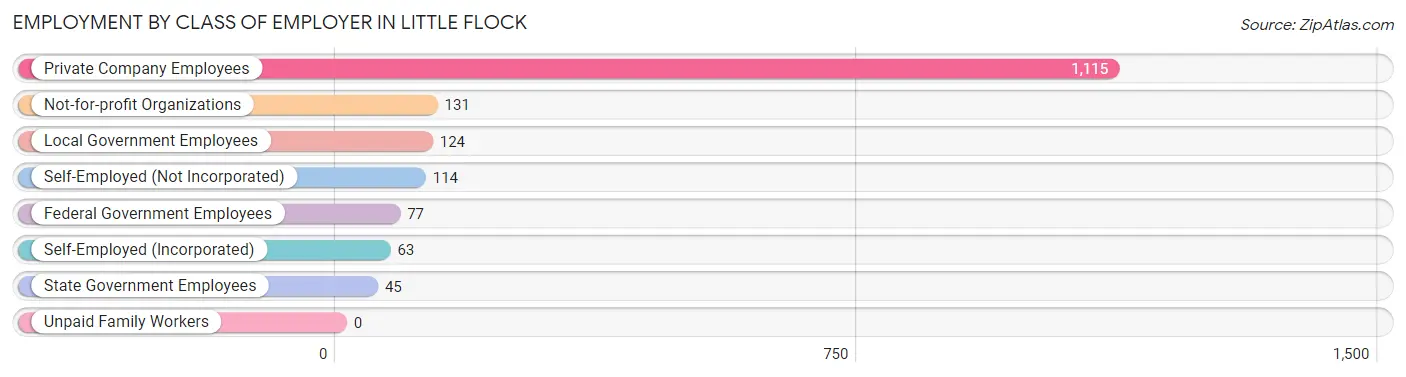
| Employer Class | # Employees | % Employees |
| Private Company Employees | 1,115 | 66.8% |
| Self-Employed (Incorporated) | 63 | 3.8% |
| Self-Employed (Not Incorporated) | 114 | 6.8% |
| Not-for-profit Organizations | 131 | 7.9% |
| Local Government Employees | 124 | 7.4% |
| State Government Employees | 45 | 2.7% |
| Federal Government Employees | 77 | 4.6% |
| Unpaid Family Workers | 0 | 0.0% |
| Total | 1,669 | 100.0% |
Employment Status by Age in Little Flock
According to the labor force statistics for Little Flock, out of the total population over 16 years of age (2,503), 73.2% or 1,832 individuals are in the labor force, with 8.6% or 158 of them unemployed. The age group with the highest labor force participation rate is 25 to 29 years, with 97.8% or 261 individuals in the labor force. Within the labor force, the 55 to 59 years age range has the highest percentage of unemployed individuals, with 25.8% or 54 of them being unemployed.
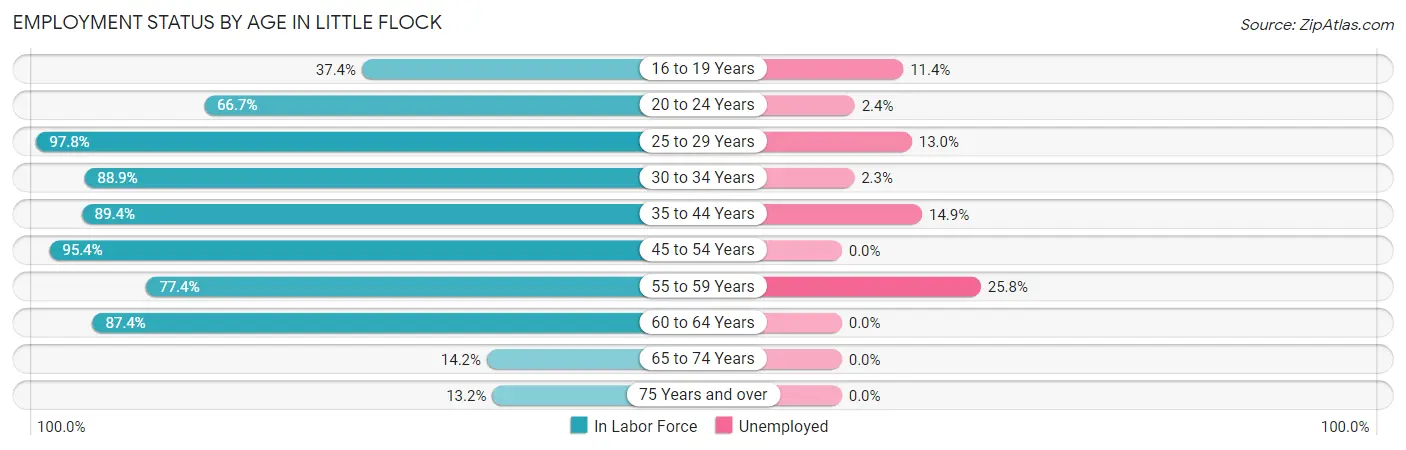
| Age Bracket | In Labor Force | Unemployed |
| 16 to 19 Years | 79 (37.4%) | 9 (11.4%) |
| 20 to 24 Years | 208 (66.7%) | 5 (2.4%) |
| 25 to 29 Years | 261 (97.8%) | 34 (13.0%) |
| 30 to 34 Years | 216 (88.9%) | 5 (2.3%) |
| 35 to 44 Years | 336 (89.4%) | 50 (14.9%) |
| 45 to 54 Years | 292 (95.4%) | 0 (0.0%) |
| 55 to 59 Years | 209 (77.4%) | 54 (25.8%) |
| 60 to 64 Years | 188 (87.4%) | 0 (0.0%) |
| 65 to 74 Years | 30 (14.2%) | 0 (0.0%) |
| 75 Years and over | 12 (13.2%) | 0 (0.0%) |
| Total | 1,832 (73.2%) | 158 (8.6%) |
Employment Status by Educational Attainment in Little Flock
According to labor force statistics for Little Flock, 89.6% of individuals (1,503) out of the total population between 25 and 64 years of age (1,677) are in the labor force, with 9.5% or 143 of them being unemployed. The group with the highest labor force participation rate are those with the educational attainment of bachelor's degree or higher, with 96.5% or 411 individuals in the labor force. Within the labor force, individuals with high school diploma education have the highest percentage of unemployment, with 22.7% or 127 of them being unemployed.
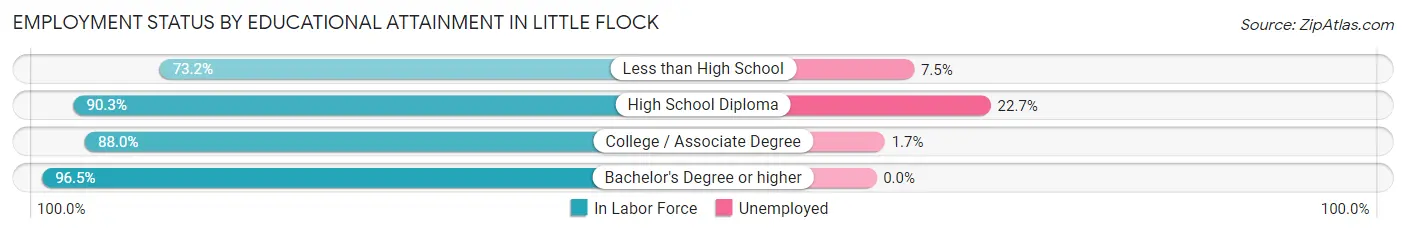
| Educational Attainment | In Labor Force | Unemployed |
| Less than High School | 120 (73.2%) | 12 (7.5%) |
| High School Diploma | 560 (90.3%) | 141 (22.7%) |
| College / Associate Degree | 411 (88.0%) | 8 (1.7%) |
| Bachelor's Degree or higher | 411 (96.5%) | 0 (0.0%) |
| Total | 1,503 (89.6%) | 159 (9.5%) |
Employment Occupations by Sex in Little Flock
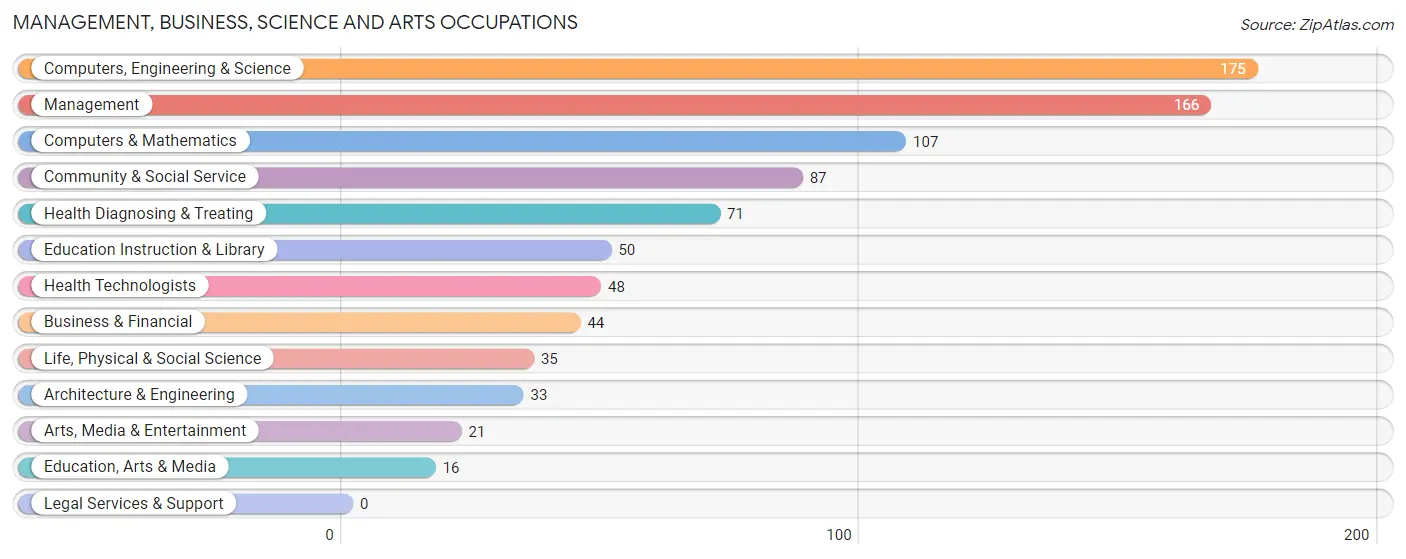
Management, Business, Science and Arts Occupations
The most common Management, Business, Science and Arts occupations in Little Flock are Computers, Engineering & Science (175 | 10.4%), Management (166 | 9.9%), Computers & Mathematics (107 | 6.4%), Community & Social Service (87 | 5.2%), and Health Diagnosing & Treating (71 | 4.2%).
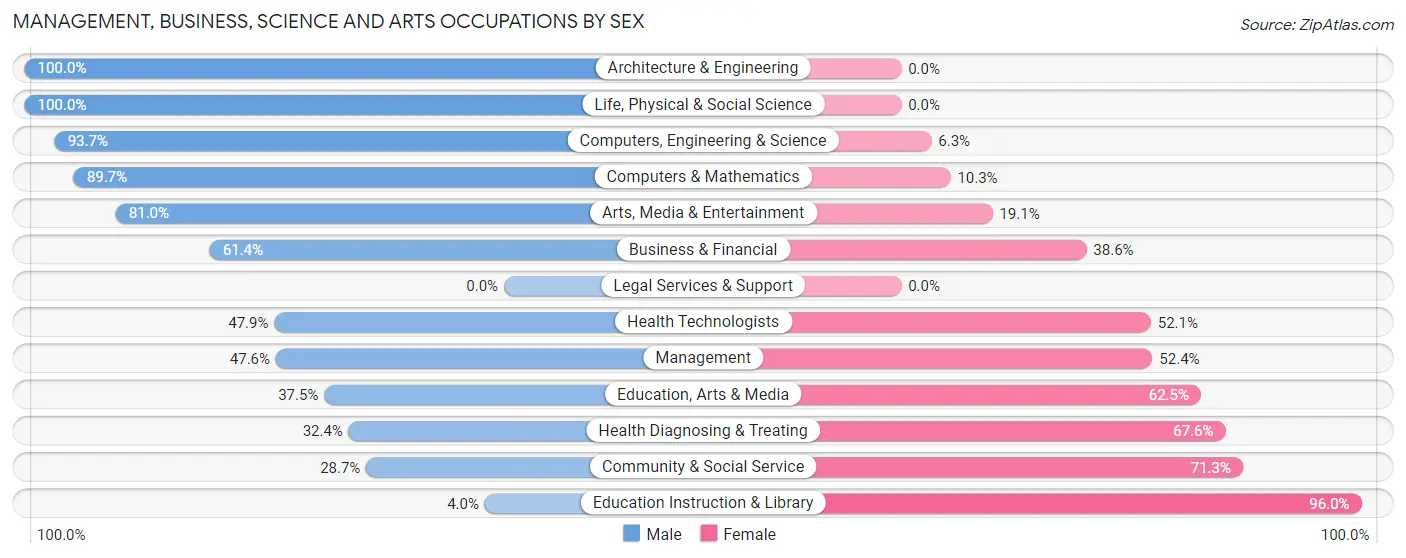
Management, Business, Science and Arts Occupations by Sex
Within the Management, Business, Science and Arts occupations in Little Flock, the most male-oriented occupations are Architecture & Engineering (100.0%), Life, Physical & Social Science (100.0%), and Computers, Engineering & Science (93.7%), while the most female-oriented occupations are Education Instruction & Library (96.0%), Community & Social Service (71.3%), and Health Diagnosing & Treating (67.6%).
| Occupation | Male | Female |
| Management | 79 (47.6%) | 87 (52.4%) |
| Business & Financial | 27 (61.4%) | 17 (38.6%) |
| Computers, Engineering & Science | 164 (93.7%) | 11 (6.3%) |
| Computers & Mathematics | 96 (89.7%) | 11 (10.3%) |
| Architecture & Engineering | 33 (100.0%) | 0 (0.0%) |
| Life, Physical & Social Science | 35 (100.0%) | 0 (0.0%) |
| Community & Social Service | 25 (28.7%) | 62 (71.3%) |
| Education, Arts & Media | 6 (37.5%) | 10 (62.5%) |
| Legal Services & Support | 0 (0.0%) | 0 (0.0%) |
| Education Instruction & Library | 2 (4.0%) | 48 (96.0%) |
| Arts, Media & Entertainment | 17 (80.9%) | 4 (19.1%) |
| Health Diagnosing & Treating | 23 (32.4%) | 48 (67.6%) |
| Health Technologists | 23 (47.9%) | 25 (52.1%) |
| Total (Category) | 318 (58.6%) | 225 (41.4%) |
| Total (Overall) | 933 (55.7%) | 741 (44.3%) |
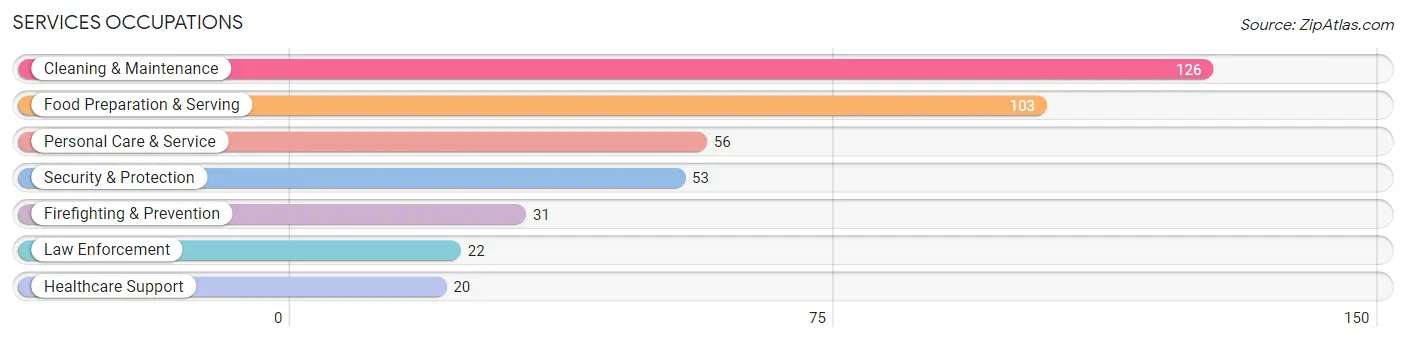
Services Occupations
The most common Services occupations in Little Flock are Cleaning & Maintenance (126 | 7.5%), Food Preparation & Serving (103 | 6.1%), Personal Care & Service (56 | 3.4%), Security & Protection (53 | 3.2%), and Firefighting & Prevention (31 | 1.8%).
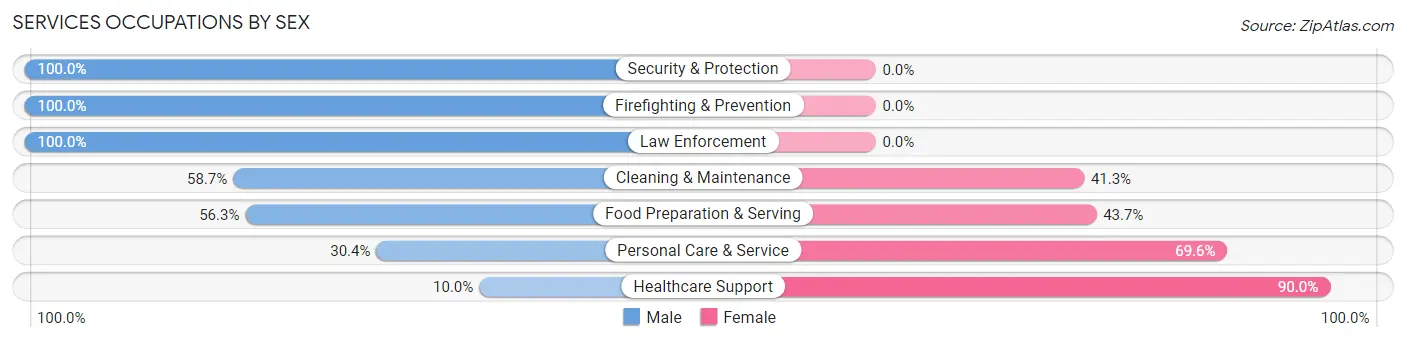
Services Occupations by Sex
Within the Services occupations in Little Flock, the most male-oriented occupations are Security & Protection (100.0%), Firefighting & Prevention (100.0%), and Law Enforcement (100.0%), while the most female-oriented occupations are Healthcare Support (90.0%), Personal Care & Service (69.6%), and Food Preparation & Serving (43.7%).
| Occupation | Male | Female |
| Healthcare Support | 2 (10.0%) | 18 (90.0%) |
| Security & Protection | 53 (100.0%) | 0 (0.0%) |
| Firefighting & Prevention | 31 (100.0%) | 0 (0.0%) |
| Law Enforcement | 22 (100.0%) | 0 (0.0%) |
| Food Preparation & Serving | 58 (56.3%) | 45 (43.7%) |
| Cleaning & Maintenance | 74 (58.7%) | 52 (41.3%) |
| Personal Care & Service | 17 (30.4%) | 39 (69.6%) |
| Total (Category) | 204 (57.0%) | 154 (43.0%) |
| Total (Overall) | 933 (55.7%) | 741 (44.3%) |
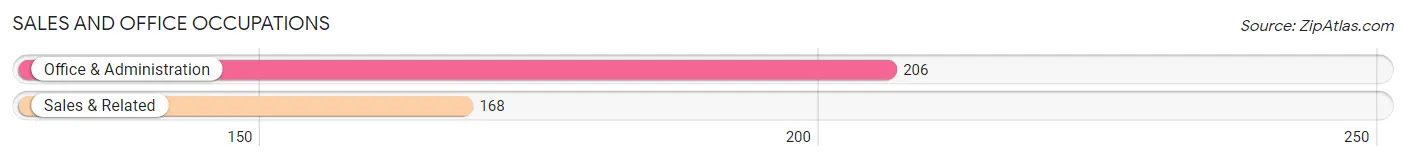
Sales and Office Occupations
The most common Sales and Office occupations in Little Flock are Office & Administration (206 | 12.3%), and Sales & Related (168 | 10.0%).
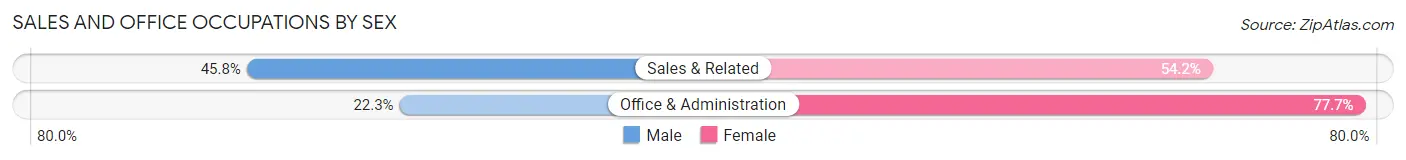
Sales and Office Occupations by Sex
| Occupation | Male | Female |
| Sales & Related | 77 (45.8%) | 91 (54.2%) |
| Office & Administration | 46 (22.3%) | 160 (77.7%) |
| Total (Category) | 123 (32.9%) | 251 (67.1%) |
| Total (Overall) | 933 (55.7%) | 741 (44.3%) |
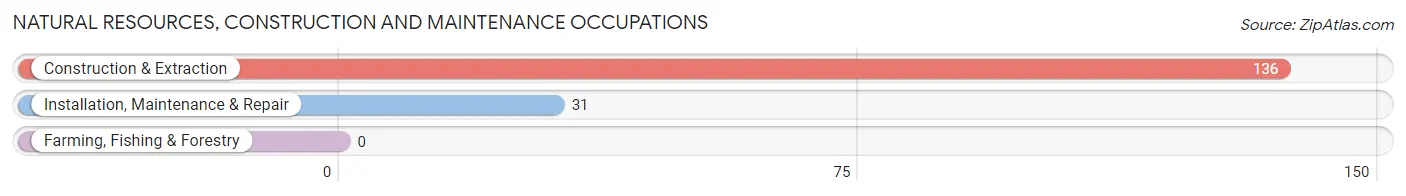
Natural Resources, Construction and Maintenance Occupations
The most common Natural Resources, Construction and Maintenance occupations in Little Flock are Construction & Extraction (136 | 8.1%), and Installation, Maintenance & Repair (31 | 1.8%).
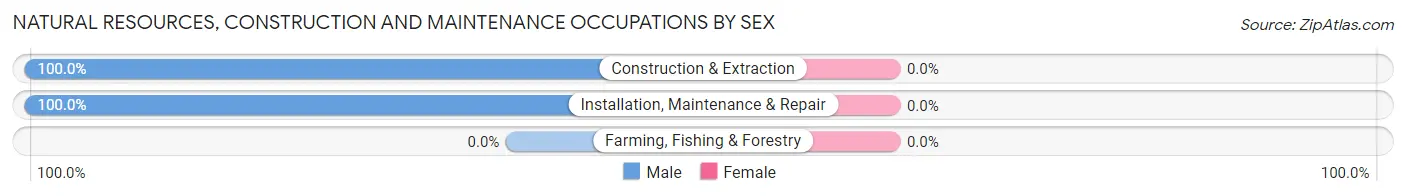
Natural Resources, Construction and Maintenance Occupations by Sex
| Occupation | Male | Female |
| Farming, Fishing & Forestry | 0 (0.0%) | 0 (0.0%) |
| Construction & Extraction | 136 (100.0%) | 0 (0.0%) |
| Installation, Maintenance & Repair | 31 (100.0%) | 0 (0.0%) |
| Total (Category) | 167 (100.0%) | 0 (0.0%) |
| Total (Overall) | 933 (55.7%) | 741 (44.3%) |
Production, Transportation and Moving Occupations
The most common Production, Transportation and Moving occupations in Little Flock are Material Moving (107 | 6.4%), Production (71 | 4.2%), and Transportation (54 | 3.2%).
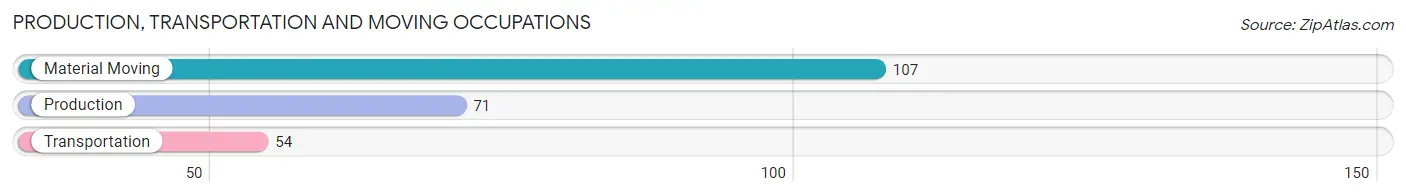
Production, Transportation and Moving Occupations by Sex

| Occupation | Male | Female |
| Production | 27 (38.0%) | 44 (62.0%) |
| Transportation | 42 (77.8%) | 12 (22.2%) |
| Material Moving | 52 (48.6%) | 55 (51.4%) |
| Total (Category) | 121 (52.2%) | 111 (47.8%) |
| Total (Overall) | 933 (55.7%) | 741 (44.3%) |
Employment Industries by Sex in Little Flock
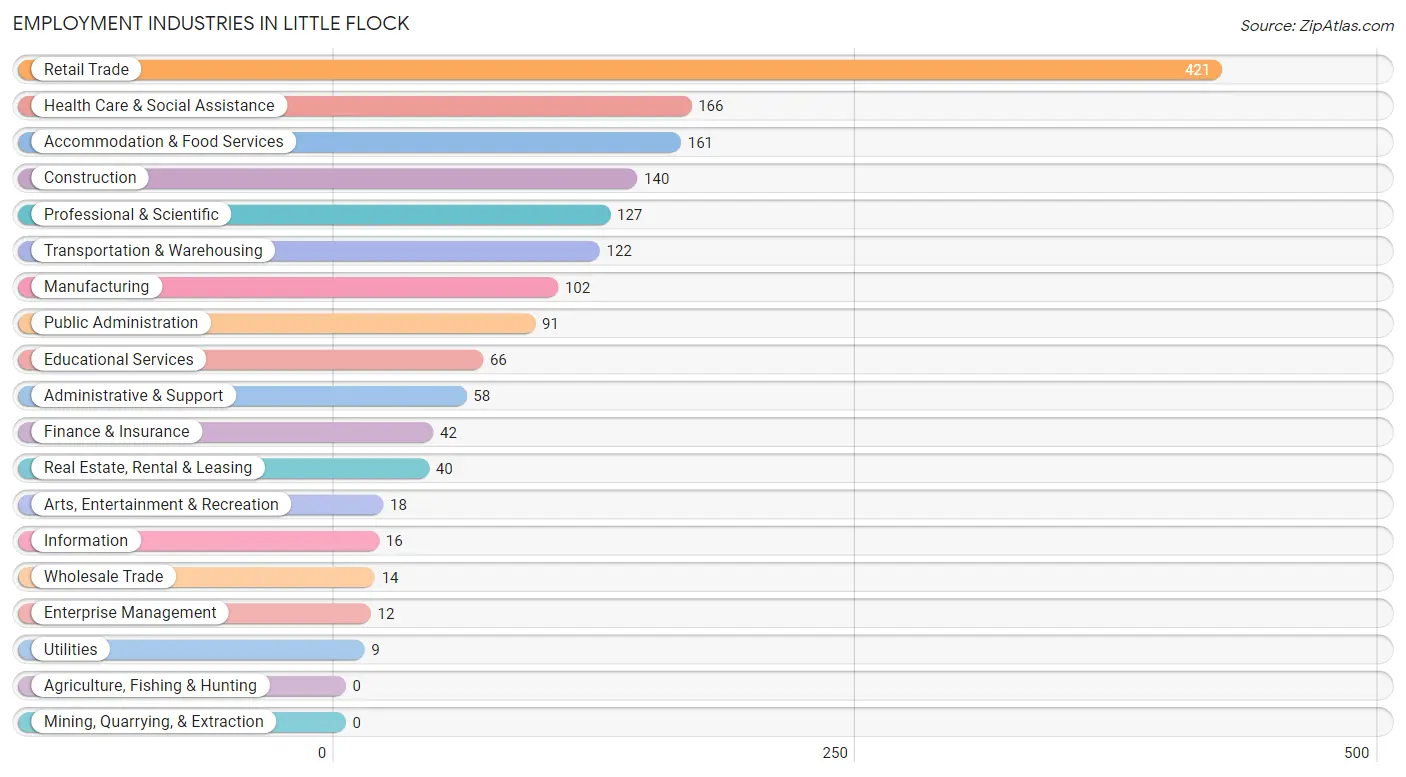
Employment Industries in Little Flock
The major employment industries in Little Flock include Retail Trade (421 | 25.2%), Health Care & Social Assistance (166 | 9.9%), Accommodation & Food Services (161 | 9.6%), Construction (140 | 8.4%), and Professional & Scientific (127 | 7.6%).
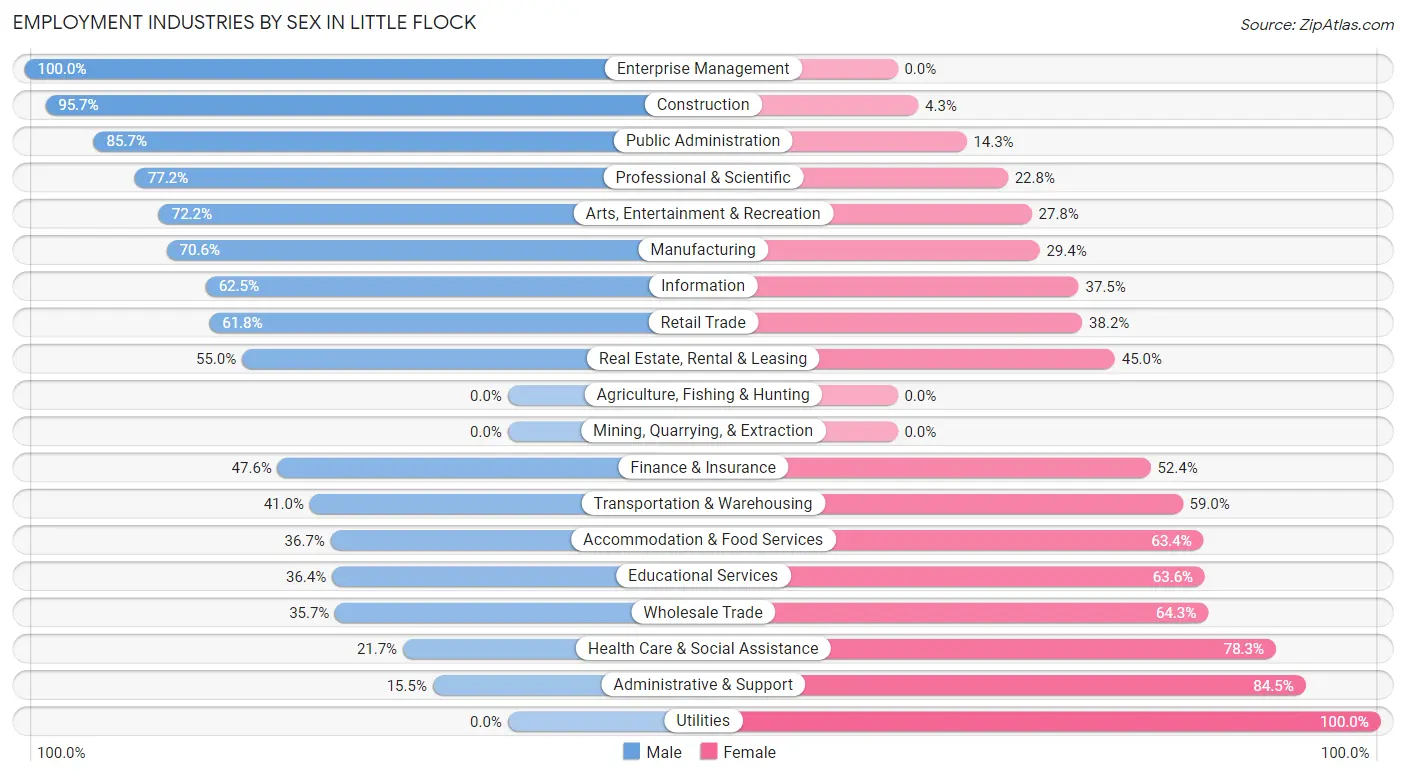
Employment Industries by Sex in Little Flock
The Little Flock industries that see more men than women are Enterprise Management (100.0%), Construction (95.7%), and Public Administration (85.7%), whereas the industries that tend to have a higher number of women are Utilities (100.0%), Administrative & Support (84.5%), and Health Care & Social Assistance (78.3%).
| Industry | Male | Female |
| Agriculture, Fishing & Hunting | 0 (0.0%) | 0 (0.0%) |
| Mining, Quarrying, & Extraction | 0 (0.0%) | 0 (0.0%) |
| Construction | 134 (95.7%) | 6 (4.3%) |
| Manufacturing | 72 (70.6%) | 30 (29.4%) |
| Wholesale Trade | 5 (35.7%) | 9 (64.3%) |
| Retail Trade | 260 (61.8%) | 161 (38.2%) |
| Transportation & Warehousing | 50 (41.0%) | 72 (59.0%) |
| Utilities | 0 (0.0%) | 9 (100.0%) |
| Information | 10 (62.5%) | 6 (37.5%) |
| Finance & Insurance | 20 (47.6%) | 22 (52.4%) |
| Real Estate, Rental & Leasing | 22 (55.0%) | 18 (45.0%) |
| Professional & Scientific | 98 (77.2%) | 29 (22.8%) |
| Enterprise Management | 12 (100.0%) | 0 (0.0%) |
| Administrative & Support | 9 (15.5%) | 49 (84.5%) |
| Educational Services | 24 (36.4%) | 42 (63.6%) |
| Health Care & Social Assistance | 36 (21.7%) | 130 (78.3%) |
| Arts, Entertainment & Recreation | 13 (72.2%) | 5 (27.8%) |
| Accommodation & Food Services | 59 (36.6%) | 102 (63.3%) |
| Public Administration | 78 (85.7%) | 13 (14.3%) |
| Total | 933 (55.7%) | 741 (44.3%) |
Education in Little Flock
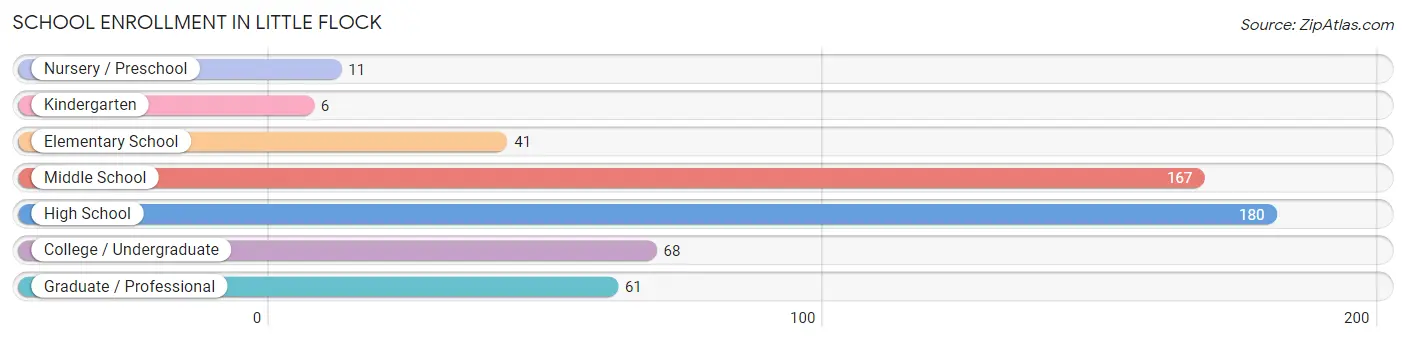
School Enrollment in Little Flock
The most common levels of schooling among the 534 students in Little Flock are high school (180 | 33.7%), middle school (167 | 31.3%), and college / undergraduate (68 | 12.7%).
| School Level | # Students | % Students |
| Nursery / Preschool | 11 | 2.1% |
| Kindergarten | 6 | 1.1% |
| Elementary School | 41 | 7.7% |
| Middle School | 167 | 31.3% |
| High School | 180 | 33.7% |
| College / Undergraduate | 68 | 12.7% |
| Graduate / Professional | 61 | 11.4% |
| Total | 534 | 100.0% |
School Enrollment by Age by Funding Source in Little Flock
Out of a total of 534 students who are enrolled in schools in Little Flock, 77 (14.4%) attend a private institution, while the remaining 457 (85.6%) are enrolled in public schools. The age group of 3 to 4 year olds has the highest likelihood of being enrolled in private schools, with 3 (42.9% in the age bracket) enrolled. Conversely, the age group of 35 years and over has the lowest likelihood of being enrolled in a private school, with 57 (100.0% in the age bracket) attending a public institution.
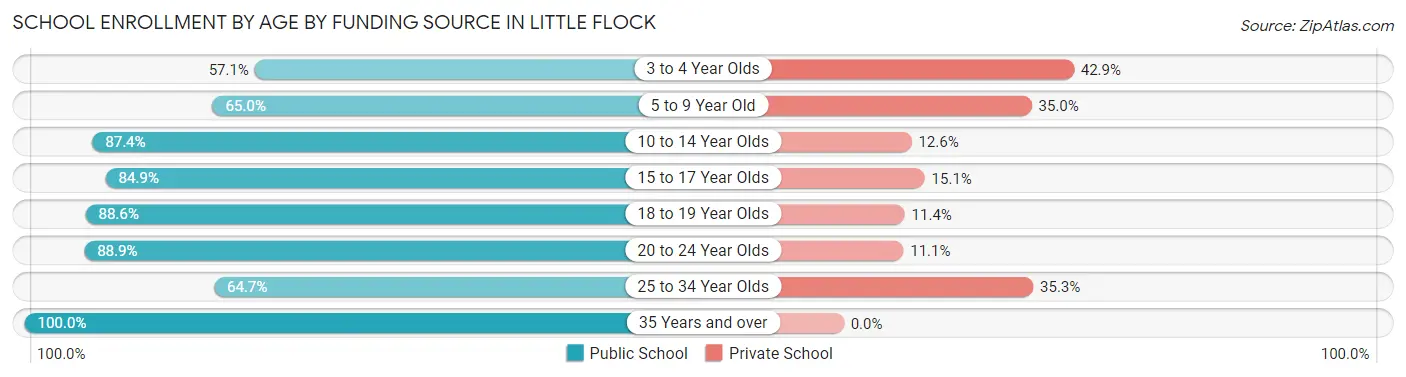
| Age Bracket | Public School | Private School |
| 3 to 4 Year Olds | 4 (57.1%) | 3 (42.9%) |
| 5 to 9 Year Old | 26 (65.0%) | 14 (35.0%) |
| 10 to 14 Year Olds | 173 (87.4%) | 25 (12.6%) |
| 15 to 17 Year Olds | 107 (84.9%) | 19 (15.1%) |
| 18 to 19 Year Olds | 39 (88.6%) | 5 (11.4%) |
| 20 to 24 Year Olds | 40 (88.9%) | 5 (11.1%) |
| 25 to 34 Year Olds | 11 (64.7%) | 6 (35.3%) |
| 35 Years and over | 57 (100.0%) | 0 (0.0%) |
| Total | 457 (85.6%) | 77 (14.4%) |
Educational Attainment by Field of Study in Little Flock
Business (159 | 28.6%), science & technology (59 | 10.6%), computers & mathematics (53 | 9.6%), liberal arts & history (48 | 8.6%), and education (40 | 7.2%) are the most common fields of study among 555 individuals in Little Flock who have obtained a bachelor's degree or higher.
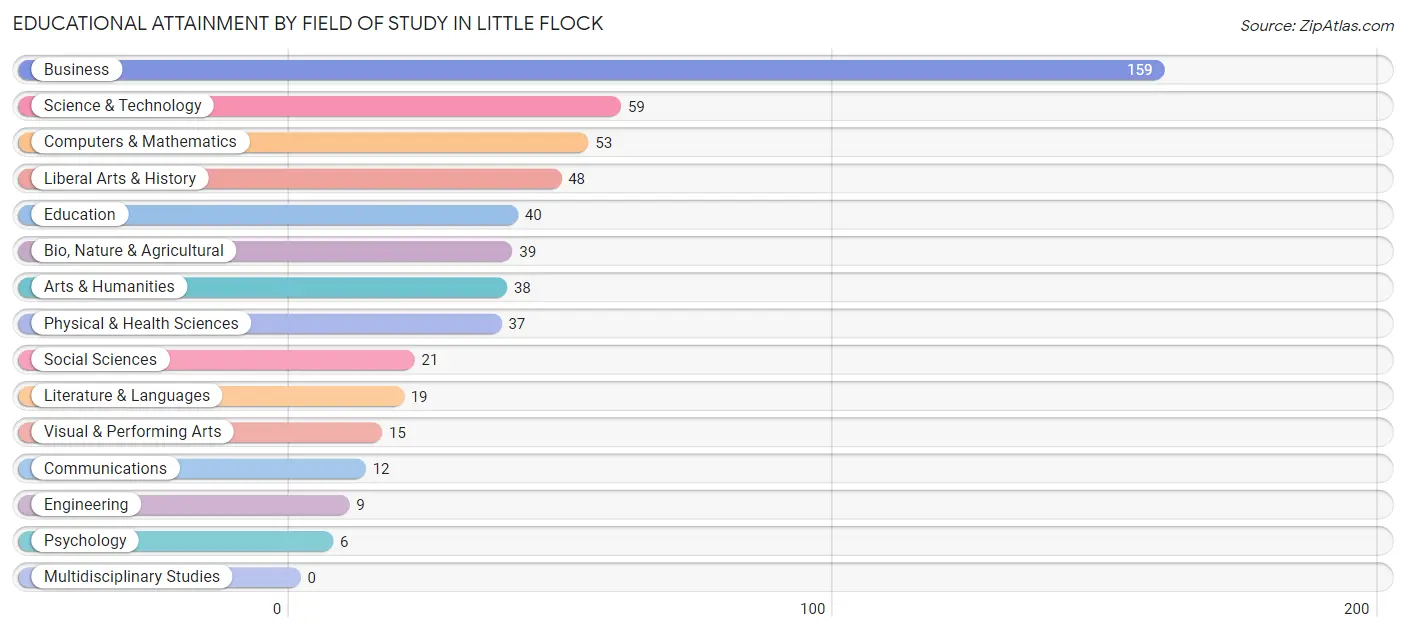
| Field of Study | # Graduates | % Graduates |
| Computers & Mathematics | 53 | 9.6% |
| Bio, Nature & Agricultural | 39 | 7.0% |
| Physical & Health Sciences | 37 | 6.7% |
| Psychology | 6 | 1.1% |
| Social Sciences | 21 | 3.8% |
| Engineering | 9 | 1.6% |
| Multidisciplinary Studies | 0 | 0.0% |
| Science & Technology | 59 | 10.6% |
| Business | 159 | 28.6% |
| Education | 40 | 7.2% |
| Literature & Languages | 19 | 3.4% |
| Liberal Arts & History | 48 | 8.6% |
| Visual & Performing Arts | 15 | 2.7% |
| Communications | 12 | 2.2% |
| Arts & Humanities | 38 | 6.9% |
| Total | 555 | 100.0% |
Transportation & Commute in Little Flock
Vehicle Availability by Sex in Little Flock
The most prevalent vehicle ownership categories in Little Flock are males with 2 vehicles (444, accounting for 48.0%) and females with 2 vehicles (324, making up 60.7%).
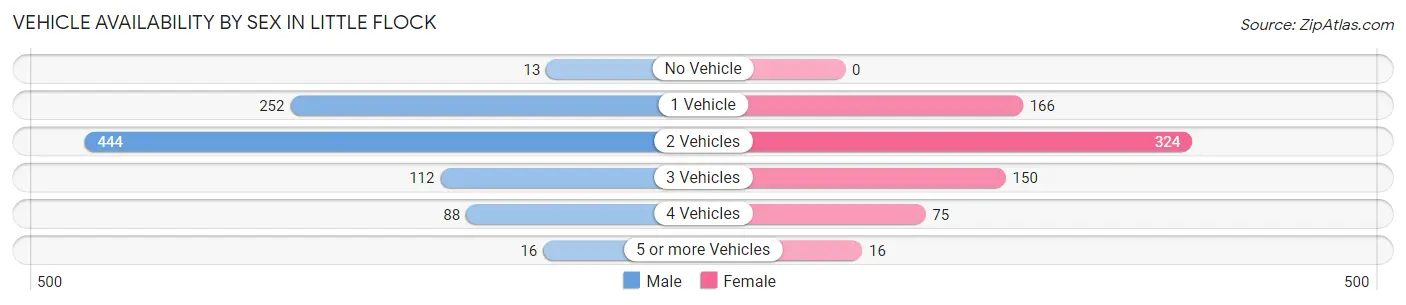
| Vehicles Available | Male | Female |
| No Vehicle | 13 (1.4%) | 0 (0.0%) |
| 1 Vehicle | 252 (27.2%) | 166 (22.7%) |
| 2 Vehicles | 444 (48.0%) | 324 (44.3%) |
| 3 Vehicles | 112 (12.1%) | 150 (20.5%) |
| 4 Vehicles | 88 (9.5%) | 75 (10.3%) |
| 5 or more Vehicles | 16 (1.7%) | 16 (2.2%) |
| Total | 925 (100.0%) | 731 (100.0%) |
Commute Time in Little Flock
The most frequently occuring commute durations in Little Flock are 20 to 24 minutes (413 commuters, 28.6%), 15 to 19 minutes (351 commuters, 24.3%), and 5 to 9 minutes (208 commuters, 14.4%).
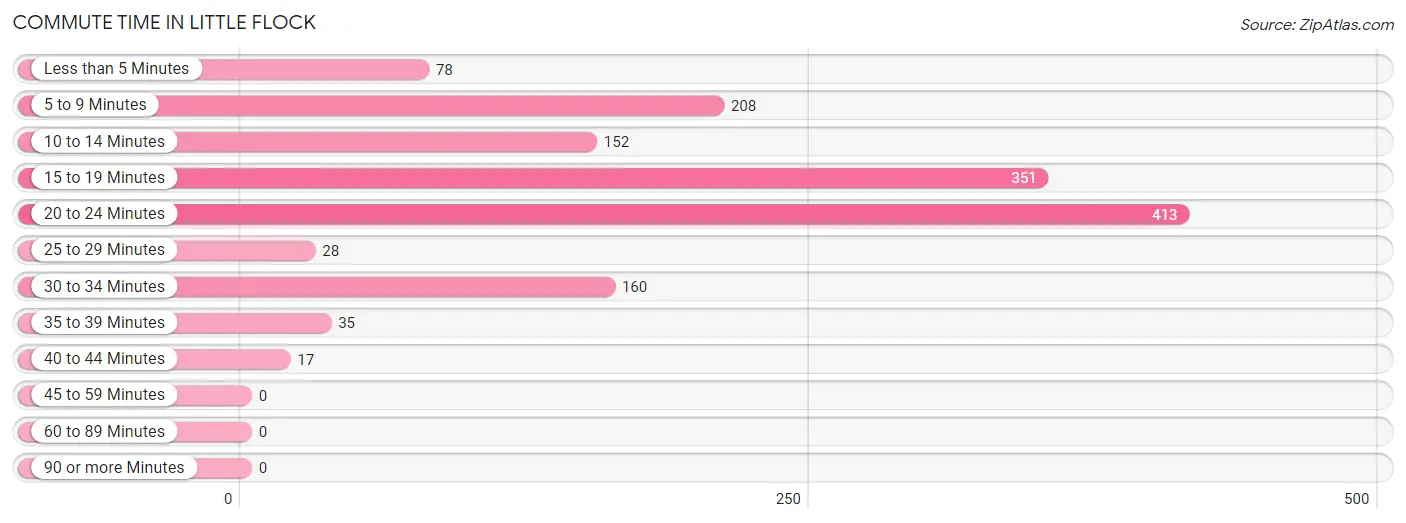
| Commute Time | # Commuters | % Commuters |
| Less than 5 Minutes | 78 | 5.4% |
| 5 to 9 Minutes | 208 | 14.4% |
| 10 to 14 Minutes | 152 | 10.5% |
| 15 to 19 Minutes | 351 | 24.3% |
| 20 to 24 Minutes | 413 | 28.6% |
| 25 to 29 Minutes | 28 | 1.9% |
| 30 to 34 Minutes | 160 | 11.1% |
| 35 to 39 Minutes | 35 | 2.4% |
| 40 to 44 Minutes | 17 | 1.2% |
| 45 to 59 Minutes | 0 | 0.0% |
| 60 to 89 Minutes | 0 | 0.0% |
| 90 or more Minutes | 0 | 0.0% |
Commute Time by Sex in Little Flock
The most common commute times in Little Flock are 20 to 24 minutes (241 commuters, 32.2%) for males and 15 to 19 minutes (226 commuters, 32.6%) for females.
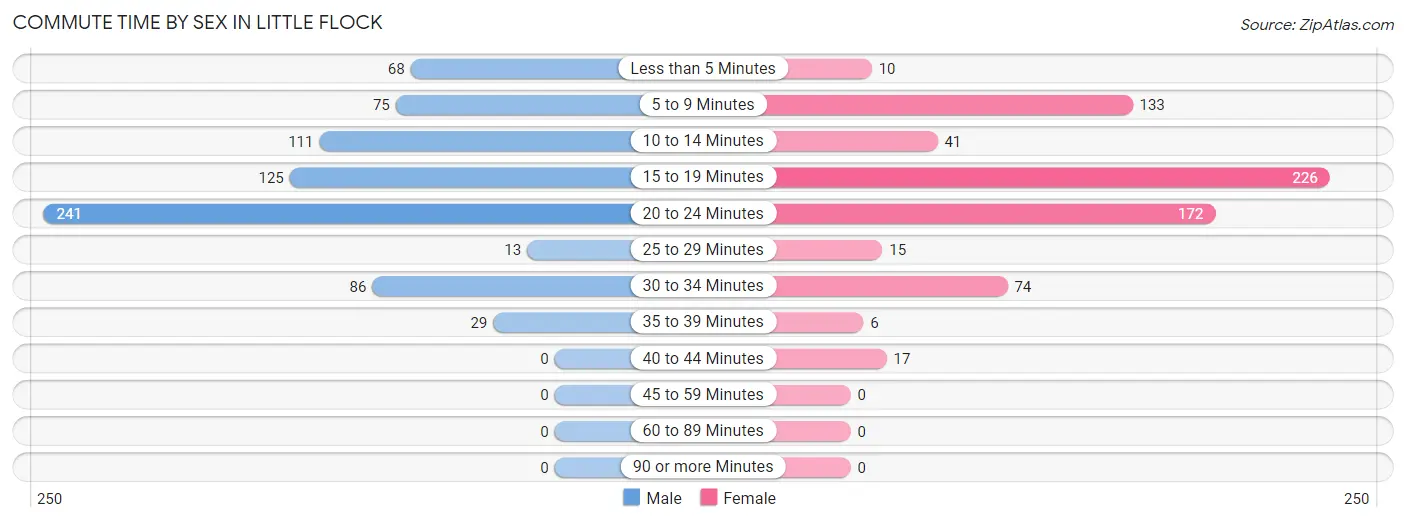
| Commute Time | Male | Female |
| Less than 5 Minutes | 68 (9.1%) | 10 (1.4%) |
| 5 to 9 Minutes | 75 (10.0%) | 133 (19.2%) |
| 10 to 14 Minutes | 111 (14.8%) | 41 (5.9%) |
| 15 to 19 Minutes | 125 (16.7%) | 226 (32.6%) |
| 20 to 24 Minutes | 241 (32.2%) | 172 (24.8%) |
| 25 to 29 Minutes | 13 (1.7%) | 15 (2.2%) |
| 30 to 34 Minutes | 86 (11.5%) | 74 (10.7%) |
| 35 to 39 Minutes | 29 (3.9%) | 6 (0.9%) |
| 40 to 44 Minutes | 0 (0.0%) | 17 (2.5%) |
| 45 to 59 Minutes | 0 (0.0%) | 0 (0.0%) |
| 60 to 89 Minutes | 0 (0.0%) | 0 (0.0%) |
| 90 or more Minutes | 0 (0.0%) | 0 (0.0%) |
Time of Departure to Work by Sex in Little Flock
The most frequent times of departure to work in Little Flock are 7:00 AM to 7:29 AM (215, 28.7%) for males and 7:00 AM to 7:29 AM (132, 19.0%) for females.
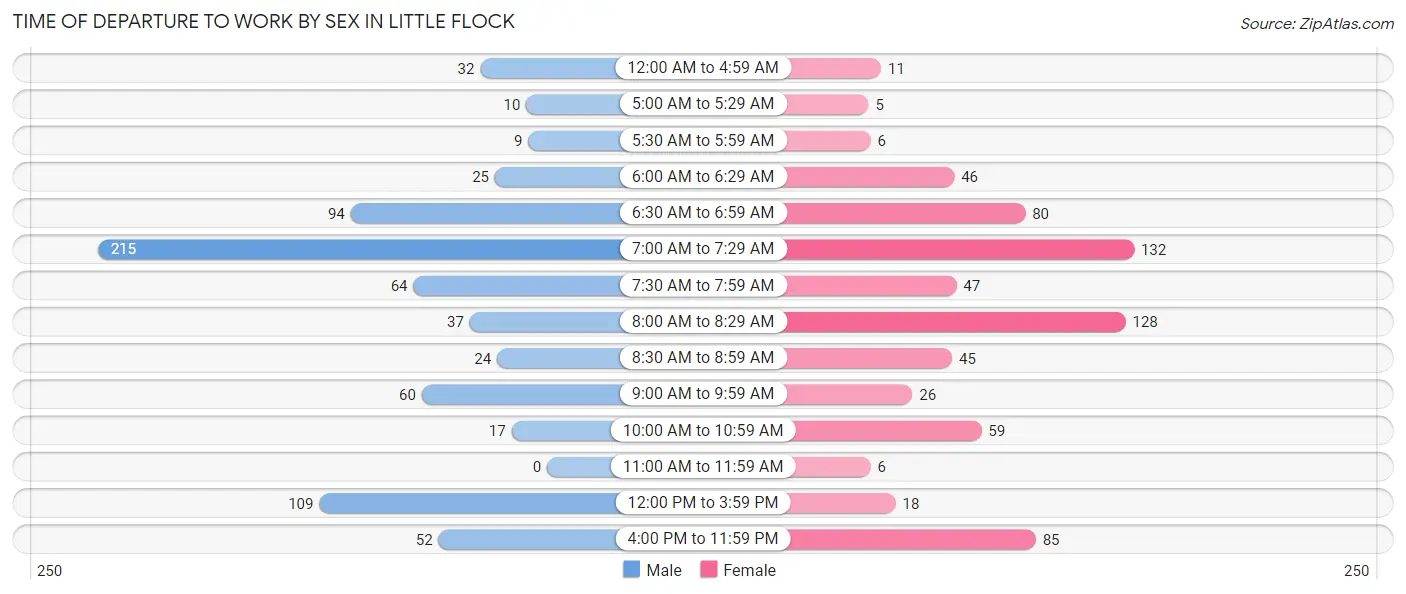
| Time of Departure | Male | Female |
| 12:00 AM to 4:59 AM | 32 (4.3%) | 11 (1.6%) |
| 5:00 AM to 5:29 AM | 10 (1.3%) | 5 (0.7%) |
| 5:30 AM to 5:59 AM | 9 (1.2%) | 6 (0.9%) |
| 6:00 AM to 6:29 AM | 25 (3.3%) | 46 (6.6%) |
| 6:30 AM to 6:59 AM | 94 (12.6%) | 80 (11.5%) |
| 7:00 AM to 7:29 AM | 215 (28.7%) | 132 (19.0%) |
| 7:30 AM to 7:59 AM | 64 (8.6%) | 47 (6.8%) |
| 8:00 AM to 8:29 AM | 37 (5.0%) | 128 (18.4%) |
| 8:30 AM to 8:59 AM | 24 (3.2%) | 45 (6.5%) |
| 9:00 AM to 9:59 AM | 60 (8.0%) | 26 (3.7%) |
| 10:00 AM to 10:59 AM | 17 (2.3%) | 59 (8.5%) |
| 11:00 AM to 11:59 AM | 0 (0.0%) | 6 (0.9%) |
| 12:00 PM to 3:59 PM | 109 (14.6%) | 18 (2.6%) |
| 4:00 PM to 11:59 PM | 52 (7.0%) | 85 (12.2%) |
| Total | 748 (100.0%) | 694 (100.0%) |
Housing Occupancy in Little Flock
Occupancy by Ownership in Little Flock
Of the total 1,291 dwellings in Little Flock, owner-occupied units account for 472 (36.6%), while renter-occupied units make up 819 (63.4%).
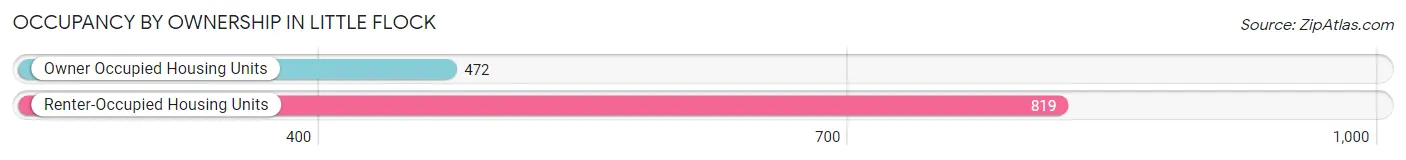
| Occupancy | # Housing Units | % Housing Units |
| Owner Occupied Housing Units | 472 | 36.6% |
| Renter-Occupied Housing Units | 819 | 63.4% |
| Total Occupied Housing Units | 1,291 | 100.0% |
Occupancy by Household Size in Little Flock
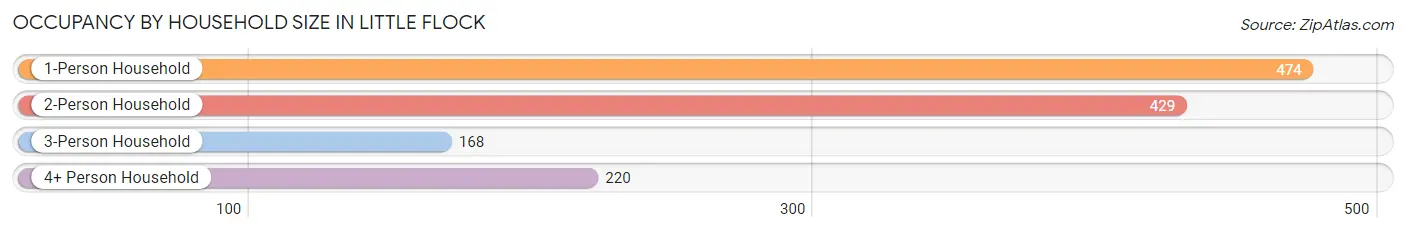
| Household Size | # Housing Units | % Housing Units |
| 1-Person Household | 474 | 36.7% |
| 2-Person Household | 429 | 33.2% |
| 3-Person Household | 168 | 13.0% |
| 4+ Person Household | 220 | 17.0% |
| Total Housing Units | 1,291 | 100.0% |
Occupancy by Ownership by Household Size in Little Flock
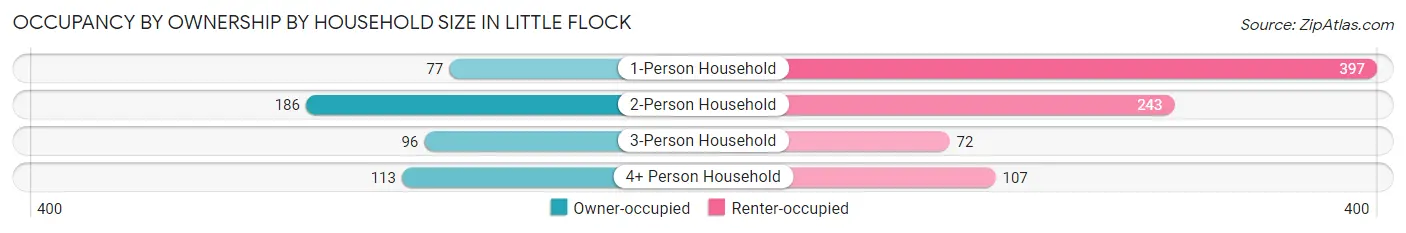
| Household Size | Owner-occupied | Renter-occupied |
| 1-Person Household | 77 (16.2%) | 397 (83.8%) |
| 2-Person Household | 186 (43.4%) | 243 (56.6%) |
| 3-Person Household | 96 (57.1%) | 72 (42.9%) |
| 4+ Person Household | 113 (51.4%) | 107 (48.6%) |
| Total Housing Units | 472 (36.6%) | 819 (63.4%) |
Occupancy by Educational Attainment in Little Flock
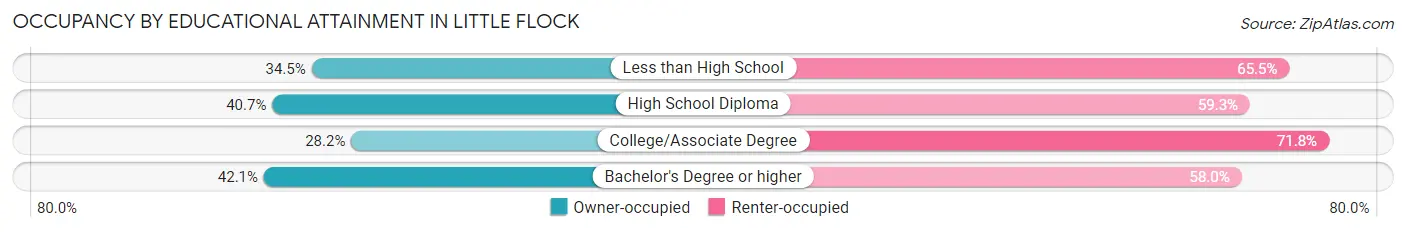
| Household Size | Owner-occupied | Renter-occupied |
| Less than High School | 40 (34.5%) | 76 (65.5%) |
| High School Diploma | 169 (40.7%) | 246 (59.3%) |
| College/Associate Degree | 115 (28.2%) | 293 (71.8%) |
| Bachelor's Degree or higher | 148 (42.0%) | 204 (58.0%) |
Occupancy by Age of Householder in Little Flock
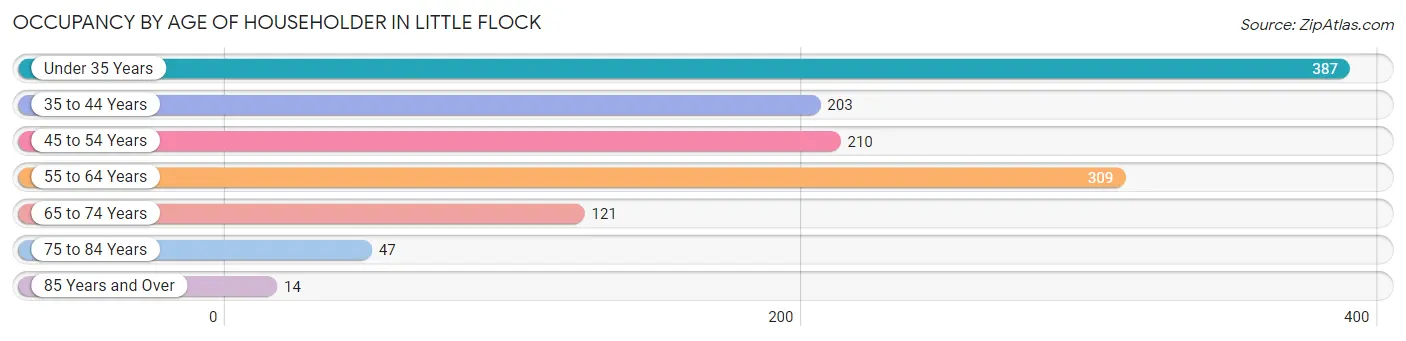
| Age Bracket | # Households | % Households |
| Under 35 Years | 387 | 30.0% |
| 35 to 44 Years | 203 | 15.7% |
| 45 to 54 Years | 210 | 16.3% |
| 55 to 64 Years | 309 | 23.9% |
| 65 to 74 Years | 121 | 9.4% |
| 75 to 84 Years | 47 | 3.6% |
| 85 Years and Over | 14 | 1.1% |
| Total | 1,291 | 100.0% |
Housing Finances in Little Flock
Median Income by Occupancy in Little Flock
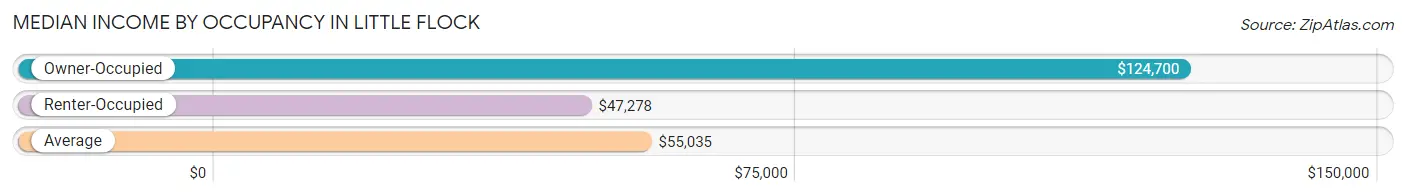
| Occupancy Type | # Households | Median Income |
| Owner-Occupied | 472 (36.6%) | $124,700 |
| Renter-Occupied | 819 (63.4%) | $47,278 |
| Average | 1,291 (100.0%) | $55,035 |
Occupancy by Householder Income Bracket in Little Flock
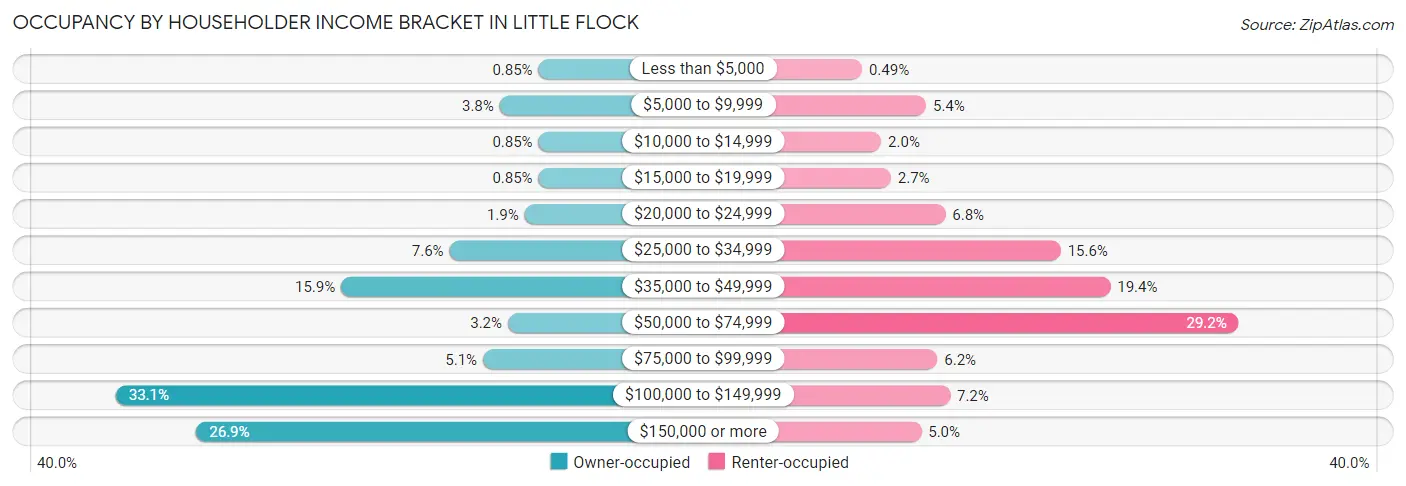
| Income Bracket | Owner-occupied | Renter-occupied |
| Less than $5,000 | 4 (0.9%) | 4 (0.5%) |
| $5,000 to $9,999 | 18 (3.8%) | 44 (5.4%) |
| $10,000 to $14,999 | 4 (0.9%) | 16 (1.9%) |
| $15,000 to $19,999 | 4 (0.9%) | 22 (2.7%) |
| $20,000 to $24,999 | 9 (1.9%) | 56 (6.8%) |
| $25,000 to $34,999 | 36 (7.6%) | 128 (15.6%) |
| $35,000 to $49,999 | 75 (15.9%) | 159 (19.4%) |
| $50,000 to $74,999 | 15 (3.2%) | 239 (29.2%) |
| $75,000 to $99,999 | 24 (5.1%) | 51 (6.2%) |
| $100,000 to $149,999 | 156 (33.1%) | 59 (7.2%) |
| $150,000 or more | 127 (26.9%) | 41 (5.0%) |
| Total | 472 (100.0%) | 819 (100.0%) |
Monthly Housing Cost Tiers in Little Flock
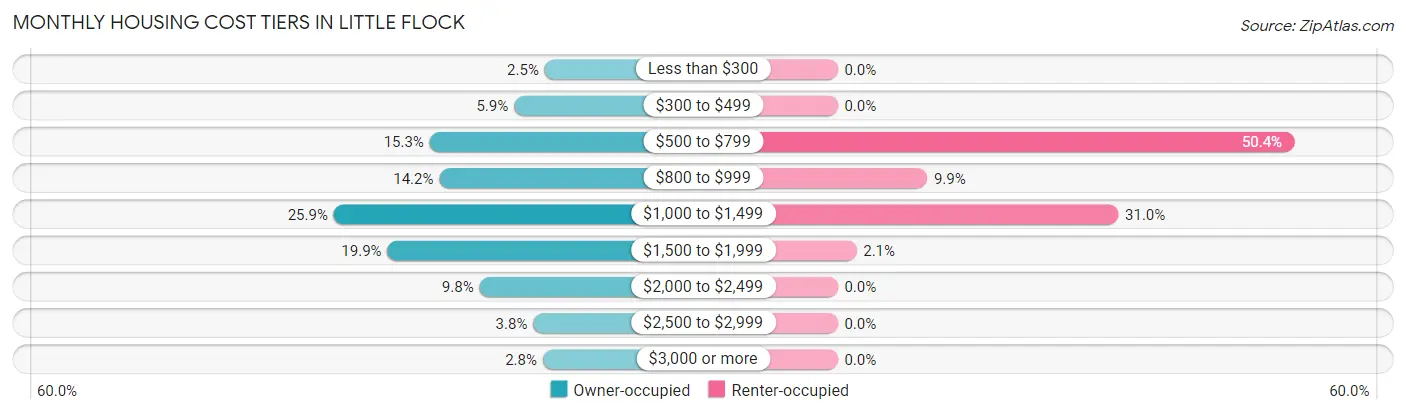
| Monthly Cost | Owner-occupied | Renter-occupied |
| Less than $300 | 12 (2.5%) | 0 (0.0%) |
| $300 to $499 | 28 (5.9%) | 0 (0.0%) |
| $500 to $799 | 72 (15.2%) | 413 (50.4%) |
| $800 to $999 | 67 (14.2%) | 81 (9.9%) |
| $1,000 to $1,499 | 122 (25.9%) | 254 (31.0%) |
| $1,500 to $1,999 | 94 (19.9%) | 17 (2.1%) |
| $2,000 to $2,499 | 46 (9.8%) | 0 (0.0%) |
| $2,500 to $2,999 | 18 (3.8%) | 0 (0.0%) |
| $3,000 or more | 13 (2.8%) | 0 (0.0%) |
| Total | 472 (100.0%) | 819 (100.0%) |
Physical Housing Characteristics in Little Flock
Housing Structures in Little Flock
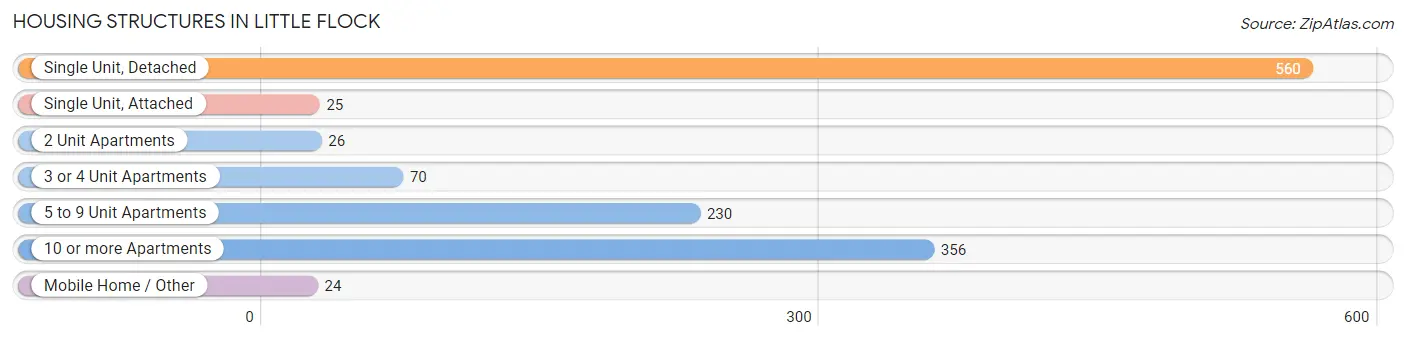
| Structure Type | # Housing Units | % Housing Units |
| Single Unit, Detached | 560 | 43.4% |
| Single Unit, Attached | 25 | 1.9% |
| 2 Unit Apartments | 26 | 2.0% |
| 3 or 4 Unit Apartments | 70 | 5.4% |
| 5 to 9 Unit Apartments | 230 | 17.8% |
| 10 or more Apartments | 356 | 27.6% |
| Mobile Home / Other | 24 | 1.9% |
| Total | 1,291 | 100.0% |
Housing Structures by Occupancy in Little Flock
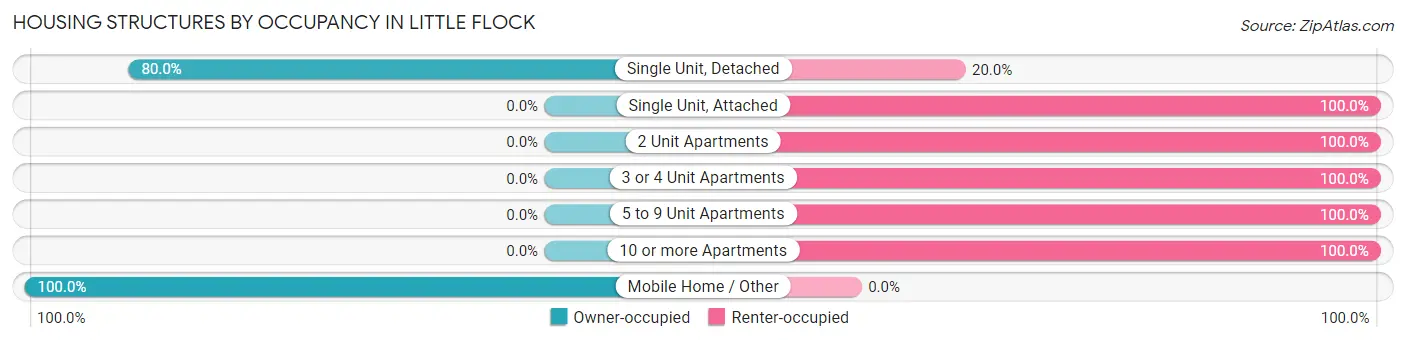
| Structure Type | Owner-occupied | Renter-occupied |
| Single Unit, Detached | 448 (80.0%) | 112 (20.0%) |
| Single Unit, Attached | 0 (0.0%) | 25 (100.0%) |
| 2 Unit Apartments | 0 (0.0%) | 26 (100.0%) |
| 3 or 4 Unit Apartments | 0 (0.0%) | 70 (100.0%) |
| 5 to 9 Unit Apartments | 0 (0.0%) | 230 (100.0%) |
| 10 or more Apartments | 0 (0.0%) | 356 (100.0%) |
| Mobile Home / Other | 24 (100.0%) | 0 (0.0%) |
| Total | 472 (36.6%) | 819 (63.4%) |
Housing Structures by Number of Rooms in Little Flock
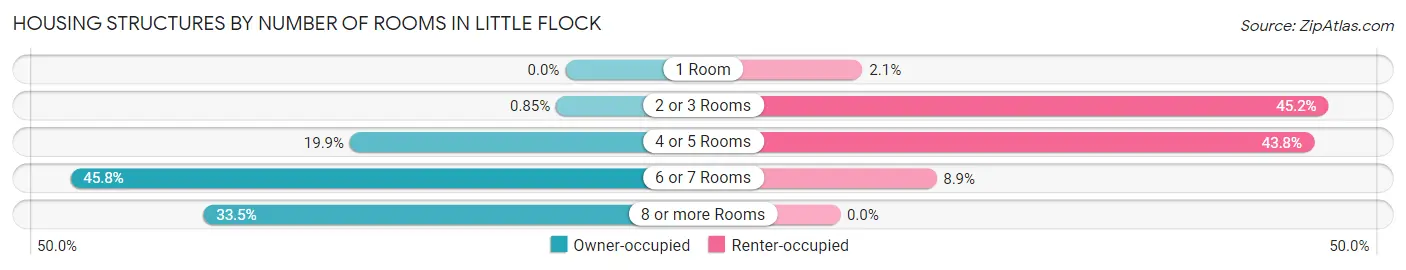
| Number of Rooms | Owner-occupied | Renter-occupied |
| 1 Room | 0 (0.0%) | 17 (2.1%) |
| 2 or 3 Rooms | 4 (0.9%) | 370 (45.2%) |
| 4 or 5 Rooms | 94 (19.9%) | 359 (43.8%) |
| 6 or 7 Rooms | 216 (45.8%) | 73 (8.9%) |
| 8 or more Rooms | 158 (33.5%) | 0 (0.0%) |
| Total | 472 (100.0%) | 819 (100.0%) |
Housing Structure by Heating Type in Little Flock
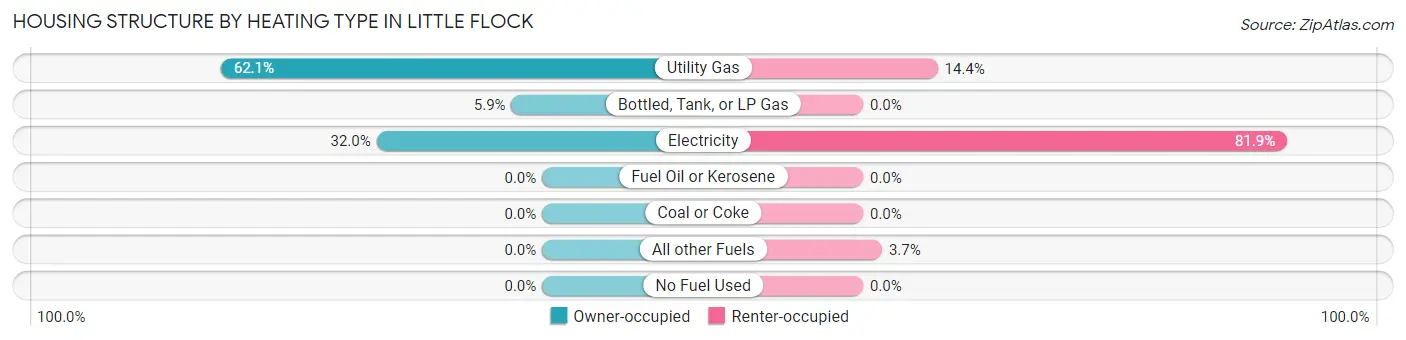
| Heating Type | Owner-occupied | Renter-occupied |
| Utility Gas | 293 (62.1%) | 118 (14.4%) |
| Bottled, Tank, or LP Gas | 28 (5.9%) | 0 (0.0%) |
| Electricity | 151 (32.0%) | 671 (81.9%) |
| Fuel Oil or Kerosene | 0 (0.0%) | 0 (0.0%) |
| Coal or Coke | 0 (0.0%) | 0 (0.0%) |
| All other Fuels | 0 (0.0%) | 30 (3.7%) |
| No Fuel Used | 0 (0.0%) | 0 (0.0%) |
| Total | 472 (100.0%) | 819 (100.0%) |
Household Vehicle Usage in Little Flock
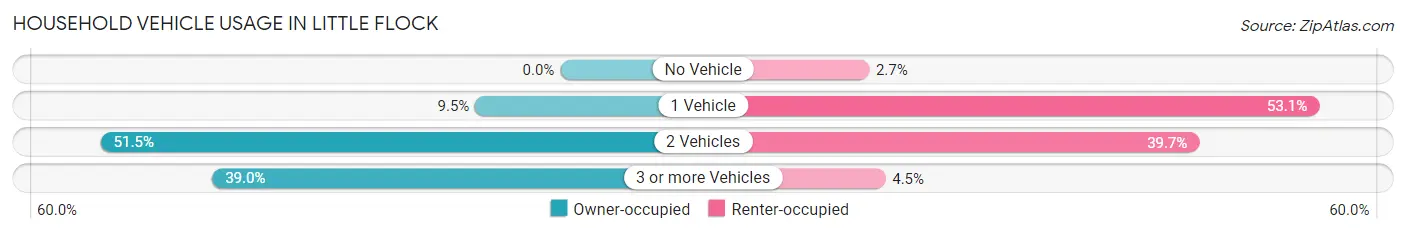
| Vehicles per Household | Owner-occupied | Renter-occupied |
| No Vehicle | 0 (0.0%) | 22 (2.7%) |
| 1 Vehicle | 45 (9.5%) | 435 (53.1%) |
| 2 Vehicles | 243 (51.5%) | 325 (39.7%) |
| 3 or more Vehicles | 184 (39.0%) | 37 (4.5%) |
| Total | 472 (100.0%) | 819 (100.0%) |
Real Estate & Mortgages in Little Flock
Real Estate and Mortgage Overview in Little Flock
| Characteristic | Without Mortgage | With Mortgage |
| Housing Units | 166 | 306 |
| Median Property Value | $389,500 | $355,200 |
| Median Household Income | $127,625 | $82 |
| Monthly Housing Costs | $633 | $13 |
| Real Estate Taxes | $2,292 | $0 |
Property Value by Mortgage Status in Little Flock
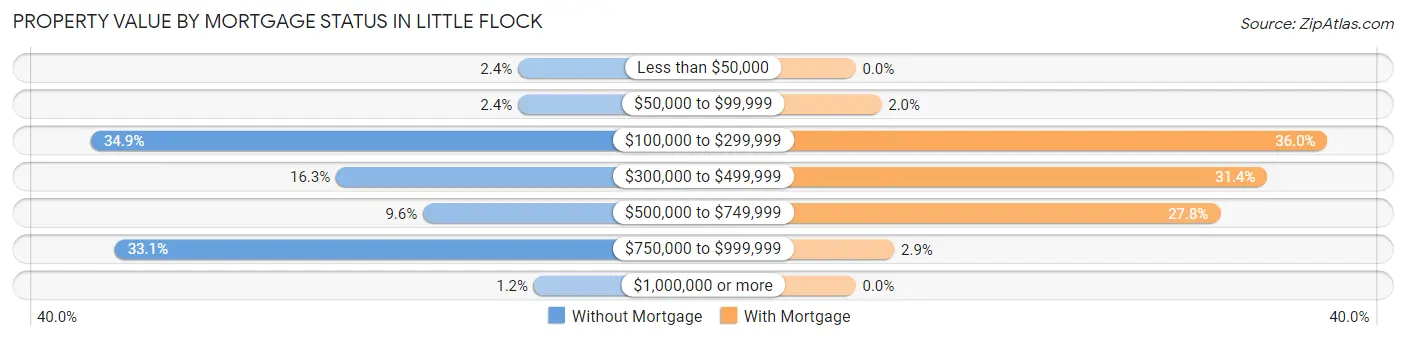
| Property Value | Without Mortgage | With Mortgage |
| Less than $50,000 | 4 (2.4%) | 0 (0.0%) |
| $50,000 to $99,999 | 4 (2.4%) | 6 (2.0%) |
| $100,000 to $299,999 | 58 (34.9%) | 110 (35.9%) |
| $300,000 to $499,999 | 27 (16.3%) | 96 (31.4%) |
| $500,000 to $749,999 | 16 (9.6%) | 85 (27.8%) |
| $750,000 to $999,999 | 55 (33.1%) | 9 (2.9%) |
| $1,000,000 or more | 2 (1.2%) | 0 (0.0%) |
| Total | 166 (100.0%) | 306 (100.0%) |
Household Income by Mortgage Status in Little Flock
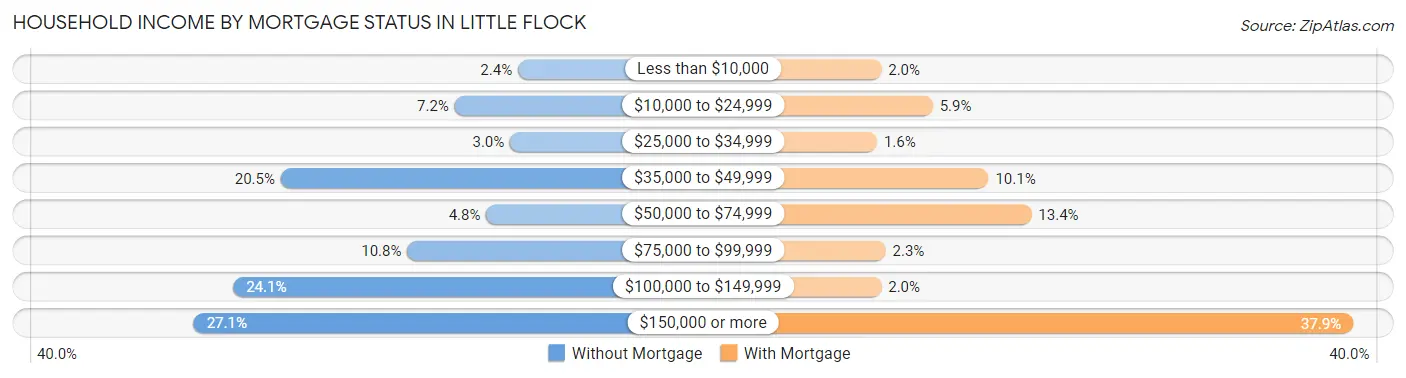
| Household Income | Without Mortgage | With Mortgage |
| Less than $10,000 | 4 (2.4%) | 6 (2.0%) |
| $10,000 to $24,999 | 12 (7.2%) | 18 (5.9%) |
| $25,000 to $34,999 | 5 (3.0%) | 5 (1.6%) |
| $35,000 to $49,999 | 34 (20.5%) | 31 (10.1%) |
| $50,000 to $74,999 | 8 (4.8%) | 41 (13.4%) |
| $75,000 to $99,999 | 18 (10.8%) | 7 (2.3%) |
| $100,000 to $149,999 | 40 (24.1%) | 6 (2.0%) |
| $150,000 or more | 45 (27.1%) | 116 (37.9%) |
| Total | 166 (100.0%) | 306 (100.0%) |
Property Value to Household Income Ratio in Little Flock
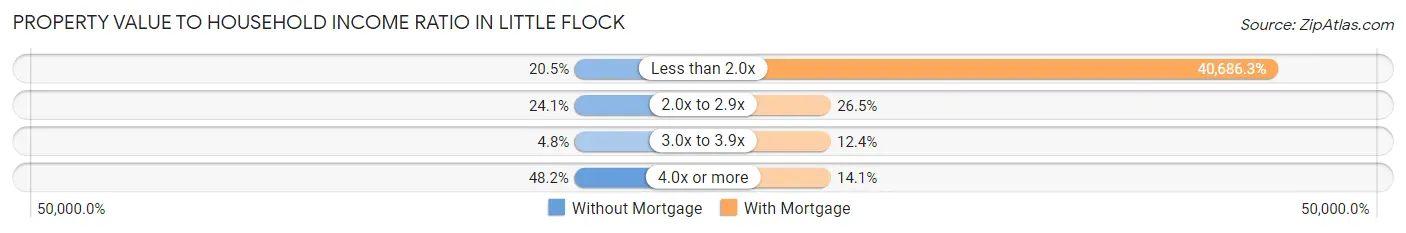
| Value-to-Income Ratio | Without Mortgage | With Mortgage |
| Less than 2.0x | 34 (20.5%) | 124,500 (40,686.3%) |
| 2.0x to 2.9x | 40 (24.1%) | 81 (26.5%) |
| 3.0x to 3.9x | 8 (4.8%) | 38 (12.4%) |
| 4.0x or more | 80 (48.2%) | 43 (14.1%) |
| Total | 166 (100.0%) | 306 (100.0%) |
Real Estate Taxes by Mortgage Status in Little Flock
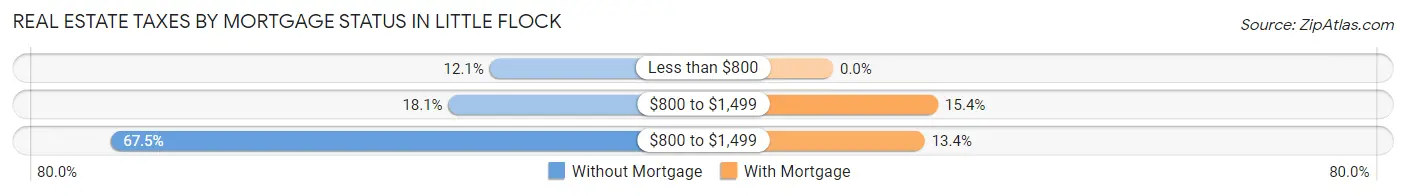
| Property Taxes | Without Mortgage | With Mortgage |
| Less than $800 | 20 (12.0%) | 0 (0.0%) |
| $800 to $1,499 | 30 (18.1%) | 47 (15.4%) |
| $800 to $1,499 | 112 (67.5%) | 41 (13.4%) |
| Total | 166 (100.0%) | 306 (100.0%) |
Health & Disability in Little Flock
Health Insurance Coverage by Age in Little Flock
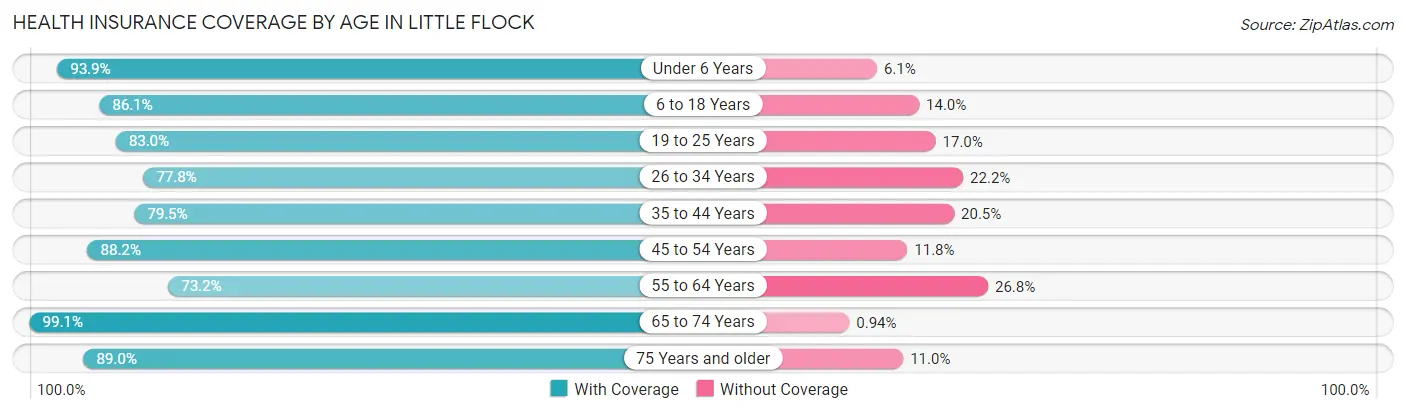
| Age Bracket | With Coverage | Without Coverage |
| Under 6 Years | 200 (93.9%) | 13 (6.1%) |
| 6 to 18 Years | 401 (86.1%) | 65 (14.0%) |
| 19 to 25 Years | 385 (83.0%) | 79 (17.0%) |
| 26 to 34 Years | 316 (77.8%) | 90 (22.2%) |
| 35 to 44 Years | 299 (79.5%) | 77 (20.5%) |
| 45 to 54 Years | 270 (88.2%) | 36 (11.8%) |
| 55 to 64 Years | 355 (73.2%) | 130 (26.8%) |
| 65 to 74 Years | 210 (99.1%) | 2 (0.9%) |
| 75 Years and older | 81 (89.0%) | 10 (11.0%) |
| Total | 2,517 (83.4%) | 502 (16.6%) |
Health Insurance Coverage by Citizenship Status in Little Flock
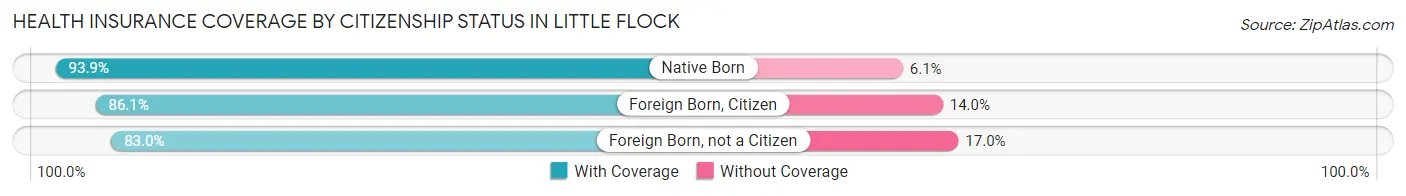
| Citizenship Status | With Coverage | Without Coverage |
| Native Born | 200 (93.9%) | 13 (6.1%) |
| Foreign Born, Citizen | 401 (86.1%) | 65 (14.0%) |
| Foreign Born, not a Citizen | 385 (83.0%) | 79 (17.0%) |
Health Insurance Coverage by Household Income in Little Flock
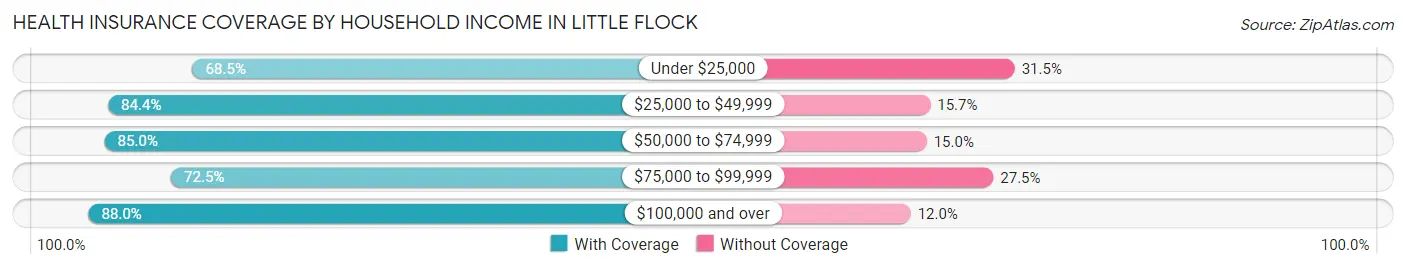
| Household Income | With Coverage | Without Coverage |
| Under $25,000 | 146 (68.5%) | 67 (31.5%) |
| $25,000 to $49,999 | 889 (84.4%) | 165 (15.7%) |
| $50,000 to $74,999 | 386 (85.0%) | 68 (15.0%) |
| $75,000 to $99,999 | 177 (72.5%) | 67 (27.5%) |
| $100,000 and over | 897 (88.0%) | 122 (12.0%) |
Public vs Private Health Insurance Coverage by Age in Little Flock
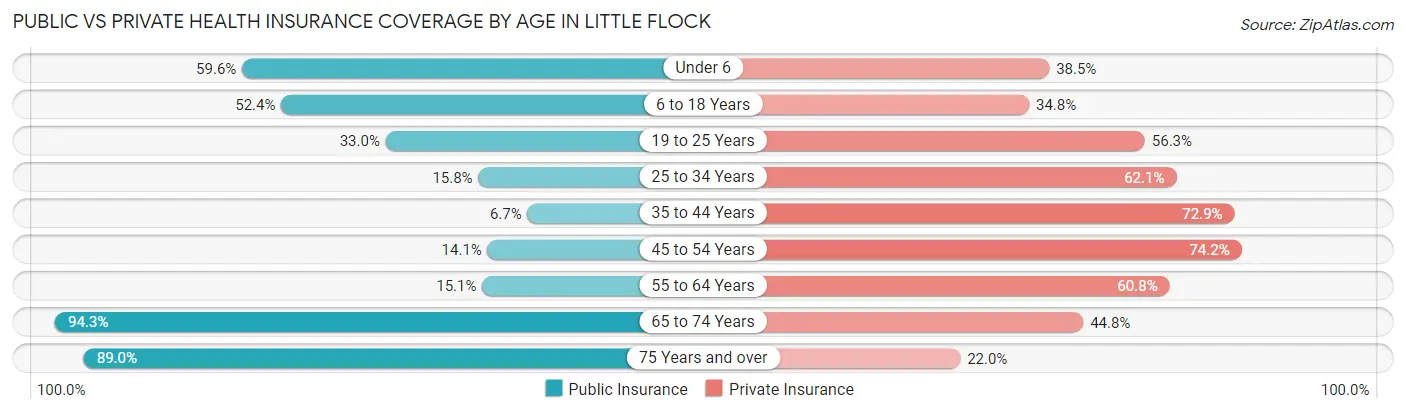
| Age Bracket | Public Insurance | Private Insurance |
| Under 6 | 127 (59.6%) | 82 (38.5%) |
| 6 to 18 Years | 244 (52.4%) | 162 (34.8%) |
| 19 to 25 Years | 153 (33.0%) | 261 (56.2%) |
| 25 to 34 Years | 64 (15.8%) | 252 (62.1%) |
| 35 to 44 Years | 25 (6.7%) | 274 (72.9%) |
| 45 to 54 Years | 43 (14.1%) | 227 (74.2%) |
| 55 to 64 Years | 73 (15.0%) | 295 (60.8%) |
| 65 to 74 Years | 200 (94.3%) | 95 (44.8%) |
| 75 Years and over | 81 (89.0%) | 20 (22.0%) |
| Total | 1,010 (33.5%) | 1,668 (55.2%) |
Disability Status by Sex by Age in Little Flock
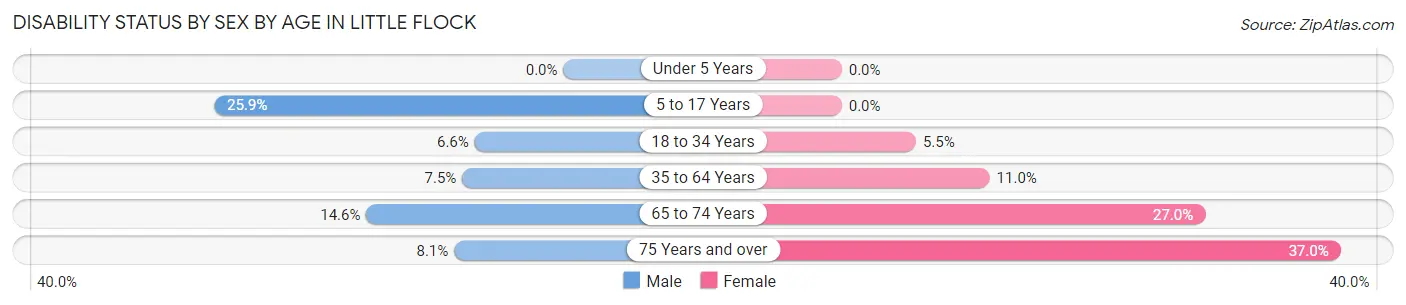
| Age Bracket | Male | Female |
| Under 5 Years | 0 (0.0%) | 0 (0.0%) |
| 5 to 17 Years | 63 (25.9%) | 0 (0.0%) |
| 18 to 34 Years | 28 (6.6%) | 29 (5.5%) |
| 35 to 64 Years | 48 (7.5%) | 58 (11.0%) |
| 65 to 74 Years | 18 (14.6%) | 24 (27.0%) |
| 75 Years and over | 3 (8.1%) | 20 (37.0%) |
Disability Class by Sex by Age in Little Flock
Disability Class: Hearing Difficulty
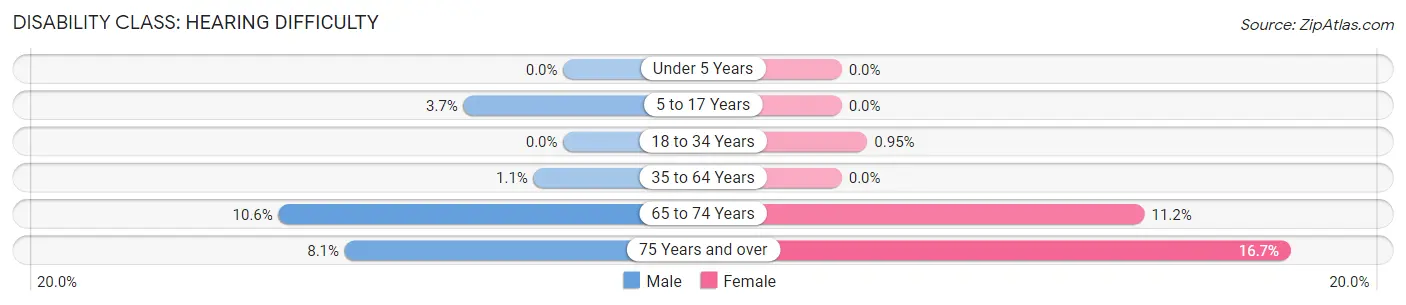
| Age Bracket | Male | Female |
| Under 5 Years | 0 (0.0%) | 0 (0.0%) |
| 5 to 17 Years | 9 (3.7%) | 0 (0.0%) |
| 18 to 34 Years | 0 (0.0%) | 5 (0.9%) |
| 35 to 64 Years | 7 (1.1%) | 0 (0.0%) |
| 65 to 74 Years | 13 (10.6%) | 10 (11.2%) |
| 75 Years and over | 3 (8.1%) | 9 (16.7%) |
Disability Class: Vision Difficulty
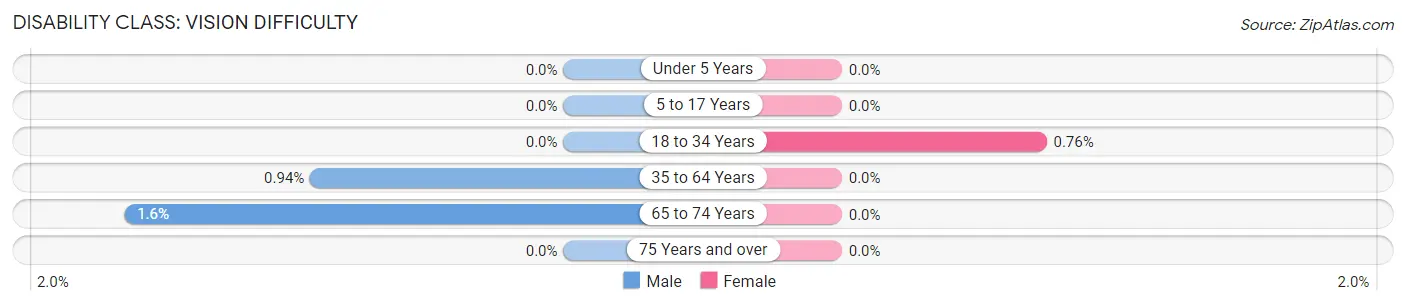
| Age Bracket | Male | Female |
| Under 5 Years | 0 (0.0%) | 0 (0.0%) |
| 5 to 17 Years | 0 (0.0%) | 0 (0.0%) |
| 18 to 34 Years | 0 (0.0%) | 4 (0.8%) |
| 35 to 64 Years | 6 (0.9%) | 0 (0.0%) |
| 65 to 74 Years | 2 (1.6%) | 0 (0.0%) |
| 75 Years and over | 0 (0.0%) | 0 (0.0%) |
Disability Class: Cognitive Difficulty
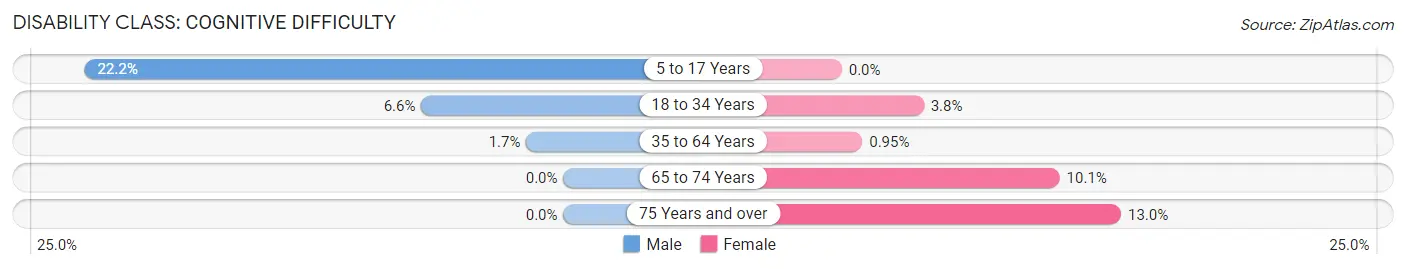
| Age Bracket | Male | Female |
| 5 to 17 Years | 54 (22.2%) | 0 (0.0%) |
| 18 to 34 Years | 28 (6.6%) | 20 (3.8%) |
| 35 to 64 Years | 11 (1.7%) | 5 (0.9%) |
| 65 to 74 Years | 0 (0.0%) | 9 (10.1%) |
| 75 Years and over | 0 (0.0%) | 7 (13.0%) |
Disability Class: Ambulatory Difficulty
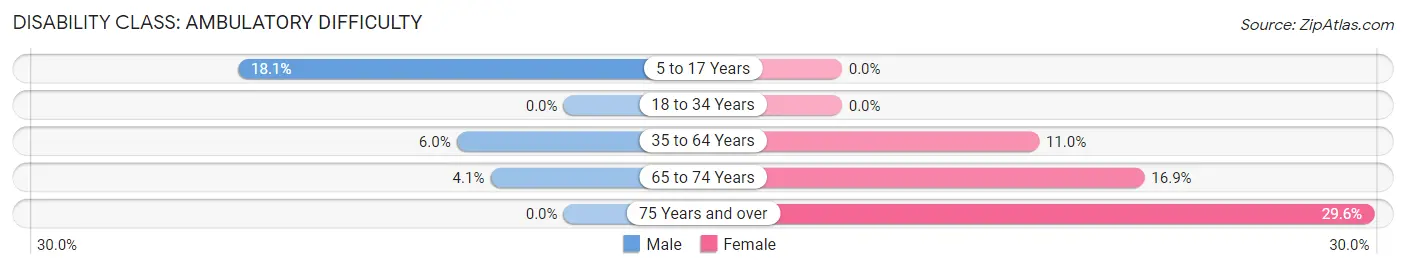
| Age Bracket | Male | Female |
| 5 to 17 Years | 44 (18.1%) | 0 (0.0%) |
| 18 to 34 Years | 0 (0.0%) | 0 (0.0%) |
| 35 to 64 Years | 38 (5.9%) | 58 (11.0%) |
| 65 to 74 Years | 5 (4.1%) | 15 (16.9%) |
| 75 Years and over | 0 (0.0%) | 16 (29.6%) |
Disability Class: Self-Care Difficulty
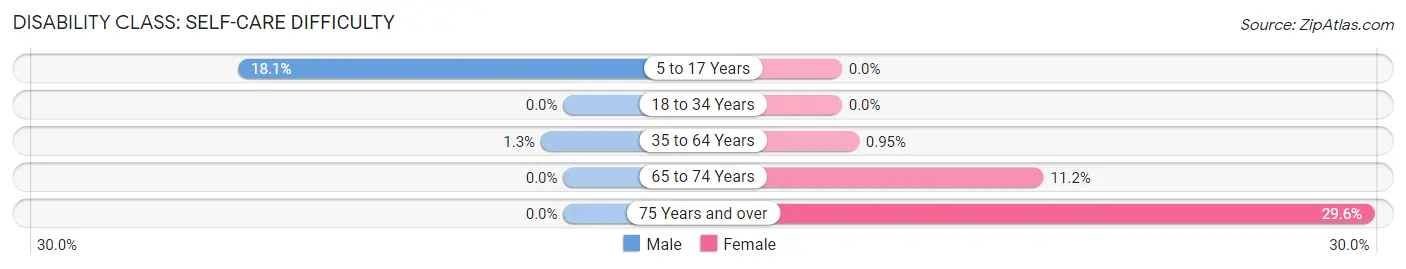
| Age Bracket | Male | Female |
| 5 to 17 Years | 44 (18.1%) | 0 (0.0%) |
| 18 to 34 Years | 0 (0.0%) | 0 (0.0%) |
| 35 to 64 Years | 8 (1.3%) | 5 (0.9%) |
| 65 to 74 Years | 0 (0.0%) | 10 (11.2%) |
| 75 Years and over | 0 (0.0%) | 16 (29.6%) |
Technology Access in Little Flock
Computing Device Access in Little Flock
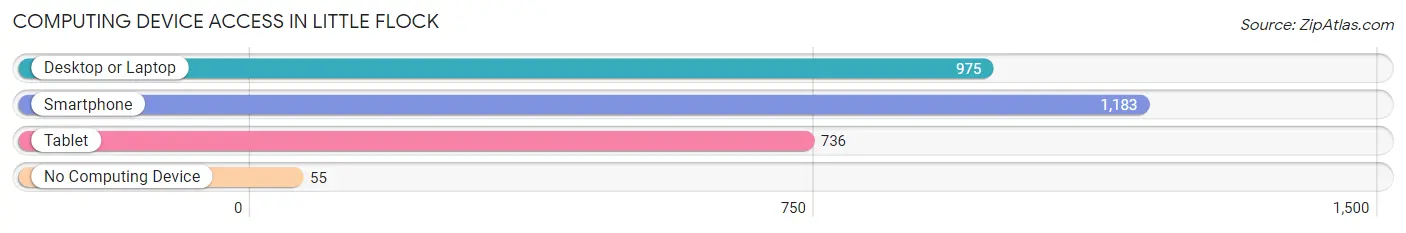
| Device Type | # Households | % Households |
| Desktop or Laptop | 975 | 75.5% |
| Smartphone | 1,183 | 91.6% |
| Tablet | 736 | 57.0% |
| No Computing Device | 55 | 4.3% |
| Total | 1,291 | 100.0% |
Internet Access in Little Flock
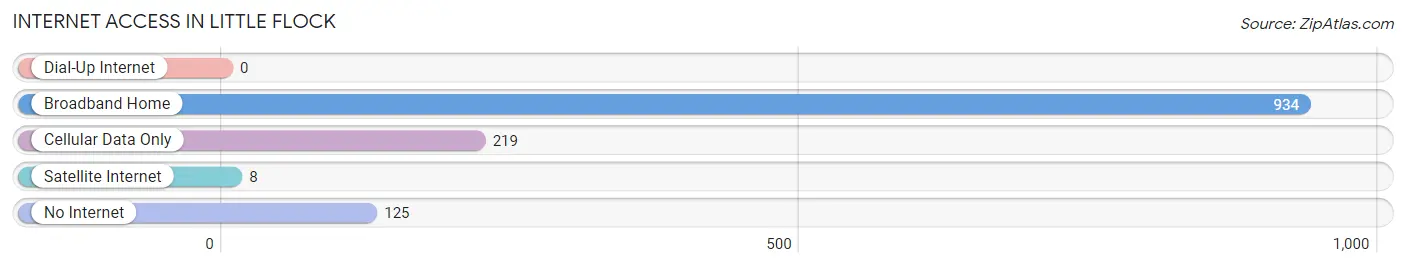
| Internet Type | # Households | % Households |
| Dial-Up Internet | 0 | 0.0% |
| Broadband Home | 934 | 72.4% |
| Cellular Data Only | 219 | 17.0% |
| Satellite Internet | 8 | 0.6% |
| No Internet | 125 | 9.7% |
| Total | 1,291 | 100.0% |
Little Flock Summary
Little Flock is a small city located in Benton County, Arkansas. It is situated in the northwest corner of the state, just south of the Arkansas-Missouri border. The city is part of the Fayetteville-Springdale-Rogers Metropolitan Statistical Area and has a population of approximately 4,000 people.
History
Little Flock was founded in 1871 by a group of settlers from the nearby town of Springdale. The town was originally known as “Little Flock” due to the large number of sheep that were kept in the area. The town was officially incorporated in 1887 and was named after the nearby Little Flock Baptist Church.
In the early 1900s, Little Flock experienced a period of growth and development. The town was home to several businesses, including a cotton gin, a grist mill, and a sawmill. The town also had a post office, a bank, and a hotel.
In the 1950s, Little Flock began to experience a decline in population as many of its residents moved away in search of better economic opportunities. The town’s population dropped from a peak of around 1,500 in 1950 to just over 1,000 in 2000.
Geography
Little Flock is located in the northwest corner of Arkansas, just south of the Arkansas-Missouri border. The city is situated in the Ozark Mountains and is surrounded by rolling hills and forests. The city is located approximately 25 miles north of Fayetteville and 40 miles south of Springfield, Missouri.
The climate in Little Flock is humid subtropical, with hot summers and mild winters. The average annual temperature is around 63 degrees Fahrenheit, with an average high of around 87 degrees in the summer and an average low of around 40 degrees in the winter.
Economy
Little Flock’s economy is largely based on agriculture and manufacturing. The city is home to several large poultry processing plants, as well as a number of smaller businesses. The city also has a thriving tourism industry, with many visitors coming to the area to enjoy the natural beauty of the Ozark Mountains.
Demographics
As of the 2010 census, Little Flock had a population of 4,000 people. The racial makeup of the city was 94.3% White, 1.2% African American, 0.7% Native American, 0.4% Asian, and 3.4% from other races. The median household income was $37,500, and the median family income was $45,000.
Little Flock is a small city with a rich history and a diverse population. The city is home to a variety of businesses and industries, and its economy is largely based on agriculture and manufacturing. The city is also a popular tourist destination, with many visitors coming to the area to enjoy the natural beauty of the Ozark Mountains.
Common Questions
What is Per Capita Income in Little Flock?
Per Capita income in Little Flock is $37,423.
What is the Median Family Income in Little Flock?
Median Family Income in Little Flock is $79,265.
What is the Median Household income in Little Flock?
Median Household Income in Little Flock is $55,035.
What is Income or Wage Gap in Little Flock?
Income or Wage Gap in Little Flock is 15.8%.
Women in Little Flock earn 84.2 cents for every dollar earned by a man.
What is Inequality or Gini Index in Little Flock?
Inequality or Gini Index in Little Flock is 0.46.
What is the Total Population of Little Flock?
Total Population of Little Flock is 3,019.
What is the Total Male Population of Little Flock?
Total Male Population of Little Flock is 1,553.
What is the Total Female Population of Little Flock?
Total Female Population of Little Flock is 1,466.
What is the Ratio of Males per 100 Females in Little Flock?
There are 105.93 Males per 100 Females in Little Flock.
What is the Ratio of Females per 100 Males in Little Flock?
There are 94.40 Females per 100 Males in Little Flock.
What is the Median Population Age in Little Flock?
Median Population Age in Little Flock is 32.4 Years.
What is the Average Family Size in Little Flock
Average Family Size in Little Flock is 3.0 People.
What is the Average Household Size in Little Flock
Average Household Size in Little Flock is 2.3 People.
How Large is the Labor Force in Little Flock?
There are 1,832 People in the Labor Forcein in Little Flock.
What is the Percentage of People in the Labor Force in Little Flock?
73.2% of People are in the Labor Force in Little Flock.
What is the Unemployment Rate in Little Flock?
Unemployment Rate in Little Flock is 8.6%.