East Camden, AR Map & Demographics
East Camden Map
East Camden Overview
$19,341
PER CAPITA INCOME
$43,125
AVG FAMILY INCOME
$41,667
AVG HOUSEHOLD INCOME
19.9%
WAGE / INCOME GAP [ % ]
80.1¢/ $1
WAGE / INCOME GAP [ $ ]
0.37
INEQUALITY / GINI INDEX
1,174
TOTAL POPULATION
488
MALE POPULATION
686
FEMALE POPULATION
71.14
MALES / 100 FEMALES
140.57
FEMALES / 100 MALES
25.6
MEDIAN AGE
3.2
AVG FAMILY SIZE
2.9
AVG HOUSEHOLD SIZE
533
LABOR FORCE [ PEOPLE ]
63.9%
PERCENT IN LABOR FORCE
6.8%
UNEMPLOYMENT RATE
East Camden Area Codes
Income in East Camden
Income Overview in East Camden
Per Capita Income in East Camden is $19,341, while median incomes of families and households are $43,125 and $41,667 respectively.
| Characteristic | Number | Measure |
| Per Capita Income | 1,174 | $19,341 |
| Median Family Income | 329 | $43,125 |
| Mean Family Income | 329 | $54,452 |
| Median Household Income | 406 | $41,667 |
| Mean Household Income | 406 | $54,361 |
| Income Deficit | 329 | $0 |
| Wage / Income Gap (%) | 1,174 | 19.94% |
| Wage / Income Gap ($) | 1,174 | 80.06¢ per $1 |
| Gini / Inequality Index | 1,174 | 0.37 |
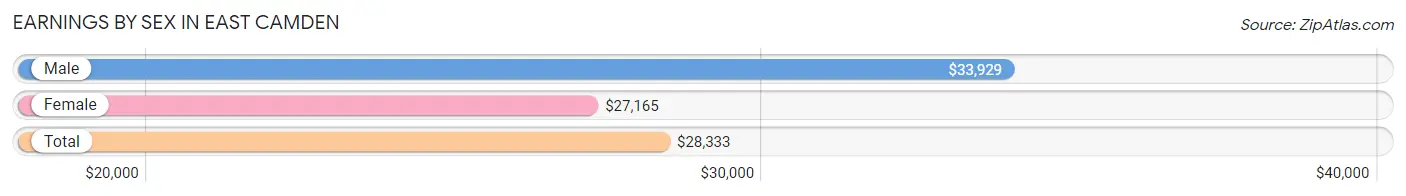
Earnings by Sex in East Camden
Average Earnings in East Camden are $28,333, $33,929 for men and $27,165 for women, a difference of 19.9%.
| Sex | Number | Average Earnings |
| Male | 228 (43.0%) | $33,929 |
| Female | 302 (57.0%) | $27,165 |
| Total | 530 (100.0%) | $28,333 |
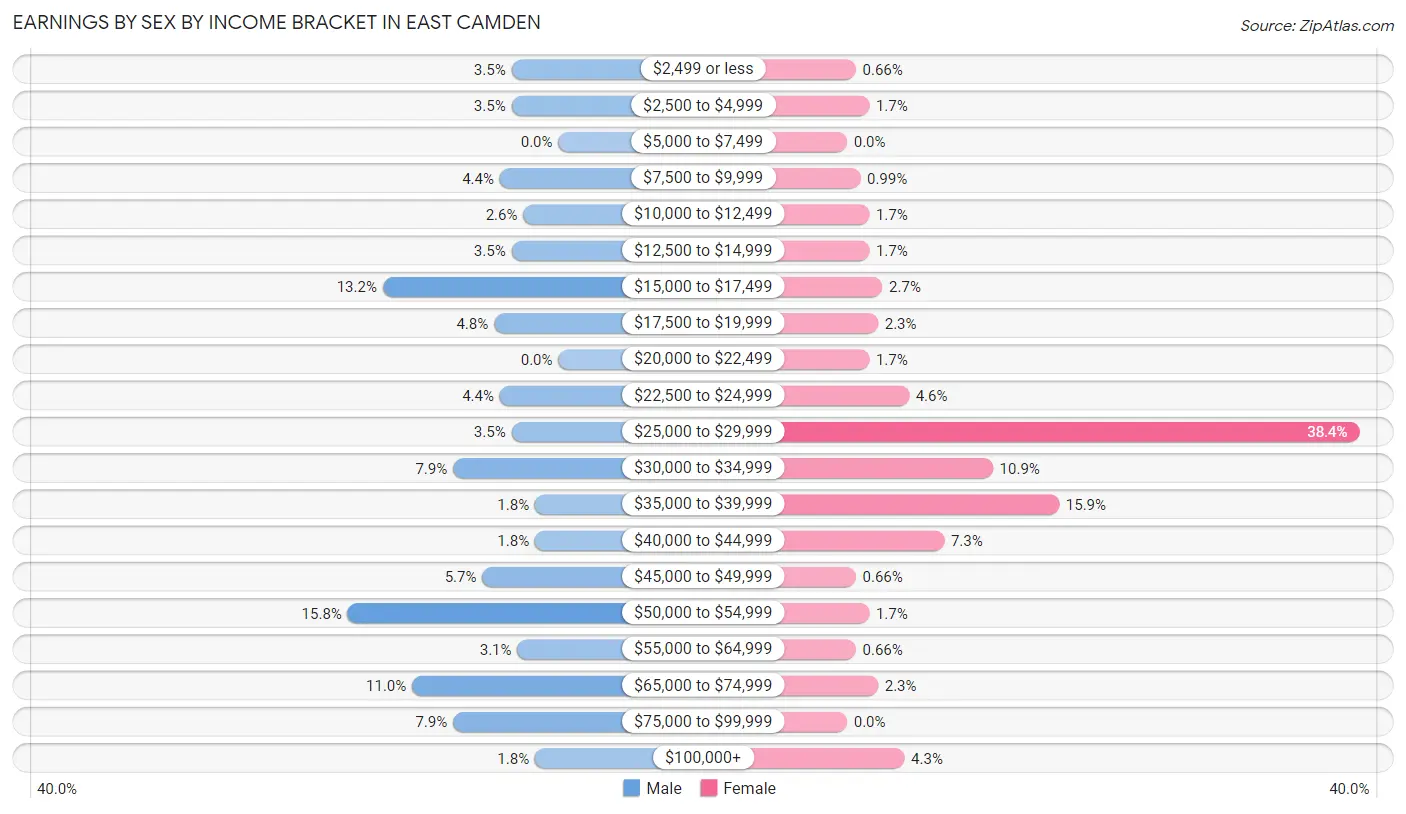
Earnings by Sex by Income Bracket in East Camden
The most common earnings brackets in East Camden are $50,000 to $54,999 for men (36 | 15.8%) and $25,000 to $29,999 for women (116 | 38.4%).
| Income | Male | Female |
| $2,499 or less | 8 (3.5%) | 2 (0.7%) |
| $2,500 to $4,999 | 8 (3.5%) | 5 (1.7%) |
| $5,000 to $7,499 | 0 (0.0%) | 0 (0.0%) |
| $7,500 to $9,999 | 10 (4.4%) | 3 (1.0%) |
| $10,000 to $12,499 | 6 (2.6%) | 5 (1.7%) |
| $12,500 to $14,999 | 8 (3.5%) | 5 (1.7%) |
| $15,000 to $17,499 | 30 (13.2%) | 8 (2.6%) |
| $17,500 to $19,999 | 11 (4.8%) | 7 (2.3%) |
| $20,000 to $22,499 | 0 (0.0%) | 5 (1.7%) |
| $22,500 to $24,999 | 10 (4.4%) | 14 (4.6%) |
| $25,000 to $29,999 | 8 (3.5%) | 116 (38.4%) |
| $30,000 to $34,999 | 18 (7.9%) | 33 (10.9%) |
| $35,000 to $39,999 | 4 (1.8%) | 48 (15.9%) |
| $40,000 to $44,999 | 4 (1.8%) | 22 (7.3%) |
| $45,000 to $49,999 | 13 (5.7%) | 2 (0.7%) |
| $50,000 to $54,999 | 36 (15.8%) | 5 (1.7%) |
| $55,000 to $64,999 | 7 (3.1%) | 2 (0.7%) |
| $65,000 to $74,999 | 25 (11.0%) | 7 (2.3%) |
| $75,000 to $99,999 | 18 (7.9%) | 0 (0.0%) |
| $100,000+ | 4 (1.8%) | 13 (4.3%) |
| Total | 228 (100.0%) | 302 (100.0%) |
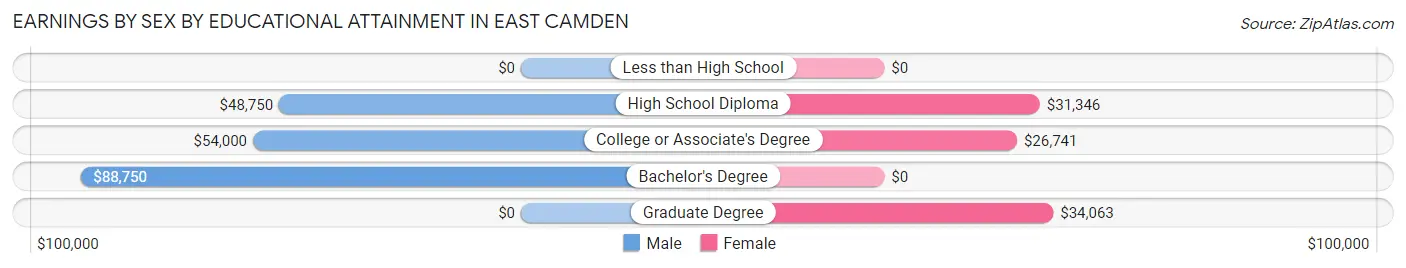
Earnings by Sex by Educational Attainment in East Camden
Average earnings in East Camden are $53,148 for men and $27,095 for women, a difference of 49.0%. Men with an educational attainment of bachelor's degree enjoy the highest average annual earnings of $88,750, while those with high school diploma education earn the least with $48,750. Women with an educational attainment of graduate degree earn the most with the average annual earnings of $34,063, while those with college or associate's degree education have the smallest earnings of $26,741.
| Educational Attainment | Male Income | Female Income |
| Less than High School | - | - |
| High School Diploma | $48,750 | $31,346 |
| College or Associate's Degree | $54,000 | $26,741 |
| Bachelor's Degree | $88,750 | $0 |
| Graduate Degree | - | - |
| Total | $53,148 | $27,095 |
Family Income in East Camden
Family Income Brackets in East Camden
According to the East Camden family income data, there are 106 families falling into the $25,000 to $34,999 income range, which is the most common income bracket and makes up 32.2% of all families. Conversely, the $200,000+ income bracket is the least frequent group with only 2 families (0.6%) belonging to this category.
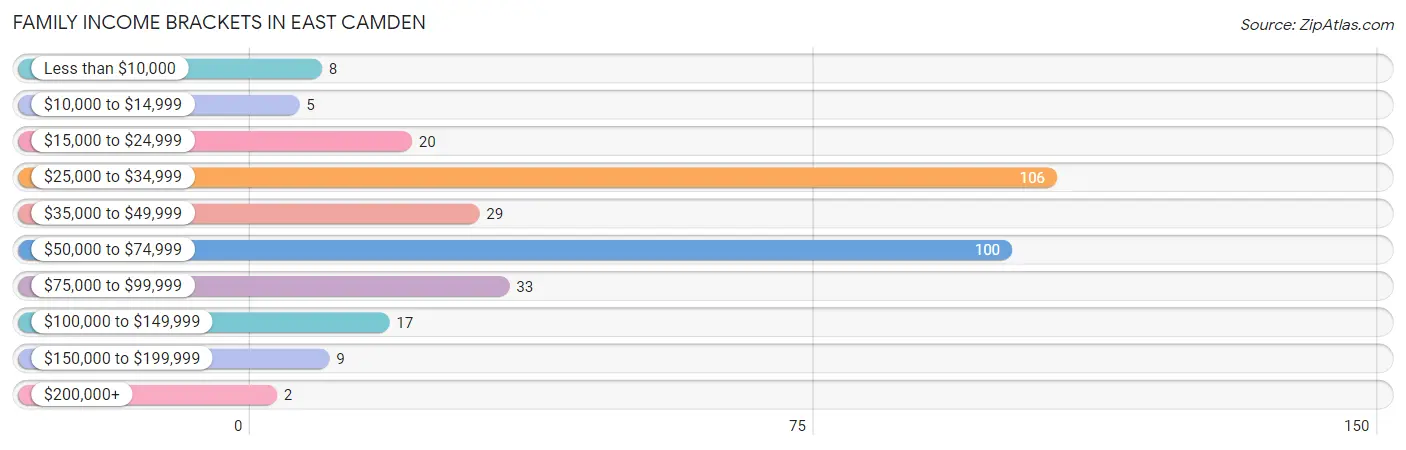
| Income Bracket | # Families | % Families |
| Less than $10,000 | 8 | 2.4% |
| $10,000 to $14,999 | 5 | 1.5% |
| $15,000 to $24,999 | 20 | 6.1% |
| $25,000 to $34,999 | 106 | 32.2% |
| $35,000 to $49,999 | 29 | 8.8% |
| $50,000 to $74,999 | 100 | 30.4% |
| $75,000 to $99,999 | 33 | 10.0% |
| $100,000 to $149,999 | 17 | 5.2% |
| $150,000 to $199,999 | 9 | 2.7% |
| $200,000+ | 2 | 0.6% |
Family Income by Famaliy Size in East Camden
5-person families (23 | 7.0%) account for the highest median family income in East Camden with $88,125 per family, while 2-person families (95 | 28.9%) have the highest median income of $19,961 per family member.
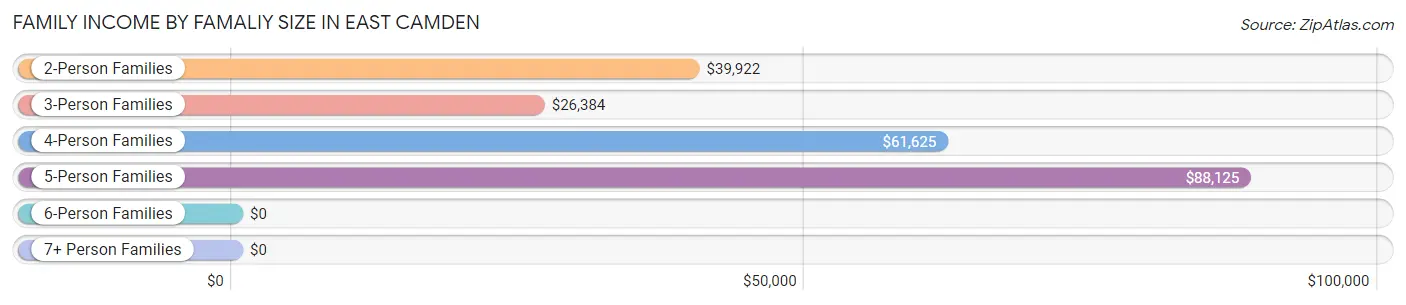
| Income Bracket | # Families | Median Income |
| 2-Person Families | 95 (28.9%) | $39,922 |
| 3-Person Families | 119 (36.2%) | $26,384 |
| 4-Person Families | 67 (20.4%) | $61,625 |
| 5-Person Families | 23 (7.0%) | $88,125 |
| 6-Person Families | 25 (7.6%) | $0 |
| 7+ Person Families | 0 (0.0%) | $0 |
| Total | 329 (100.0%) | $43,125 |
Family Income by Number of Earners in East Camden
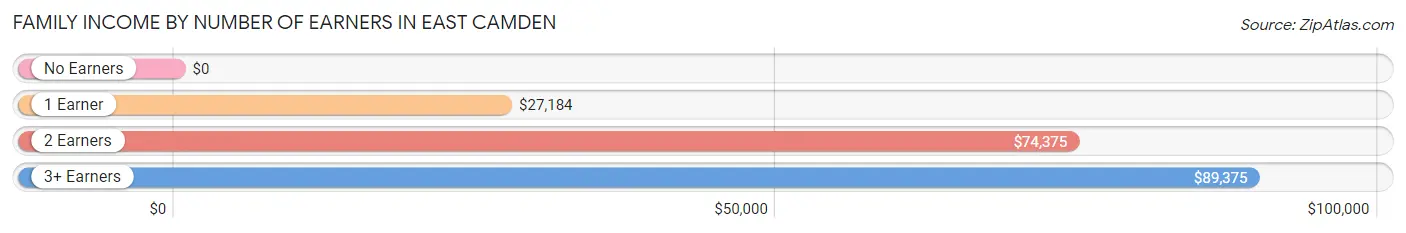
| Number of Earners | # Families | Median Income |
| No Earners | 24 (7.3%) | $0 |
| 1 Earner | 206 (62.6%) | $27,184 |
| 2 Earners | 84 (25.5%) | $74,375 |
| 3+ Earners | 15 (4.6%) | $89,375 |
| Total | 329 (100.0%) | $43,125 |
Household Income in East Camden
Household Income Brackets in East Camden
With 127 households falling in the category, the $25,000 to $34,999 income range is the most frequent in East Camden, accounting for 31.3% of all households. In contrast, only 4 households (1.0%) fall into the $200,000+ income bracket, making it the least populous group.
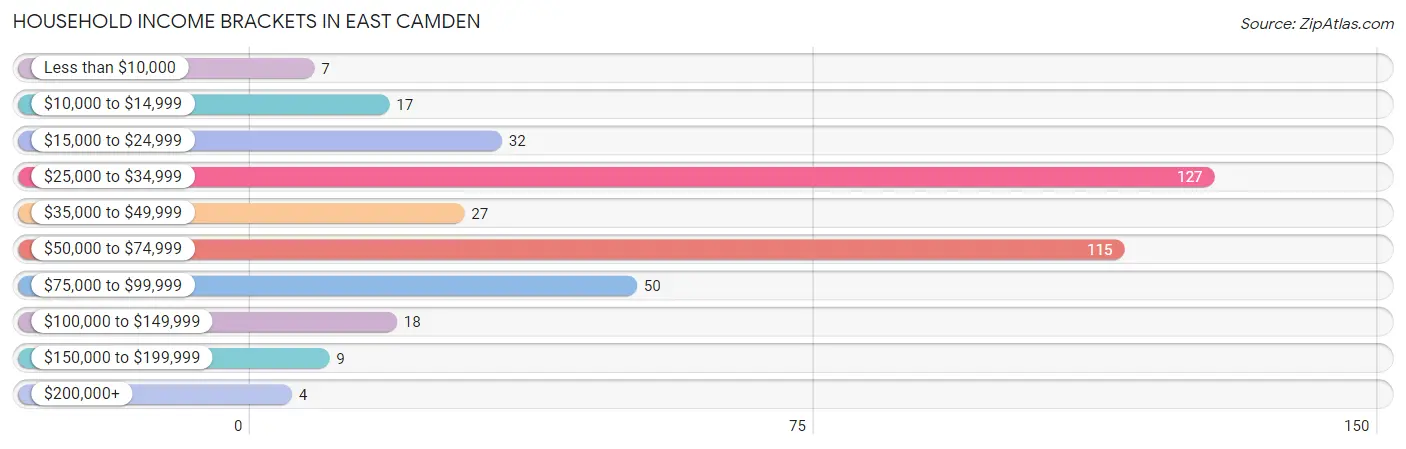
| Income Bracket | # Households | % Households |
| Less than $10,000 | 7 | 1.7% |
| $10,000 to $14,999 | 17 | 4.2% |
| $15,000 to $24,999 | 32 | 7.9% |
| $25,000 to $34,999 | 127 | 31.3% |
| $35,000 to $49,999 | 27 | 6.7% |
| $50,000 to $74,999 | 115 | 28.3% |
| $75,000 to $99,999 | 50 | 12.3% |
| $100,000 to $149,999 | 18 | 4.4% |
| $150,000 to $199,999 | 9 | 2.2% |
| $200,000+ | 4 | 1.0% |
Household Income by Householder Age in East Camden
The median household income in East Camden is $41,667, with the highest median household income of $60,441 found in the 45 to 64 years age bracket for the primary householder. A total of 118 households (29.1%) fall into this category. Meanwhile, the 25 to 44 years age bracket for the primary householder has the lowest median household income of $0, with 240 households (59.1%) in this group.
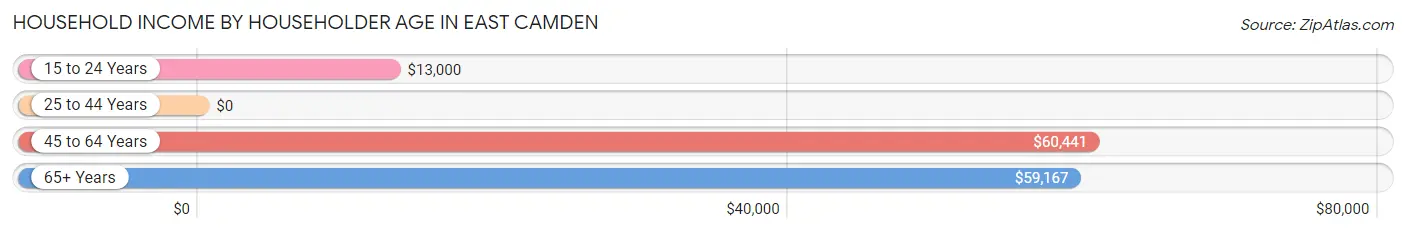
| Income Bracket | # Households | Median Income |
| 15 to 24 Years | 12 (3.0%) | $13,000 |
| 25 to 44 Years | 240 (59.1%) | $0 |
| 45 to 64 Years | 118 (29.1%) | $60,441 |
| 65+ Years | 36 (8.9%) | $59,167 |
| Total | 406 (100.0%) | $41,667 |
Poverty in East Camden
Income Below Poverty by Sex and Age in East Camden
With 6.0% poverty level for males and 12.3% for females among the residents of East Camden, 55 to 64 year old males and 15 year old females are the most vulnerable to poverty, with 10 males (38.5%) and 11 females (50.0%) in their respective age groups living below the poverty level.
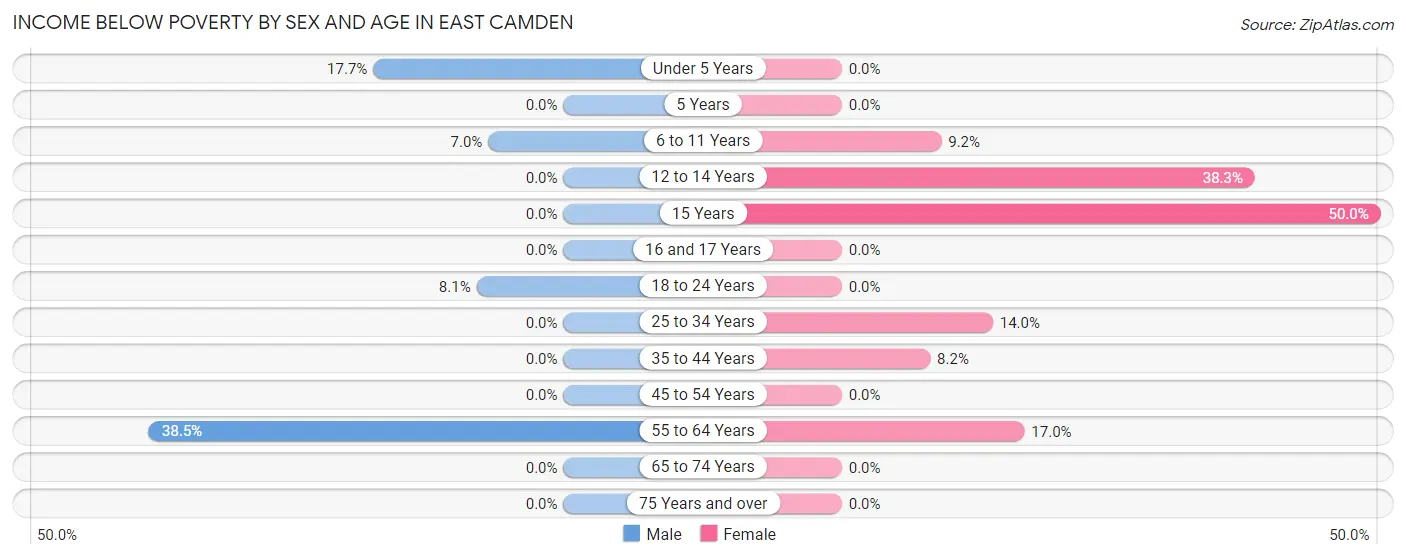
| Age Bracket | Male | Female |
| Under 5 Years | 6 (17.6%) | 0 (0.0%) |
| 5 Years | 0 (0.0%) | 0 (0.0%) |
| 6 to 11 Years | 3 (7.0%) | 12 (9.2%) |
| 12 to 14 Years | 0 (0.0%) | 23 (38.3%) |
| 15 Years | 0 (0.0%) | 11 (50.0%) |
| 16 and 17 Years | 0 (0.0%) | 0 (0.0%) |
| 18 to 24 Years | 10 (8.1%) | 0 (0.0%) |
| 25 to 34 Years | 0 (0.0%) | 22 (14.0%) |
| 35 to 44 Years | 0 (0.0%) | 5 (8.2%) |
| 45 to 54 Years | 0 (0.0%) | 0 (0.0%) |
| 55 to 64 Years | 10 (38.5%) | 10 (17.0%) |
| 65 to 74 Years | 0 (0.0%) | 0 (0.0%) |
| 75 Years and over | 0 (0.0%) | 0 (0.0%) |
| Total | 29 (6.0%) | 83 (12.3%) |
Income Above Poverty by Sex and Age in East Camden
According to the poverty statistics in East Camden, males aged 5 years and females aged under 5 years are the age groups that are most secure financially, with 100.0% of males and 100.0% of females in these age groups living above the poverty line.
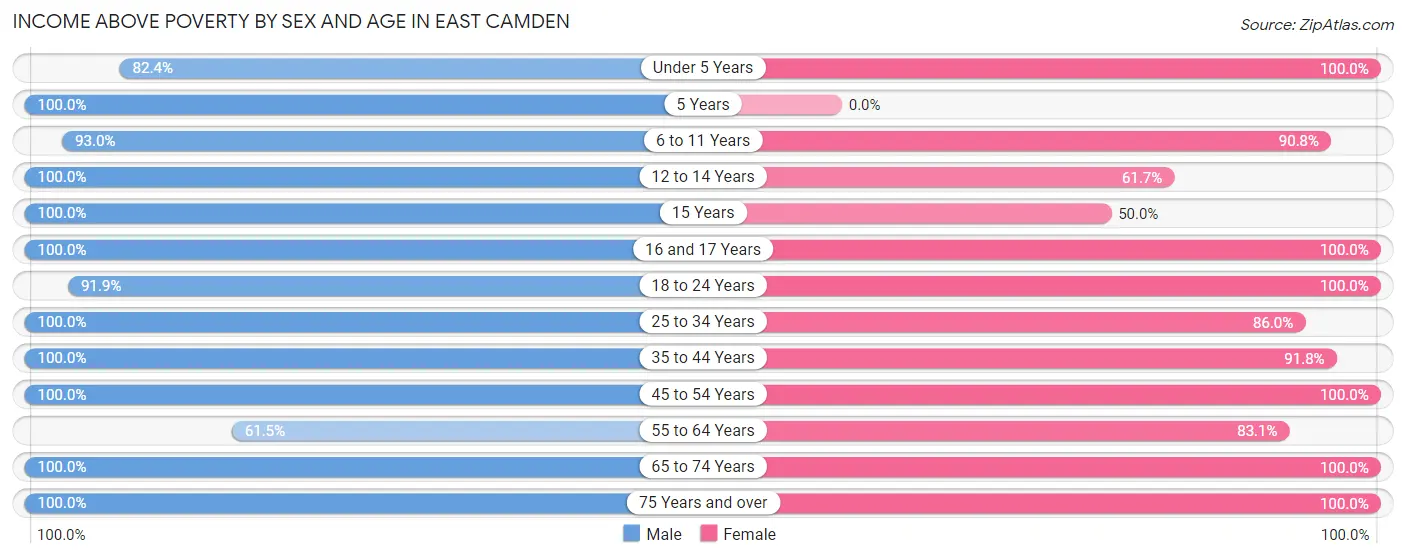
| Age Bracket | Male | Female |
| Under 5 Years | 28 (82.4%) | 20 (100.0%) |
| 5 Years | 22 (100.0%) | 0 (0.0%) |
| 6 to 11 Years | 40 (93.0%) | 118 (90.8%) |
| 12 to 14 Years | 6 (100.0%) | 37 (61.7%) |
| 15 Years | 3 (100.0%) | 11 (50.0%) |
| 16 and 17 Years | 31 (100.0%) | 23 (100.0%) |
| 18 to 24 Years | 114 (91.9%) | 41 (100.0%) |
| 25 to 34 Years | 64 (100.0%) | 135 (86.0%) |
| 35 to 44 Years | 22 (100.0%) | 56 (91.8%) |
| 45 to 54 Years | 62 (100.0%) | 50 (100.0%) |
| 55 to 64 Years | 16 (61.5%) | 49 (83.1%) |
| 65 to 74 Years | 37 (100.0%) | 39 (100.0%) |
| 75 Years and over | 6 (100.0%) | 15 (100.0%) |
| Total | 451 (94.0%) | 594 (87.7%) |
Income Below Poverty Among Married-Couple Families in East Camden
The poverty statistics for married-couple families in East Camden show that 2.9% or 4 of the total 139 families live below the poverty line. Families with no children have the highest poverty rate of 6.6%, comprising of 4 families. On the other hand, families with 1 or 2 children have the lowest poverty rate of 0.0%, which includes 0 families.
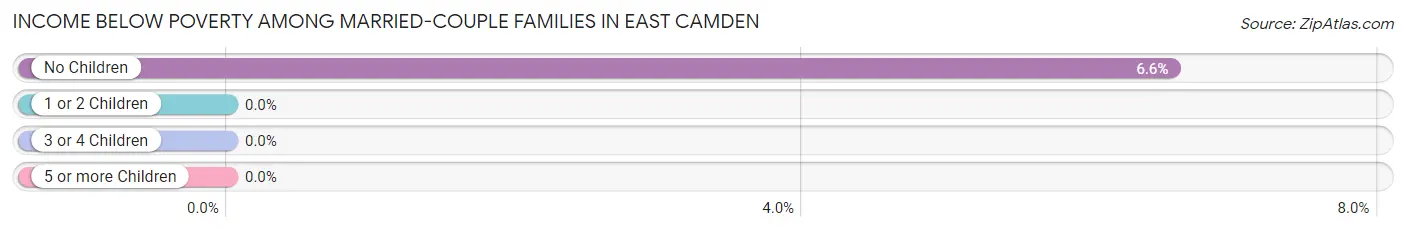
| Children | Above Poverty | Below Poverty |
| No Children | 57 (93.4%) | 4 (6.6%) |
| 1 or 2 Children | 46 (100.0%) | 0 (0.0%) |
| 3 or 4 Children | 32 (100.0%) | 0 (0.0%) |
| 5 or more Children | 0 (0.0%) | 0 (0.0%) |
| Total | 135 (97.1%) | 4 (2.9%) |
Income Below Poverty Among Single-Parent Households in East Camden
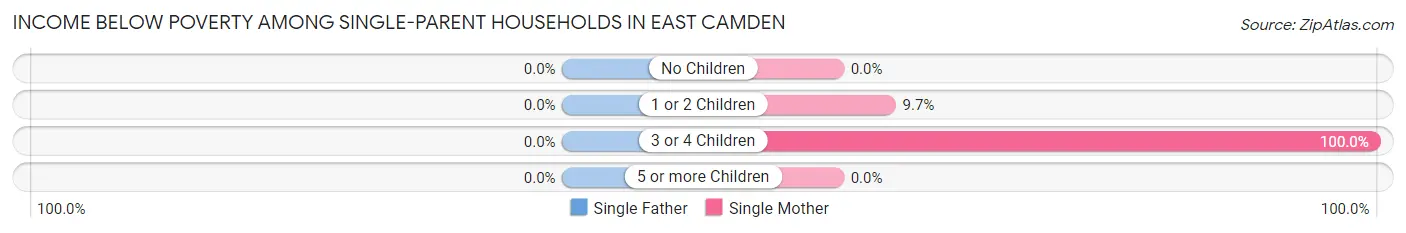
| Children | Single Father | Single Mother |
| No Children | 0 (0.0%) | 0 (0.0%) |
| 1 or 2 Children | 0 (0.0%) | 12 (9.7%) |
| 3 or 4 Children | 0 (0.0%) | 12 (100.0%) |
| 5 or more Children | 0 (0.0%) | 0 (0.0%) |
| Total | 0 (0.0%) | 24 (14.6%) |
Income Below Poverty Among Married-Couple vs Single-Parent Households in East Camden
The poverty data for East Camden shows that 4 of the married-couple family households (2.9%) and 24 of the single-parent households (12.6%) are living below the poverty level. Within the married-couple family households, those with no children have the highest poverty rate, with 4 households (6.6%) falling below the poverty line. Among the single-parent households, those with 3 or 4 children have the highest poverty rate, with 12 household (36.4%) living below poverty.
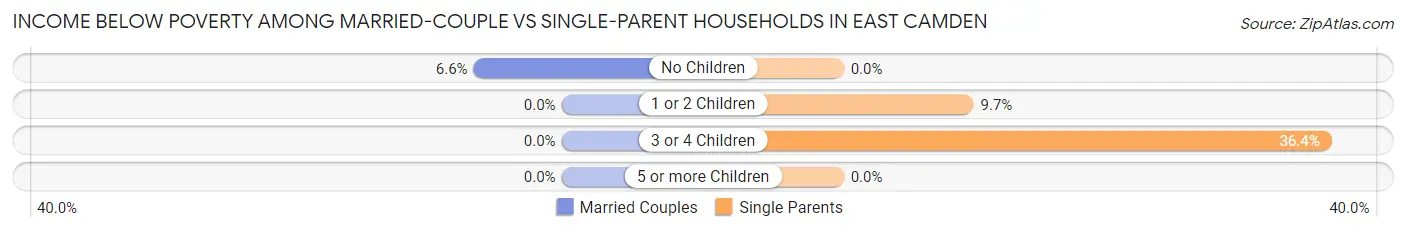
| Children | Married-Couple Families | Single-Parent Households |
| No Children | 4 (6.6%) | 0 (0.0%) |
| 1 or 2 Children | 0 (0.0%) | 12 (9.7%) |
| 3 or 4 Children | 0 (0.0%) | 12 (36.4%) |
| 5 or more Children | 0 (0.0%) | 0 (0.0%) |
| Total | 4 (2.9%) | 24 (12.6%) |
Race in East Camden
The most populous races in East Camden are White / Caucasian (723 | 61.6%), Black / African American (367 | 31.3%), and Hispanic or Latino (113 | 9.6%).
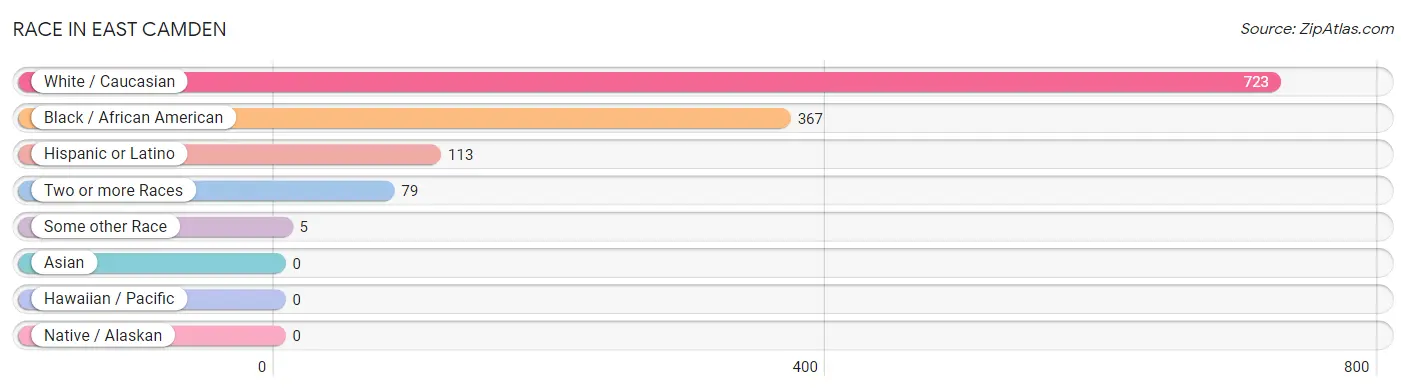
| Race | # Population | % Population |
| Asian | 0 | 0.0% |
| Black / African American | 367 | 31.3% |
| Hawaiian / Pacific | 0 | 0.0% |
| Hispanic or Latino | 113 | 9.6% |
| Native / Alaskan | 0 | 0.0% |
| White / Caucasian | 723 | 61.6% |
| Two or more Races | 79 | 6.7% |
| Some other Race | 5 | 0.4% |
| Total | 1,174 | 100.0% |
Ancestry in East Camden
The most populous ancestries reported in East Camden are Irish (128 | 10.9%), Mexican (88 | 7.5%), American (56 | 4.8%), English (54 | 4.6%), and French (42 | 3.6%), together accounting for 31.4% of all East Camden residents.
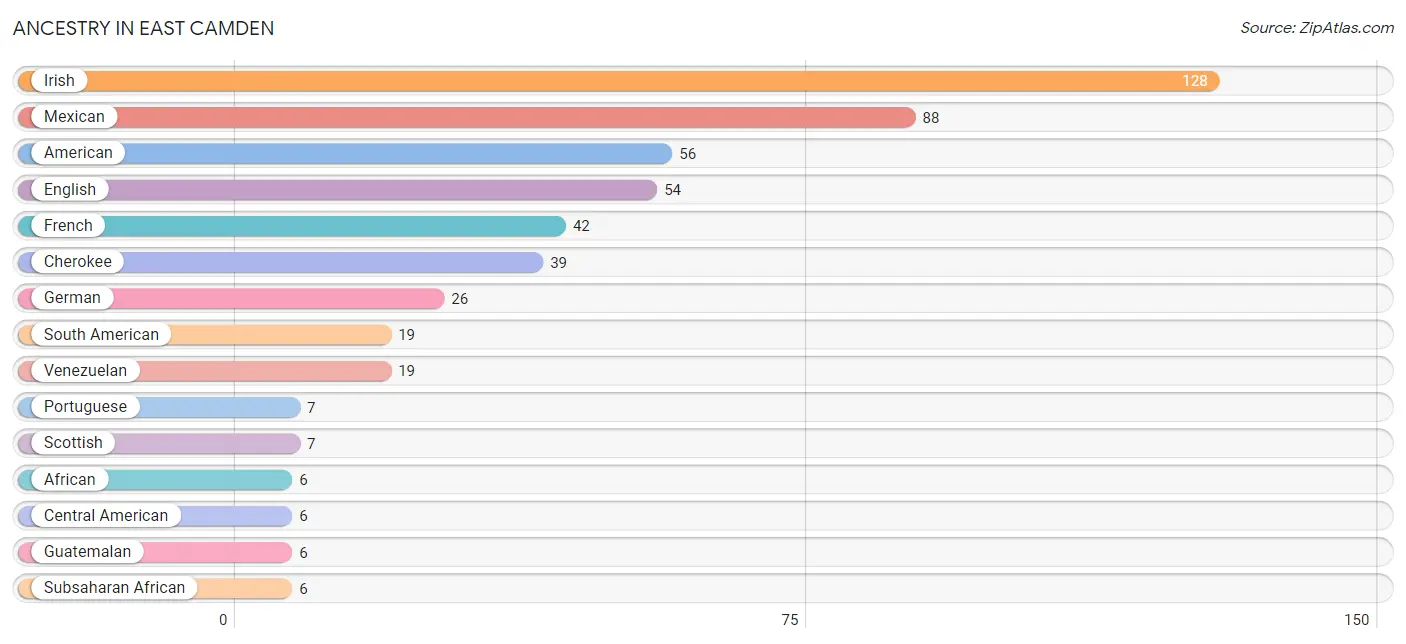
| Ancestry | # Population | % Population |
| African | 6 | 0.5% |
| American | 56 | 4.8% |
| Austrian | 1 | 0.1% |
| Central American | 6 | 0.5% |
| Cherokee | 39 | 3.3% |
| Danish | 2 | 0.2% |
| Dutch | 2 | 0.2% |
| English | 54 | 4.6% |
| European | 2 | 0.2% |
| French | 42 | 3.6% |
| German | 26 | 2.2% |
| Guatemalan | 6 | 0.5% |
| Irish | 128 | 10.9% |
| Italian | 2 | 0.2% |
| Mexican | 88 | 7.5% |
| Polish | 3 | 0.3% |
| Portuguese | 7 | 0.6% |
| Scotch-Irish | 2 | 0.2% |
| Scottish | 7 | 0.6% |
| South American | 19 | 1.6% |
| Subsaharan African | 6 | 0.5% |
| Venezuelan | 19 | 1.6% | View All 22 Rows |
Immigrants in East Camden
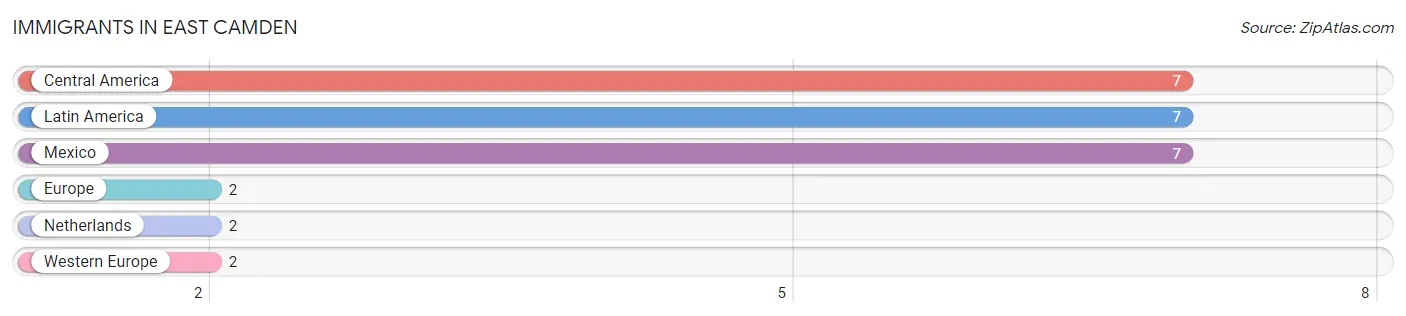
The most numerous immigrant groups reported in East Camden came from Central America (7 | 0.6%), Latin America (7 | 0.6%), Mexico (7 | 0.6%), Europe (2 | 0.2%), and Netherlands (2 | 0.2%), together accounting for 2.1% of all East Camden residents.
| Immigration Origin | # Population | % Population |
| Central America | 7 | 0.6% |
| Europe | 2 | 0.2% |
| Latin America | 7 | 0.6% |
| Mexico | 7 | 0.6% |
| Netherlands | 2 | 0.2% |
| Western Europe | 2 | 0.2% | View All 6 Rows |
Sex and Age in East Camden
Sex and Age in East Camden
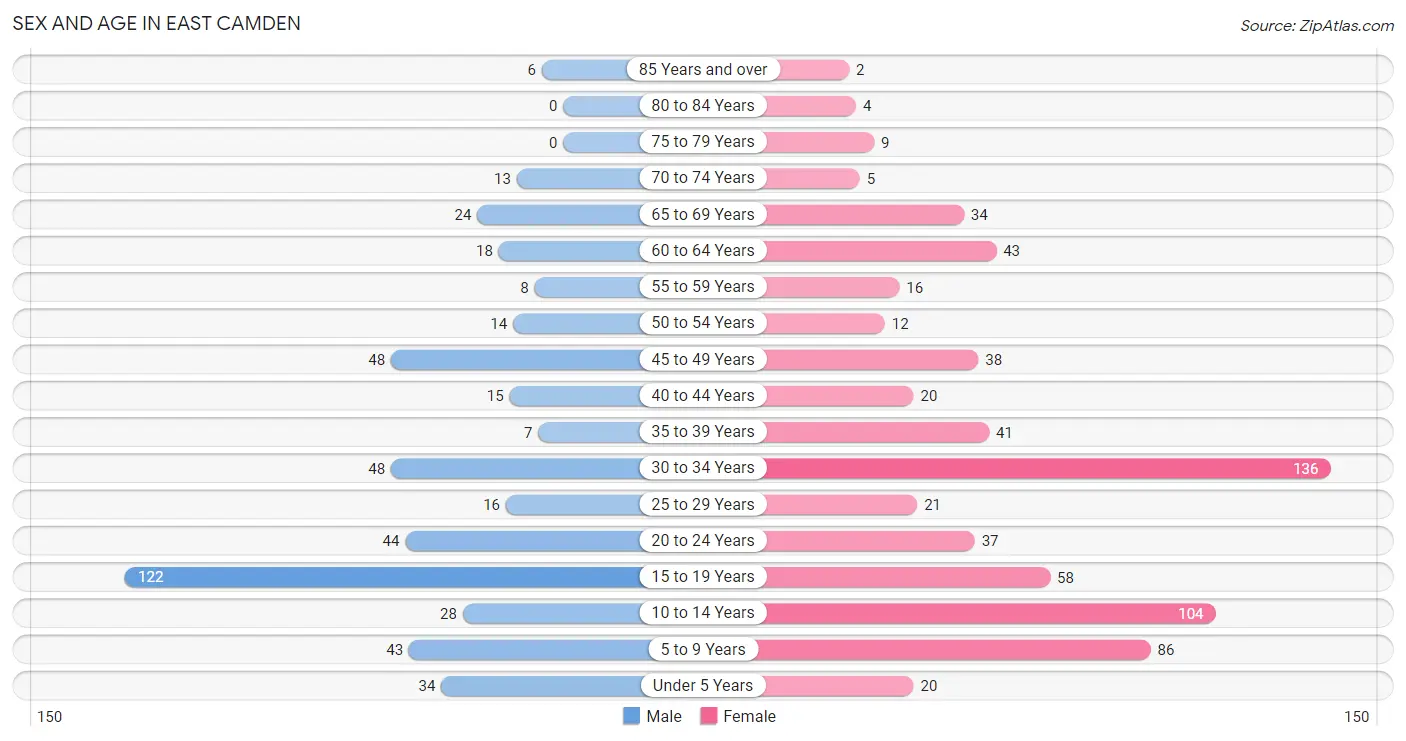
The most populous age groups in East Camden are 15 to 19 Years (122 | 25.0%) for men and 30 to 34 Years (136 | 19.8%) for women.
| Age Bracket | Male | Female |
| Under 5 Years | 34 (7.0%) | 20 (2.9%) |
| 5 to 9 Years | 43 (8.8%) | 86 (12.5%) |
| 10 to 14 Years | 28 (5.7%) | 104 (15.2%) |
| 15 to 19 Years | 122 (25.0%) | 58 (8.5%) |
| 20 to 24 Years | 44 (9.0%) | 37 (5.4%) |
| 25 to 29 Years | 16 (3.3%) | 21 (3.1%) |
| 30 to 34 Years | 48 (9.8%) | 136 (19.8%) |
| 35 to 39 Years | 7 (1.4%) | 41 (6.0%) |
| 40 to 44 Years | 15 (3.1%) | 20 (2.9%) |
| 45 to 49 Years | 48 (9.8%) | 38 (5.5%) |
| 50 to 54 Years | 14 (2.9%) | 12 (1.8%) |
| 55 to 59 Years | 8 (1.6%) | 16 (2.3%) |
| 60 to 64 Years | 18 (3.7%) | 43 (6.3%) |
| 65 to 69 Years | 24 (4.9%) | 34 (5.0%) |
| 70 to 74 Years | 13 (2.7%) | 5 (0.7%) |
| 75 to 79 Years | 0 (0.0%) | 9 (1.3%) |
| 80 to 84 Years | 0 (0.0%) | 4 (0.6%) |
| 85 Years and over | 6 (1.2%) | 2 (0.3%) |
| Total | 488 (100.0%) | 686 (100.0%) |
Families and Households in East Camden
Median Family Size in East Camden
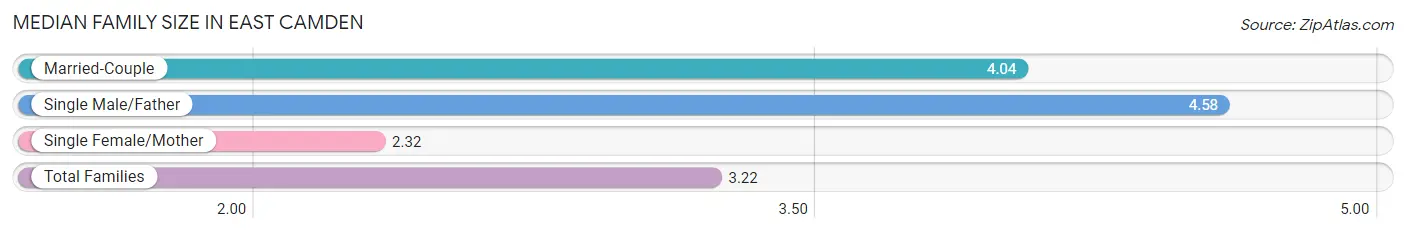
The median family size in East Camden is 3.22 persons per family, with single male/father families (26 | 7.9%) accounting for the largest median family size of 4.58 persons per family. On the other hand, single female/mother families (164 | 49.8%) represent the smallest median family size with 2.32 persons per family.
| Family Type | # Families | Family Size |
| Married-Couple | 139 (42.2%) | 4.04 |
| Single Male/Father | 26 (7.9%) | 4.58 |
| Single Female/Mother | 164 (49.8%) | 2.32 |
| Total Families | 329 (100.0%) | 3.22 |
Median Household Size in East Camden
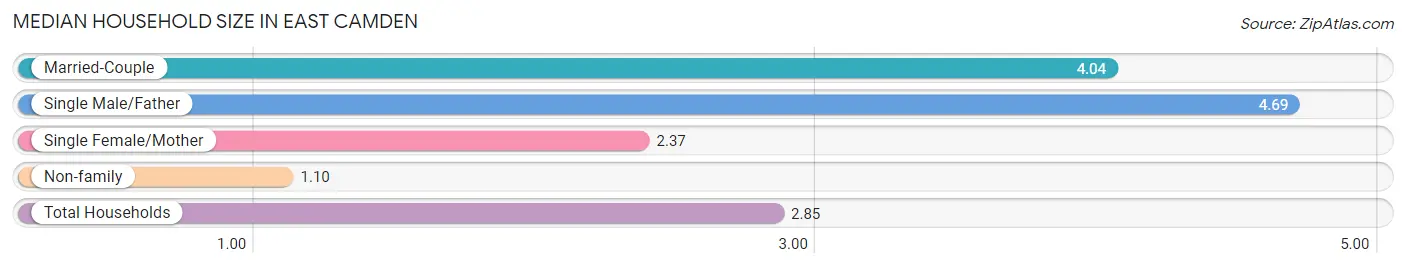
The median household size in East Camden is 2.85 persons per household, with single male/father households (26 | 6.4%) accounting for the largest median household size of 4.69 persons per household. non-family households (77 | 19.0%) represent the smallest median household size with 1.10 persons per household.
| Household Type | # Households | Household Size |
| Married-Couple | 139 (34.2%) | 4.04 |
| Single Male/Father | 26 (6.4%) | 4.69 |
| Single Female/Mother | 164 (40.4%) | 2.37 |
| Non-family | 77 (19.0%) | 1.10 |
| Total Households | 406 (100.0%) | 2.85 |
Household Size by Marriage Status in East Camden
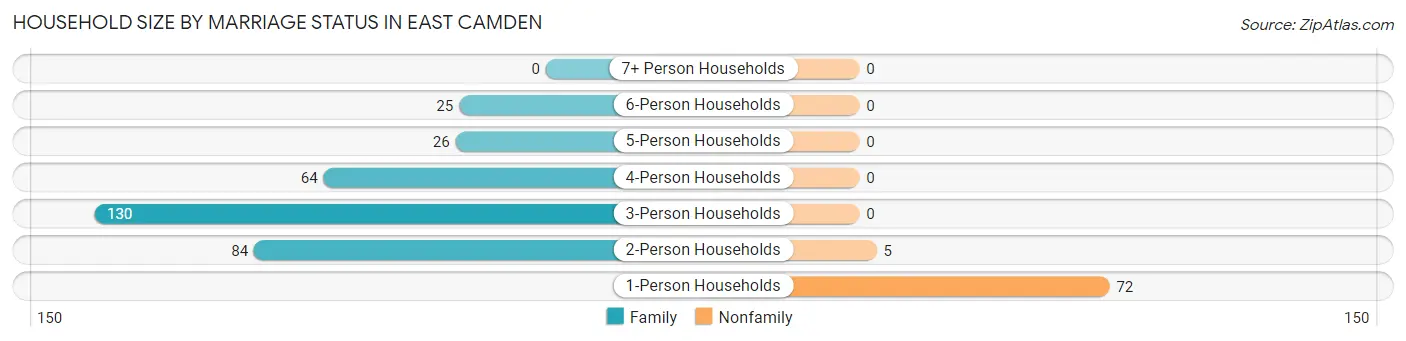
Out of a total of 406 households in East Camden, 329 (81.0%) are family households, while 77 (19.0%) are nonfamily households. The most numerous type of family households are 3-person households, comprising 130, and the most common type of nonfamily households are 1-person households, comprising 72.
| Household Size | Family Households | Nonfamily Households |
| 1-Person Households | - | 72 (17.7%) |
| 2-Person Households | 84 (20.7%) | 5 (1.2%) |
| 3-Person Households | 130 (32.0%) | 0 (0.0%) |
| 4-Person Households | 64 (15.8%) | 0 (0.0%) |
| 5-Person Households | 26 (6.4%) | 0 (0.0%) |
| 6-Person Households | 25 (6.2%) | 0 (0.0%) |
| 7+ Person Households | 0 (0.0%) | 0 (0.0%) |
| Total | 329 (81.0%) | 77 (19.0%) |
Female Fertility in East Camden
Fertility by Age in East Camden
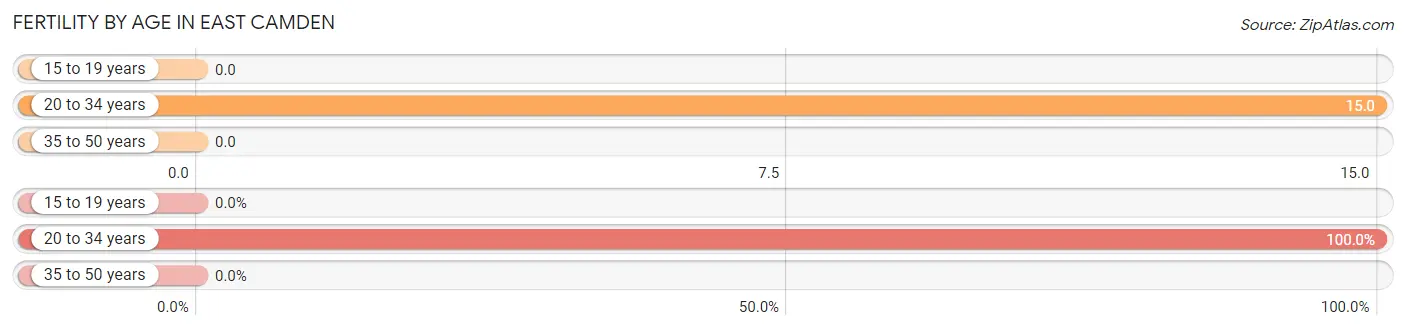
Average fertility rate in East Camden is 9.0 births per 1,000 women. Women in the age bracket of 20 to 34 years have the highest fertility rate with 15.0 births per 1,000 women. Women in the age bracket of 20 to 34 years acount for 100.0% of all women with births.
| Age Bracket | Women with Births | Births / 1,000 Women |
| 15 to 19 years | 0 (0.0%) | 0.0 |
| 20 to 34 years | 3 (100.0%) | 15.0 |
| 35 to 50 years | 0 (0.0%) | 0.0 |
| Total | 3 (100.0%) | 9.0 |
Fertility by Age by Marriage Status in East Camden
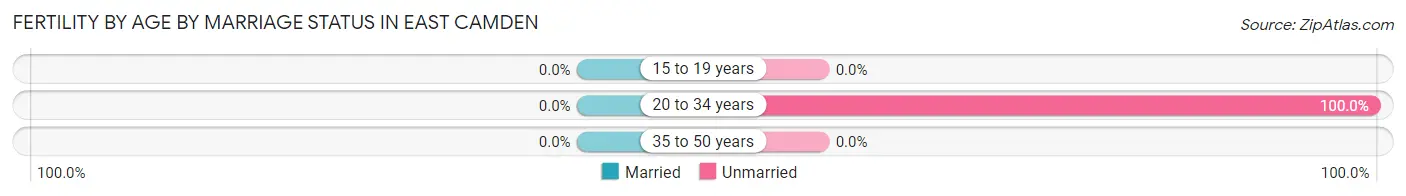
| Age Bracket | Married | Unmarried |
| 15 to 19 years | 0 (0.0%) | 0 (0.0%) |
| 20 to 34 years | 0 (0.0%) | 3 (100.0%) |
| 35 to 50 years | 0 (0.0%) | 0 (0.0%) |
| Total | 0 (0.0%) | 3 (100.0%) |
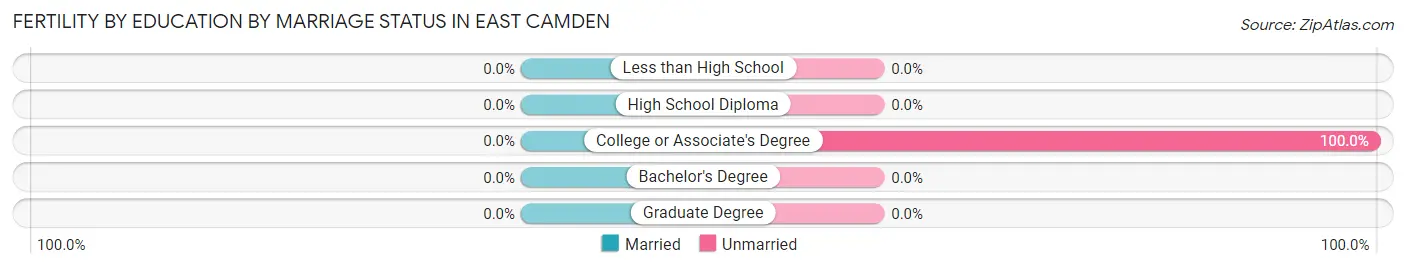
Fertility by Education in East Camden
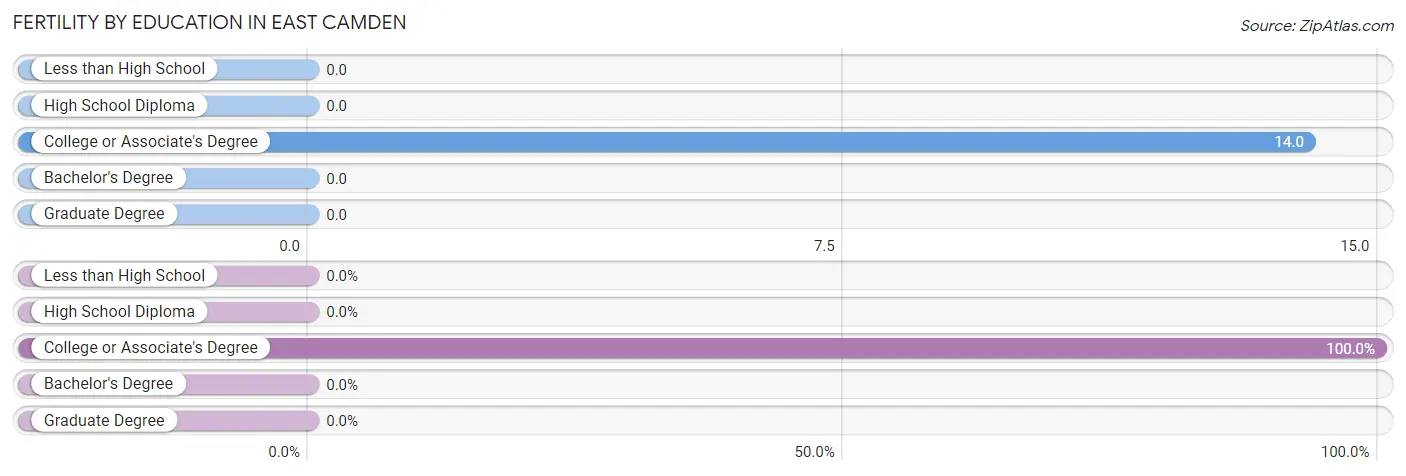
| Educational Attainment | Women with Births | Births / 1,000 Women |
| Less than High School | 0 (0.0%) | 0.0 |
| High School Diploma | 0 (0.0%) | 0.0 |
| College or Associate's Degree | 3 (100.0%) | 14.0 |
| Bachelor's Degree | 0 (0.0%) | 0.0 |
| Graduate Degree | 0 (0.0%) | 0.0 |
| Total | 3 (100.0%) | 9.0 |
Fertility by Education by Marriage Status in East Camden
| Educational Attainment | Married | Unmarried |
| Less than High School | 0 (0.0%) | 0 (0.0%) |
| High School Diploma | 0 (0.0%) | 0 (0.0%) |
| College or Associate's Degree | 0 (0.0%) | 3 (100.0%) |
| Bachelor's Degree | 0 (0.0%) | 0 (0.0%) |
| Graduate Degree | 0 (0.0%) | 0 (0.0%) |
| Total | 0 (0.0%) | 3 (100.0%) |
Employment Characteristics in East Camden
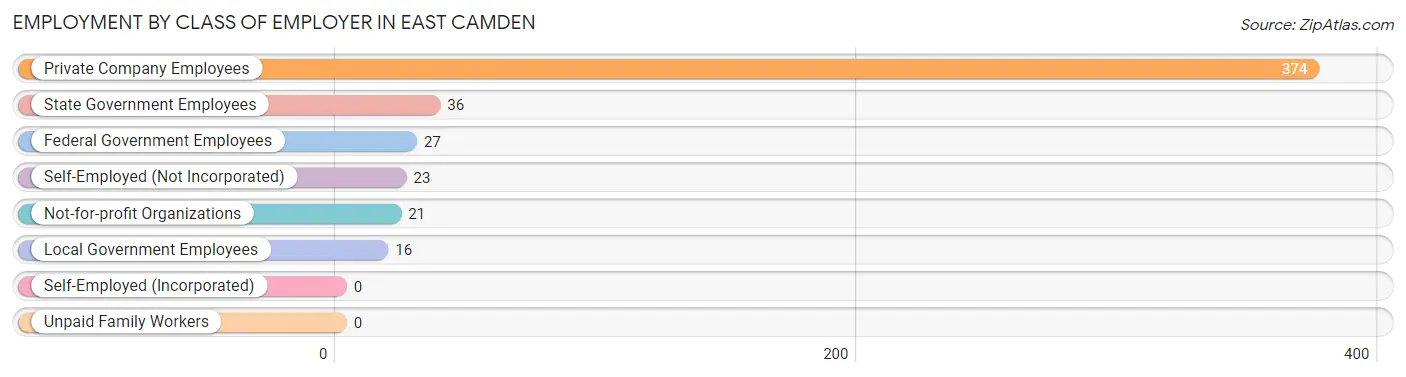
Employment by Class of Employer in East Camden
Among the 497 employed individuals in East Camden, private company employees (374 | 75.2%), state government employees (36 | 7.2%), and federal government employees (27 | 5.4%) make up the most common classes of employment.
| Employer Class | # Employees | % Employees |
| Private Company Employees | 374 | 75.2% |
| Self-Employed (Incorporated) | 0 | 0.0% |
| Self-Employed (Not Incorporated) | 23 | 4.6% |
| Not-for-profit Organizations | 21 | 4.2% |
| Local Government Employees | 16 | 3.2% |
| State Government Employees | 36 | 7.2% |
| Federal Government Employees | 27 | 5.4% |
| Unpaid Family Workers | 0 | 0.0% |
| Total | 497 | 100.0% |
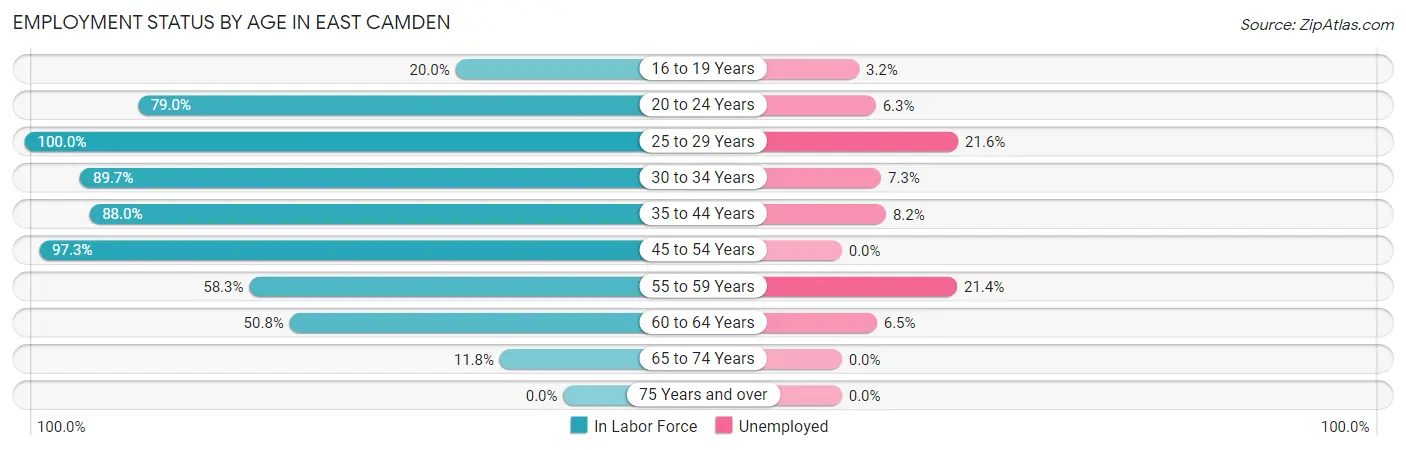
Employment Status by Age in East Camden
According to the labor force statistics for East Camden, out of the total population over 16 years of age (834), 63.9% or 533 individuals are in the labor force, with 6.8% or 36 of them unemployed. The age group with the highest labor force participation rate is 25 to 29 years, with 100.0% or 37 individuals in the labor force. Within the labor force, the 25 to 29 years age range has the highest percentage of unemployed individuals, with 21.6% or 8 of them being unemployed.
| Age Bracket | In Labor Force | Unemployed |
| 16 to 19 Years | 31 (20.0%) | 1 (3.2%) |
| 20 to 24 Years | 64 (79.0%) | 4 (6.3%) |
| 25 to 29 Years | 37 (100.0%) | 8 (21.6%) |
| 30 to 34 Years | 165 (89.7%) | 12 (7.3%) |
| 35 to 44 Years | 73 (88.0%) | 6 (8.2%) |
| 45 to 54 Years | 109 (97.3%) | 0 (0.0%) |
| 55 to 59 Years | 14 (58.3%) | 3 (21.4%) |
| 60 to 64 Years | 31 (50.8%) | 2 (6.5%) |
| 65 to 74 Years | 9 (11.8%) | 0 (0.0%) |
| 75 Years and over | 0 (0.0%) | 0 (0.0%) |
| Total | 533 (63.9%) | 36 (6.8%) |
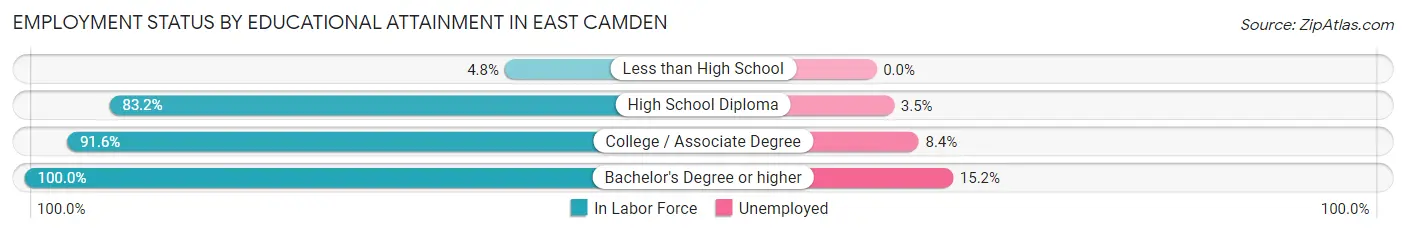
Employment Status by Educational Attainment in East Camden
According to labor force statistics for East Camden, 85.6% of individuals (429) out of the total population between 25 and 64 years of age (501) are in the labor force, with 7.2% or 31 of them being unemployed. The group with the highest labor force participation rate are those with the educational attainment of bachelor's degree or higher, with 100.0% or 33 individuals in the labor force. Within the labor force, individuals with bachelor's degree or higher education have the highest percentage of unemployment, with 15.2% or 5 of them being unemployed.
| Educational Attainment | In Labor Force | Unemployed |
| Less than High School | 1 (4.8%) | 0 (0.0%) |
| High School Diploma | 144 (83.2%) | 6 (3.5%) |
| College / Associate Degree | 251 (91.6%) | 23 (8.4%) |
| Bachelor's Degree or higher | 33 (100.0%) | 5 (15.2%) |
| Total | 429 (85.6%) | 36 (7.2%) |
Employment Occupations by Sex in East Camden
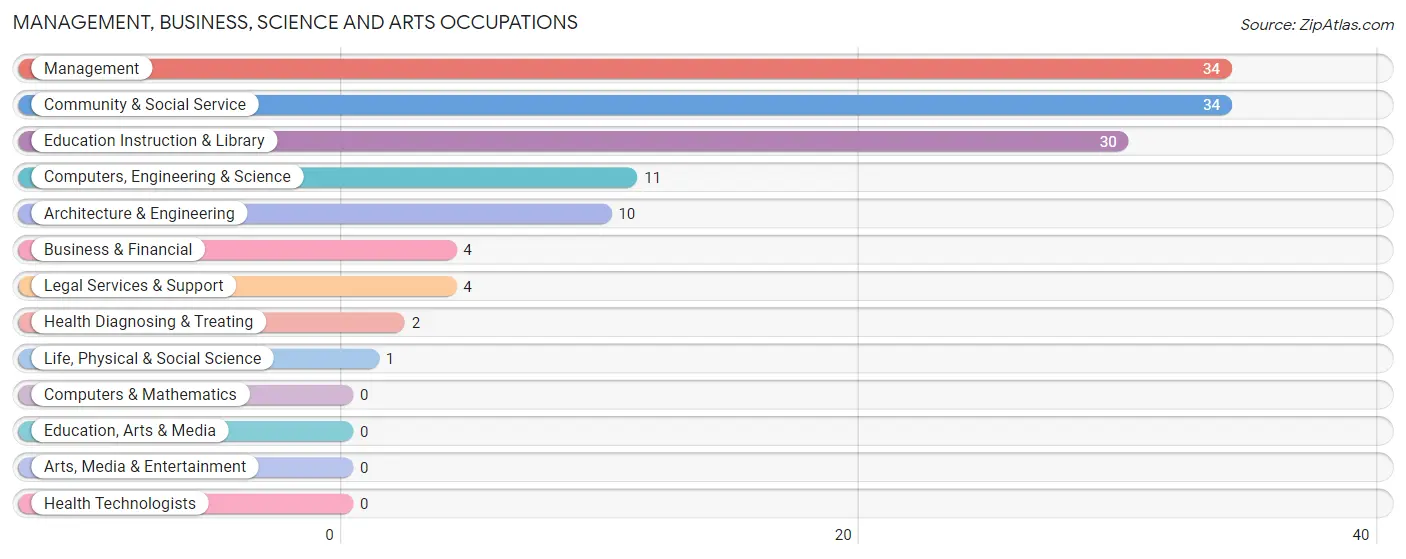
Management, Business, Science and Arts Occupations
The most common Management, Business, Science and Arts occupations in East Camden are Management (34 | 6.8%), Community & Social Service (34 | 6.8%), Education Instruction & Library (30 | 6.0%), Computers, Engineering & Science (11 | 2.2%), and Architecture & Engineering (10 | 2.0%).
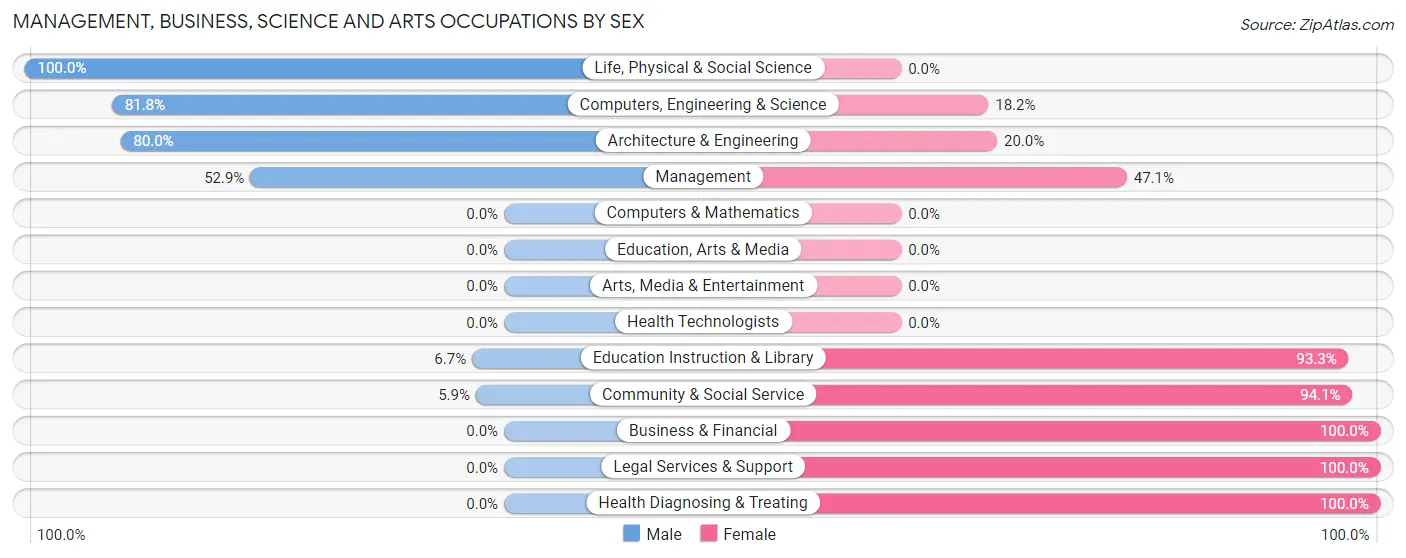
Management, Business, Science and Arts Occupations by Sex
Within the Management, Business, Science and Arts occupations in East Camden, the most male-oriented occupations are Life, Physical & Social Science (100.0%), Computers, Engineering & Science (81.8%), and Architecture & Engineering (80.0%), while the most female-oriented occupations are Business & Financial (100.0%), Legal Services & Support (100.0%), and Health Diagnosing & Treating (100.0%).
| Occupation | Male | Female |
| Management | 18 (52.9%) | 16 (47.1%) |
| Business & Financial | 0 (0.0%) | 4 (100.0%) |
| Computers, Engineering & Science | 9 (81.8%) | 2 (18.2%) |
| Computers & Mathematics | 0 (0.0%) | 0 (0.0%) |
| Architecture & Engineering | 8 (80.0%) | 2 (20.0%) |
| Life, Physical & Social Science | 1 (100.0%) | 0 (0.0%) |
| Community & Social Service | 2 (5.9%) | 32 (94.1%) |
| Education, Arts & Media | 0 (0.0%) | 0 (0.0%) |
| Legal Services & Support | 0 (0.0%) | 4 (100.0%) |
| Education Instruction & Library | 2 (6.7%) | 28 (93.3%) |
| Arts, Media & Entertainment | 0 (0.0%) | 0 (0.0%) |
| Health Diagnosing & Treating | 0 (0.0%) | 2 (100.0%) |
| Health Technologists | 0 (0.0%) | 0 (0.0%) |
| Total (Category) | 29 (34.1%) | 56 (65.9%) |
| Total (Overall) | 210 (42.2%) | 287 (57.8%) |
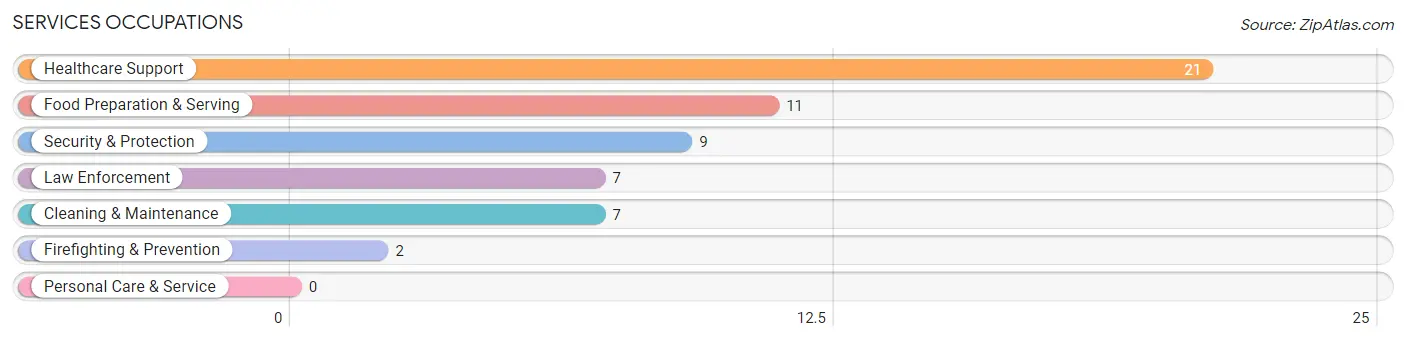
Services Occupations
The most common Services occupations in East Camden are Healthcare Support (21 | 4.2%), Food Preparation & Serving (11 | 2.2%), Security & Protection (9 | 1.8%), Law Enforcement (7 | 1.4%), and Cleaning & Maintenance (7 | 1.4%).
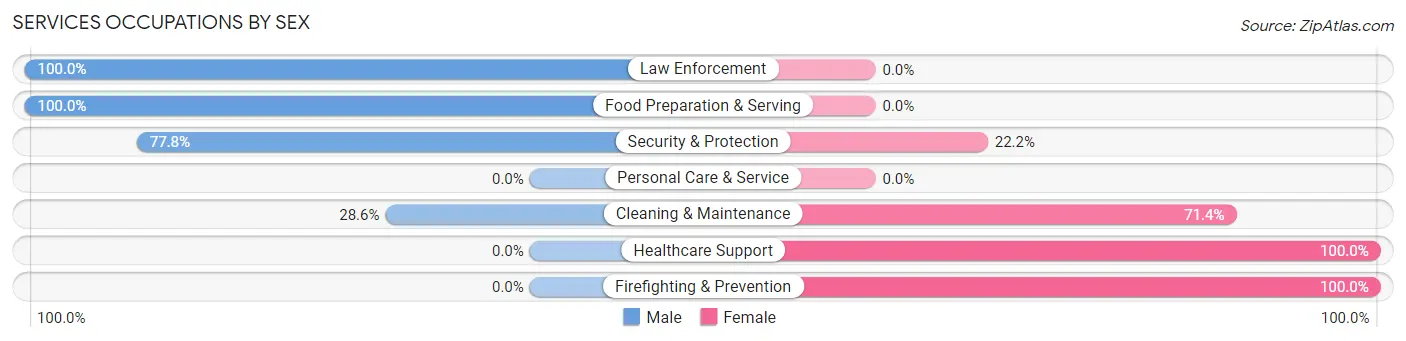
Services Occupations by Sex
Within the Services occupations in East Camden, the most male-oriented occupations are Law Enforcement (100.0%), Food Preparation & Serving (100.0%), and Security & Protection (77.8%), while the most female-oriented occupations are Healthcare Support (100.0%), Firefighting & Prevention (100.0%), and Cleaning & Maintenance (71.4%).
| Occupation | Male | Female |
| Healthcare Support | 0 (0.0%) | 21 (100.0%) |
| Security & Protection | 7 (77.8%) | 2 (22.2%) |
| Firefighting & Prevention | 0 (0.0%) | 2 (100.0%) |
| Law Enforcement | 7 (100.0%) | 0 (0.0%) |
| Food Preparation & Serving | 11 (100.0%) | 0 (0.0%) |
| Cleaning & Maintenance | 2 (28.6%) | 5 (71.4%) |
| Personal Care & Service | 0 (0.0%) | 0 (0.0%) |
| Total (Category) | 20 (41.7%) | 28 (58.3%) |
| Total (Overall) | 210 (42.2%) | 287 (57.8%) |
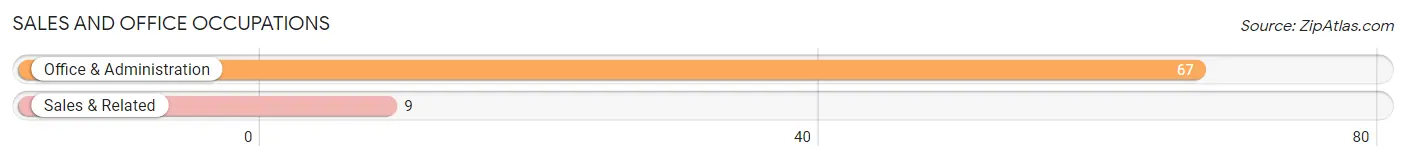
Sales and Office Occupations
The most common Sales and Office occupations in East Camden are Office & Administration (67 | 13.5%), and Sales & Related (9 | 1.8%).
Sales and Office Occupations by Sex
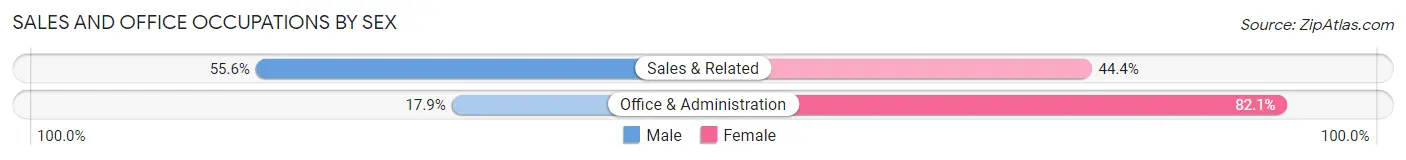
| Occupation | Male | Female |
| Sales & Related | 5 (55.6%) | 4 (44.4%) |
| Office & Administration | 12 (17.9%) | 55 (82.1%) |
| Total (Category) | 17 (22.4%) | 59 (77.6%) |
| Total (Overall) | 210 (42.2%) | 287 (57.8%) |
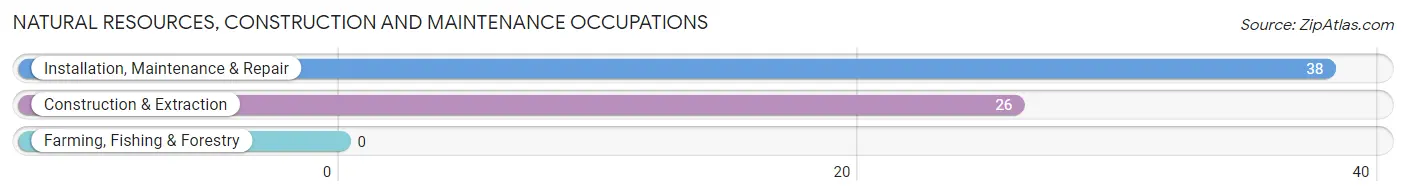
Natural Resources, Construction and Maintenance Occupations
The most common Natural Resources, Construction and Maintenance occupations in East Camden are Installation, Maintenance & Repair (38 | 7.6%), and Construction & Extraction (26 | 5.2%).
Natural Resources, Construction and Maintenance Occupations by Sex
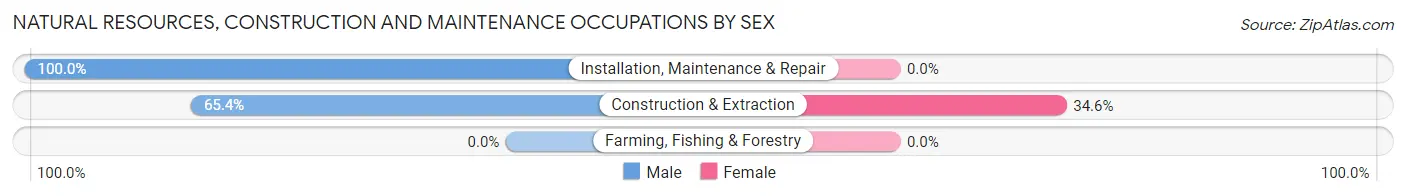
| Occupation | Male | Female |
| Farming, Fishing & Forestry | 0 (0.0%) | 0 (0.0%) |
| Construction & Extraction | 17 (65.4%) | 9 (34.6%) |
| Installation, Maintenance & Repair | 38 (100.0%) | 0 (0.0%) |
| Total (Category) | 55 (85.9%) | 9 (14.1%) |
| Total (Overall) | 210 (42.2%) | 287 (57.8%) |
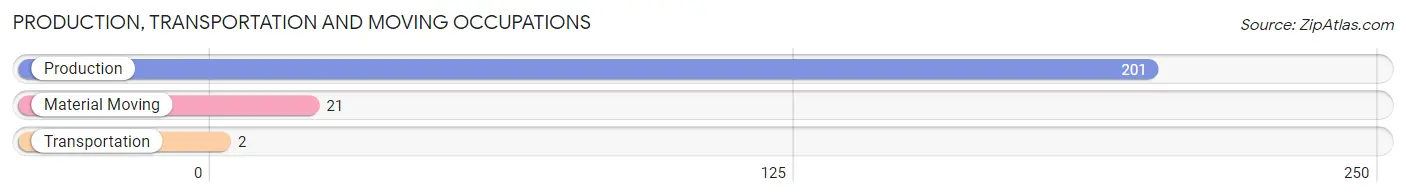
Production, Transportation and Moving Occupations
The most common Production, Transportation and Moving occupations in East Camden are Production (201 | 40.4%), Material Moving (21 | 4.2%), and Transportation (2 | 0.4%).
Production, Transportation and Moving Occupations by Sex
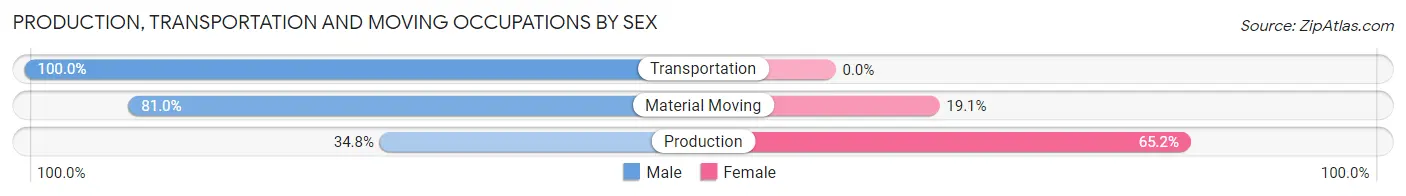
| Occupation | Male | Female |
| Production | 70 (34.8%) | 131 (65.2%) |
| Transportation | 2 (100.0%) | 0 (0.0%) |
| Material Moving | 17 (80.9%) | 4 (19.1%) |
| Total (Category) | 89 (39.7%) | 135 (60.3%) |
| Total (Overall) | 210 (42.2%) | 287 (57.8%) |
Employment Industries by Sex in East Camden
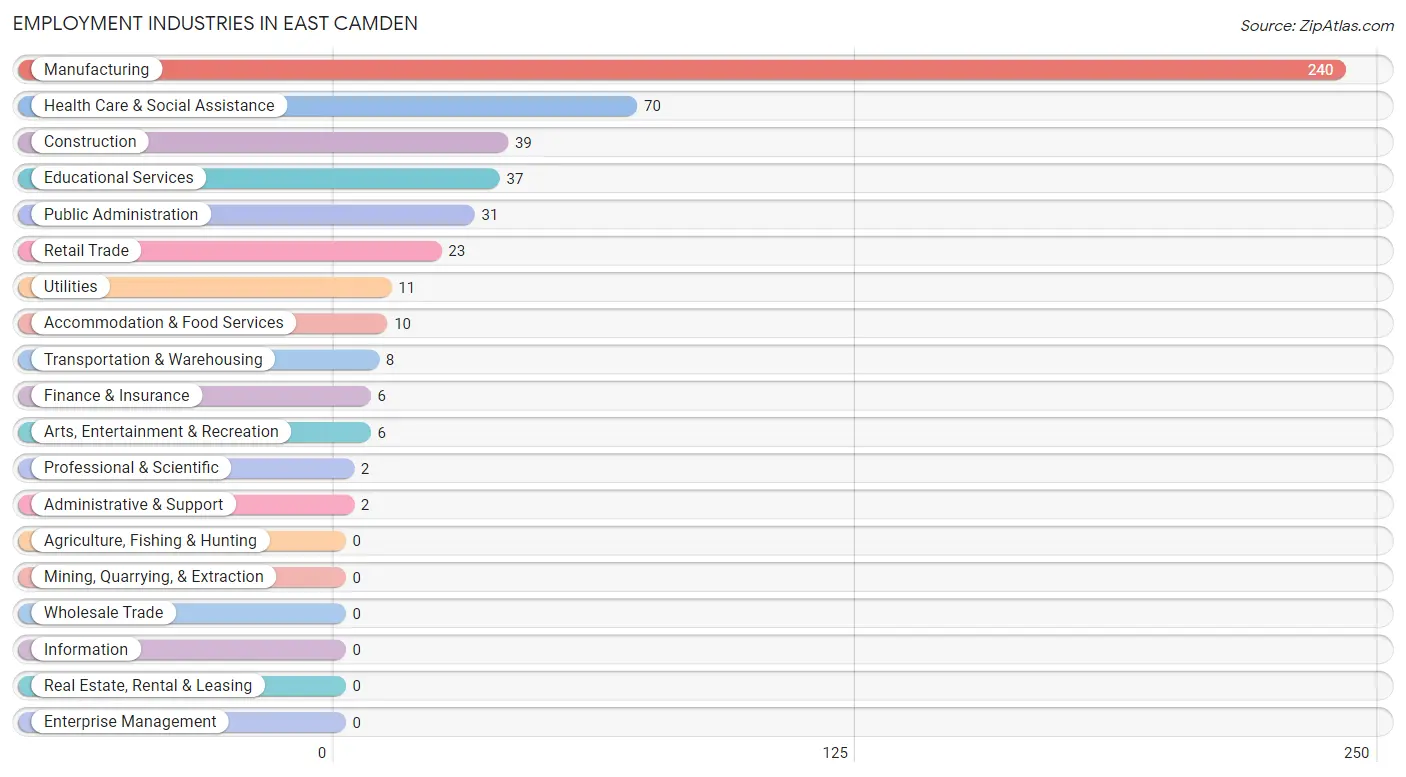
Employment Industries in East Camden
The major employment industries in East Camden include Manufacturing (240 | 48.3%), Health Care & Social Assistance (70 | 14.1%), Construction (39 | 7.9%), Educational Services (37 | 7.4%), and Public Administration (31 | 6.2%).
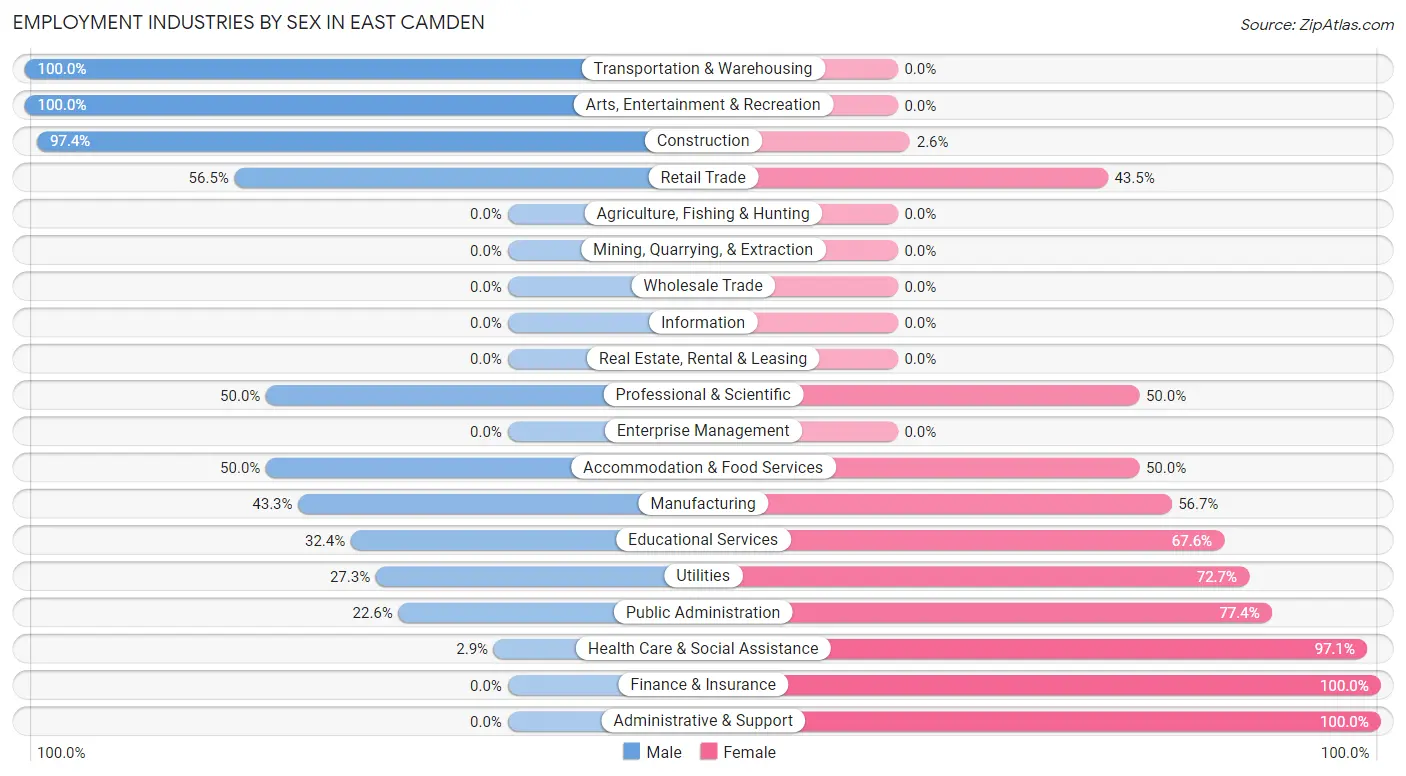
Employment Industries by Sex in East Camden
The East Camden industries that see more men than women are Transportation & Warehousing (100.0%), Arts, Entertainment & Recreation (100.0%), and Construction (97.4%), whereas the industries that tend to have a higher number of women are Finance & Insurance (100.0%), Administrative & Support (100.0%), and Health Care & Social Assistance (97.1%).
| Industry | Male | Female |
| Agriculture, Fishing & Hunting | 0 (0.0%) | 0 (0.0%) |
| Mining, Quarrying, & Extraction | 0 (0.0%) | 0 (0.0%) |
| Construction | 38 (97.4%) | 1 (2.6%) |
| Manufacturing | 104 (43.3%) | 136 (56.7%) |
| Wholesale Trade | 0 (0.0%) | 0 (0.0%) |
| Retail Trade | 13 (56.5%) | 10 (43.5%) |
| Transportation & Warehousing | 8 (100.0%) | 0 (0.0%) |
| Utilities | 3 (27.3%) | 8 (72.7%) |
| Information | 0 (0.0%) | 0 (0.0%) |
| Finance & Insurance | 0 (0.0%) | 6 (100.0%) |
| Real Estate, Rental & Leasing | 0 (0.0%) | 0 (0.0%) |
| Professional & Scientific | 1 (50.0%) | 1 (50.0%) |
| Enterprise Management | 0 (0.0%) | 0 (0.0%) |
| Administrative & Support | 0 (0.0%) | 2 (100.0%) |
| Educational Services | 12 (32.4%) | 25 (67.6%) |
| Health Care & Social Assistance | 2 (2.9%) | 68 (97.1%) |
| Arts, Entertainment & Recreation | 6 (100.0%) | 0 (0.0%) |
| Accommodation & Food Services | 5 (50.0%) | 5 (50.0%) |
| Public Administration | 7 (22.6%) | 24 (77.4%) |
| Total | 210 (42.2%) | 287 (57.8%) |
Education in East Camden
School Enrollment in East Camden
The most common levels of schooling among the 508 students in East Camden are college / undergraduate (157 | 30.9%), elementary school (114 | 22.4%), and middle school (107 | 21.1%).
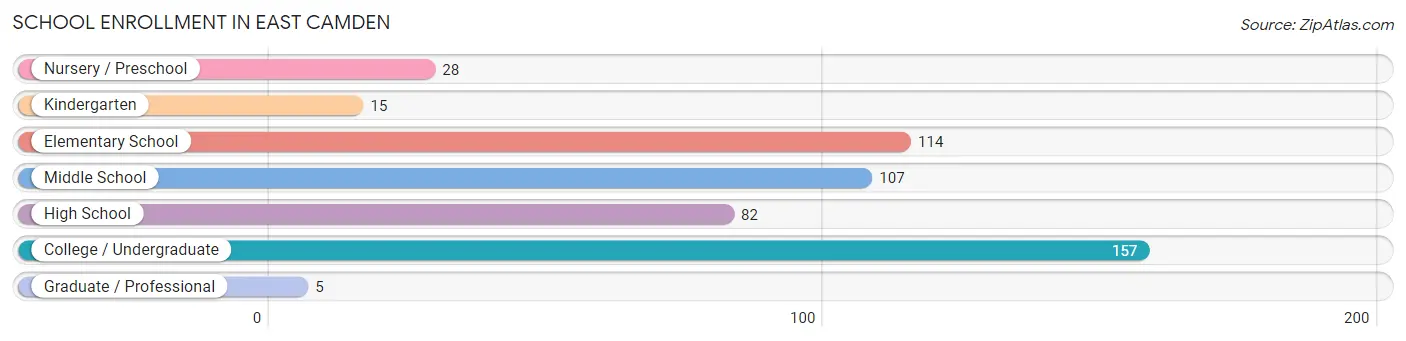
| School Level | # Students | % Students |
| Nursery / Preschool | 28 | 5.5% |
| Kindergarten | 15 | 2.9% |
| Elementary School | 114 | 22.4% |
| Middle School | 107 | 21.1% |
| High School | 82 | 16.1% |
| College / Undergraduate | 157 | 30.9% |
| Graduate / Professional | 5 | 1.0% |
| Total | 508 | 100.0% |
School Enrollment by Age by Funding Source in East Camden
Out of a total of 508 students who are enrolled in schools in East Camden, 70 (13.8%) attend a private institution, while the remaining 438 (86.2%) are enrolled in public schools. The age group of 3 to 4 year olds has the highest likelihood of being enrolled in private schools, with 22 (78.6% in the age bracket) enrolled. Conversely, the age group of 5 to 9 year old has the lowest likelihood of being enrolled in a private school, with 107 (100.0% in the age bracket) attending a public institution.
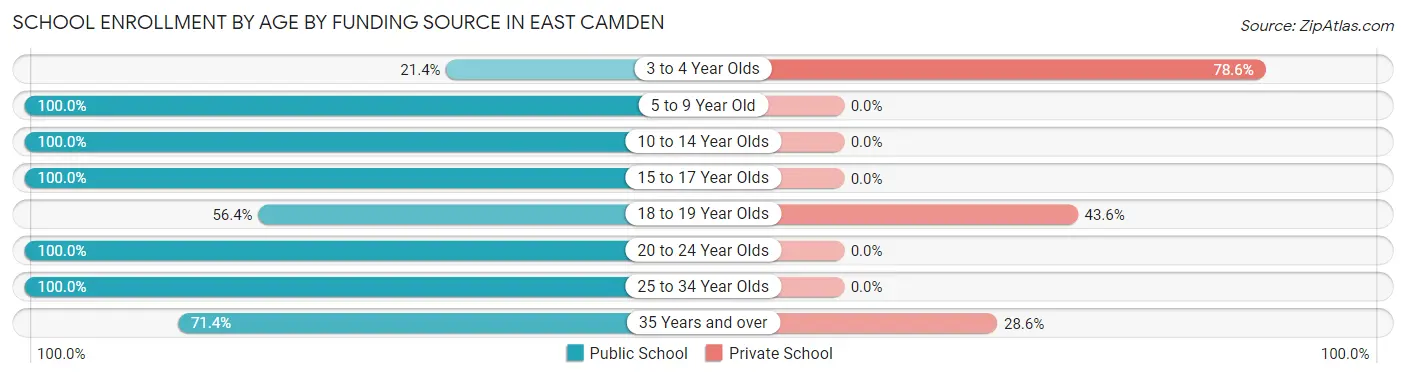
| Age Bracket | Public School | Private School |
| 3 to 4 Year Olds | 6 (21.4%) | 22 (78.6%) |
| 5 to 9 Year Old | 107 (100.0%) | 0 (0.0%) |
| 10 to 14 Year Olds | 132 (100.0%) | 0 (0.0%) |
| 15 to 17 Year Olds | 79 (100.0%) | 0 (0.0%) |
| 18 to 19 Year Olds | 57 (56.4%) | 44 (43.6%) |
| 20 to 24 Year Olds | 33 (100.0%) | 0 (0.0%) |
| 25 to 34 Year Olds | 14 (100.0%) | 0 (0.0%) |
| 35 Years and over | 10 (71.4%) | 4 (28.6%) |
| Total | 438 (86.2%) | 70 (13.8%) |
Educational Attainment by Field of Study in East Camden
Psychology (10 | 19.6%), education (8 | 15.7%), liberal arts & history (8 | 15.7%), science & technology (7 | 13.7%), and engineering (5 | 9.8%) are the most common fields of study among 51 individuals in East Camden who have obtained a bachelor's degree or higher.
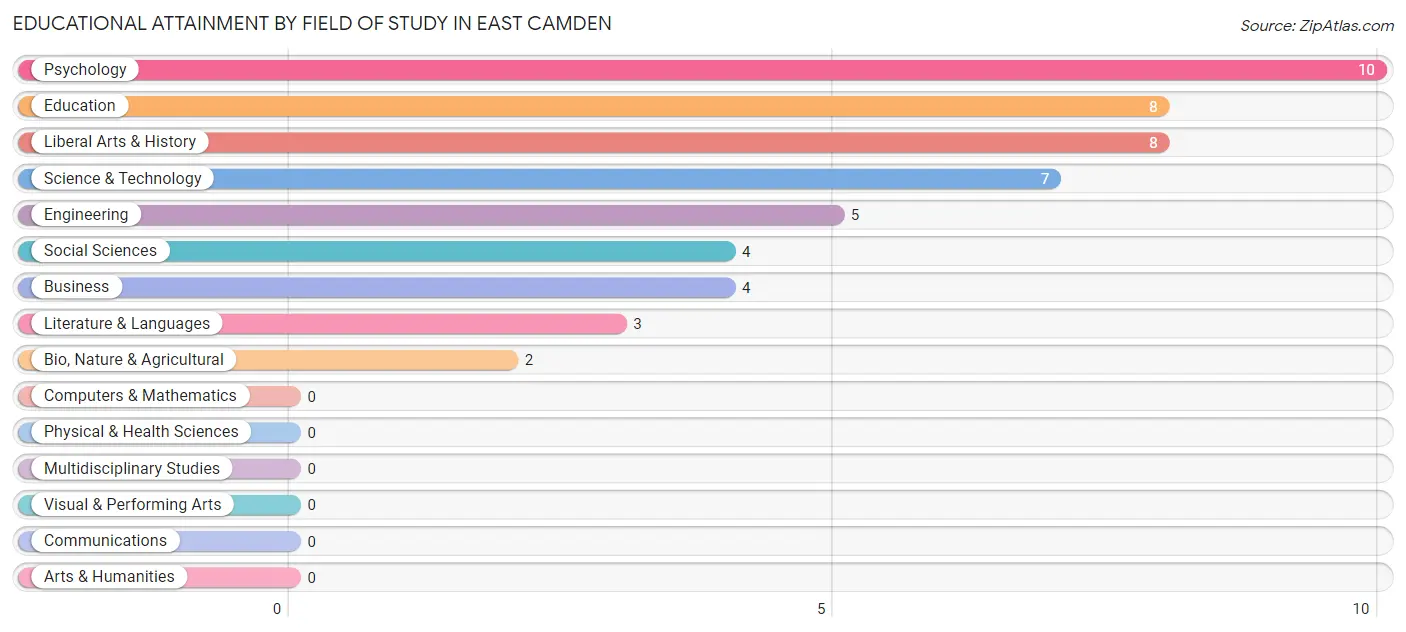
| Field of Study | # Graduates | % Graduates |
| Computers & Mathematics | 0 | 0.0% |
| Bio, Nature & Agricultural | 2 | 3.9% |
| Physical & Health Sciences | 0 | 0.0% |
| Psychology | 10 | 19.6% |
| Social Sciences | 4 | 7.8% |
| Engineering | 5 | 9.8% |
| Multidisciplinary Studies | 0 | 0.0% |
| Science & Technology | 7 | 13.7% |
| Business | 4 | 7.8% |
| Education | 8 | 15.7% |
| Literature & Languages | 3 | 5.9% |
| Liberal Arts & History | 8 | 15.7% |
| Visual & Performing Arts | 0 | 0.0% |
| Communications | 0 | 0.0% |
| Arts & Humanities | 0 | 0.0% |
| Total | 51 | 100.0% |
Transportation & Commute in East Camden
Vehicle Availability by Sex in East Camden
The most prevalent vehicle ownership categories in East Camden are males with 2 vehicles (87, accounting for 41.4%) and females with 2 vehicles (121, making up 30.7%).
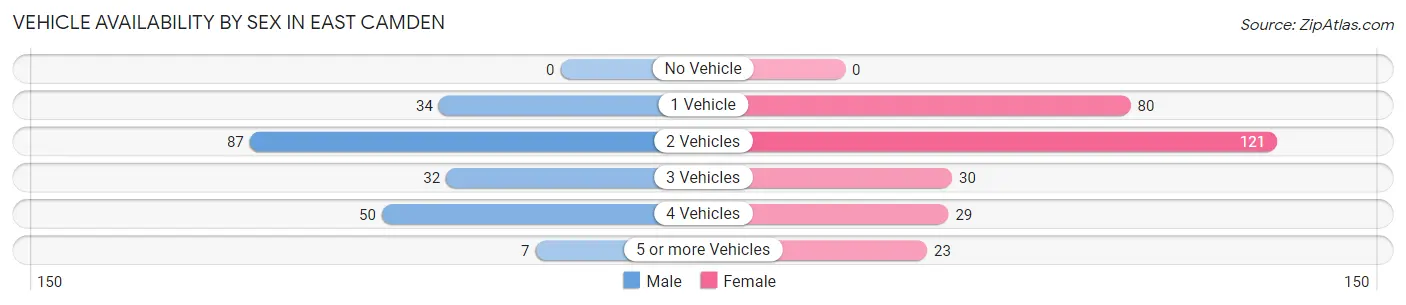
| Vehicles Available | Male | Female |
| No Vehicle | 0 (0.0%) | 0 (0.0%) |
| 1 Vehicle | 34 (16.2%) | 80 (28.3%) |
| 2 Vehicles | 87 (41.4%) | 121 (42.8%) |
| 3 Vehicles | 32 (15.2%) | 30 (10.6%) |
| 4 Vehicles | 50 (23.8%) | 29 (10.2%) |
| 5 or more Vehicles | 7 (3.3%) | 23 (8.1%) |
| Total | 210 (100.0%) | 283 (100.0%) |
Commute Time in East Camden
The most frequently occuring commute durations in East Camden are 10 to 14 minutes (220 commuters, 44.4%), 15 to 19 minutes (86 commuters, 17.4%), and 5 to 9 minutes (62 commuters, 12.5%).
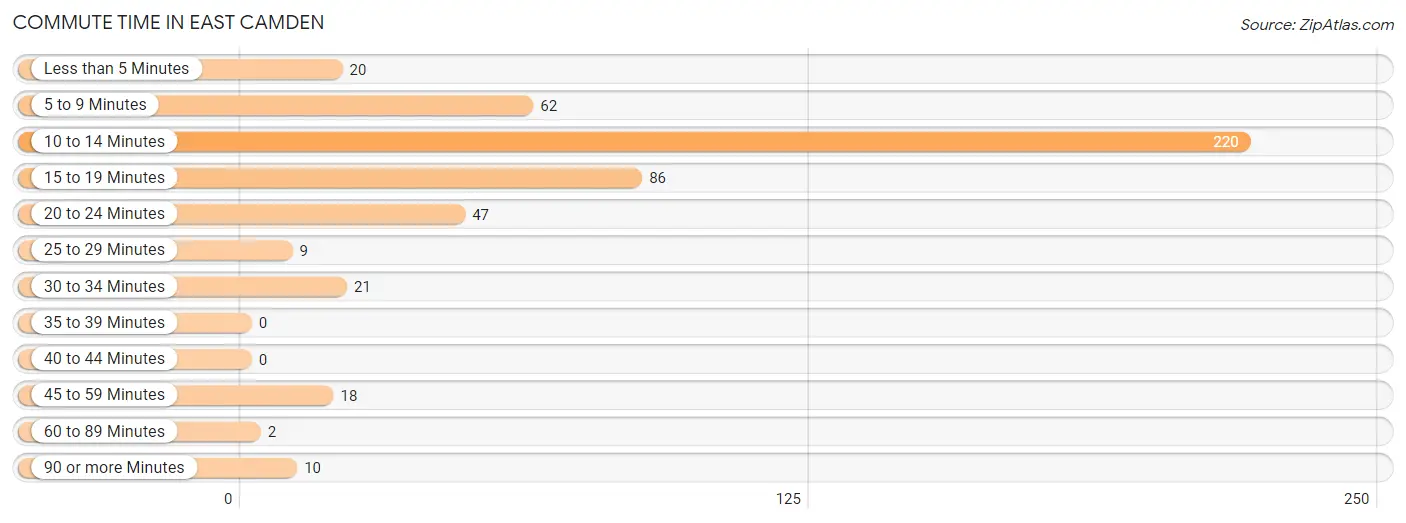
| Commute Time | # Commuters | % Commuters |
| Less than 5 Minutes | 20 | 4.0% |
| 5 to 9 Minutes | 62 | 12.5% |
| 10 to 14 Minutes | 220 | 44.4% |
| 15 to 19 Minutes | 86 | 17.4% |
| 20 to 24 Minutes | 47 | 9.5% |
| 25 to 29 Minutes | 9 | 1.8% |
| 30 to 34 Minutes | 21 | 4.2% |
| 35 to 39 Minutes | 0 | 0.0% |
| 40 to 44 Minutes | 0 | 0.0% |
| 45 to 59 Minutes | 18 | 3.6% |
| 60 to 89 Minutes | 2 | 0.4% |
| 90 or more Minutes | 10 | 2.0% |
Commute Time by Sex in East Camden
The most common commute times in East Camden are 10 to 14 minutes (61 commuters, 29.0%) for males and 10 to 14 minutes (159 commuters, 55.8%) for females.
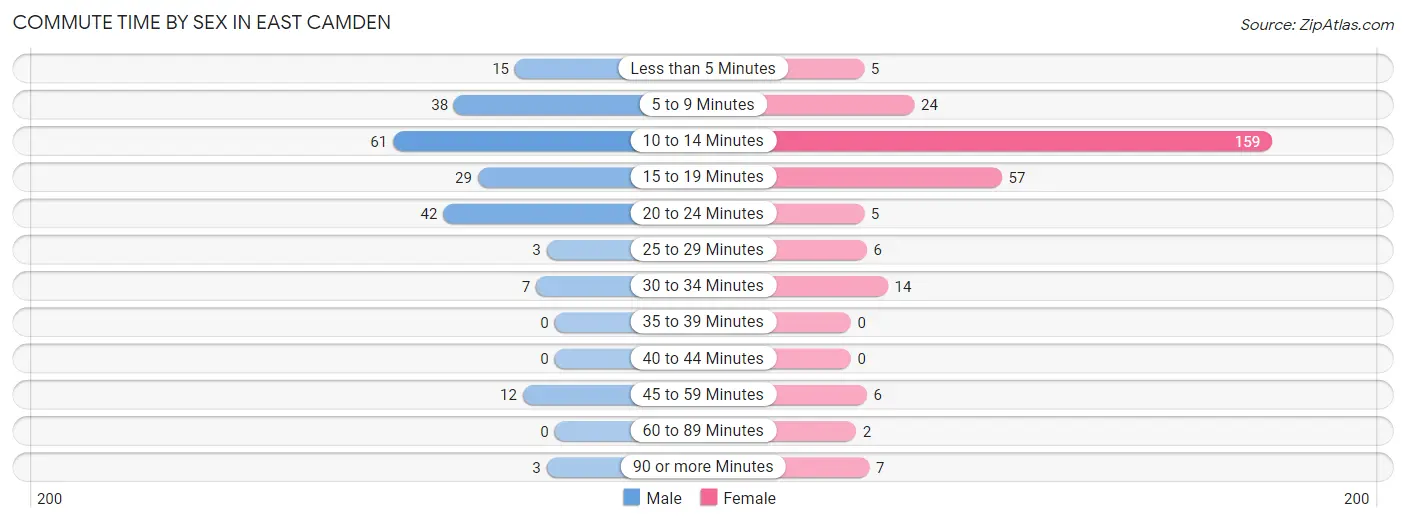
| Commute Time | Male | Female |
| Less than 5 Minutes | 15 (7.1%) | 5 (1.8%) |
| 5 to 9 Minutes | 38 (18.1%) | 24 (8.4%) |
| 10 to 14 Minutes | 61 (29.0%) | 159 (55.8%) |
| 15 to 19 Minutes | 29 (13.8%) | 57 (20.0%) |
| 20 to 24 Minutes | 42 (20.0%) | 5 (1.8%) |
| 25 to 29 Minutes | 3 (1.4%) | 6 (2.1%) |
| 30 to 34 Minutes | 7 (3.3%) | 14 (4.9%) |
| 35 to 39 Minutes | 0 (0.0%) | 0 (0.0%) |
| 40 to 44 Minutes | 0 (0.0%) | 0 (0.0%) |
| 45 to 59 Minutes | 12 (5.7%) | 6 (2.1%) |
| 60 to 89 Minutes | 0 (0.0%) | 2 (0.7%) |
| 90 or more Minutes | 3 (1.4%) | 7 (2.5%) |
Time of Departure to Work by Sex in East Camden
The most frequent times of departure to work in East Camden are 5:30 AM to 5:59 AM (42, 20.0%) for males and 6:00 AM to 6:29 AM (115, 40.4%) for females.
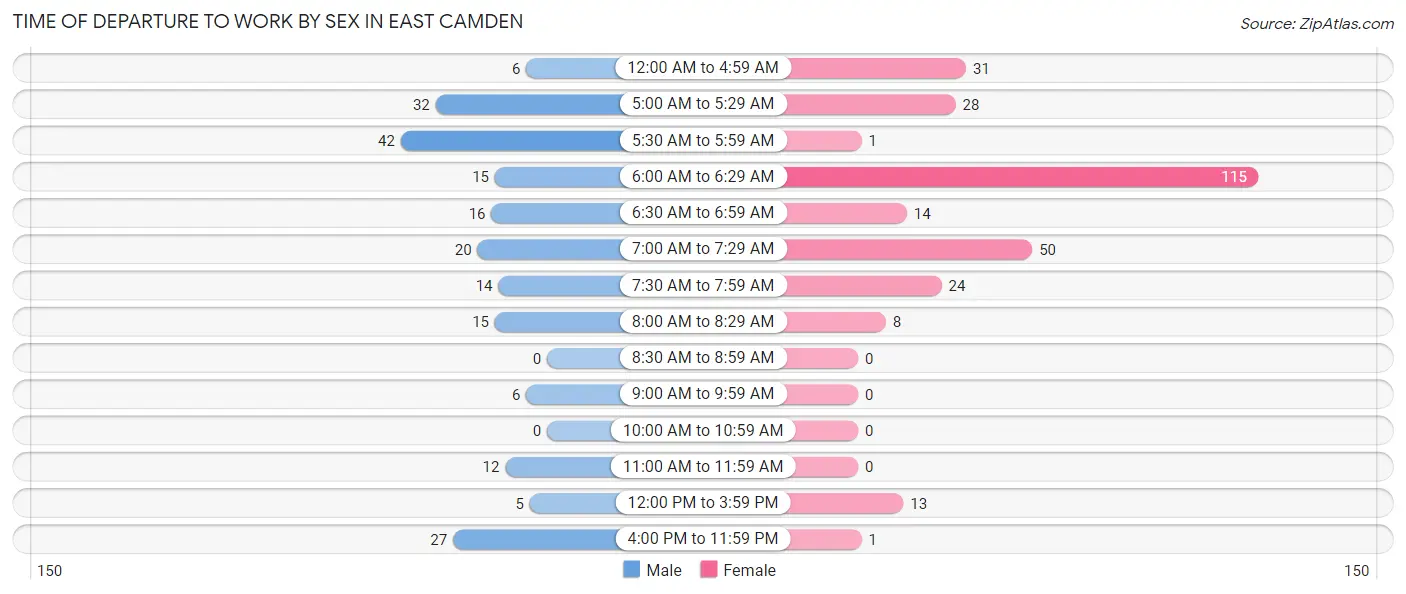
| Time of Departure | Male | Female |
| 12:00 AM to 4:59 AM | 6 (2.9%) | 31 (10.9%) |
| 5:00 AM to 5:29 AM | 32 (15.2%) | 28 (9.8%) |
| 5:30 AM to 5:59 AM | 42 (20.0%) | 1 (0.4%) |
| 6:00 AM to 6:29 AM | 15 (7.1%) | 115 (40.4%) |
| 6:30 AM to 6:59 AM | 16 (7.6%) | 14 (4.9%) |
| 7:00 AM to 7:29 AM | 20 (9.5%) | 50 (17.5%) |
| 7:30 AM to 7:59 AM | 14 (6.7%) | 24 (8.4%) |
| 8:00 AM to 8:29 AM | 15 (7.1%) | 8 (2.8%) |
| 8:30 AM to 8:59 AM | 0 (0.0%) | 0 (0.0%) |
| 9:00 AM to 9:59 AM | 6 (2.9%) | 0 (0.0%) |
| 10:00 AM to 10:59 AM | 0 (0.0%) | 0 (0.0%) |
| 11:00 AM to 11:59 AM | 12 (5.7%) | 0 (0.0%) |
| 12:00 PM to 3:59 PM | 5 (2.4%) | 13 (4.6%) |
| 4:00 PM to 11:59 PM | 27 (12.9%) | 1 (0.4%) |
| Total | 210 (100.0%) | 285 (100.0%) |
Housing Occupancy in East Camden
Occupancy by Ownership in East Camden
Of the total 406 dwellings in East Camden, owner-occupied units account for 218 (53.7%), while renter-occupied units make up 188 (46.3%).
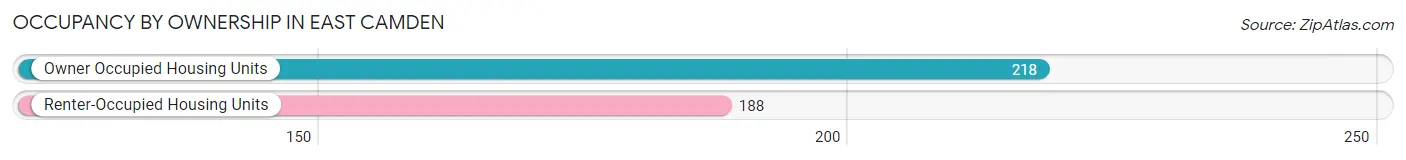
| Occupancy | # Housing Units | % Housing Units |
| Owner Occupied Housing Units | 218 | 53.7% |
| Renter-Occupied Housing Units | 188 | 46.3% |
| Total Occupied Housing Units | 406 | 100.0% |
Occupancy by Household Size in East Camden
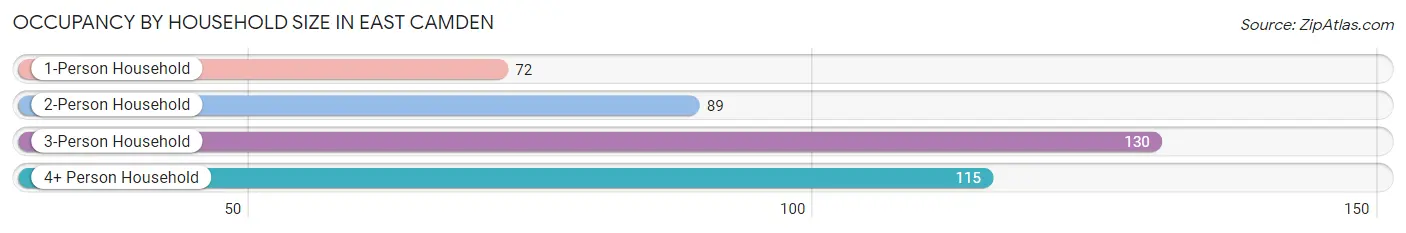
| Household Size | # Housing Units | % Housing Units |
| 1-Person Household | 72 | 17.7% |
| 2-Person Household | 89 | 21.9% |
| 3-Person Household | 130 | 32.0% |
| 4+ Person Household | 115 | 28.3% |
| Total Housing Units | 406 | 100.0% |
Occupancy by Ownership by Household Size in East Camden
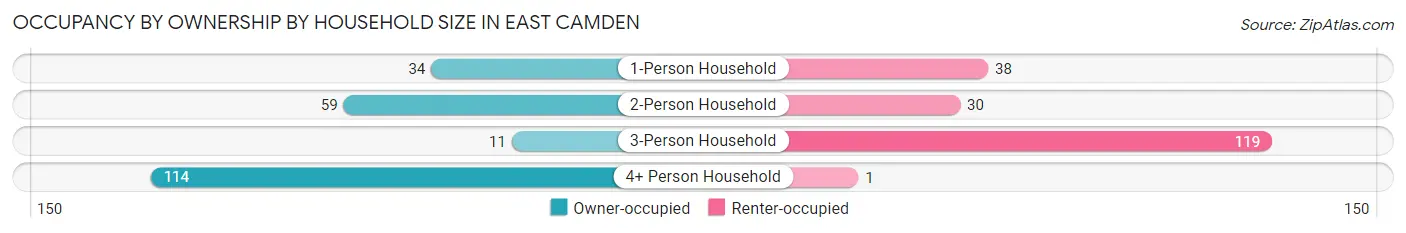
| Household Size | Owner-occupied | Renter-occupied |
| 1-Person Household | 34 (47.2%) | 38 (52.8%) |
| 2-Person Household | 59 (66.3%) | 30 (33.7%) |
| 3-Person Household | 11 (8.5%) | 119 (91.5%) |
| 4+ Person Household | 114 (99.1%) | 1 (0.9%) |
| Total Housing Units | 218 (53.7%) | 188 (46.3%) |
Occupancy by Educational Attainment in East Camden
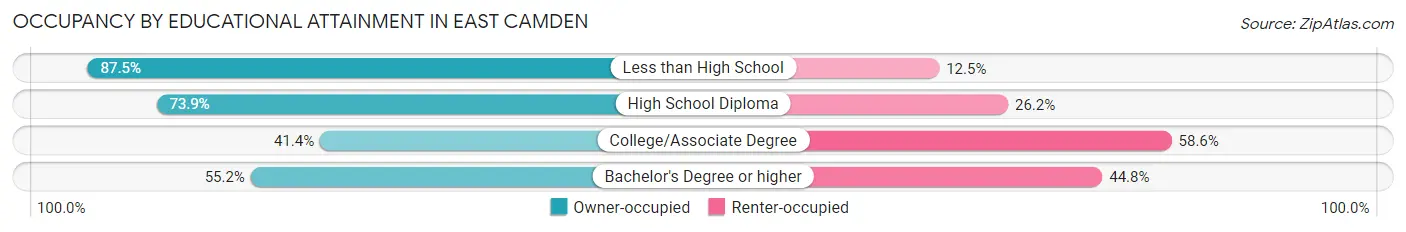
| Household Size | Owner-occupied | Renter-occupied |
| Less than High School | 7 (87.5%) | 1 (12.5%) |
| High School Diploma | 96 (73.9%) | 34 (26.2%) |
| College/Associate Degree | 99 (41.4%) | 140 (58.6%) |
| Bachelor's Degree or higher | 16 (55.2%) | 13 (44.8%) |
Occupancy by Age of Householder in East Camden
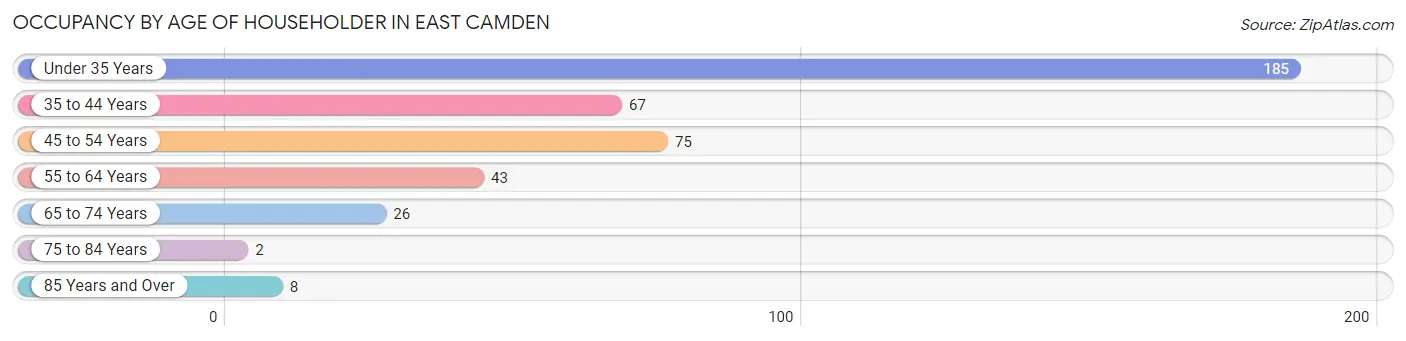
| Age Bracket | # Households | % Households |
| Under 35 Years | 185 | 45.6% |
| 35 to 44 Years | 67 | 16.5% |
| 45 to 54 Years | 75 | 18.5% |
| 55 to 64 Years | 43 | 10.6% |
| 65 to 74 Years | 26 | 6.4% |
| 75 to 84 Years | 2 | 0.5% |
| 85 Years and Over | 8 | 2.0% |
| Total | 406 | 100.0% |
Housing Finances in East Camden
Median Income by Occupancy in East Camden
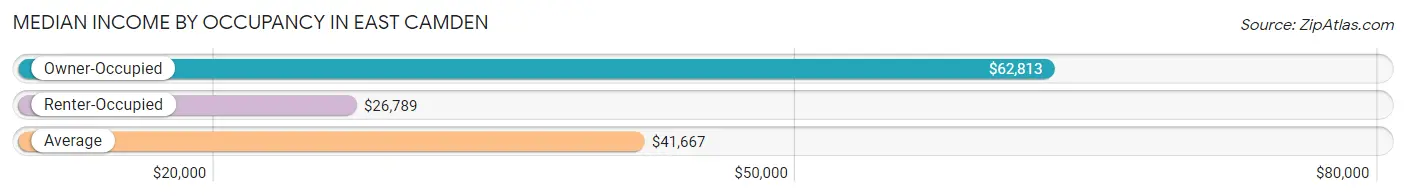
| Occupancy Type | # Households | Median Income |
| Owner-Occupied | 218 (53.7%) | $62,813 |
| Renter-Occupied | 188 (46.3%) | $26,789 |
| Average | 406 (100.0%) | $41,667 |
Occupancy by Householder Income Bracket in East Camden
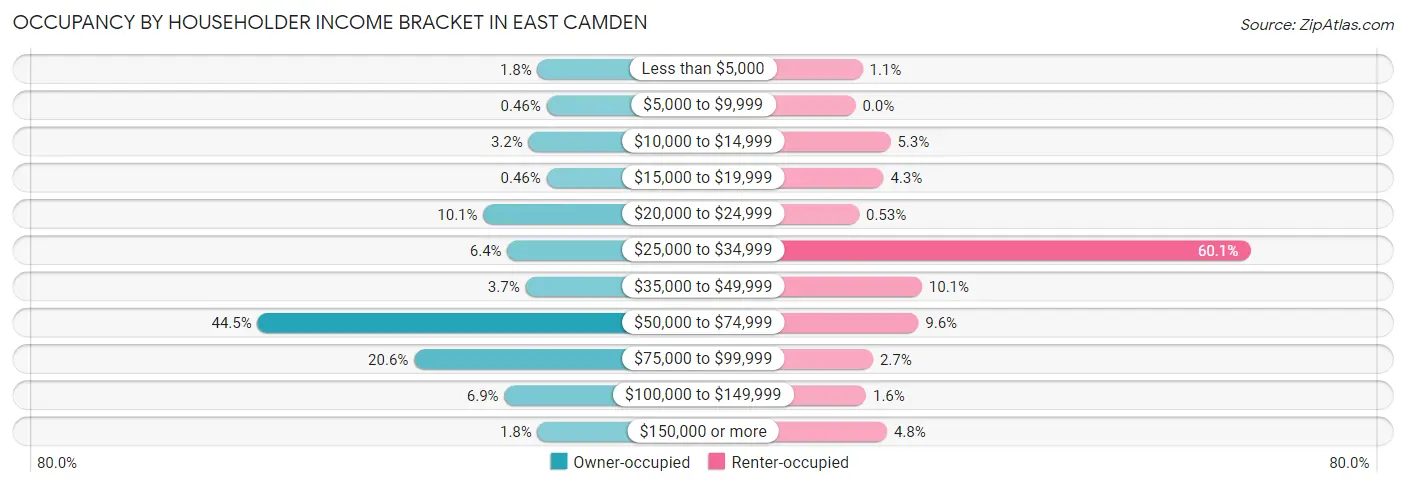
| Income Bracket | Owner-occupied | Renter-occupied |
| Less than $5,000 | 4 (1.8%) | 2 (1.1%) |
| $5,000 to $9,999 | 1 (0.5%) | 0 (0.0%) |
| $10,000 to $14,999 | 7 (3.2%) | 10 (5.3%) |
| $15,000 to $19,999 | 1 (0.5%) | 8 (4.3%) |
| $20,000 to $24,999 | 22 (10.1%) | 1 (0.5%) |
| $25,000 to $34,999 | 14 (6.4%) | 113 (60.1%) |
| $35,000 to $49,999 | 8 (3.7%) | 19 (10.1%) |
| $50,000 to $74,999 | 97 (44.5%) | 18 (9.6%) |
| $75,000 to $99,999 | 45 (20.6%) | 5 (2.7%) |
| $100,000 to $149,999 | 15 (6.9%) | 3 (1.6%) |
| $150,000 or more | 4 (1.8%) | 9 (4.8%) |
| Total | 218 (100.0%) | 188 (100.0%) |
Monthly Housing Cost Tiers in East Camden
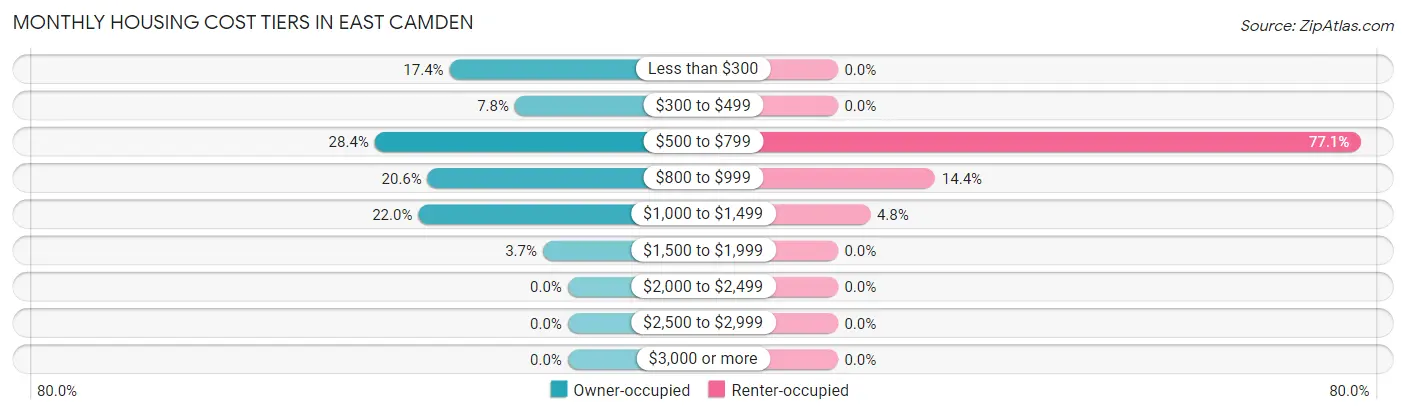
| Monthly Cost | Owner-occupied | Renter-occupied |
| Less than $300 | 38 (17.4%) | 0 (0.0%) |
| $300 to $499 | 17 (7.8%) | 0 (0.0%) |
| $500 to $799 | 62 (28.4%) | 145 (77.1%) |
| $800 to $999 | 45 (20.6%) | 27 (14.4%) |
| $1,000 to $1,499 | 48 (22.0%) | 9 (4.8%) |
| $1,500 to $1,999 | 8 (3.7%) | 0 (0.0%) |
| $2,000 to $2,499 | 0 (0.0%) | 0 (0.0%) |
| $2,500 to $2,999 | 0 (0.0%) | 0 (0.0%) |
| $3,000 or more | 0 (0.0%) | 0 (0.0%) |
| Total | 218 (100.0%) | 188 (100.0%) |
Physical Housing Characteristics in East Camden
Housing Structures in East Camden
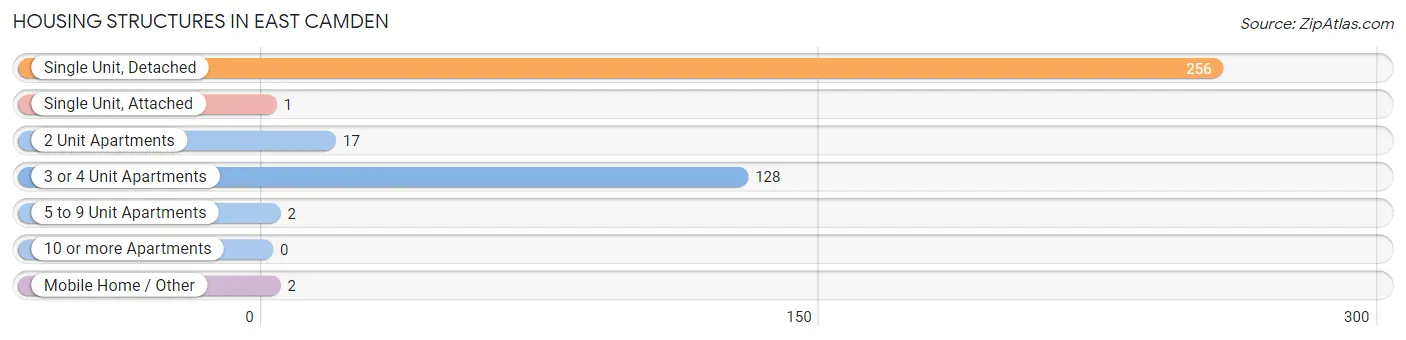
| Structure Type | # Housing Units | % Housing Units |
| Single Unit, Detached | 256 | 63.0% |
| Single Unit, Attached | 1 | 0.3% |
| 2 Unit Apartments | 17 | 4.2% |
| 3 or 4 Unit Apartments | 128 | 31.5% |
| 5 to 9 Unit Apartments | 2 | 0.5% |
| 10 or more Apartments | 0 | 0.0% |
| Mobile Home / Other | 2 | 0.5% |
| Total | 406 | 100.0% |
Housing Structures by Occupancy in East Camden
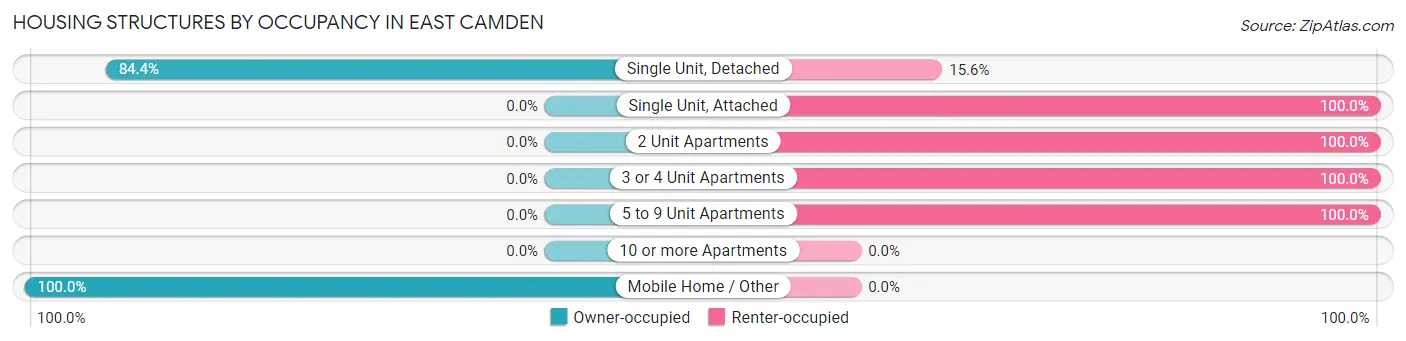
| Structure Type | Owner-occupied | Renter-occupied |
| Single Unit, Detached | 216 (84.4%) | 40 (15.6%) |
| Single Unit, Attached | 0 (0.0%) | 1 (100.0%) |
| 2 Unit Apartments | 0 (0.0%) | 17 (100.0%) |
| 3 or 4 Unit Apartments | 0 (0.0%) | 128 (100.0%) |
| 5 to 9 Unit Apartments | 0 (0.0%) | 2 (100.0%) |
| 10 or more Apartments | 0 (0.0%) | 0 (0.0%) |
| Mobile Home / Other | 2 (100.0%) | 0 (0.0%) |
| Total | 218 (53.7%) | 188 (46.3%) |
Housing Structures by Number of Rooms in East Camden
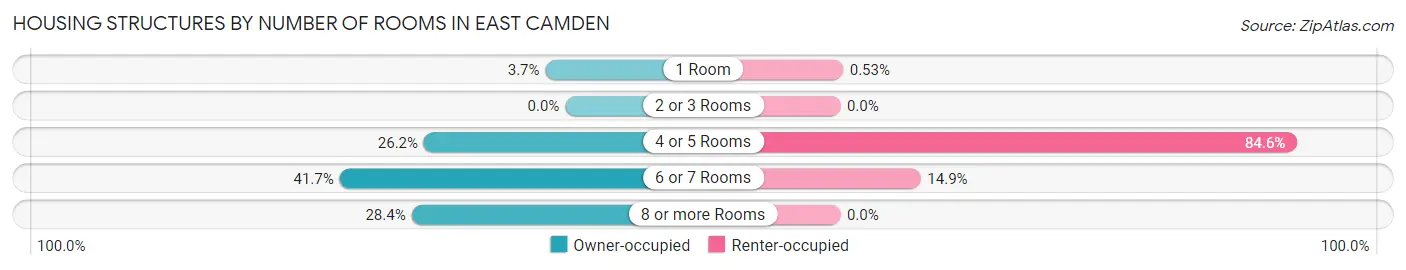
| Number of Rooms | Owner-occupied | Renter-occupied |
| 1 Room | 8 (3.7%) | 1 (0.5%) |
| 2 or 3 Rooms | 0 (0.0%) | 0 (0.0%) |
| 4 or 5 Rooms | 57 (26.2%) | 159 (84.6%) |
| 6 or 7 Rooms | 91 (41.7%) | 28 (14.9%) |
| 8 or more Rooms | 62 (28.4%) | 0 (0.0%) |
| Total | 218 (100.0%) | 188 (100.0%) |
Housing Structure by Heating Type in East Camden
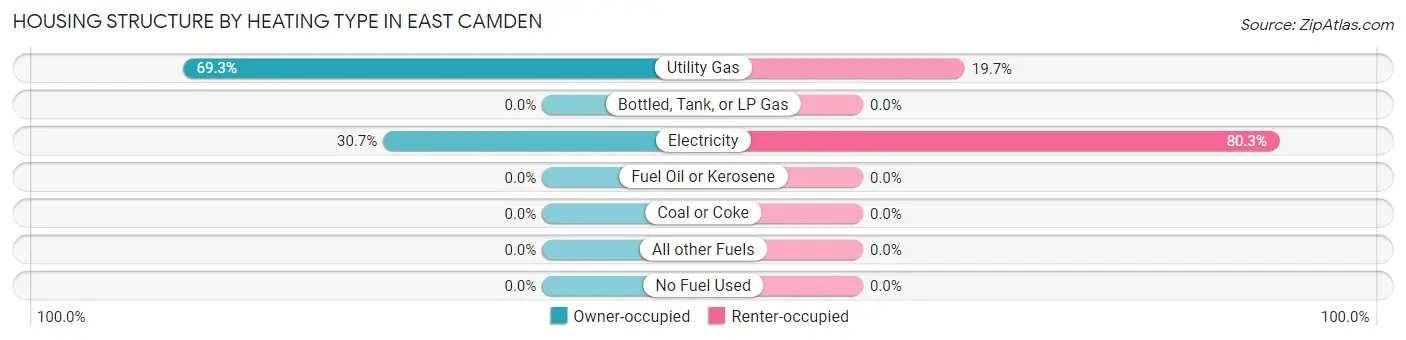
| Heating Type | Owner-occupied | Renter-occupied |
| Utility Gas | 151 (69.3%) | 37 (19.7%) |
| Bottled, Tank, or LP Gas | 0 (0.0%) | 0 (0.0%) |
| Electricity | 67 (30.7%) | 151 (80.3%) |
| Fuel Oil or Kerosene | 0 (0.0%) | 0 (0.0%) |
| Coal or Coke | 0 (0.0%) | 0 (0.0%) |
| All other Fuels | 0 (0.0%) | 0 (0.0%) |
| No Fuel Used | 0 (0.0%) | 0 (0.0%) |
| Total | 218 (100.0%) | 188 (100.0%) |
Household Vehicle Usage in East Camden
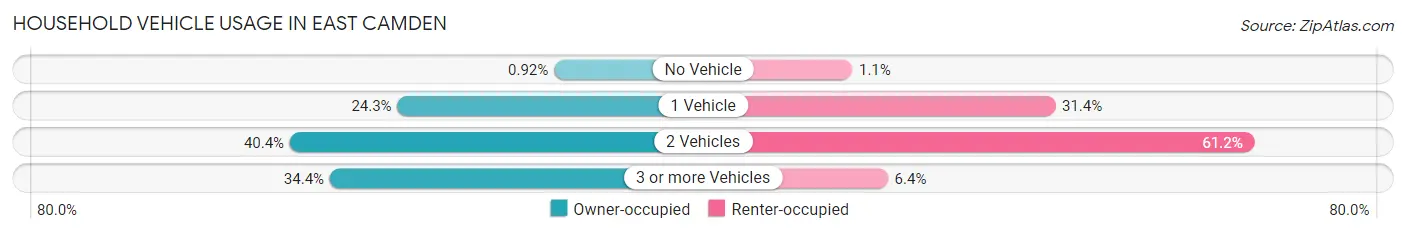
| Vehicles per Household | Owner-occupied | Renter-occupied |
| No Vehicle | 2 (0.9%) | 2 (1.1%) |
| 1 Vehicle | 53 (24.3%) | 59 (31.4%) |
| 2 Vehicles | 88 (40.4%) | 115 (61.2%) |
| 3 or more Vehicles | 75 (34.4%) | 12 (6.4%) |
| Total | 218 (100.0%) | 188 (100.0%) |
Real Estate & Mortgages in East Camden
Real Estate and Mortgage Overview in East Camden
| Characteristic | Without Mortgage | With Mortgage |
| Housing Units | 75 | 143 |
| Median Property Value | $74,200 | $98,800 |
| Median Household Income | $60,875 | $0 |
| Monthly Housing Costs | $299 | $0 |
| Real Estate Taxes | $500 | $40 |
Property Value by Mortgage Status in East Camden
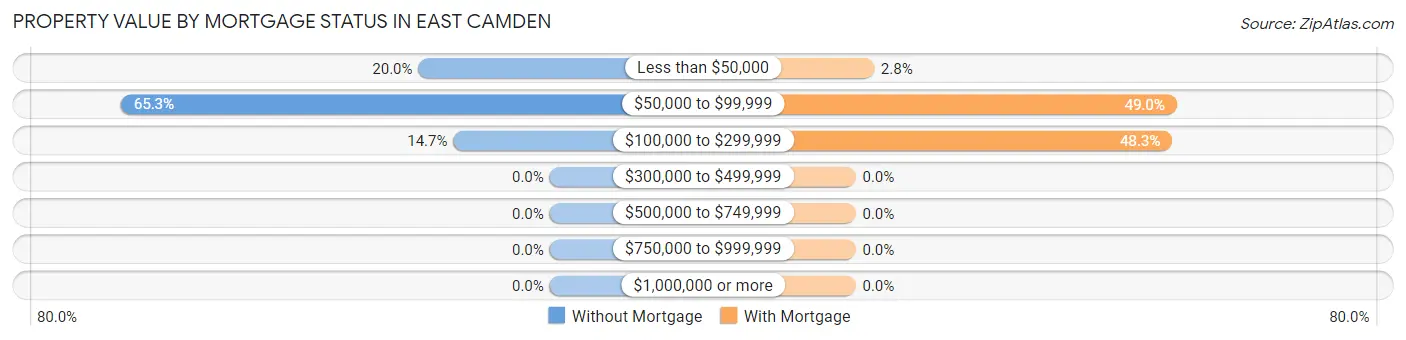
| Property Value | Without Mortgage | With Mortgage |
| Less than $50,000 | 15 (20.0%) | 4 (2.8%) |
| $50,000 to $99,999 | 49 (65.3%) | 70 (48.9%) |
| $100,000 to $299,999 | 11 (14.7%) | 69 (48.2%) |
| $300,000 to $499,999 | 0 (0.0%) | 0 (0.0%) |
| $500,000 to $749,999 | 0 (0.0%) | 0 (0.0%) |
| $750,000 to $999,999 | 0 (0.0%) | 0 (0.0%) |
| $1,000,000 or more | 0 (0.0%) | 0 (0.0%) |
| Total | 75 (100.0%) | 143 (100.0%) |
Household Income by Mortgage Status in East Camden
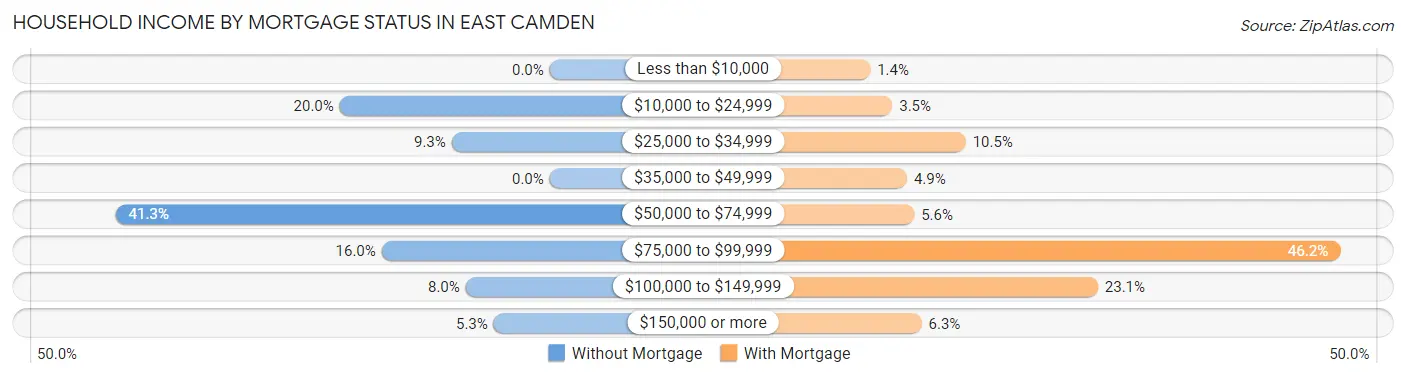
| Household Income | Without Mortgage | With Mortgage |
| Less than $10,000 | 0 (0.0%) | 2 (1.4%) |
| $10,000 to $24,999 | 15 (20.0%) | 5 (3.5%) |
| $25,000 to $34,999 | 7 (9.3%) | 15 (10.5%) |
| $35,000 to $49,999 | 0 (0.0%) | 7 (4.9%) |
| $50,000 to $74,999 | 31 (41.3%) | 8 (5.6%) |
| $75,000 to $99,999 | 12 (16.0%) | 66 (46.2%) |
| $100,000 to $149,999 | 6 (8.0%) | 33 (23.1%) |
| $150,000 or more | 4 (5.3%) | 9 (6.3%) |
| Total | 75 (100.0%) | 143 (100.0%) |
Property Value to Household Income Ratio in East Camden
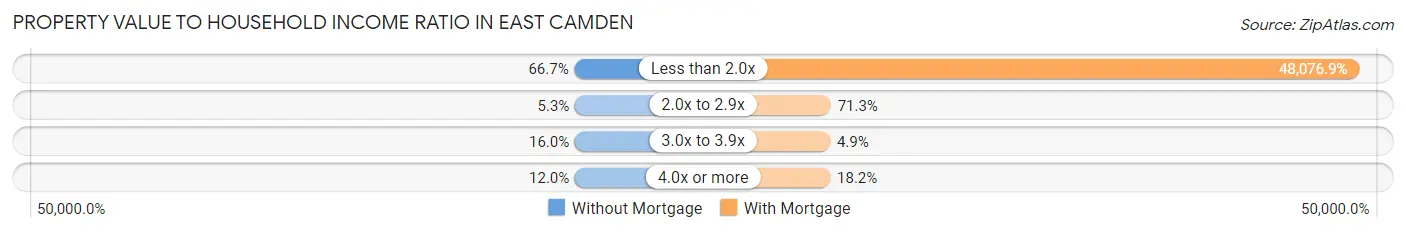
| Value-to-Income Ratio | Without Mortgage | With Mortgage |
| Less than 2.0x | 50 (66.7%) | 68,750 (48,076.9%) |
| 2.0x to 2.9x | 4 (5.3%) | 102 (71.3%) |
| 3.0x to 3.9x | 12 (16.0%) | 7 (4.9%) |
| 4.0x or more | 9 (12.0%) | 26 (18.2%) |
| Total | 75 (100.0%) | 143 (100.0%) |
Real Estate Taxes by Mortgage Status in East Camden
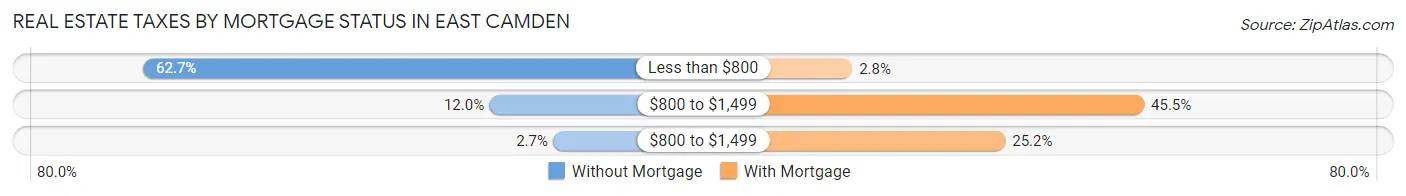
| Property Taxes | Without Mortgage | With Mortgage |
| Less than $800 | 47 (62.7%) | 4 (2.8%) |
| $800 to $1,499 | 9 (12.0%) | 65 (45.5%) |
| $800 to $1,499 | 2 (2.7%) | 36 (25.2%) |
| Total | 75 (100.0%) | 143 (100.0%) |
Health & Disability in East Camden
Health Insurance Coverage by Age in East Camden
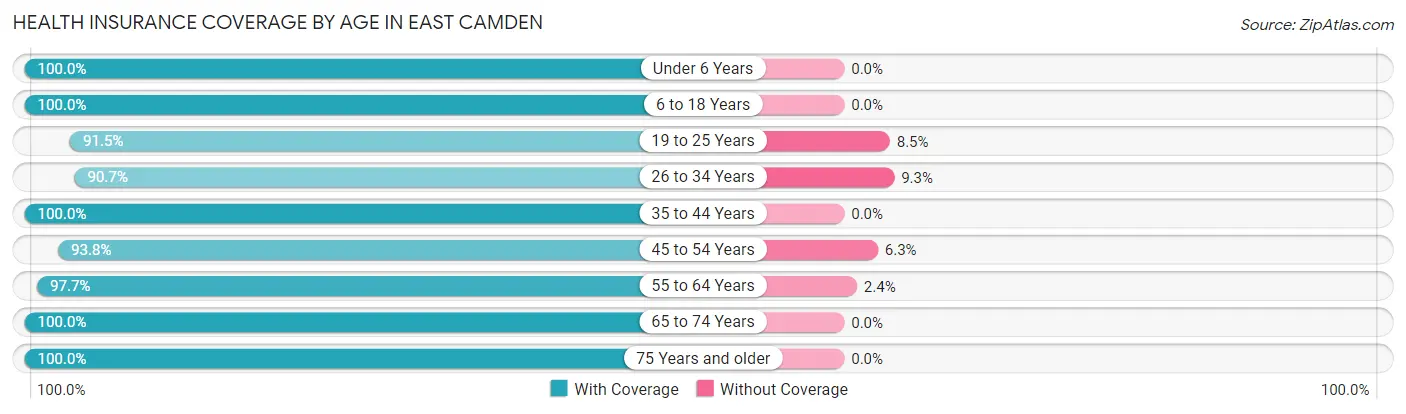
| Age Bracket | With Coverage | Without Coverage |
| Under 6 Years | 76 (100.0%) | 0 (0.0%) |
| 6 to 18 Years | 352 (100.0%) | 0 (0.0%) |
| 19 to 25 Years | 151 (91.5%) | 14 (8.5%) |
| 26 to 34 Years | 185 (90.7%) | 19 (9.3%) |
| 35 to 44 Years | 83 (100.0%) | 0 (0.0%) |
| 45 to 54 Years | 105 (93.8%) | 7 (6.2%) |
| 55 to 64 Years | 83 (97.7%) | 2 (2.4%) |
| 65 to 74 Years | 76 (100.0%) | 0 (0.0%) |
| 75 Years and older | 21 (100.0%) | 0 (0.0%) |
| Total | 1,132 (96.4%) | 42 (3.6%) |
Health Insurance Coverage by Citizenship Status in East Camden
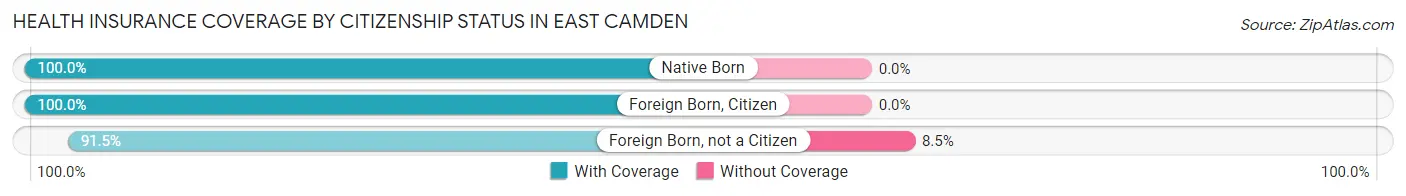
| Citizenship Status | With Coverage | Without Coverage |
| Native Born | 76 (100.0%) | 0 (0.0%) |
| Foreign Born, Citizen | 352 (100.0%) | 0 (0.0%) |
| Foreign Born, not a Citizen | 151 (91.5%) | 14 (8.5%) |
Health Insurance Coverage by Household Income in East Camden
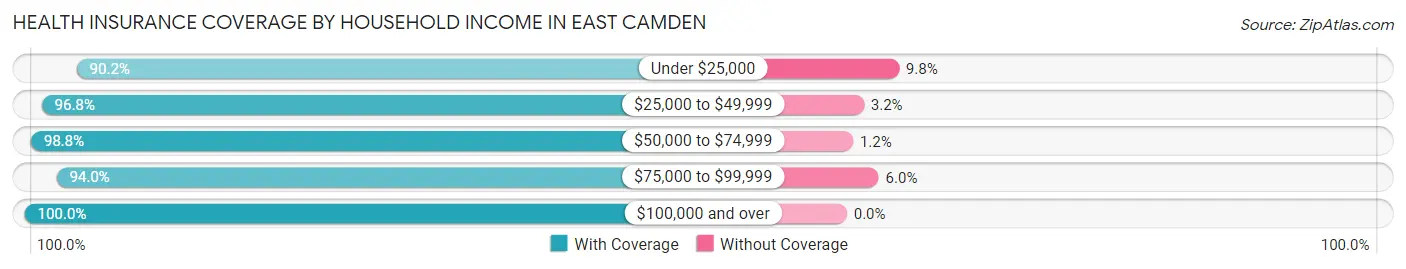
| Household Income | With Coverage | Without Coverage |
| Under $25,000 | 111 (90.2%) | 12 (9.8%) |
| $25,000 to $49,999 | 273 (96.8%) | 9 (3.2%) |
| $50,000 to $74,999 | 425 (98.8%) | 5 (1.2%) |
| $75,000 to $99,999 | 189 (94.0%) | 12 (6.0%) |
| $100,000 and over | 121 (100.0%) | 0 (0.0%) |
Public vs Private Health Insurance Coverage by Age in East Camden
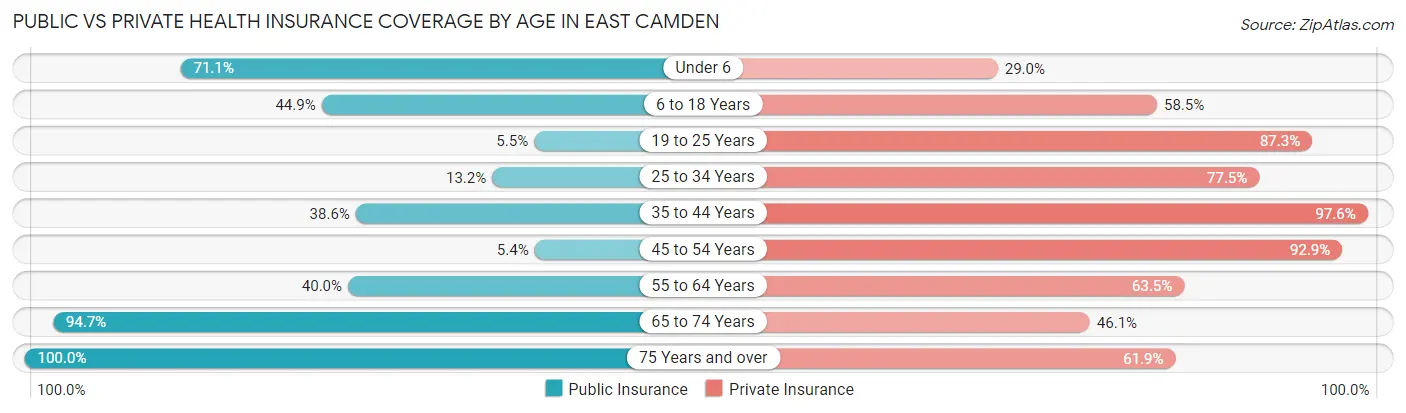
| Age Bracket | Public Insurance | Private Insurance |
| Under 6 | 54 (71.1%) | 22 (28.9%) |
| 6 to 18 Years | 158 (44.9%) | 206 (58.5%) |
| 19 to 25 Years | 9 (5.4%) | 144 (87.3%) |
| 25 to 34 Years | 27 (13.2%) | 158 (77.4%) |
| 35 to 44 Years | 32 (38.6%) | 81 (97.6%) |
| 45 to 54 Years | 6 (5.4%) | 104 (92.9%) |
| 55 to 64 Years | 34 (40.0%) | 54 (63.5%) |
| 65 to 74 Years | 72 (94.7%) | 35 (46.1%) |
| 75 Years and over | 21 (100.0%) | 13 (61.9%) |
| Total | 413 (35.2%) | 817 (69.6%) |
Disability Status by Sex by Age in East Camden
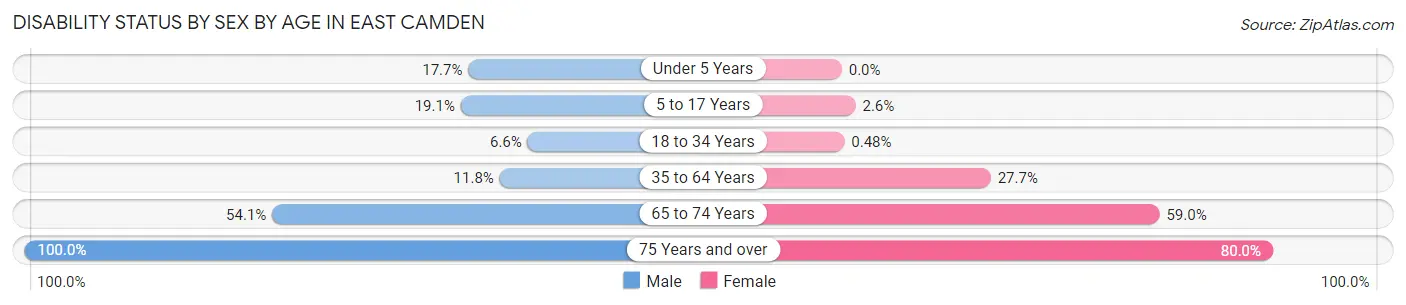
| Age Bracket | Male | Female |
| Under 5 Years | 6 (17.6%) | 0 (0.0%) |
| 5 to 17 Years | 20 (19.1%) | 6 (2.5%) |
| 18 to 34 Years | 13 (6.6%) | 1 (0.5%) |
| 35 to 64 Years | 13 (11.8%) | 47 (27.7%) |
| 65 to 74 Years | 20 (54.0%) | 23 (59.0%) |
| 75 Years and over | 6 (100.0%) | 12 (80.0%) |
Disability Class by Sex by Age in East Camden
Disability Class: Hearing Difficulty
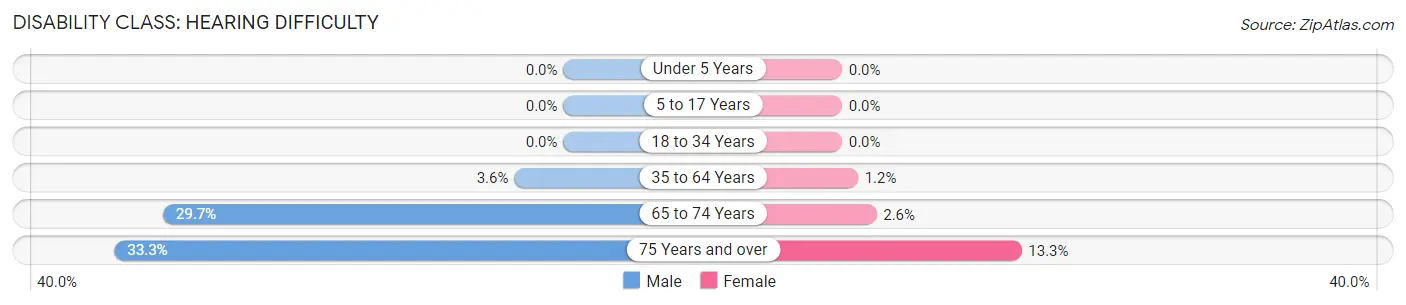
| Age Bracket | Male | Female |
| Under 5 Years | 0 (0.0%) | 0 (0.0%) |
| 5 to 17 Years | 0 (0.0%) | 0 (0.0%) |
| 18 to 34 Years | 0 (0.0%) | 0 (0.0%) |
| 35 to 64 Years | 4 (3.6%) | 2 (1.2%) |
| 65 to 74 Years | 11 (29.7%) | 1 (2.6%) |
| 75 Years and over | 2 (33.3%) | 2 (13.3%) |
Disability Class: Vision Difficulty
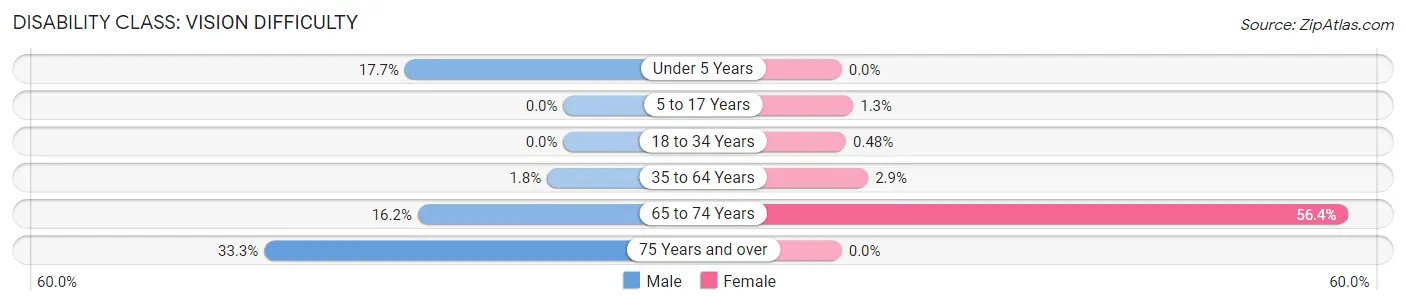
| Age Bracket | Male | Female |
| Under 5 Years | 6 (17.6%) | 0 (0.0%) |
| 5 to 17 Years | 0 (0.0%) | 3 (1.3%) |
| 18 to 34 Years | 0 (0.0%) | 1 (0.5%) |
| 35 to 64 Years | 2 (1.8%) | 5 (2.9%) |
| 65 to 74 Years | 6 (16.2%) | 22 (56.4%) |
| 75 Years and over | 2 (33.3%) | 0 (0.0%) |
Disability Class: Cognitive Difficulty
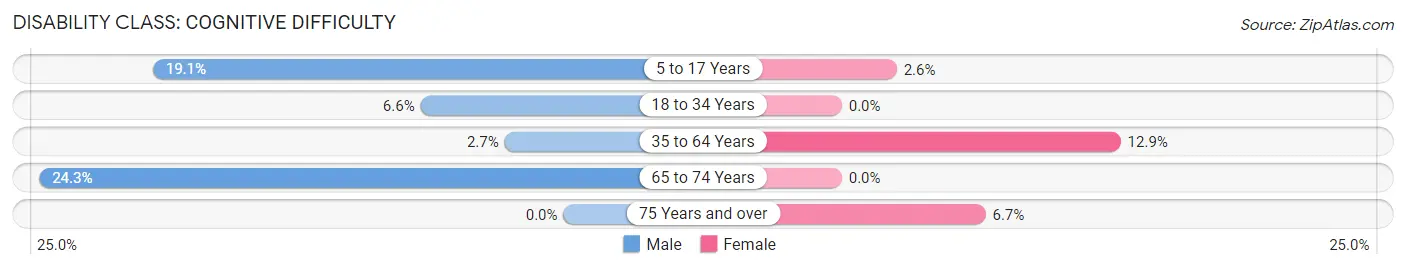
| Age Bracket | Male | Female |
| 5 to 17 Years | 20 (19.1%) | 6 (2.5%) |
| 18 to 34 Years | 13 (6.6%) | 0 (0.0%) |
| 35 to 64 Years | 3 (2.7%) | 22 (12.9%) |
| 65 to 74 Years | 9 (24.3%) | 0 (0.0%) |
| 75 Years and over | 0 (0.0%) | 1 (6.7%) |
Disability Class: Ambulatory Difficulty
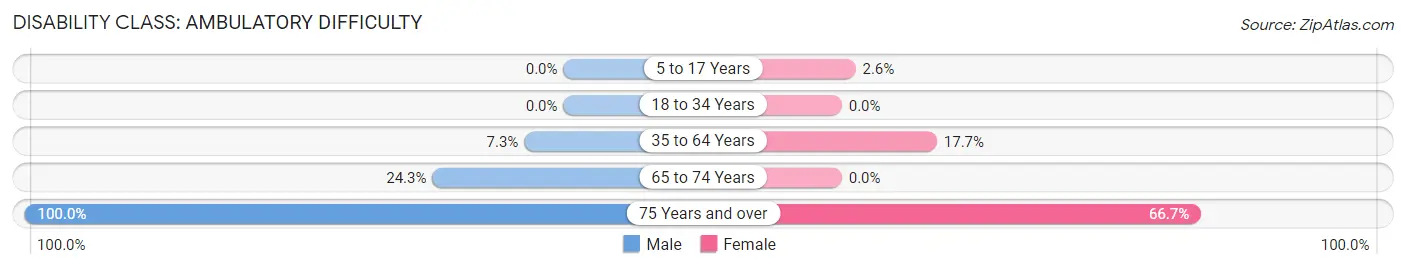
| Age Bracket | Male | Female |
| 5 to 17 Years | 0 (0.0%) | 6 (2.5%) |
| 18 to 34 Years | 0 (0.0%) | 0 (0.0%) |
| 35 to 64 Years | 8 (7.3%) | 30 (17.6%) |
| 65 to 74 Years | 9 (24.3%) | 0 (0.0%) |
| 75 Years and over | 6 (100.0%) | 10 (66.7%) |
Disability Class: Self-Care Difficulty
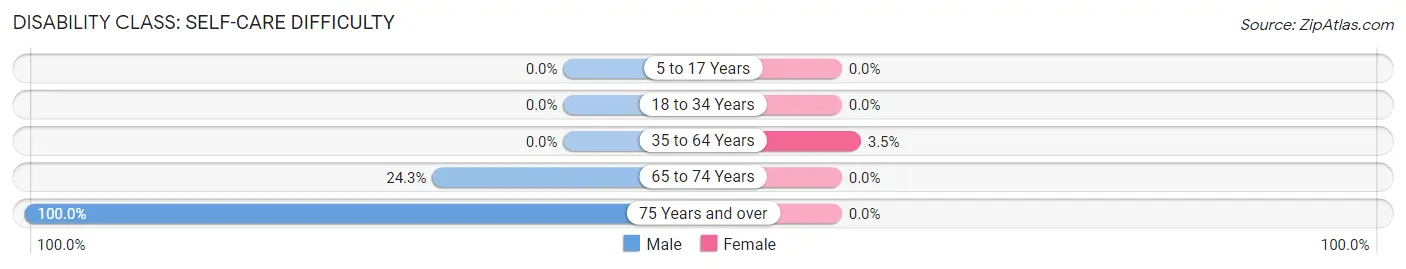
| Age Bracket | Male | Female |
| 5 to 17 Years | 0 (0.0%) | 0 (0.0%) |
| 18 to 34 Years | 0 (0.0%) | 0 (0.0%) |
| 35 to 64 Years | 0 (0.0%) | 6 (3.5%) |
| 65 to 74 Years | 9 (24.3%) | 0 (0.0%) |
| 75 Years and over | 6 (100.0%) | 0 (0.0%) |
Technology Access in East Camden
Computing Device Access in East Camden
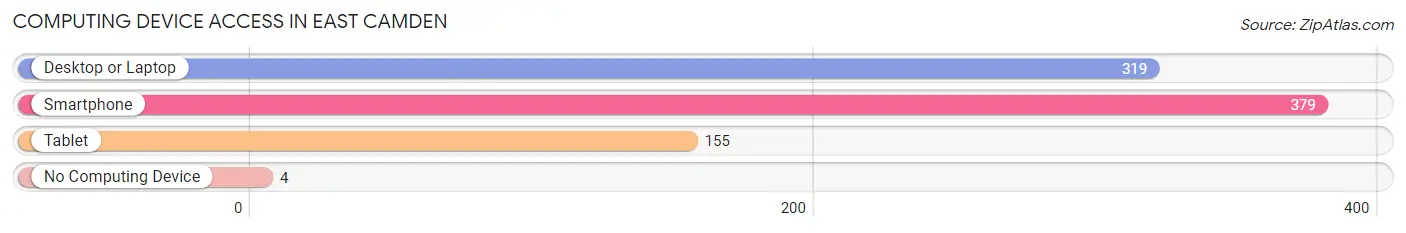
| Device Type | # Households | % Households |
| Desktop or Laptop | 319 | 78.6% |
| Smartphone | 379 | 93.3% |
| Tablet | 155 | 38.2% |
| No Computing Device | 4 | 1.0% |
| Total | 406 | 100.0% |
Internet Access in East Camden
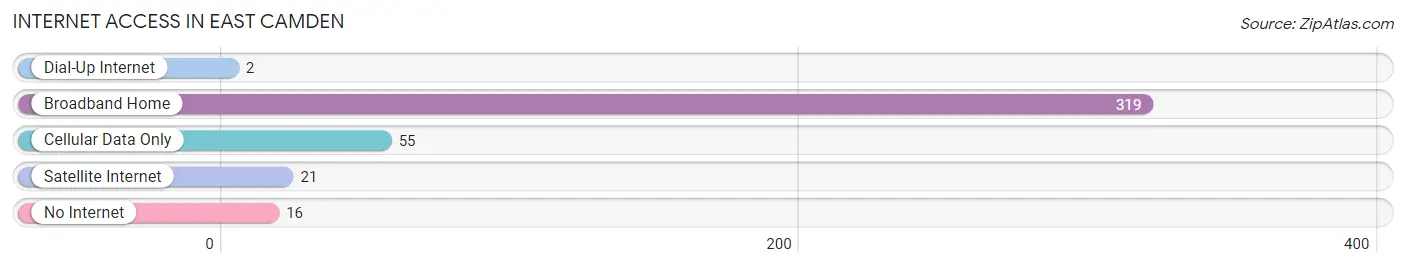
| Internet Type | # Households | % Households |
| Dial-Up Internet | 2 | 0.5% |
| Broadband Home | 319 | 78.6% |
| Cellular Data Only | 55 | 13.6% |
| Satellite Internet | 21 | 5.2% |
| No Internet | 16 | 3.9% |
| Total | 406 | 100.0% |
East Camden Summary
Camden, Arkansas is a city located in Ouachita County in the south-central part of the state. It is the county seat and the largest city in the county. Camden is located on the Ouachita River, approximately 100 miles south of Little Rock. The city has a population of 12,183 as of the 2010 census.
History
The area that is now Camden was first settled in the early 1800s by settlers from the United States and Europe. The first permanent settlement was established in 1819 by William P. King, who named the settlement after his hometown of Camden, South Carolina. The settlement was incorporated in 1844 and was named the county seat of Ouachita County in 1846.
The city was a major center of the cotton industry in the 19th century, and the economy was further bolstered by the arrival of the railroad in 1873. The city was also the site of a major Civil War battle in 1864, when Union forces under General Frederick Steele defeated Confederate forces under General Sterling Price.
Geography
Camden is located in south-central Arkansas, approximately 100 miles south of Little Rock. The city is situated on the Ouachita River, which forms the western boundary of the city. The city has a total area of 16.2 square miles, of which 15.9 square miles is land and 0.3 square miles is water.
The city is located in the Ouachita Mountains, a range of low mountains that run through the state. The city is located in a humid subtropical climate zone, with hot, humid summers and mild winters. The average annual temperature is 64°F, and the average annual precipitation is 48.5 inches.
Economy
The economy of Camden is largely based on manufacturing and agriculture. The city is home to several manufacturing plants, including a paper mill, a steel mill, and a chemical plant. The city is also home to several agricultural operations, including poultry farms, cattle ranches, and timber operations.
The city is also home to several retail and service businesses, including restaurants, hotels, and banks. The city is also home to a regional medical center, which provides medical care to the surrounding area.
Demographics
As of the 2010 census, the population of Camden was 12,183. The racial makeup of the city was 68.3% White, 28.2% African American, 0.4% Native American, 0.7% Asian, 0.1% Pacific Islander, 0.7% from other races, and 1.6% from two or more races. Hispanic or Latino of any race were 2.2% of the population.
The median income for a household in the city was $30,945, and the median income for a family was $37,945. The per capita income for the city was $17,845. About 19.2% of families and 22.7% of the population were below the poverty line, including 33.2% of those under age 18 and 16.2% of those age 65 or over.
Common Questions
What is Per Capita Income in East Camden?
Per Capita income in East Camden is $19,341.
What is the Median Family Income in East Camden?
Median Family Income in East Camden is $43,125.
What is the Median Household income in East Camden?
Median Household Income in East Camden is $41,667.
What is Income or Wage Gap in East Camden?
Income or Wage Gap in East Camden is 19.9%.
Women in East Camden earn 80.1 cents for every dollar earned by a man.
What is Inequality or Gini Index in East Camden?
Inequality or Gini Index in East Camden is 0.37.
What is the Total Population of East Camden?
Total Population of East Camden is 1,174.
What is the Total Male Population of East Camden?
Total Male Population of East Camden is 488.
What is the Total Female Population of East Camden?
Total Female Population of East Camden is 686.
What is the Ratio of Males per 100 Females in East Camden?
There are 71.14 Males per 100 Females in East Camden.
What is the Ratio of Females per 100 Males in East Camden?
There are 140.57 Females per 100 Males in East Camden.
What is the Median Population Age in East Camden?
Median Population Age in East Camden is 25.6 Years.
What is the Average Family Size in East Camden
Average Family Size in East Camden is 3.2 People.
What is the Average Household Size in East Camden
Average Household Size in East Camden is 2.9 People.
How Large is the Labor Force in East Camden?
There are 533 People in the Labor Forcein in East Camden.
What is the Percentage of People in the Labor Force in East Camden?
63.9% of People are in the Labor Force in East Camden.
What is the Unemployment Rate in East Camden?
Unemployment Rate in East Camden is 6.8%.