Newark, AR Map & Demographics
Newark Map
Newark Overview
$20,214
PER CAPITA INCOME
$44,554
AVG FAMILY INCOME
$33,103
AVG HOUSEHOLD INCOME
16.5%
WAGE / INCOME GAP [ % ]
83.5¢/ $1
WAGE / INCOME GAP [ $ ]
$13,801
FAMILY INCOME DEFICIT
0.46
INEQUALITY / GINI INDEX
1,421
TOTAL POPULATION
678
MALE POPULATION
743
FEMALE POPULATION
91.25
MALES / 100 FEMALES
109.59
FEMALES / 100 MALES
35.1
MEDIAN AGE
3.4
AVG FAMILY SIZE
2.6
AVG HOUSEHOLD SIZE
503
LABOR FORCE [ PEOPLE ]
47.3%
PERCENT IN LABOR FORCE
3.0%
UNEMPLOYMENT RATE
Newark Zip Codes
Newark Area Codes
Income in Newark
Income Overview in Newark
Per Capita Income in Newark is $20,214, while median incomes of families and households are $44,554 and $33,103 respectively.
| Characteristic | Number | Measure |
| Per Capita Income | 1,421 | $20,214 |
| Median Family Income | 330 | $44,554 |
| Mean Family Income | 330 | $57,755 |
| Median Household Income | 544 | $33,103 |
| Mean Household Income | 544 | $48,221 |
| Income Deficit | 330 | $13,801 |
| Wage / Income Gap (%) | 1,421 | 16.55% |
| Wage / Income Gap ($) | 1,421 | 83.45¢ per $1 |
| Gini / Inequality Index | 1,421 | 0.46 |
Earnings by Sex in Newark
Average Earnings in Newark are $32,708, $34,450 for men and $28,750 for women, a difference of 16.6%.
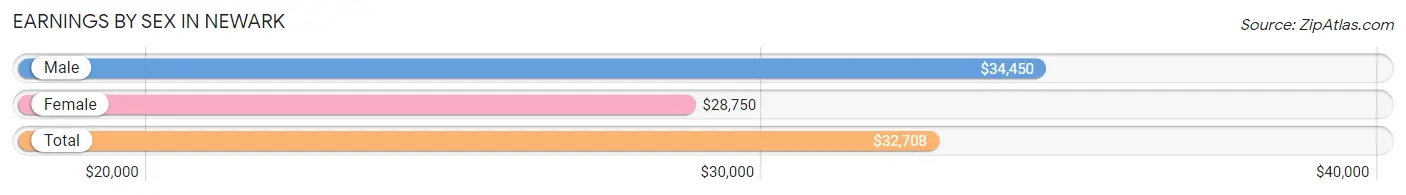
| Sex | Number | Average Earnings |
| Male | 263 (50.1%) | $34,450 |
| Female | 262 (49.9%) | $28,750 |
| Total | 525 (100.0%) | $32,708 |
Earnings by Sex by Income Bracket in Newark
The most common earnings brackets in Newark are $30,000 to $34,999 for men (36 | 13.7%) and $30,000 to $34,999 for women (40 | 15.3%).
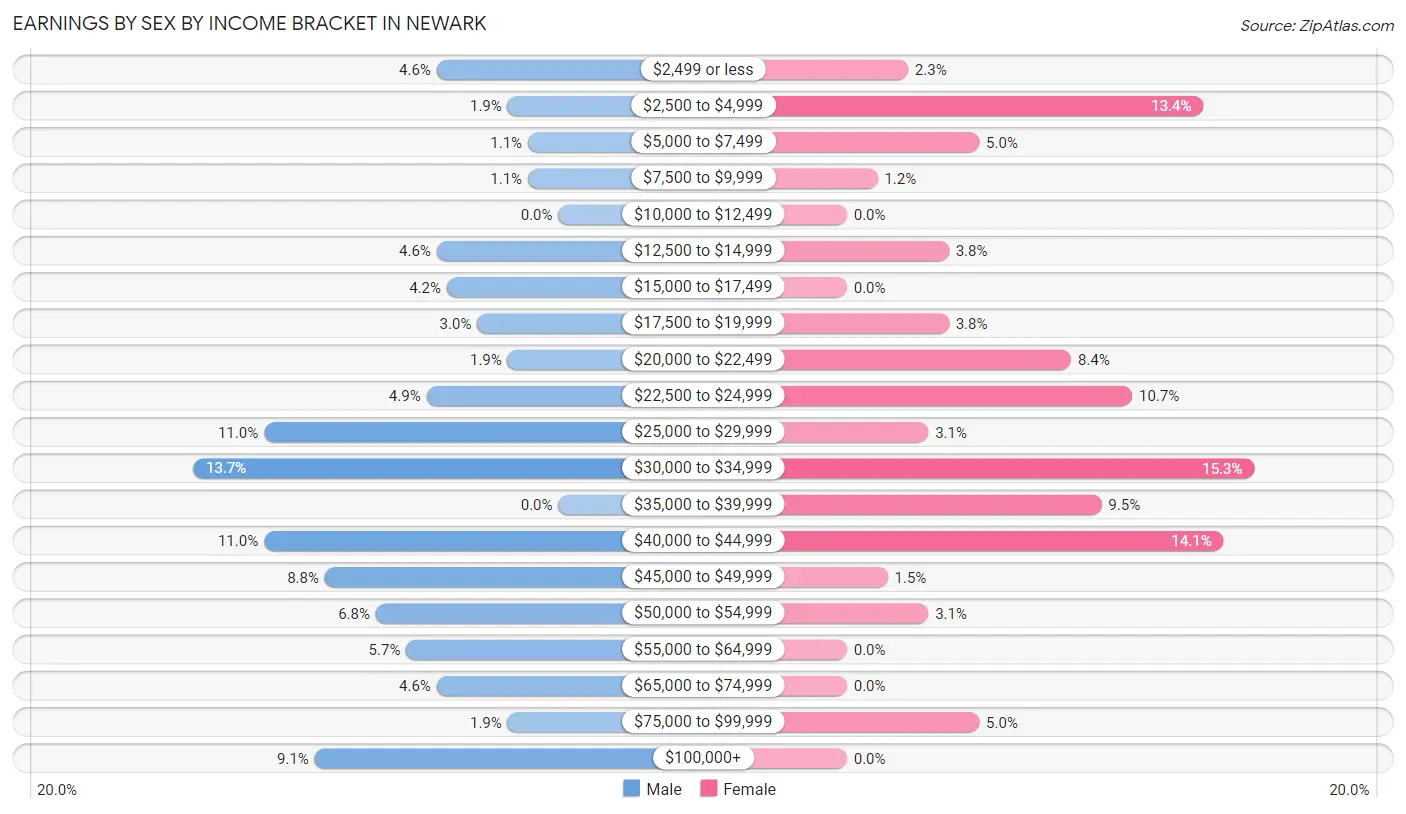
| Income | Male | Female |
| $2,499 or less | 12 (4.6%) | 6 (2.3%) |
| $2,500 to $4,999 | 5 (1.9%) | 35 (13.4%) |
| $5,000 to $7,499 | 3 (1.1%) | 13 (5.0%) |
| $7,500 to $9,999 | 3 (1.1%) | 3 (1.1%) |
| $10,000 to $12,499 | 0 (0.0%) | 0 (0.0%) |
| $12,500 to $14,999 | 12 (4.6%) | 10 (3.8%) |
| $15,000 to $17,499 | 11 (4.2%) | 0 (0.0%) |
| $17,500 to $19,999 | 8 (3.0%) | 10 (3.8%) |
| $20,000 to $22,499 | 5 (1.9%) | 22 (8.4%) |
| $22,500 to $24,999 | 13 (4.9%) | 28 (10.7%) |
| $25,000 to $29,999 | 29 (11.0%) | 8 (3.0%) |
| $30,000 to $34,999 | 36 (13.7%) | 40 (15.3%) |
| $35,000 to $39,999 | 0 (0.0%) | 25 (9.5%) |
| $40,000 to $44,999 | 29 (11.0%) | 37 (14.1%) |
| $45,000 to $49,999 | 23 (8.7%) | 4 (1.5%) |
| $50,000 to $54,999 | 18 (6.8%) | 8 (3.0%) |
| $55,000 to $64,999 | 15 (5.7%) | 0 (0.0%) |
| $65,000 to $74,999 | 12 (4.6%) | 0 (0.0%) |
| $75,000 to $99,999 | 5 (1.9%) | 13 (5.0%) |
| $100,000+ | 24 (9.1%) | 0 (0.0%) |
| Total | 263 (100.0%) | 262 (100.0%) |
Earnings by Sex by Educational Attainment in Newark
Average earnings in Newark are $41,364 for men and $33,534 for women, a difference of 18.9%. Men with an educational attainment of college or associate's degree enjoy the highest average annual earnings of $50,750, while those with high school diploma education earn the least with $33,864. Women with an educational attainment of less than high school earn the most with the average annual earnings of $33,438, while those with high school diploma education have the smallest earnings of $30,750.
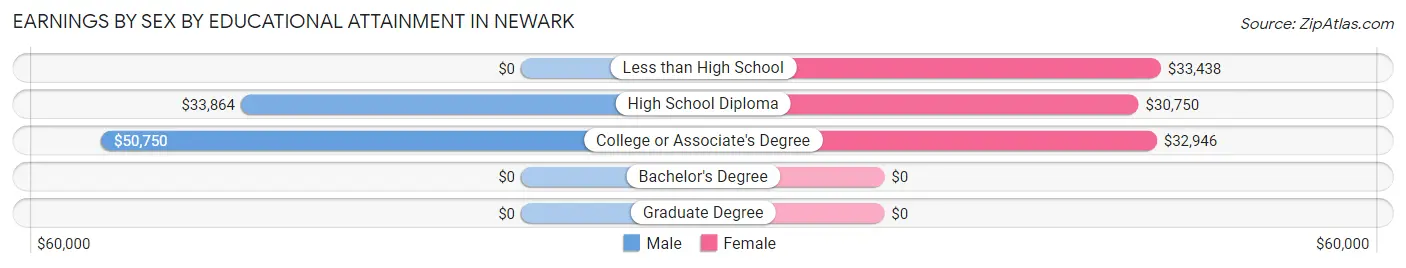
| Educational Attainment | Male Income | Female Income |
| Less than High School | - | - |
| High School Diploma | $33,864 | $30,750 |
| College or Associate's Degree | $50,750 | $32,946 |
| Bachelor's Degree | - | - |
| Graduate Degree | - | - |
| Total | $41,364 | $33,534 |
Family Income in Newark
Family Income Brackets in Newark
According to the Newark family income data, there are 65 families falling into the $50,000 to $74,999 income range, which is the most common income bracket and makes up 19.7% of all families. Conversely, the $200,000+ income bracket is the least frequent group with only 9 families (2.7%) belonging to this category.
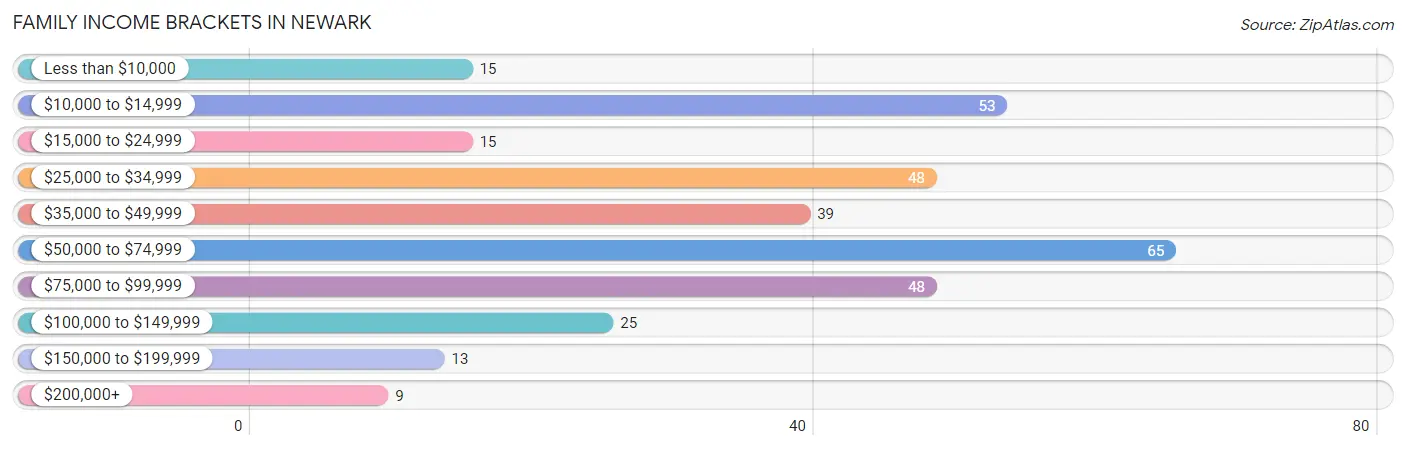
| Income Bracket | # Families | % Families |
| Less than $10,000 | 15 | 4.5% |
| $10,000 to $14,999 | 53 | 16.1% |
| $15,000 to $24,999 | 15 | 4.5% |
| $25,000 to $34,999 | 48 | 14.5% |
| $35,000 to $49,999 | 39 | 11.8% |
| $50,000 to $74,999 | 65 | 19.7% |
| $75,000 to $99,999 | 48 | 14.5% |
| $100,000 to $149,999 | 25 | 7.6% |
| $150,000 to $199,999 | 13 | 3.9% |
| $200,000+ | 9 | 2.7% |
Family Income by Famaliy Size in Newark
5-person families (24 | 7.3%) account for the highest median family income in Newark with $63,000 per family, while 2-person families (119 | 36.1%) have the highest median income of $28,542 per family member.
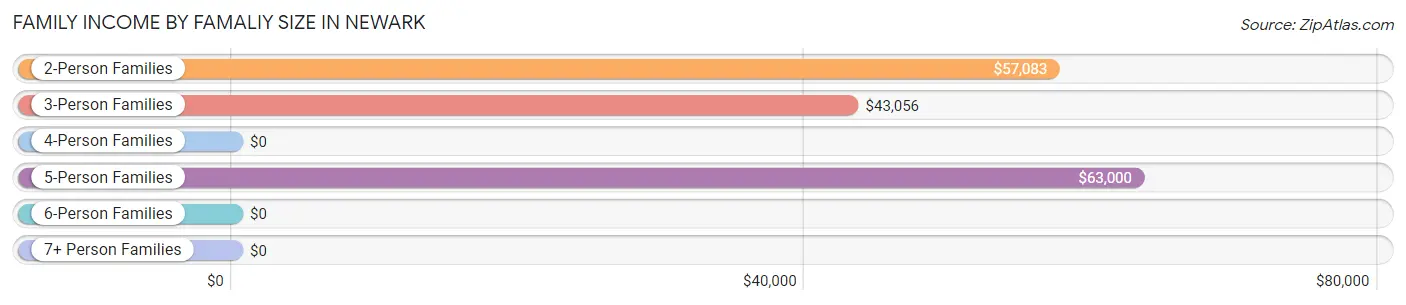
| Income Bracket | # Families | Median Income |
| 2-Person Families | 119 (36.1%) | $57,083 |
| 3-Person Families | 80 (24.2%) | $43,056 |
| 4-Person Families | 107 (32.4%) | $0 |
| 5-Person Families | 24 (7.3%) | $63,000 |
| 6-Person Families | 0 (0.0%) | $0 |
| 7+ Person Families | 0 (0.0%) | $0 |
| Total | 330 (100.0%) | $44,554 |
Family Income by Number of Earners in Newark
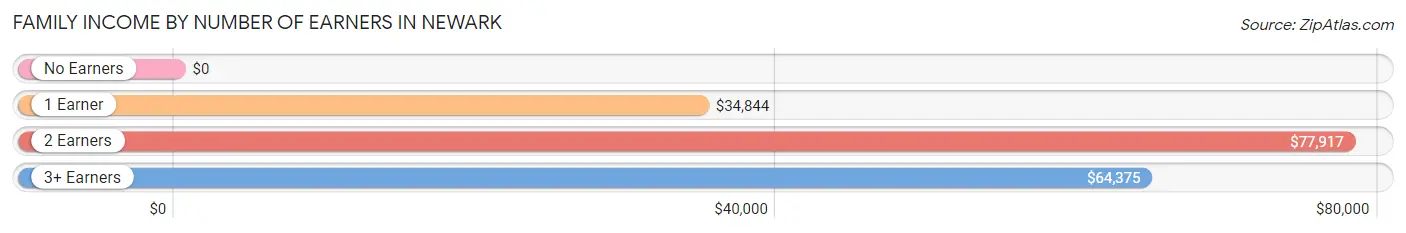
| Number of Earners | # Families | Median Income |
| No Earners | 102 (30.9%) | $0 |
| 1 Earner | 95 (28.8%) | $34,844 |
| 2 Earners | 116 (35.1%) | $77,917 |
| 3+ Earners | 17 (5.1%) | $64,375 |
| Total | 330 (100.0%) | $44,554 |
Household Income in Newark
Household Income Brackets in Newark
With 98 households falling in the category, the $10,000 to $14,999 income range is the most frequent in Newark, accounting for 18.0% of all households. In contrast, only 9 households (1.7%) fall into the $200,000+ income bracket, making it the least populous group.
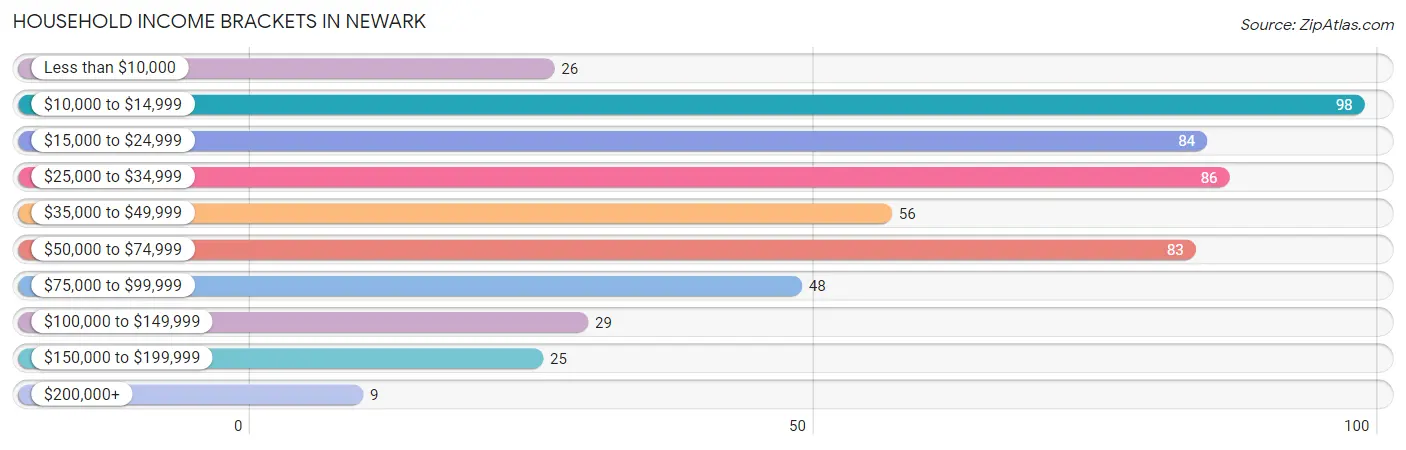
| Income Bracket | # Households | % Households |
| Less than $10,000 | 26 | 4.8% |
| $10,000 to $14,999 | 98 | 18.0% |
| $15,000 to $24,999 | 84 | 15.4% |
| $25,000 to $34,999 | 86 | 15.8% |
| $35,000 to $49,999 | 56 | 10.3% |
| $50,000 to $74,999 | 83 | 15.3% |
| $75,000 to $99,999 | 48 | 8.8% |
| $100,000 to $149,999 | 29 | 5.3% |
| $150,000 to $199,999 | 25 | 4.6% |
| $200,000+ | 9 | 1.7% |
Household Income by Householder Age in Newark
The median household income in Newark is $33,103, with the highest median household income of $38,750 found in the 45 to 64 years age bracket for the primary householder. A total of 146 households (26.8%) fall into this category. Meanwhile, the 15 to 24 years age bracket for the primary householder has the lowest median household income of $0, with 33 households (6.1%) in this group.
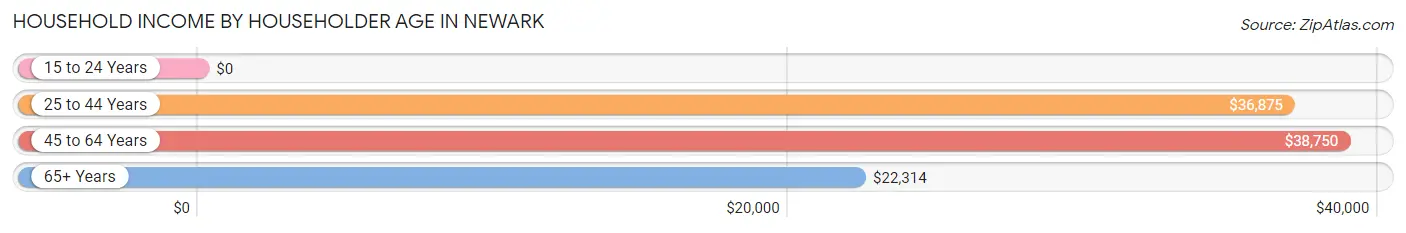
| Income Bracket | # Households | Median Income |
| 15 to 24 Years | 33 (6.1%) | $0 |
| 25 to 44 Years | 194 (35.7%) | $36,875 |
| 45 to 64 Years | 146 (26.8%) | $38,750 |
| 65+ Years | 171 (31.4%) | $22,314 |
| Total | 544 (100.0%) | $33,103 |
Poverty in Newark
Income Below Poverty by Sex and Age in Newark
With 27.4% poverty level for males and 37.2% for females among the residents of Newark, 6 to 11 year old males and 12 to 14 year old females are the most vulnerable to poverty, with 86 males (77.5%) and 80 females (91.9%) in their respective age groups living below the poverty level.
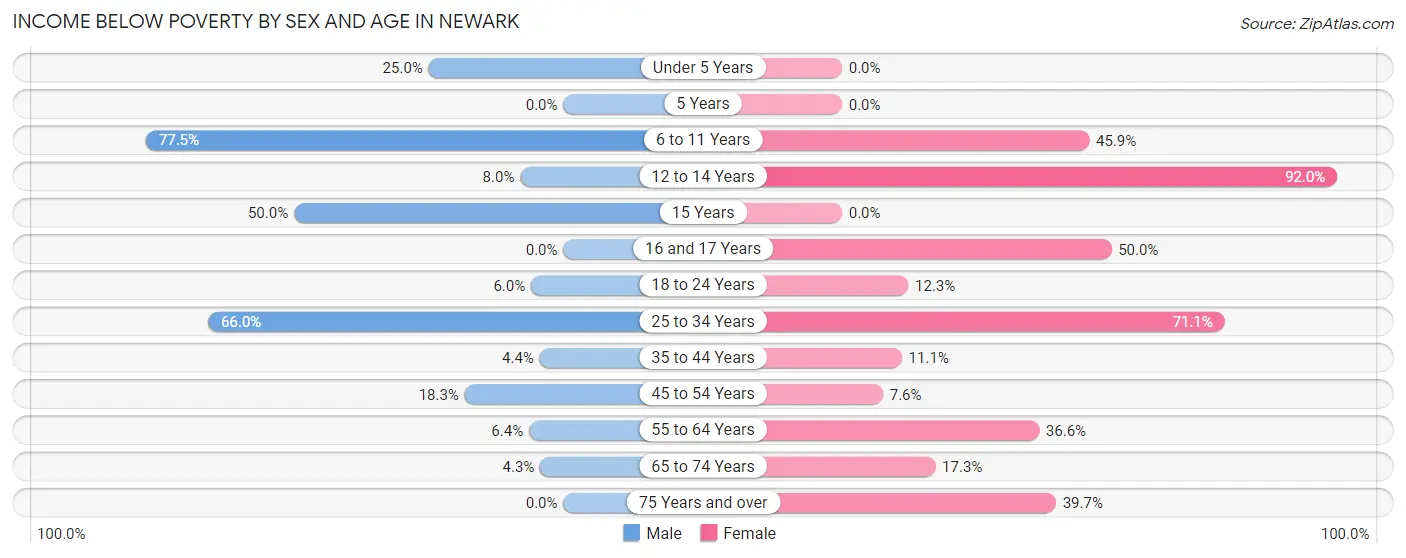
| Age Bracket | Male | Female |
| Under 5 Years | 3 (25.0%) | 0 (0.0%) |
| 5 Years | 0 (0.0%) | 0 (0.0%) |
| 6 to 11 Years | 86 (77.5%) | 28 (45.9%) |
| 12 to 14 Years | 2 (8.0%) | 80 (91.9%) |
| 15 Years | 3 (50.0%) | 0 (0.0%) |
| 16 and 17 Years | 0 (0.0%) | 3 (50.0%) |
| 18 to 24 Years | 3 (6.0%) | 8 (12.3%) |
| 25 to 34 Years | 62 (66.0%) | 86 (71.1%) |
| 35 to 44 Years | 4 (4.4%) | 8 (11.1%) |
| 45 to 54 Years | 13 (18.3%) | 7 (7.6%) |
| 55 to 64 Years | 6 (6.4%) | 15 (36.6%) |
| 65 to 74 Years | 4 (4.3%) | 13 (17.3%) |
| 75 Years and over | 0 (0.0%) | 27 (39.7%) |
| Total | 186 (27.4%) | 275 (37.2%) |
Income Above Poverty by Sex and Age in Newark
According to the poverty statistics in Newark, males aged 16 and 17 years and females aged under 5 years are the age groups that are most secure financially, with 100.0% of males and 100.0% of females in these age groups living above the poverty line.
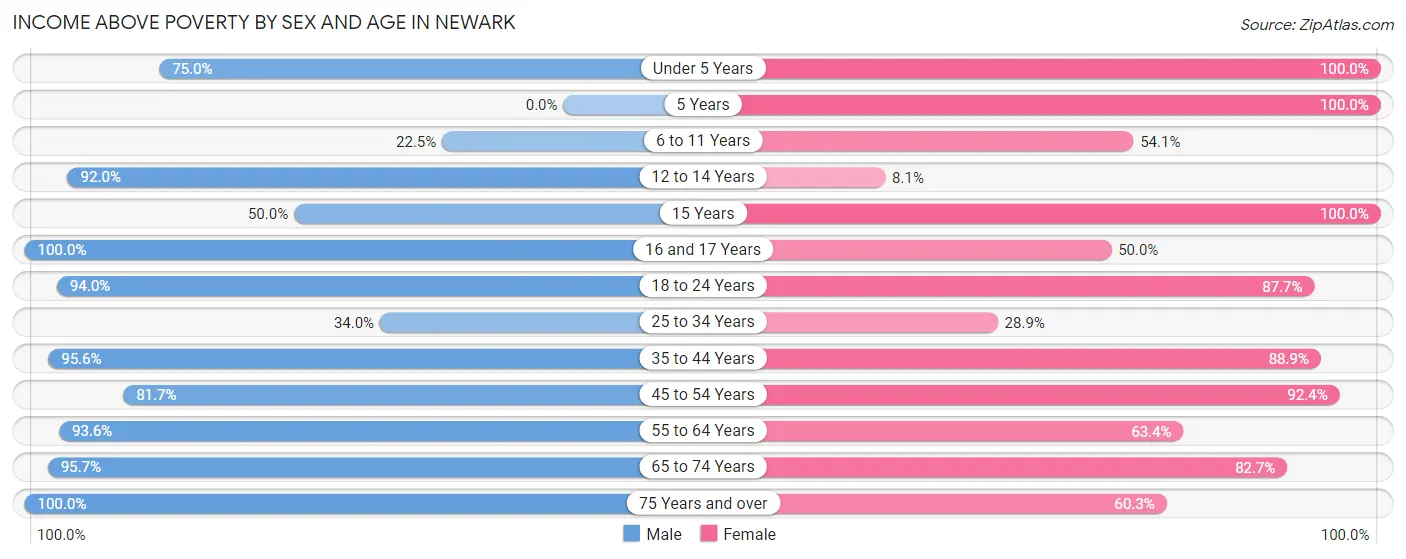
| Age Bracket | Male | Female |
| Under 5 Years | 9 (75.0%) | 18 (100.0%) |
| 5 Years | 0 (0.0%) | 4 (100.0%) |
| 6 to 11 Years | 25 (22.5%) | 33 (54.1%) |
| 12 to 14 Years | 23 (92.0%) | 7 (8.1%) |
| 15 Years | 3 (50.0%) | 29 (100.0%) |
| 16 and 17 Years | 15 (100.0%) | 3 (50.0%) |
| 18 to 24 Years | 47 (94.0%) | 57 (87.7%) |
| 25 to 34 Years | 32 (34.0%) | 35 (28.9%) |
| 35 to 44 Years | 87 (95.6%) | 64 (88.9%) |
| 45 to 54 Years | 58 (81.7%) | 85 (92.4%) |
| 55 to 64 Years | 88 (93.6%) | 26 (63.4%) |
| 65 to 74 Years | 89 (95.7%) | 62 (82.7%) |
| 75 Years and over | 16 (100.0%) | 41 (60.3%) |
| Total | 492 (72.6%) | 464 (62.8%) |
Income Below Poverty Among Married-Couple Families in Newark
The poverty statistics for married-couple families in Newark show that 32.6% or 79 of the total 242 families live below the poverty line. Families with 1 or 2 children have the highest poverty rate of 57.5%, comprising of 77 families. On the other hand, families with no children have the lowest poverty rate of 1.8%, which includes 2 families.
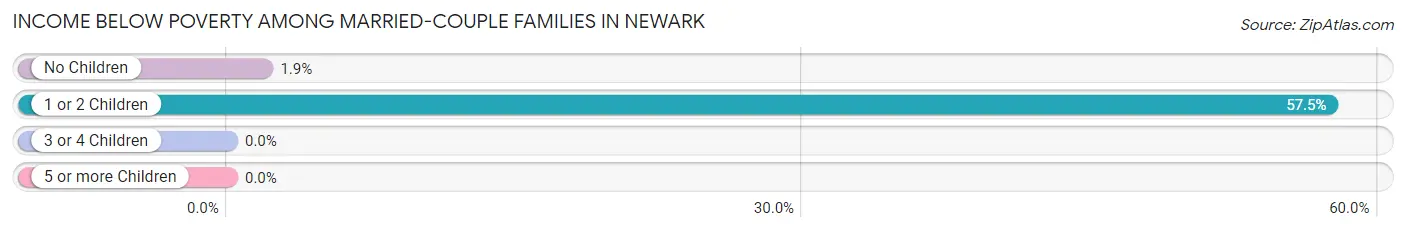
| Children | Above Poverty | Below Poverty |
| No Children | 106 (98.2%) | 2 (1.8%) |
| 1 or 2 Children | 57 (42.5%) | 77 (57.5%) |
| 3 or 4 Children | 0 (0.0%) | 0 (0.0%) |
| 5 or more Children | 0 (0.0%) | 0 (0.0%) |
| Total | 163 (67.4%) | 79 (32.6%) |
Income Below Poverty Among Single-Parent Households in Newark
| Children | Single Father | Single Mother |
| No Children | 0 (0.0%) | 3 (11.5%) |
| 1 or 2 Children | 0 (0.0%) | 1 (4.8%) |
| 3 or 4 Children | 0 (0.0%) | 3 (33.3%) |
| 5 or more Children | 0 (0.0%) | 0 (0.0%) |
| Total | 0 (0.0%) | 7 (12.5%) |
Income Below Poverty Among Married-Couple vs Single-Parent Households in Newark
The poverty data for Newark shows that 79 of the married-couple family households (32.6%) and 7 of the single-parent households (8.0%) are living below the poverty level. Within the married-couple family households, those with 1 or 2 children have the highest poverty rate, with 77 households (57.5%) falling below the poverty line. Among the single-parent households, those with 3 or 4 children have the highest poverty rate, with 3 household (33.3%) living below poverty.
| Children | Married-Couple Families | Single-Parent Households |
| No Children | 2 (1.8%) | 3 (11.5%) |
| 1 or 2 Children | 77 (57.5%) | 1 (1.9%) |
| 3 or 4 Children | 0 (0.0%) | 3 (33.3%) |
| 5 or more Children | 0 (0.0%) | 0 (0.0%) |
| Total | 79 (32.6%) | 7 (8.0%) |
Race in Newark
The most populous races in Newark are White / Caucasian (1,356 | 95.4%), Two or more Races (61 | 4.3%), and Hispanic or Latino (34 | 2.4%).
| Race | # Population | % Population |
| Asian | 0 | 0.0% |
| Black / African American | 0 | 0.0% |
| Hawaiian / Pacific | 0 | 0.0% |
| Hispanic or Latino | 34 | 2.4% |
| Native / Alaskan | 0 | 0.0% |
| White / Caucasian | 1,356 | 95.4% |
| Two or more Races | 61 | 4.3% |
| Some other Race | 4 | 0.3% |
| Total | 1,421 | 100.0% |
Ancestry in Newark
The most populous ancestries reported in Newark are American (195 | 13.7%), German (153 | 10.8%), English (99 | 7.0%), Irish (77 | 5.4%), and Scottish (60 | 4.2%), together accounting for 41.1% of all Newark residents.
| Ancestry | # Population | % Population |
| American | 195 | 13.7% |
| British | 2 | 0.1% |
| Cherokee | 9 | 0.6% |
| Danish | 7 | 0.5% |
| English | 99 | 7.0% |
| European | 3 | 0.2% |
| French | 5 | 0.4% |
| German | 153 | 10.8% |
| Irish | 77 | 5.4% |
| Italian | 21 | 1.5% |
| Mexican | 34 | 2.4% |
| Navajo | 2 | 0.1% |
| Norwegian | 5 | 0.4% |
| Scandinavian | 2 | 0.1% |
| Scotch-Irish | 34 | 2.4% |
| Scottish | 60 | 4.2% |
| Swedish | 3 | 0.2% |
| Swiss | 2 | 0.1% | View All 18 Rows |
Immigrants in Newark
The most numerous immigrant groups reported in Newark came from Central America (4 | 0.3%), Latin America (4 | 0.3%), and Mexico (4 | 0.3%), together accounting for 0.8% of all Newark residents.
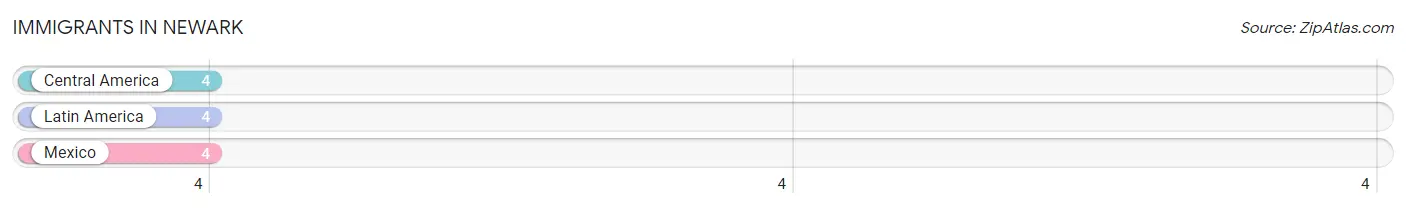
| Immigration Origin | # Population | % Population |
| Central America | 4 | 0.3% |
| Latin America | 4 | 0.3% |
| Mexico | 4 | 0.3% | View All 3 Rows |
Sex and Age in Newark
Sex and Age in Newark
The most populous age groups in Newark are 5 to 9 Years (98 | 14.4%) for men and 10 to 14 Years (97 | 13.1%) for women.
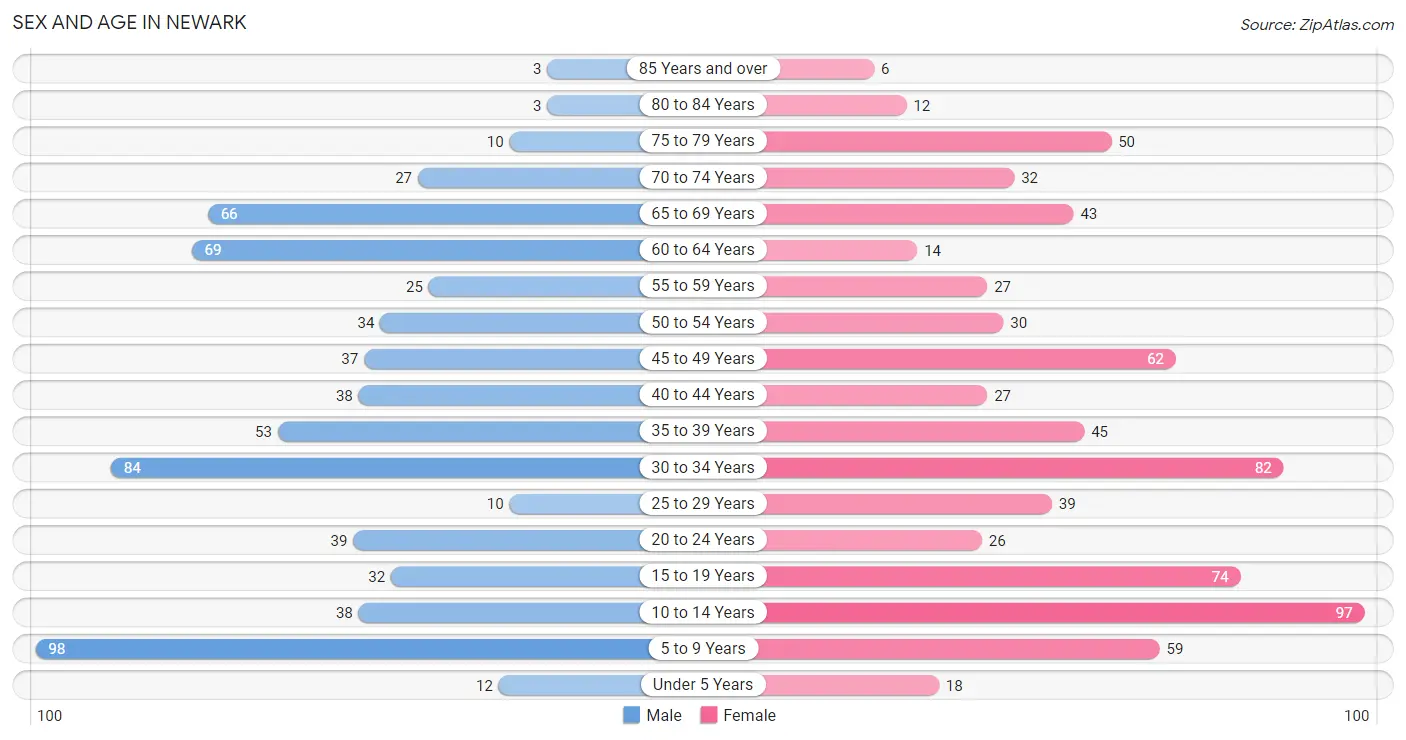
| Age Bracket | Male | Female |
| Under 5 Years | 12 (1.8%) | 18 (2.4%) |
| 5 to 9 Years | 98 (14.4%) | 59 (7.9%) |
| 10 to 14 Years | 38 (5.6%) | 97 (13.1%) |
| 15 to 19 Years | 32 (4.7%) | 74 (10.0%) |
| 20 to 24 Years | 39 (5.8%) | 26 (3.5%) |
| 25 to 29 Years | 10 (1.5%) | 39 (5.2%) |
| 30 to 34 Years | 84 (12.4%) | 82 (11.0%) |
| 35 to 39 Years | 53 (7.8%) | 45 (6.1%) |
| 40 to 44 Years | 38 (5.6%) | 27 (3.6%) |
| 45 to 49 Years | 37 (5.5%) | 62 (8.3%) |
| 50 to 54 Years | 34 (5.0%) | 30 (4.0%) |
| 55 to 59 Years | 25 (3.7%) | 27 (3.6%) |
| 60 to 64 Years | 69 (10.2%) | 14 (1.9%) |
| 65 to 69 Years | 66 (9.7%) | 43 (5.8%) |
| 70 to 74 Years | 27 (4.0%) | 32 (4.3%) |
| 75 to 79 Years | 10 (1.5%) | 50 (6.7%) |
| 80 to 84 Years | 3 (0.4%) | 12 (1.6%) |
| 85 Years and over | 3 (0.4%) | 6 (0.8%) |
| Total | 678 (100.0%) | 743 (100.0%) |
Families and Households in Newark
Median Family Size in Newark
The median family size in Newark is 3.39 persons per family, with single female/mother families (56 | 17.0%) accounting for the largest median family size of 3.96 persons per family. On the other hand, single male/father families (32 | 9.7%) represent the smallest median family size with 2.88 persons per family.
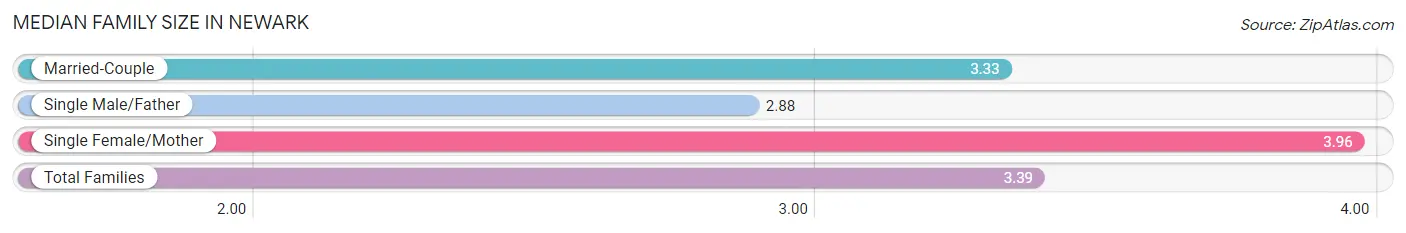
| Family Type | # Families | Family Size |
| Married-Couple | 242 (73.3%) | 3.33 |
| Single Male/Father | 32 (9.7%) | 2.88 |
| Single Female/Mother | 56 (17.0%) | 3.96 |
| Total Families | 330 (100.0%) | 3.39 |
Median Household Size in Newark
The median household size in Newark is 2.61 persons per household, with single female/mother households (56 | 10.3%) accounting for the largest median household size of 4.04 persons per household. non-family households (214 | 39.3%) represent the smallest median household size with 1.20 persons per household.
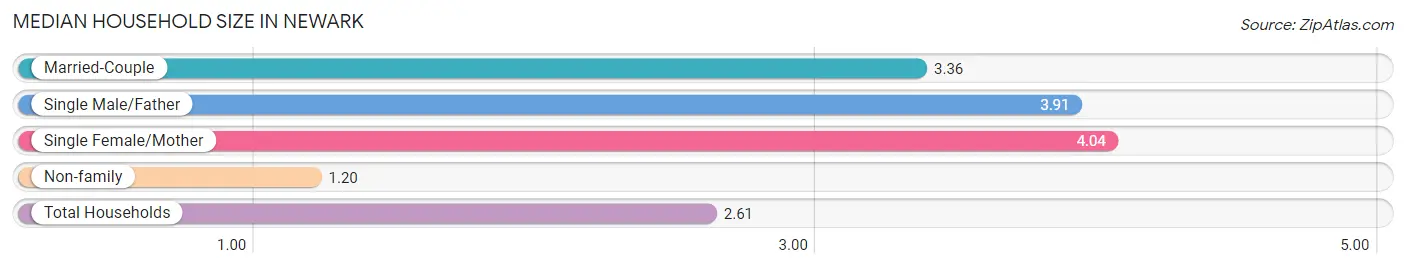
| Household Type | # Households | Household Size |
| Married-Couple | 242 (44.5%) | 3.36 |
| Single Male/Father | 32 (5.9%) | 3.91 |
| Single Female/Mother | 56 (10.3%) | 4.04 |
| Non-family | 214 (39.3%) | 1.20 |
| Total Households | 544 (100.0%) | 2.61 |
Household Size by Marriage Status in Newark
Out of a total of 544 households in Newark, 330 (60.7%) are family households, while 214 (39.3%) are nonfamily households. The most numerous type of family households are 4-person households, comprising 113, and the most common type of nonfamily households are 1-person households, comprising 187.
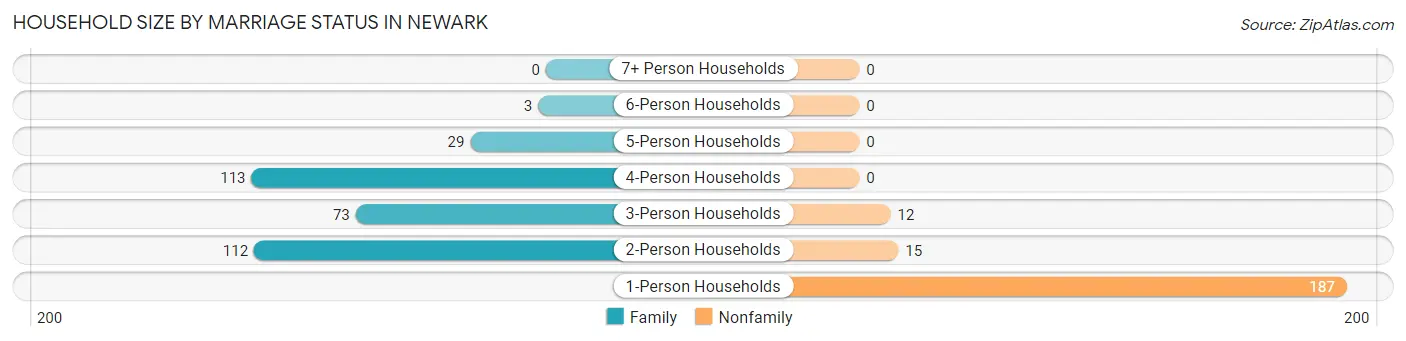
| Household Size | Family Households | Nonfamily Households |
| 1-Person Households | - | 187 (34.4%) |
| 2-Person Households | 112 (20.6%) | 15 (2.8%) |
| 3-Person Households | 73 (13.4%) | 12 (2.2%) |
| 4-Person Households | 113 (20.8%) | 0 (0.0%) |
| 5-Person Households | 29 (5.3%) | 0 (0.0%) |
| 6-Person Households | 3 (0.5%) | 0 (0.0%) |
| 7+ Person Households | 0 (0.0%) | 0 (0.0%) |
| Total | 330 (60.7%) | 214 (39.3%) |
Female Fertility in Newark
Fertility by Age in Newark
Average fertility rate in Newark is 25.0 births per 1,000 women. Women in the age bracket of 20 to 34 years have the highest fertility rate with 61.0 births per 1,000 women. Women in the age bracket of 20 to 34 years acount for 100.0% of all women with births.
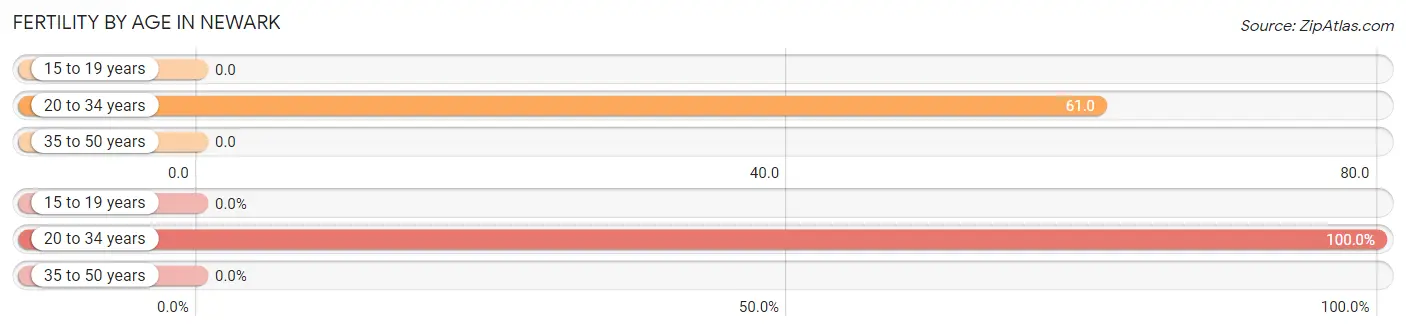
| Age Bracket | Women with Births | Births / 1,000 Women |
| 15 to 19 years | 0 (0.0%) | 0.0 |
| 20 to 34 years | 9 (100.0%) | 61.0 |
| 35 to 50 years | 0 (0.0%) | 0.0 |
| Total | 9 (100.0%) | 25.0 |
Fertility by Age by Marriage Status in Newark
44.4% of women with births (9) in Newark are married. The highest percentage of unmarried women with births falls into 20 to 34 years age bracket with 55.6% of them unmarried at the time of birth, while the lowest percentage of unmarried women with births belong to 20 to 34 years age bracket with 55.6% of them unmarried.
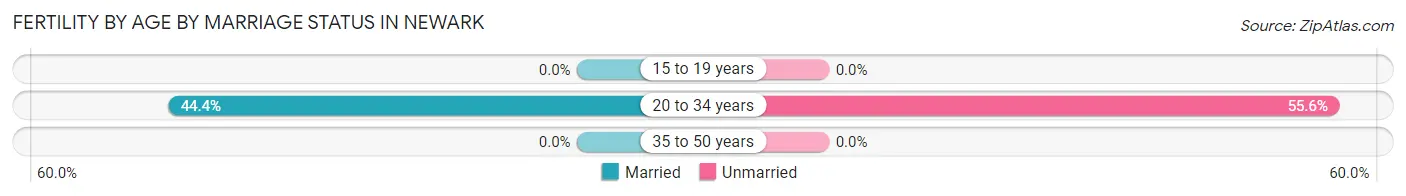
| Age Bracket | Married | Unmarried |
| 15 to 19 years | 0 (0.0%) | 0 (0.0%) |
| 20 to 34 years | 4 (44.4%) | 5 (55.6%) |
| 35 to 50 years | 0 (0.0%) | 0 (0.0%) |
| Total | 4 (44.4%) | 5 (55.6%) |
Fertility by Education in Newark
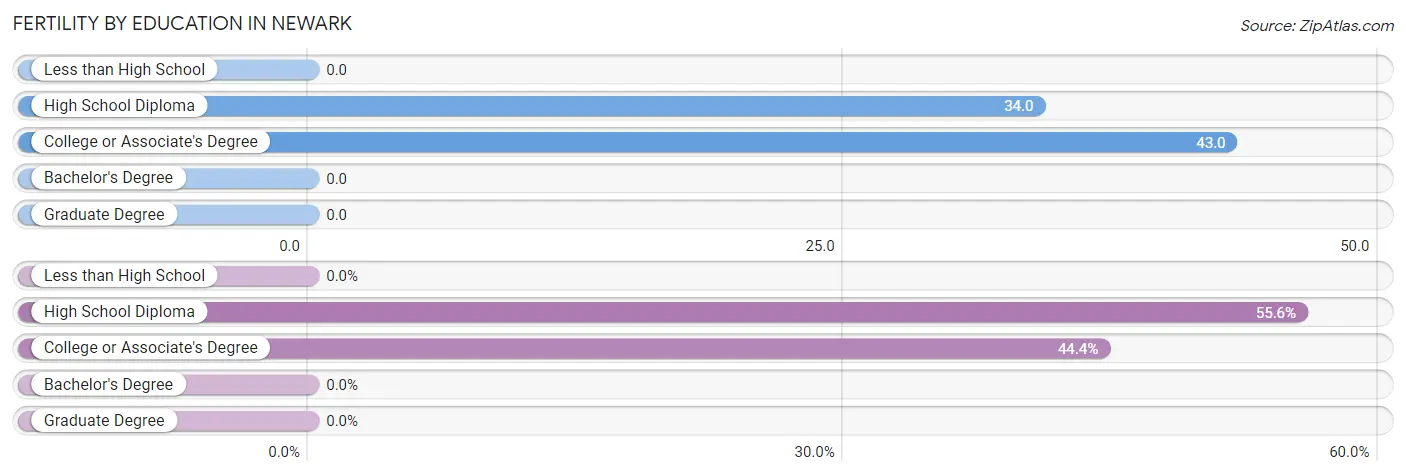
| Educational Attainment | Women with Births | Births / 1,000 Women |
| Less than High School | 0 (0.0%) | 0.0 |
| High School Diploma | 5 (55.6%) | 34.0 |
| College or Associate's Degree | 4 (44.4%) | 43.0 |
| Bachelor's Degree | 0 (0.0%) | 0.0 |
| Graduate Degree | 0 (0.0%) | 0.0 |
| Total | 9 (100.0%) | 25.0 |
Fertility by Education by Marriage Status in Newark
55.6% of women with births in Newark are unmarried. Women with the educational attainment of college or associate's degree are most likely to be married with 100.0% of them married at childbirth, while women with the educational attainment of high school diploma are least likely to be married with 100.0% of them unmarried at childbirth.
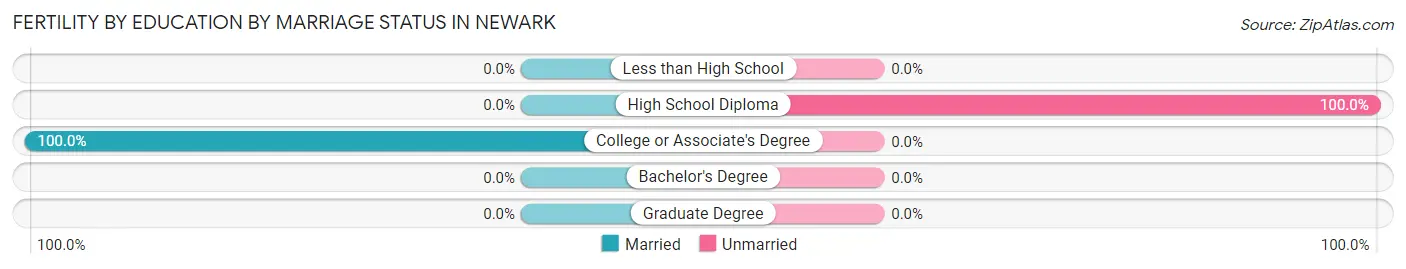
| Educational Attainment | Married | Unmarried |
| Less than High School | 0 (0.0%) | 0 (0.0%) |
| High School Diploma | 0 (0.0%) | 5 (100.0%) |
| College or Associate's Degree | 4 (100.0%) | 0 (0.0%) |
| Bachelor's Degree | 0 (0.0%) | 0 (0.0%) |
| Graduate Degree | 0 (0.0%) | 0 (0.0%) |
| Total | 4 (44.4%) | 5 (55.6%) |
Employment Characteristics in Newark
Employment by Class of Employer in Newark
Among the 486 employed individuals in Newark, private company employees (339 | 69.8%), state government employees (54 | 11.1%), and local government employees (34 | 7.0%) make up the most common classes of employment.
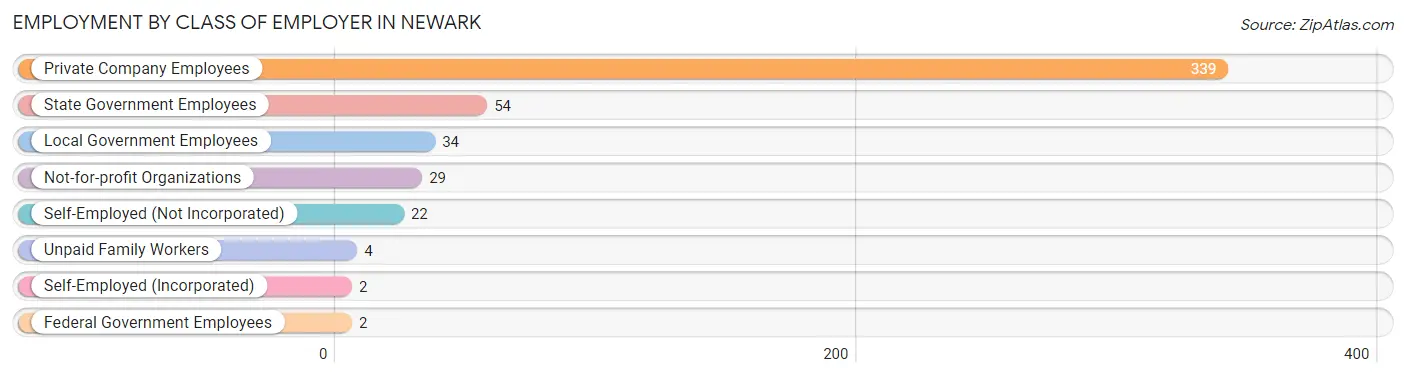
| Employer Class | # Employees | % Employees |
| Private Company Employees | 339 | 69.8% |
| Self-Employed (Incorporated) | 2 | 0.4% |
| Self-Employed (Not Incorporated) | 22 | 4.5% |
| Not-for-profit Organizations | 29 | 6.0% |
| Local Government Employees | 34 | 7.0% |
| State Government Employees | 54 | 11.1% |
| Federal Government Employees | 2 | 0.4% |
| Unpaid Family Workers | 4 | 0.8% |
| Total | 486 | 100.0% |
Employment Status by Age in Newark
According to the labor force statistics for Newark, out of the total population over 16 years of age (1,064), 47.3% or 503 individuals are in the labor force, with 3.0% or 15 of them unemployed. The age group with the highest labor force participation rate is 20 to 24 years, with 87.7% or 57 individuals in the labor force. Within the labor force, the 20 to 24 years age range has the highest percentage of unemployed individuals, with 14.0% or 8 of them being unemployed.
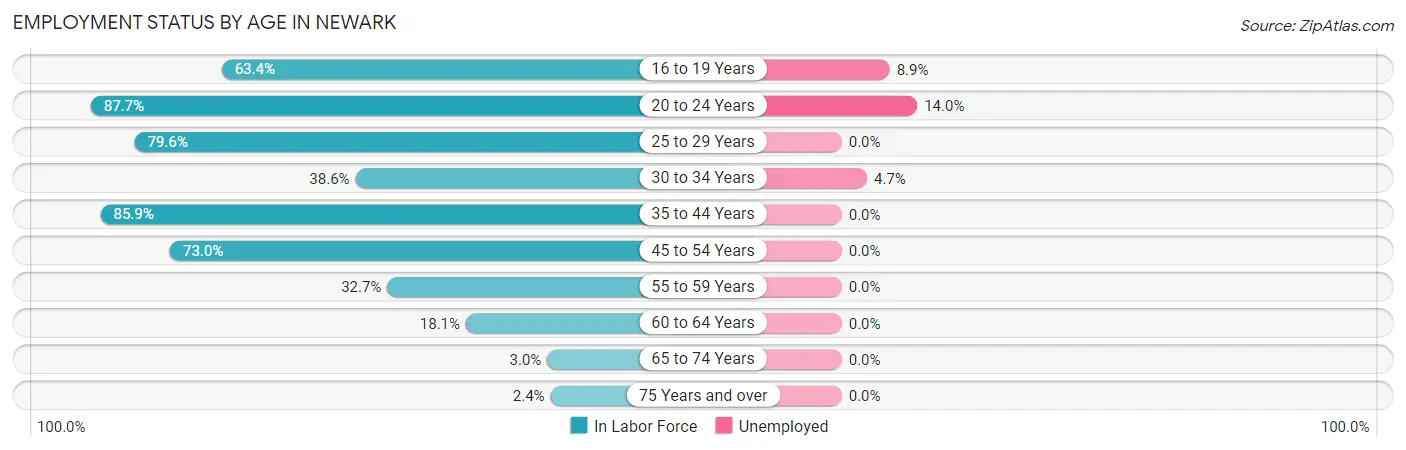
| Age Bracket | In Labor Force | Unemployed |
| 16 to 19 Years | 45 (63.4%) | 4 (8.9%) |
| 20 to 24 Years | 57 (87.7%) | 8 (14.0%) |
| 25 to 29 Years | 39 (79.6%) | 0 (0.0%) |
| 30 to 34 Years | 64 (38.6%) | 3 (4.7%) |
| 35 to 44 Years | 140 (85.9%) | 0 (0.0%) |
| 45 to 54 Years | 119 (73.0%) | 0 (0.0%) |
| 55 to 59 Years | 17 (32.7%) | 0 (0.0%) |
| 60 to 64 Years | 15 (18.1%) | 0 (0.0%) |
| 65 to 74 Years | 5 (3.0%) | 0 (0.0%) |
| 75 Years and over | 2 (2.4%) | 0 (0.0%) |
| Total | 503 (47.3%) | 15 (3.0%) |
Employment Status by Educational Attainment in Newark
According to labor force statistics for Newark, 58.3% of individuals (394) out of the total population between 25 and 64 years of age (676) are in the labor force, with 0.8% or 3 of them being unemployed. The group with the highest labor force participation rate are those with the educational attainment of bachelor's degree or higher, with 100.0% or 36 individuals in the labor force. Within the labor force, individuals with college / associate degree education have the highest percentage of unemployment, with 2.1% or 3 of them being unemployed.
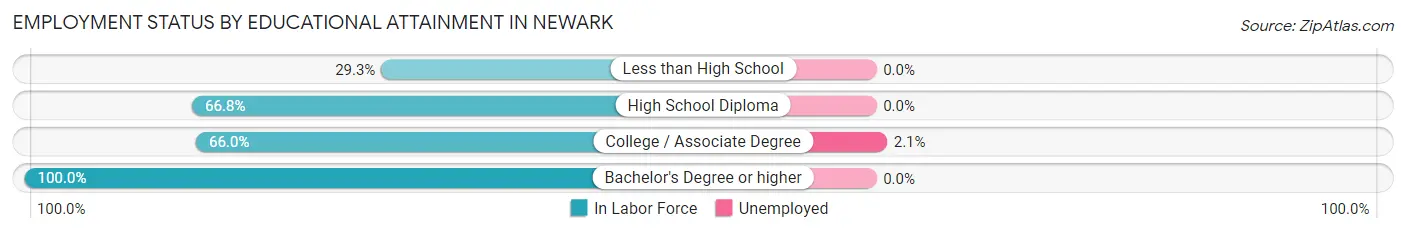
| Educational Attainment | In Labor Force | Unemployed |
| Less than High School | 53 (29.3%) | 0 (0.0%) |
| High School Diploma | 165 (66.8%) | 0 (0.0%) |
| College / Associate Degree | 140 (66.0%) | 4 (2.1%) |
| Bachelor's Degree or higher | 36 (100.0%) | 0 (0.0%) |
| Total | 394 (58.3%) | 5 (0.8%) |
Employment Occupations by Sex in Newark
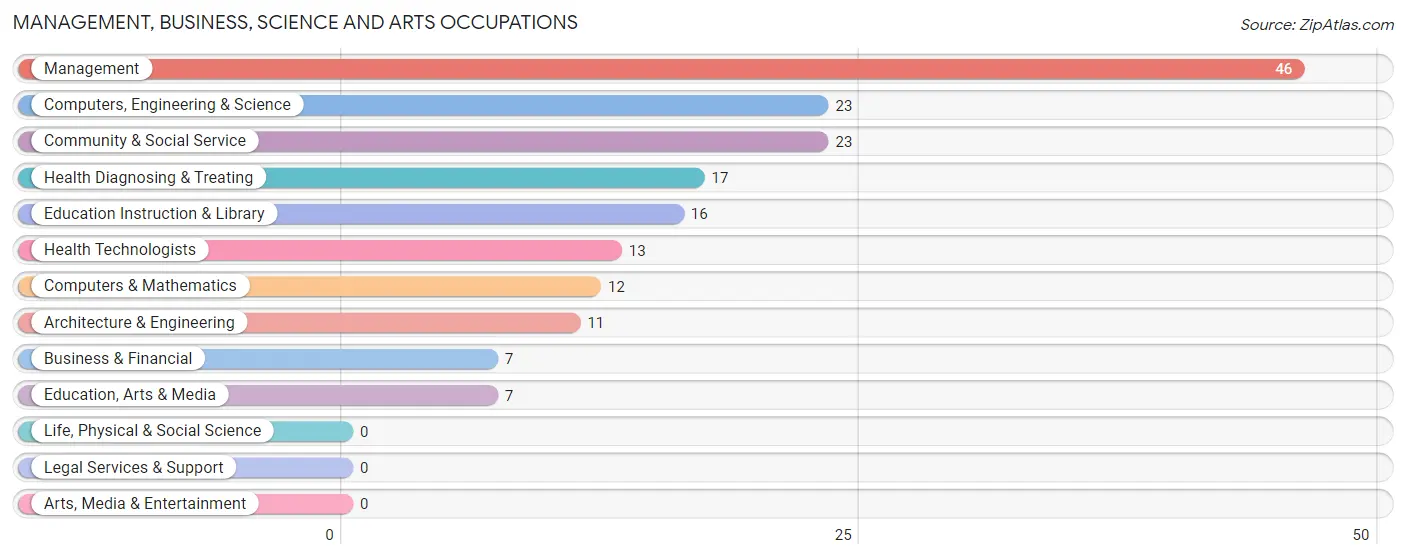
Management, Business, Science and Arts Occupations
The most common Management, Business, Science and Arts occupations in Newark are Management (46 | 9.4%), Computers, Engineering & Science (23 | 4.7%), Community & Social Service (23 | 4.7%), Health Diagnosing & Treating (17 | 3.5%), and Education Instruction & Library (16 | 3.3%).
Management, Business, Science and Arts Occupations by Sex
Within the Management, Business, Science and Arts occupations in Newark, the most male-oriented occupations are Computers, Engineering & Science (100.0%), Computers & Mathematics (100.0%), and Architecture & Engineering (100.0%), while the most female-oriented occupations are Business & Financial (100.0%), Health Diagnosing & Treating (88.2%), and Management (84.8%).
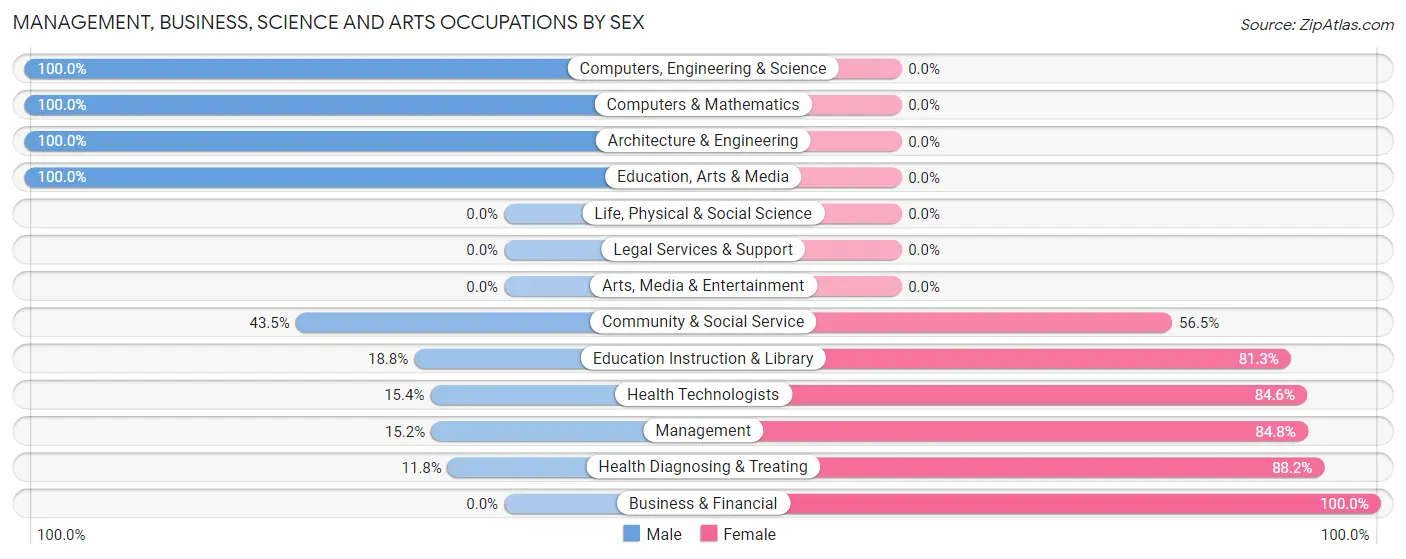
| Occupation | Male | Female |
| Management | 7 (15.2%) | 39 (84.8%) |
| Business & Financial | 0 (0.0%) | 7 (100.0%) |
| Computers, Engineering & Science | 23 (100.0%) | 0 (0.0%) |
| Computers & Mathematics | 12 (100.0%) | 0 (0.0%) |
| Architecture & Engineering | 11 (100.0%) | 0 (0.0%) |
| Life, Physical & Social Science | 0 (0.0%) | 0 (0.0%) |
| Community & Social Service | 10 (43.5%) | 13 (56.5%) |
| Education, Arts & Media | 7 (100.0%) | 0 (0.0%) |
| Legal Services & Support | 0 (0.0%) | 0 (0.0%) |
| Education Instruction & Library | 3 (18.8%) | 13 (81.2%) |
| Arts, Media & Entertainment | 0 (0.0%) | 0 (0.0%) |
| Health Diagnosing & Treating | 2 (11.8%) | 15 (88.2%) |
| Health Technologists | 2 (15.4%) | 11 (84.6%) |
| Total (Category) | 42 (36.2%) | 74 (63.8%) |
| Total (Overall) | 250 (51.2%) | 238 (48.8%) |
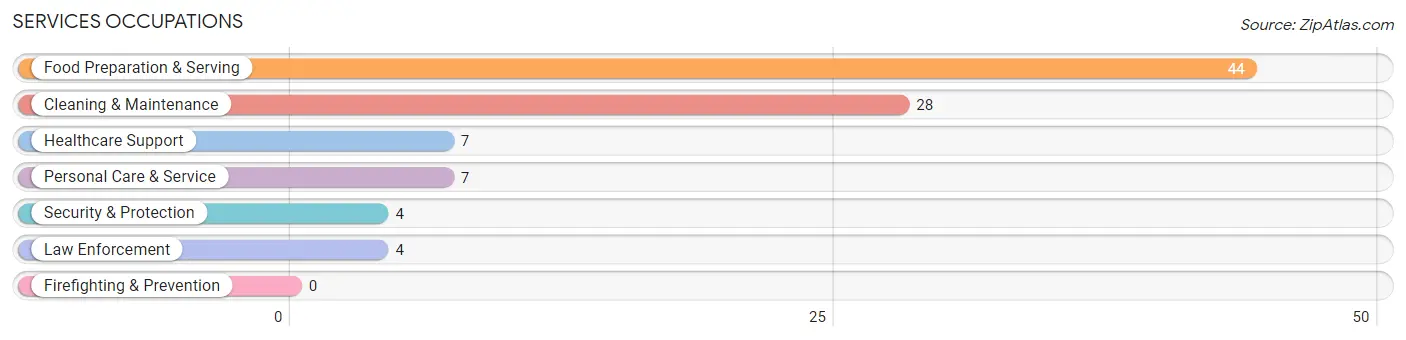
Services Occupations
The most common Services occupations in Newark are Food Preparation & Serving (44 | 9.0%), Cleaning & Maintenance (28 | 5.7%), Healthcare Support (7 | 1.4%), Personal Care & Service (7 | 1.4%), and Security & Protection (4 | 0.8%).
Services Occupations by Sex
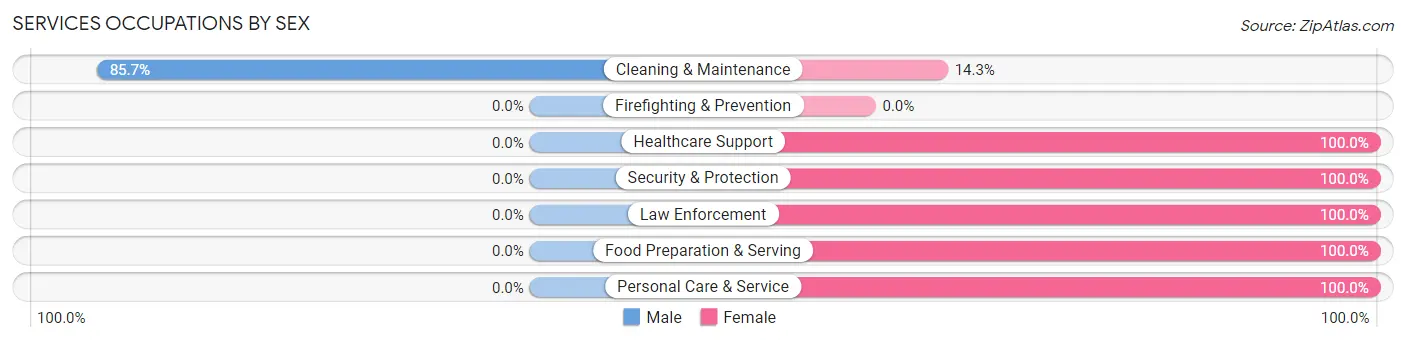
| Occupation | Male | Female |
| Healthcare Support | 0 (0.0%) | 7 (100.0%) |
| Security & Protection | 0 (0.0%) | 4 (100.0%) |
| Firefighting & Prevention | 0 (0.0%) | 0 (0.0%) |
| Law Enforcement | 0 (0.0%) | 4 (100.0%) |
| Food Preparation & Serving | 0 (0.0%) | 44 (100.0%) |
| Cleaning & Maintenance | 24 (85.7%) | 4 (14.3%) |
| Personal Care & Service | 0 (0.0%) | 7 (100.0%) |
| Total (Category) | 24 (26.7%) | 66 (73.3%) |
| Total (Overall) | 250 (51.2%) | 238 (48.8%) |
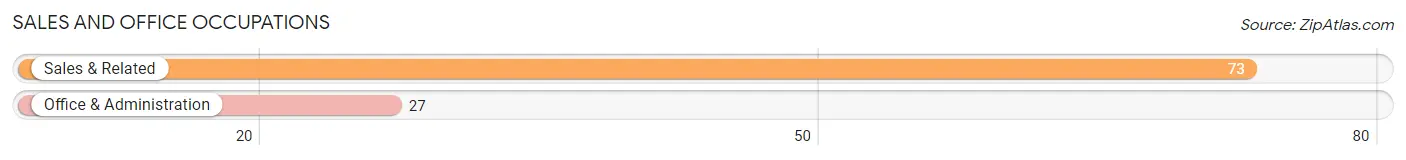
Sales and Office Occupations
The most common Sales and Office occupations in Newark are Sales & Related (73 | 15.0%), and Office & Administration (27 | 5.5%).
Sales and Office Occupations by Sex
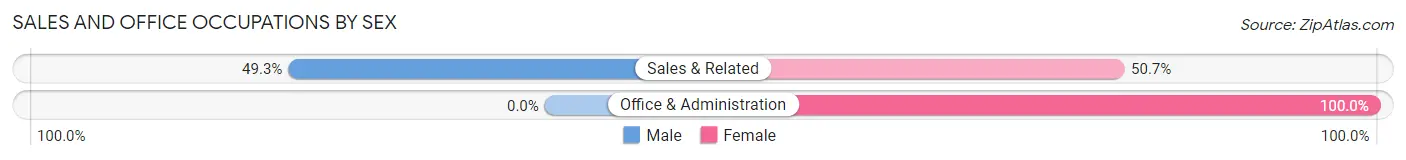
| Occupation | Male | Female |
| Sales & Related | 36 (49.3%) | 37 (50.7%) |
| Office & Administration | 0 (0.0%) | 27 (100.0%) |
| Total (Category) | 36 (36.0%) | 64 (64.0%) |
| Total (Overall) | 250 (51.2%) | 238 (48.8%) |
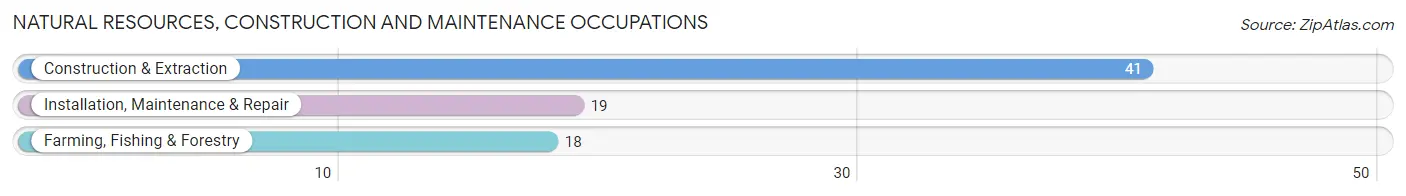
Natural Resources, Construction and Maintenance Occupations
The most common Natural Resources, Construction and Maintenance occupations in Newark are Construction & Extraction (41 | 8.4%), Installation, Maintenance & Repair (19 | 3.9%), and Farming, Fishing & Forestry (18 | 3.7%).
Natural Resources, Construction and Maintenance Occupations by Sex
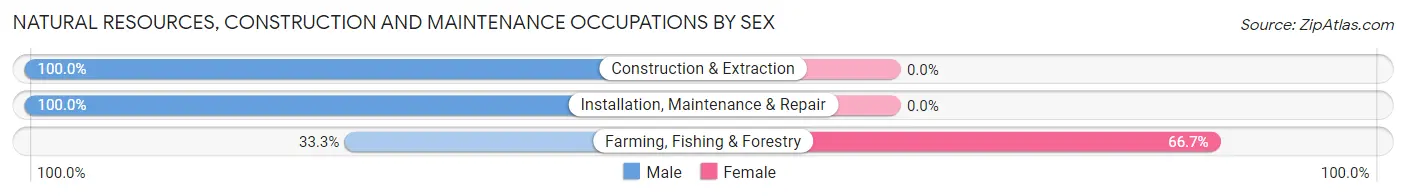
| Occupation | Male | Female |
| Farming, Fishing & Forestry | 6 (33.3%) | 12 (66.7%) |
| Construction & Extraction | 41 (100.0%) | 0 (0.0%) |
| Installation, Maintenance & Repair | 19 (100.0%) | 0 (0.0%) |
| Total (Category) | 66 (84.6%) | 12 (15.4%) |
| Total (Overall) | 250 (51.2%) | 238 (48.8%) |
Production, Transportation and Moving Occupations
The most common Production, Transportation and Moving occupations in Newark are Production (72 | 14.7%), Material Moving (26 | 5.3%), and Transportation (6 | 1.2%).
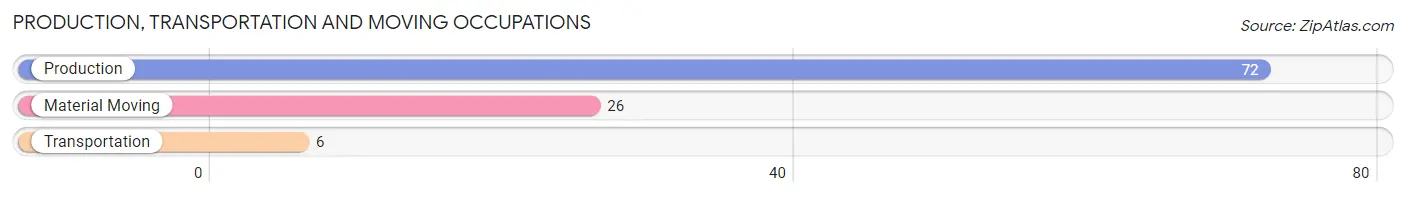
Production, Transportation and Moving Occupations by Sex
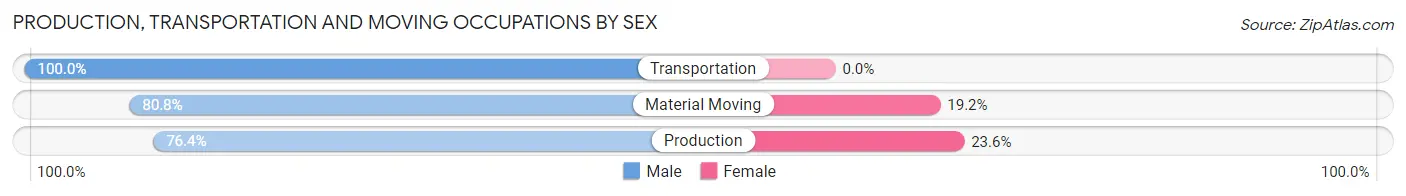
| Occupation | Male | Female |
| Production | 55 (76.4%) | 17 (23.6%) |
| Transportation | 6 (100.0%) | 0 (0.0%) |
| Material Moving | 21 (80.8%) | 5 (19.2%) |
| Total (Category) | 82 (78.8%) | 22 (21.1%) |
| Total (Overall) | 250 (51.2%) | 238 (48.8%) |
Employment Industries by Sex in Newark
Employment Industries in Newark
The major employment industries in Newark include Manufacturing (102 | 20.9%), Retail Trade (74 | 15.2%), Accommodation & Food Services (47 | 9.6%), Educational Services (46 | 9.4%), and Construction (44 | 9.0%).
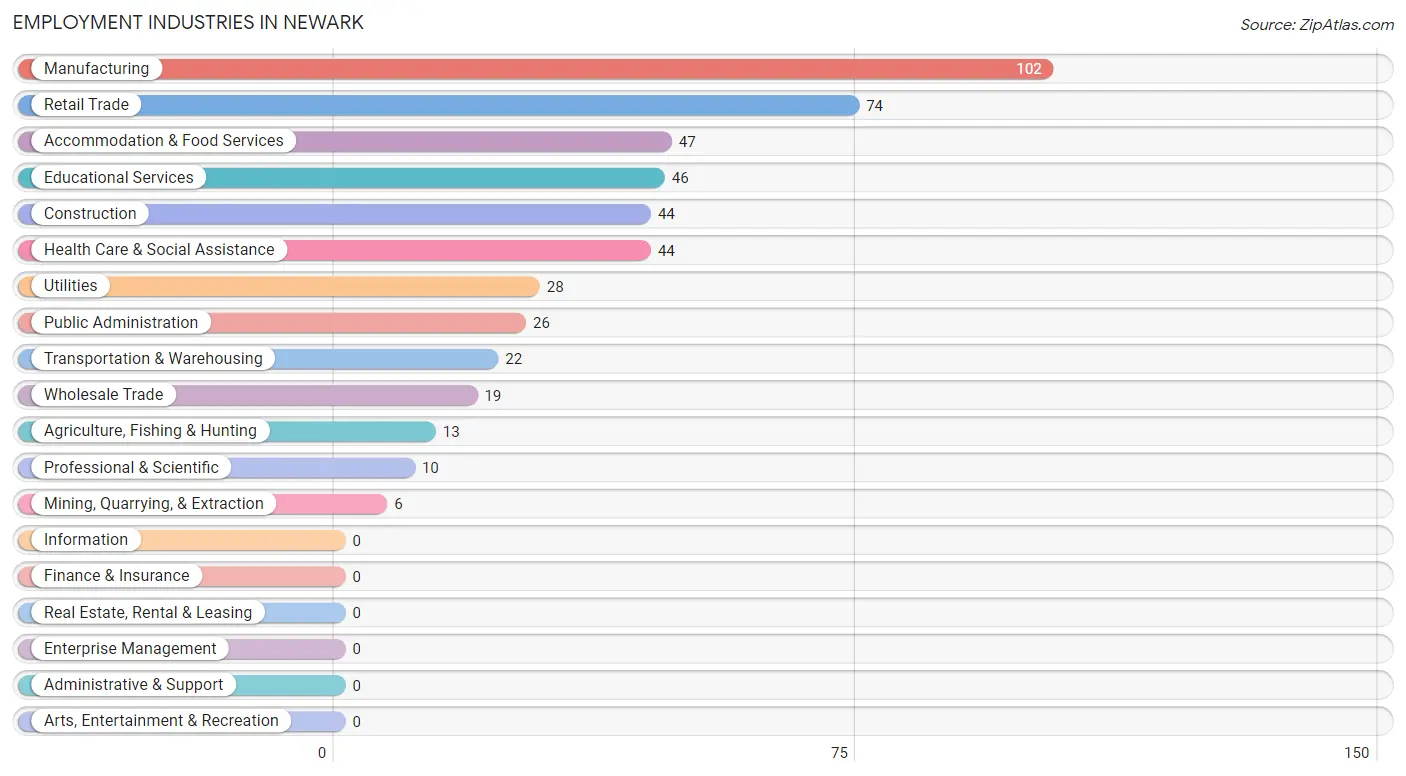
Employment Industries by Sex in Newark
The Newark industries that see more men than women are Agriculture, Fishing & Hunting (100.0%), Mining, Quarrying, & Extraction (100.0%), and Construction (100.0%), whereas the industries that tend to have a higher number of women are Utilities (100.0%), Professional & Scientific (100.0%), and Accommodation & Food Services (95.7%).
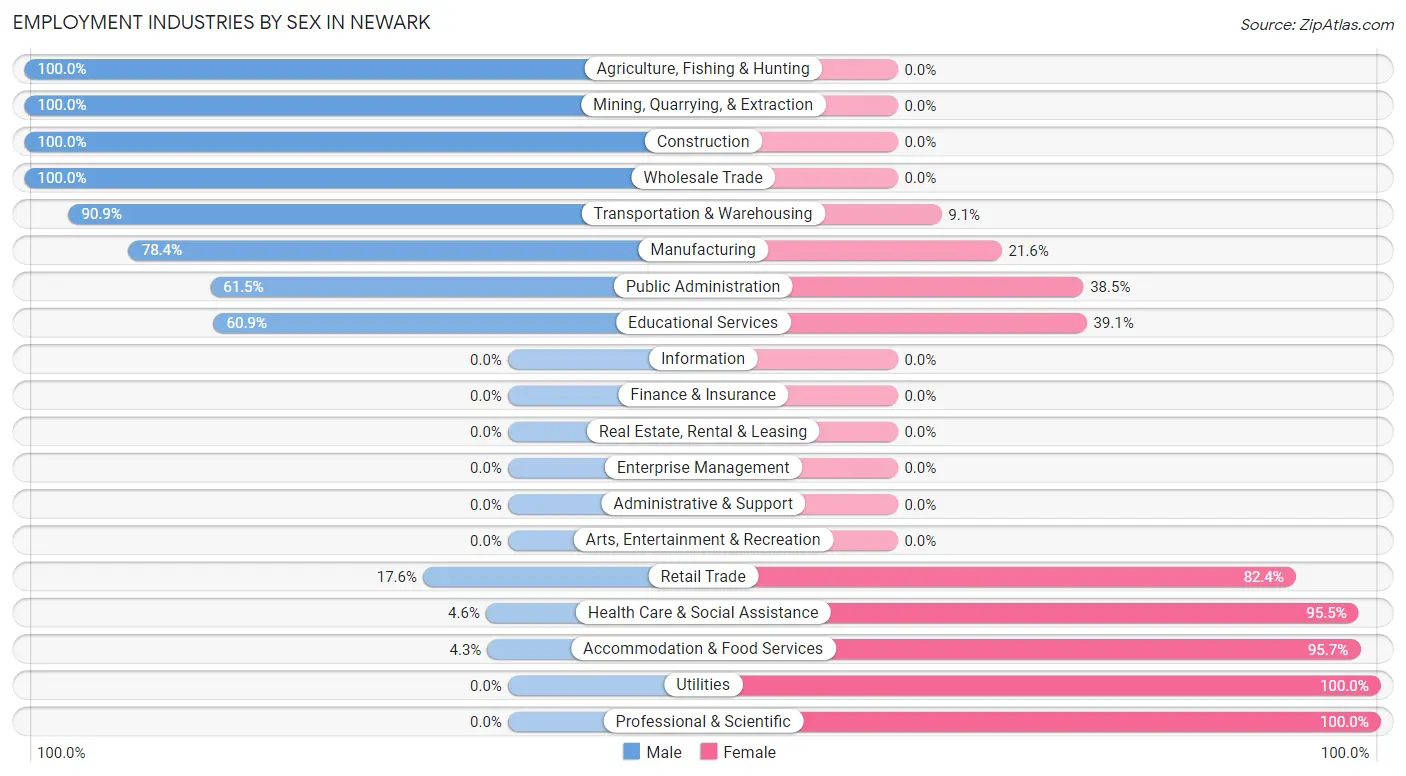
| Industry | Male | Female |
| Agriculture, Fishing & Hunting | 13 (100.0%) | 0 (0.0%) |
| Mining, Quarrying, & Extraction | 6 (100.0%) | 0 (0.0%) |
| Construction | 44 (100.0%) | 0 (0.0%) |
| Manufacturing | 80 (78.4%) | 22 (21.6%) |
| Wholesale Trade | 19 (100.0%) | 0 (0.0%) |
| Retail Trade | 13 (17.6%) | 61 (82.4%) |
| Transportation & Warehousing | 20 (90.9%) | 2 (9.1%) |
| Utilities | 0 (0.0%) | 28 (100.0%) |
| Information | 0 (0.0%) | 0 (0.0%) |
| Finance & Insurance | 0 (0.0%) | 0 (0.0%) |
| Real Estate, Rental & Leasing | 0 (0.0%) | 0 (0.0%) |
| Professional & Scientific | 0 (0.0%) | 10 (100.0%) |
| Enterprise Management | 0 (0.0%) | 0 (0.0%) |
| Administrative & Support | 0 (0.0%) | 0 (0.0%) |
| Educational Services | 28 (60.9%) | 18 (39.1%) |
| Health Care & Social Assistance | 2 (4.5%) | 42 (95.5%) |
| Arts, Entertainment & Recreation | 0 (0.0%) | 0 (0.0%) |
| Accommodation & Food Services | 2 (4.3%) | 45 (95.7%) |
| Public Administration | 16 (61.5%) | 10 (38.5%) |
| Total | 250 (51.2%) | 238 (48.8%) |
Education in Newark
School Enrollment in Newark
The most common levels of schooling among the 407 students in Newark are middle school (115 | 28.3%), kindergarten (83 | 20.4%), and elementary school (83 | 20.4%).
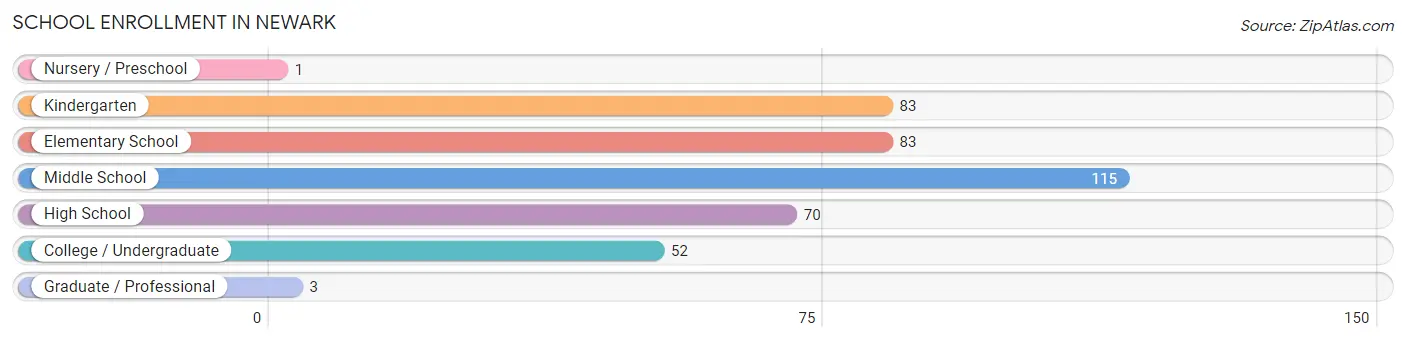
| School Level | # Students | % Students |
| Nursery / Preschool | 1 | 0.3% |
| Kindergarten | 83 | 20.4% |
| Elementary School | 83 | 20.4% |
| Middle School | 115 | 28.3% |
| High School | 70 | 17.2% |
| College / Undergraduate | 52 | 12.8% |
| Graduate / Professional | 3 | 0.7% |
| Total | 407 | 100.0% |
School Enrollment by Age by Funding Source in Newark
Out of a total of 407 students who are enrolled in schools in Newark, 9 (2.2%) attend a private institution, while the remaining 398 (97.8%) are enrolled in public schools. The age group of 25 to 34 year olds has the highest likelihood of being enrolled in private schools, with 4 (57.1% in the age bracket) enrolled. Conversely, the age group of 3 to 4 year olds has the lowest likelihood of being enrolled in a private school, with 1 (100.0% in the age bracket) attending a public institution.
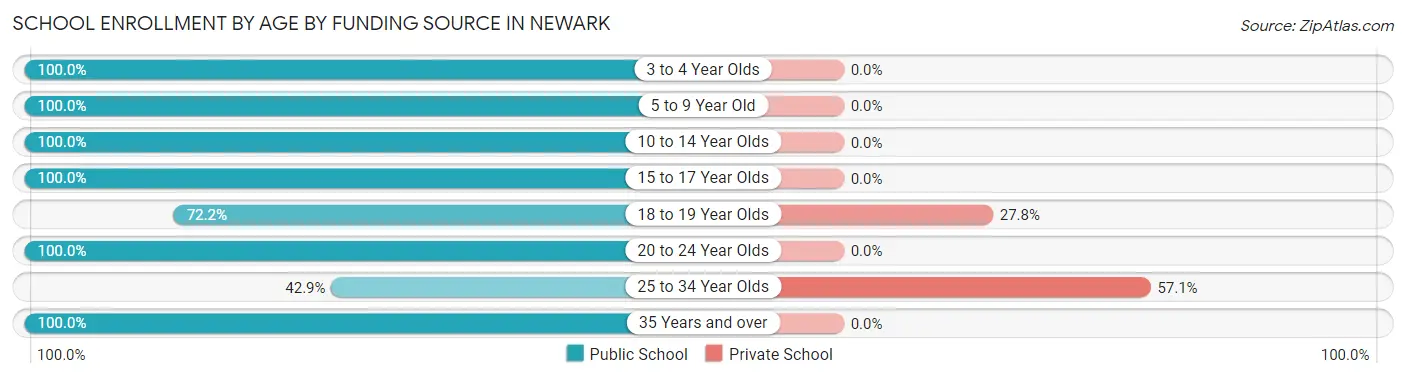
| Age Bracket | Public School | Private School |
| 3 to 4 Year Olds | 1 (100.0%) | 0 (0.0%) |
| 5 to 9 Year Old | 153 (100.0%) | 0 (0.0%) |
| 10 to 14 Year Olds | 135 (100.0%) | 0 (0.0%) |
| 15 to 17 Year Olds | 56 (100.0%) | 0 (0.0%) |
| 18 to 19 Year Olds | 13 (72.2%) | 5 (27.8%) |
| 20 to 24 Year Olds | 4 (100.0%) | 0 (0.0%) |
| 25 to 34 Year Olds | 3 (42.9%) | 4 (57.1%) |
| 35 Years and over | 33 (100.0%) | 0 (0.0%) |
| Total | 398 (97.8%) | 9 (2.2%) |
Educational Attainment by Field of Study in Newark
Education (28 | 49.1%), liberal arts & history (15 | 26.3%), bio, nature & agricultural (4 | 7.0%), business (4 | 7.0%), and psychology (3 | 5.3%) are the most common fields of study among 57 individuals in Newark who have obtained a bachelor's degree or higher.
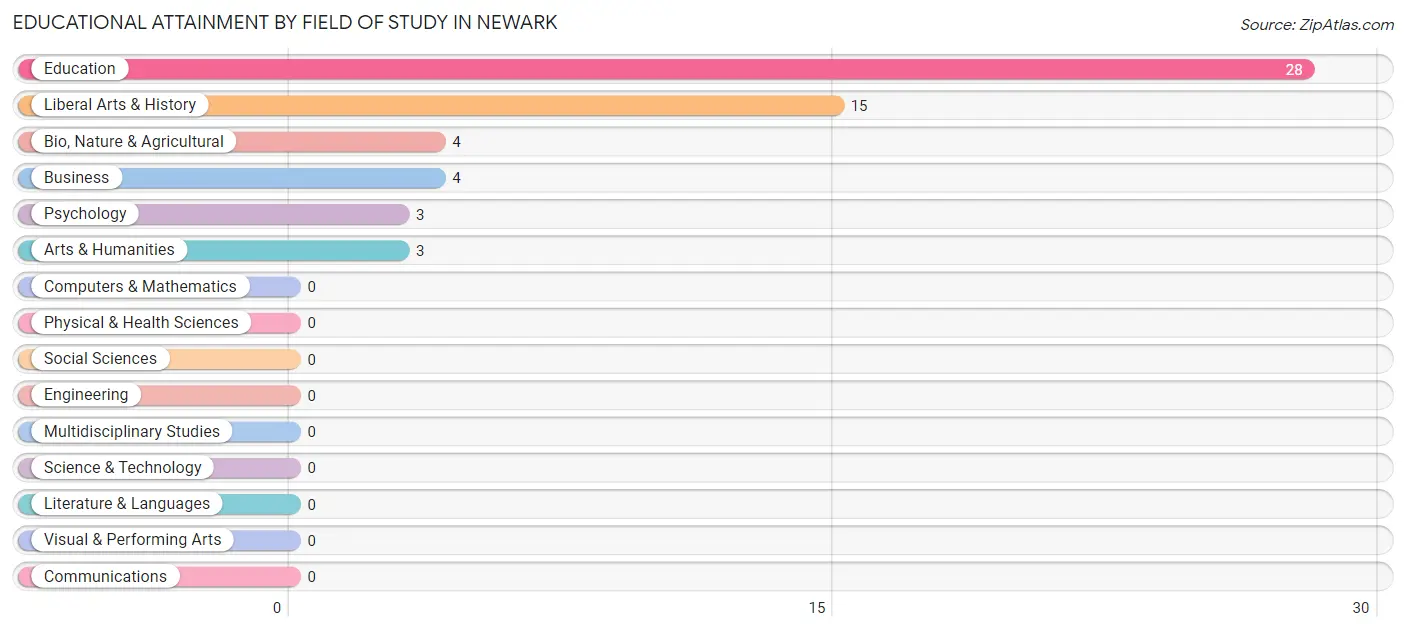
| Field of Study | # Graduates | % Graduates |
| Computers & Mathematics | 0 | 0.0% |
| Bio, Nature & Agricultural | 4 | 7.0% |
| Physical & Health Sciences | 0 | 0.0% |
| Psychology | 3 | 5.3% |
| Social Sciences | 0 | 0.0% |
| Engineering | 0 | 0.0% |
| Multidisciplinary Studies | 0 | 0.0% |
| Science & Technology | 0 | 0.0% |
| Business | 4 | 7.0% |
| Education | 28 | 49.1% |
| Literature & Languages | 0 | 0.0% |
| Liberal Arts & History | 15 | 26.3% |
| Visual & Performing Arts | 0 | 0.0% |
| Communications | 0 | 0.0% |
| Arts & Humanities | 3 | 5.3% |
| Total | 57 | 100.0% |
Transportation & Commute in Newark
Vehicle Availability by Sex in Newark
The most prevalent vehicle ownership categories in Newark are males with 2 vehicles (94, accounting for 37.6%) and females with 2 vehicles (64, making up 39.8%).
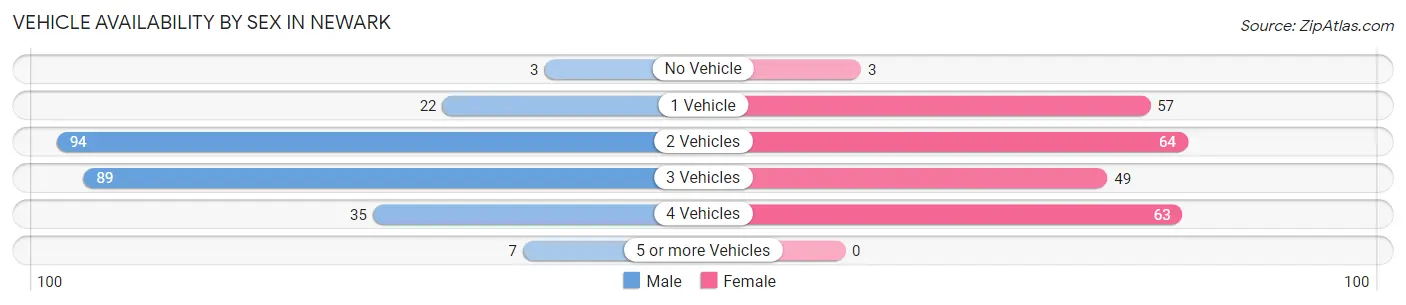
| Vehicles Available | Male | Female |
| No Vehicle | 3 (1.2%) | 3 (1.3%) |
| 1 Vehicle | 22 (8.8%) | 57 (24.1%) |
| 2 Vehicles | 94 (37.6%) | 64 (27.1%) |
| 3 Vehicles | 89 (35.6%) | 49 (20.8%) |
| 4 Vehicles | 35 (14.0%) | 63 (26.7%) |
| 5 or more Vehicles | 7 (2.8%) | 0 (0.0%) |
| Total | 250 (100.0%) | 236 (100.0%) |
Commute Time in Newark
The most frequently occuring commute durations in Newark are 20 to 24 minutes (135 commuters, 27.8%), 30 to 34 minutes (85 commuters, 17.5%), and 5 to 9 minutes (73 commuters, 15.0%).
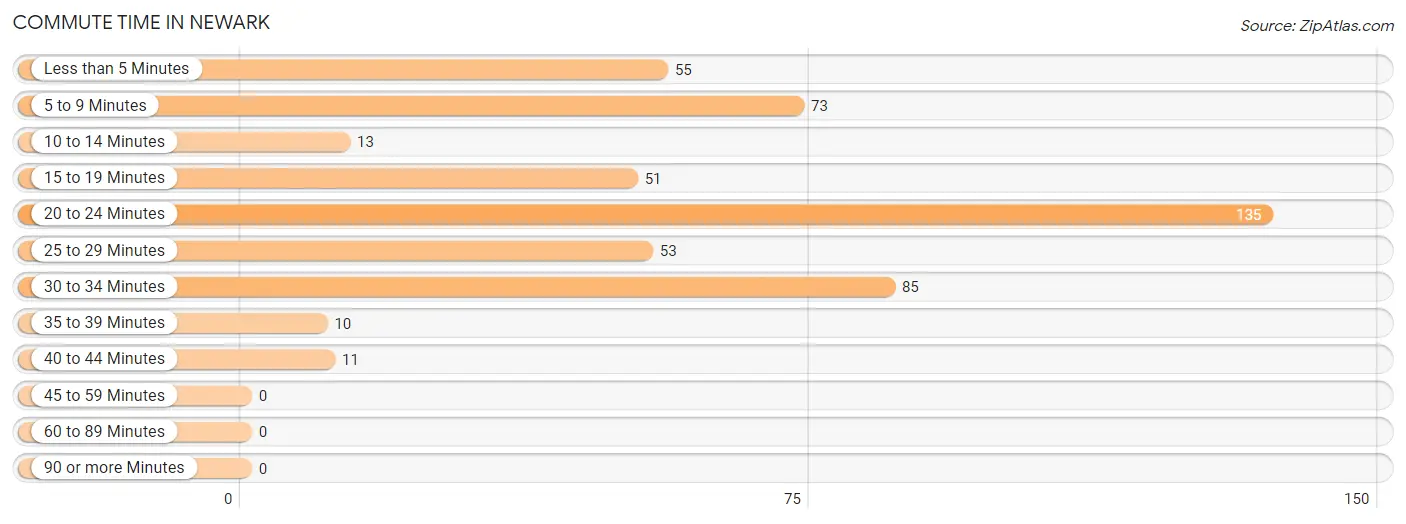
| Commute Time | # Commuters | % Commuters |
| Less than 5 Minutes | 55 | 11.3% |
| 5 to 9 Minutes | 73 | 15.0% |
| 10 to 14 Minutes | 13 | 2.7% |
| 15 to 19 Minutes | 51 | 10.5% |
| 20 to 24 Minutes | 135 | 27.8% |
| 25 to 29 Minutes | 53 | 10.9% |
| 30 to 34 Minutes | 85 | 17.5% |
| 35 to 39 Minutes | 10 | 2.1% |
| 40 to 44 Minutes | 11 | 2.3% |
| 45 to 59 Minutes | 0 | 0.0% |
| 60 to 89 Minutes | 0 | 0.0% |
| 90 or more Minutes | 0 | 0.0% |
Commute Time by Sex in Newark
The most common commute times in Newark are 20 to 24 minutes (77 commuters, 30.8%) for males and 5 to 9 minutes (65 commuters, 27.5%) for females.
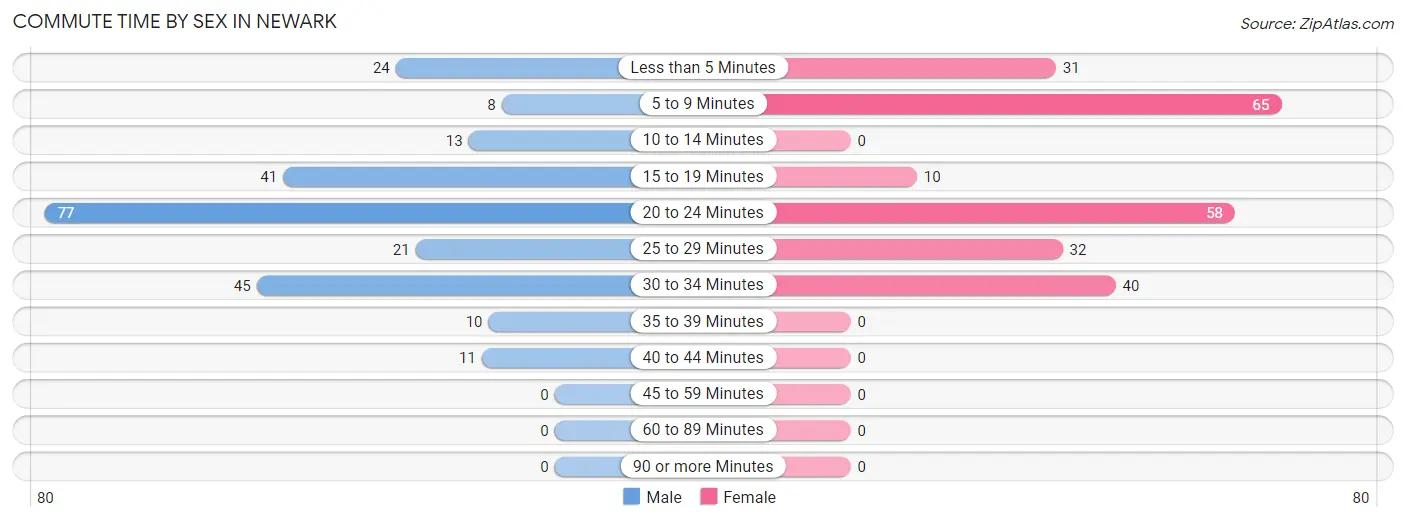
| Commute Time | Male | Female |
| Less than 5 Minutes | 24 (9.6%) | 31 (13.1%) |
| 5 to 9 Minutes | 8 (3.2%) | 65 (27.5%) |
| 10 to 14 Minutes | 13 (5.2%) | 0 (0.0%) |
| 15 to 19 Minutes | 41 (16.4%) | 10 (4.2%) |
| 20 to 24 Minutes | 77 (30.8%) | 58 (24.6%) |
| 25 to 29 Minutes | 21 (8.4%) | 32 (13.6%) |
| 30 to 34 Minutes | 45 (18.0%) | 40 (17.0%) |
| 35 to 39 Minutes | 10 (4.0%) | 0 (0.0%) |
| 40 to 44 Minutes | 11 (4.4%) | 0 (0.0%) |
| 45 to 59 Minutes | 0 (0.0%) | 0 (0.0%) |
| 60 to 89 Minutes | 0 (0.0%) | 0 (0.0%) |
| 90 or more Minutes | 0 (0.0%) | 0 (0.0%) |
Time of Departure to Work by Sex in Newark
The most frequent times of departure to work in Newark are 6:00 AM to 6:29 AM (62, 24.8%) for males and 6:00 AM to 6:29 AM (52, 22.0%) for females.
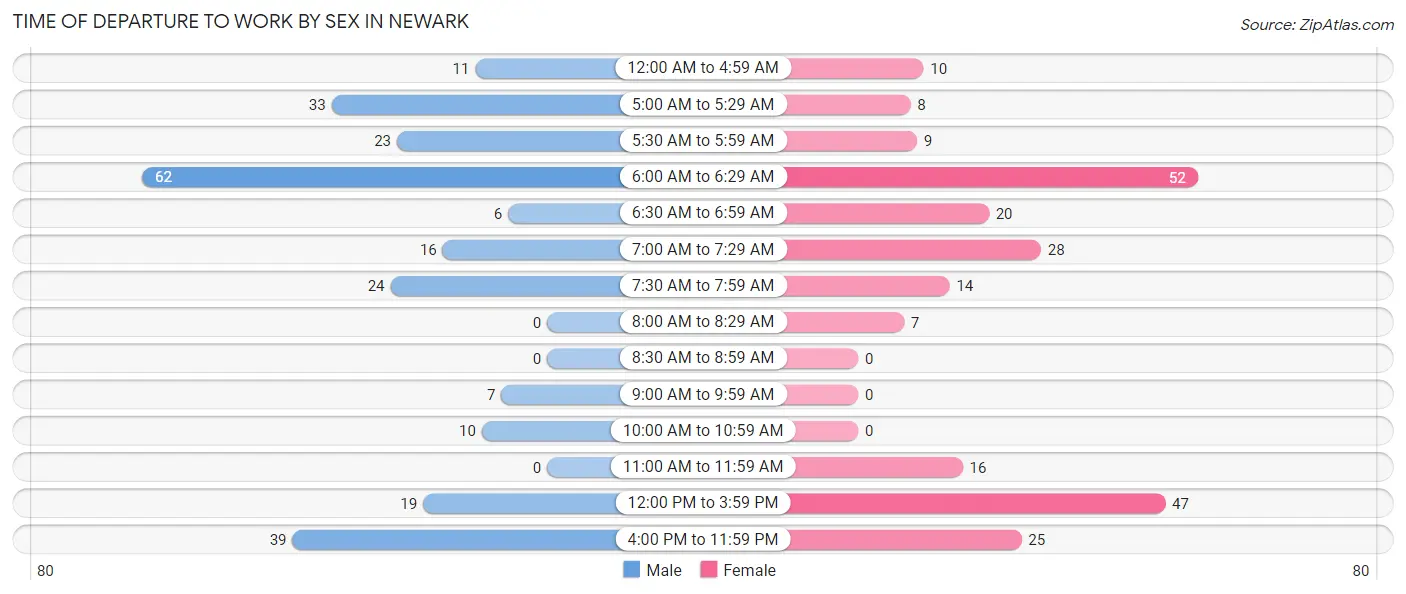
| Time of Departure | Male | Female |
| 12:00 AM to 4:59 AM | 11 (4.4%) | 10 (4.2%) |
| 5:00 AM to 5:29 AM | 33 (13.2%) | 8 (3.4%) |
| 5:30 AM to 5:59 AM | 23 (9.2%) | 9 (3.8%) |
| 6:00 AM to 6:29 AM | 62 (24.8%) | 52 (22.0%) |
| 6:30 AM to 6:59 AM | 6 (2.4%) | 20 (8.5%) |
| 7:00 AM to 7:29 AM | 16 (6.4%) | 28 (11.9%) |
| 7:30 AM to 7:59 AM | 24 (9.6%) | 14 (5.9%) |
| 8:00 AM to 8:29 AM | 0 (0.0%) | 7 (3.0%) |
| 8:30 AM to 8:59 AM | 0 (0.0%) | 0 (0.0%) |
| 9:00 AM to 9:59 AM | 7 (2.8%) | 0 (0.0%) |
| 10:00 AM to 10:59 AM | 10 (4.0%) | 0 (0.0%) |
| 11:00 AM to 11:59 AM | 0 (0.0%) | 16 (6.8%) |
| 12:00 PM to 3:59 PM | 19 (7.6%) | 47 (19.9%) |
| 4:00 PM to 11:59 PM | 39 (15.6%) | 25 (10.6%) |
| Total | 250 (100.0%) | 236 (100.0%) |
Housing Occupancy in Newark
Occupancy by Ownership in Newark
Of the total 544 dwellings in Newark, owner-occupied units account for 355 (65.3%), while renter-occupied units make up 189 (34.7%).
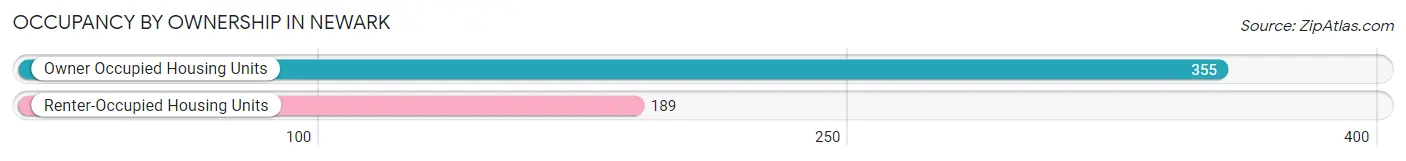
| Occupancy | # Housing Units | % Housing Units |
| Owner Occupied Housing Units | 355 | 65.3% |
| Renter-Occupied Housing Units | 189 | 34.7% |
| Total Occupied Housing Units | 544 | 100.0% |
Occupancy by Household Size in Newark
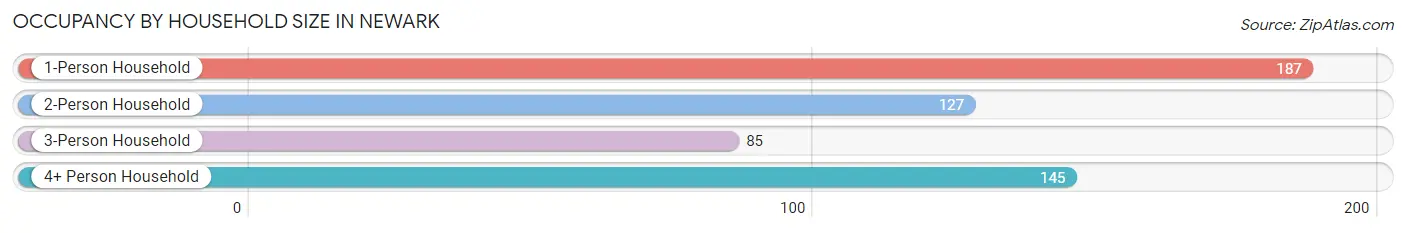
| Household Size | # Housing Units | % Housing Units |
| 1-Person Household | 187 | 34.4% |
| 2-Person Household | 127 | 23.4% |
| 3-Person Household | 85 | 15.6% |
| 4+ Person Household | 145 | 26.7% |
| Total Housing Units | 544 | 100.0% |
Occupancy by Ownership by Household Size in Newark
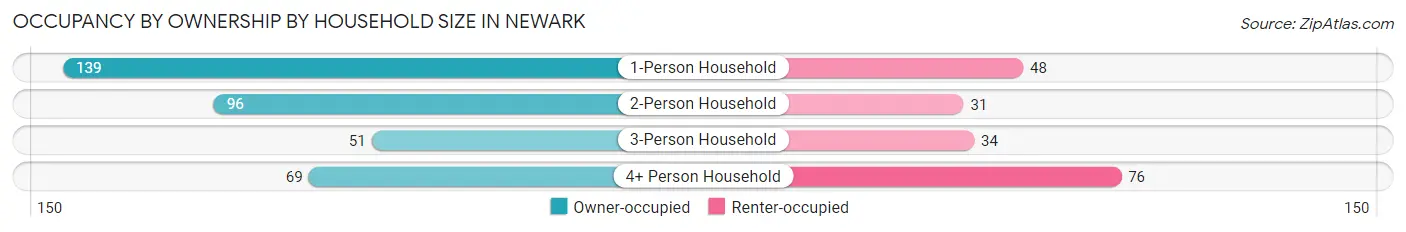
| Household Size | Owner-occupied | Renter-occupied |
| 1-Person Household | 139 (74.3%) | 48 (25.7%) |
| 2-Person Household | 96 (75.6%) | 31 (24.4%) |
| 3-Person Household | 51 (60.0%) | 34 (40.0%) |
| 4+ Person Household | 69 (47.6%) | 76 (52.4%) |
| Total Housing Units | 355 (65.3%) | 189 (34.7%) |
Occupancy by Educational Attainment in Newark
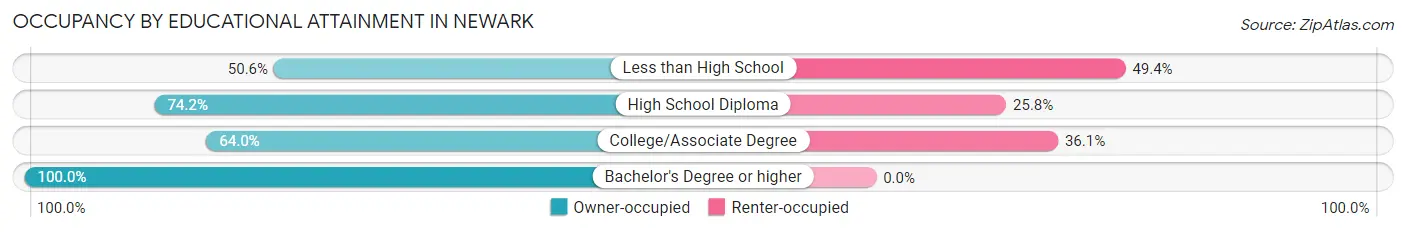
| Household Size | Owner-occupied | Renter-occupied |
| Less than High School | 87 (50.6%) | 85 (49.4%) |
| High School Diploma | 147 (74.2%) | 51 (25.8%) |
| College/Associate Degree | 94 (63.9%) | 53 (36.0%) |
| Bachelor's Degree or higher | 27 (100.0%) | 0 (0.0%) |
Occupancy by Age of Householder in Newark
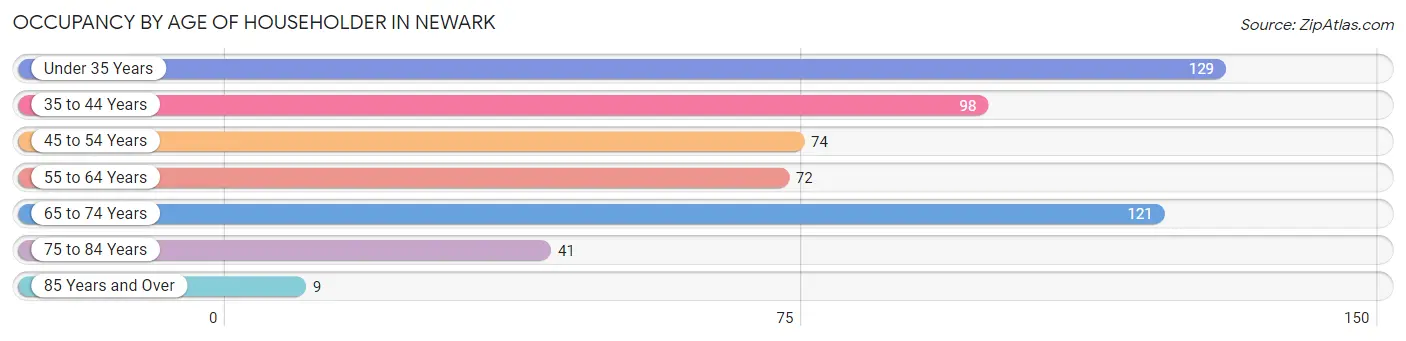
| Age Bracket | # Households | % Households |
| Under 35 Years | 129 | 23.7% |
| 35 to 44 Years | 98 | 18.0% |
| 45 to 54 Years | 74 | 13.6% |
| 55 to 64 Years | 72 | 13.2% |
| 65 to 74 Years | 121 | 22.2% |
| 75 to 84 Years | 41 | 7.5% |
| 85 Years and Over | 9 | 1.7% |
| Total | 544 | 100.0% |
Housing Finances in Newark
Median Income by Occupancy in Newark
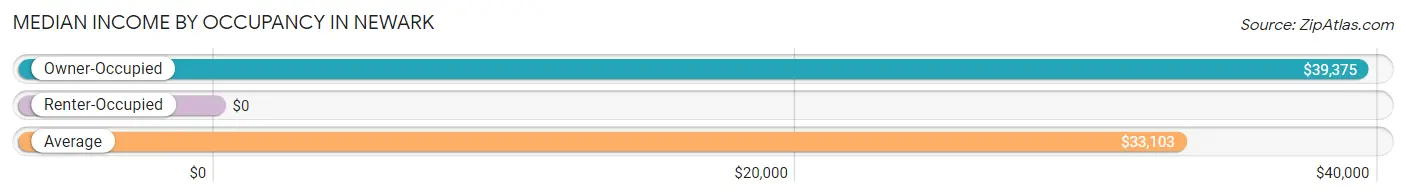
| Occupancy Type | # Households | Median Income |
| Owner-Occupied | 355 (65.3%) | $39,375 |
| Renter-Occupied | 189 (34.7%) | $0 |
| Average | 544 (100.0%) | $33,103 |
Occupancy by Householder Income Bracket in Newark
| Income Bracket | Owner-occupied | Renter-occupied |
| Less than $5,000 | 10 (2.8%) | 3 (1.6%) |
| $5,000 to $9,999 | 13 (3.7%) | 0 (0.0%) |
| $10,000 to $14,999 | 22 (6.2%) | 76 (40.2%) |
| $15,000 to $19,999 | 3 (0.9%) | 17 (9.0%) |
| $20,000 to $24,999 | 61 (17.2%) | 3 (1.6%) |
| $25,000 to $34,999 | 52 (14.6%) | 34 (18.0%) |
| $35,000 to $49,999 | 44 (12.4%) | 12 (6.4%) |
| $50,000 to $74,999 | 53 (14.9%) | 30 (15.9%) |
| $75,000 to $99,999 | 34 (9.6%) | 14 (7.4%) |
| $100,000 to $149,999 | 29 (8.2%) | 0 (0.0%) |
| $150,000 or more | 34 (9.6%) | 0 (0.0%) |
| Total | 355 (100.0%) | 189 (100.0%) |
Monthly Housing Cost Tiers in Newark
| Monthly Cost | Owner-occupied | Renter-occupied |
| Less than $300 | 57 (16.1%) | 15 (7.9%) |
| $300 to $499 | 62 (17.5%) | 10 (5.3%) |
| $500 to $799 | 116 (32.7%) | 87 (46.0%) |
| $800 to $999 | 46 (13.0%) | 23 (12.2%) |
| $1,000 to $1,499 | 49 (13.8%) | 6 (3.2%) |
| $1,500 to $1,999 | 17 (4.8%) | 0 (0.0%) |
| $2,000 to $2,499 | 8 (2.2%) | 0 (0.0%) |
| $2,500 to $2,999 | 0 (0.0%) | 0 (0.0%) |
| $3,000 or more | 0 (0.0%) | 0 (0.0%) |
| Total | 355 (100.0%) | 189 (100.0%) |
Physical Housing Characteristics in Newark
Housing Structures in Newark
| Structure Type | # Housing Units | % Housing Units |
| Single Unit, Detached | 342 | 62.9% |
| Single Unit, Attached | 0 | 0.0% |
| 2 Unit Apartments | 18 | 3.3% |
| 3 or 4 Unit Apartments | 61 | 11.2% |
| 5 to 9 Unit Apartments | 16 | 2.9% |
| 10 or more Apartments | 10 | 1.8% |
| Mobile Home / Other | 97 | 17.8% |
| Total | 544 | 100.0% |
Housing Structures by Occupancy in Newark
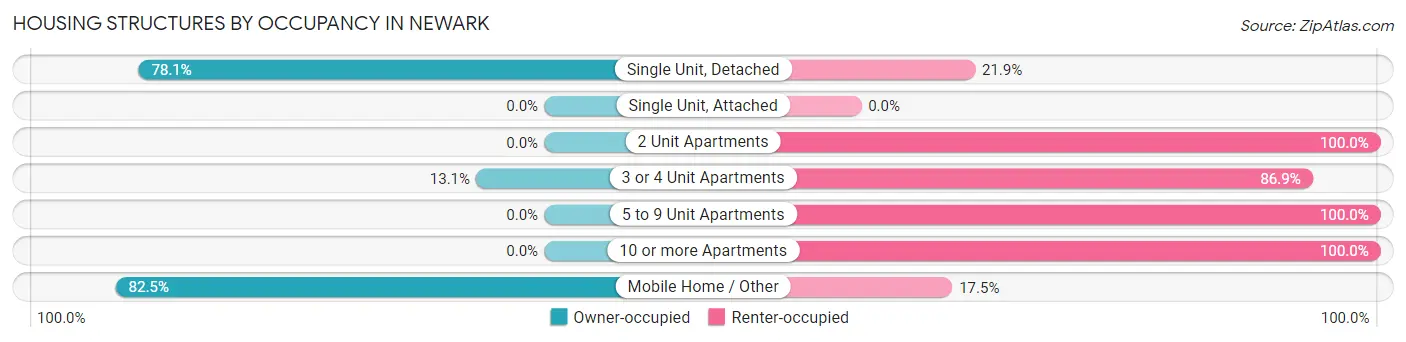
| Structure Type | Owner-occupied | Renter-occupied |
| Single Unit, Detached | 267 (78.1%) | 75 (21.9%) |
| Single Unit, Attached | 0 (0.0%) | 0 (0.0%) |
| 2 Unit Apartments | 0 (0.0%) | 18 (100.0%) |
| 3 or 4 Unit Apartments | 8 (13.1%) | 53 (86.9%) |
| 5 to 9 Unit Apartments | 0 (0.0%) | 16 (100.0%) |
| 10 or more Apartments | 0 (0.0%) | 10 (100.0%) |
| Mobile Home / Other | 80 (82.5%) | 17 (17.5%) |
| Total | 355 (65.3%) | 189 (34.7%) |
Housing Structures by Number of Rooms in Newark
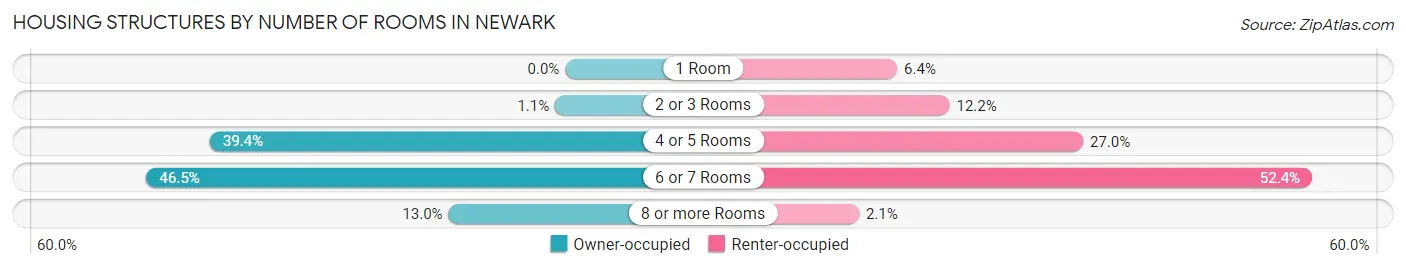
| Number of Rooms | Owner-occupied | Renter-occupied |
| 1 Room | 0 (0.0%) | 12 (6.4%) |
| 2 or 3 Rooms | 4 (1.1%) | 23 (12.2%) |
| 4 or 5 Rooms | 140 (39.4%) | 51 (27.0%) |
| 6 or 7 Rooms | 165 (46.5%) | 99 (52.4%) |
| 8 or more Rooms | 46 (13.0%) | 4 (2.1%) |
| Total | 355 (100.0%) | 189 (100.0%) |
Housing Structure by Heating Type in Newark
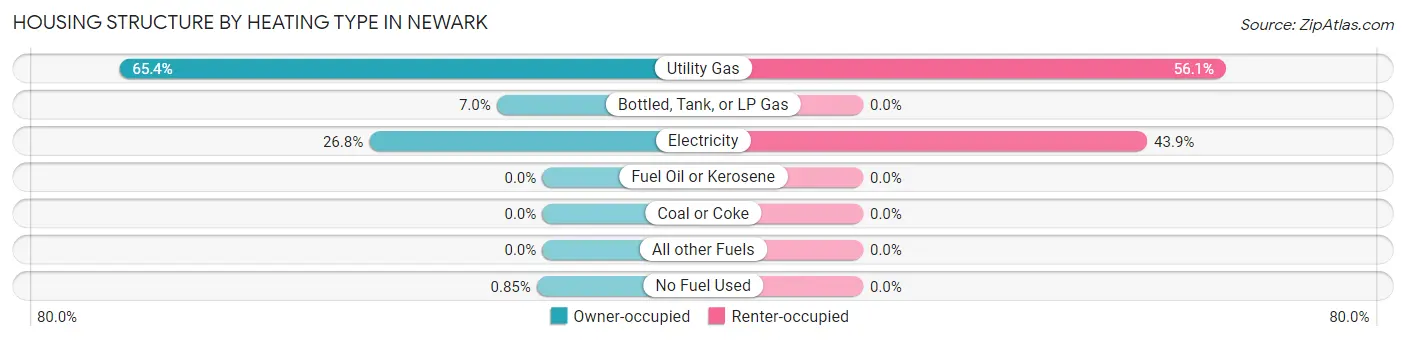
| Heating Type | Owner-occupied | Renter-occupied |
| Utility Gas | 232 (65.3%) | 106 (56.1%) |
| Bottled, Tank, or LP Gas | 25 (7.0%) | 0 (0.0%) |
| Electricity | 95 (26.8%) | 83 (43.9%) |
| Fuel Oil or Kerosene | 0 (0.0%) | 0 (0.0%) |
| Coal or Coke | 0 (0.0%) | 0 (0.0%) |
| All other Fuels | 0 (0.0%) | 0 (0.0%) |
| No Fuel Used | 3 (0.9%) | 0 (0.0%) |
| Total | 355 (100.0%) | 189 (100.0%) |
Household Vehicle Usage in Newark
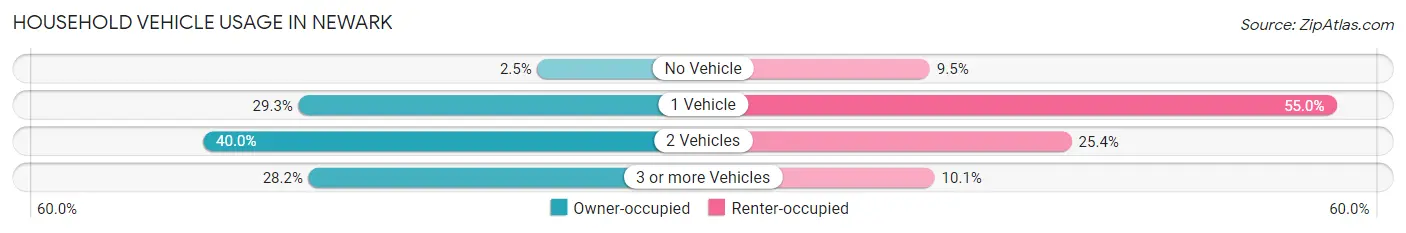
| Vehicles per Household | Owner-occupied | Renter-occupied |
| No Vehicle | 9 (2.5%) | 18 (9.5%) |
| 1 Vehicle | 104 (29.3%) | 104 (55.0%) |
| 2 Vehicles | 142 (40.0%) | 48 (25.4%) |
| 3 or more Vehicles | 100 (28.2%) | 19 (10.1%) |
| Total | 355 (100.0%) | 189 (100.0%) |
Real Estate & Mortgages in Newark
Real Estate and Mortgage Overview in Newark
| Characteristic | Without Mortgage | With Mortgage |
| Housing Units | 143 | 212 |
| Median Property Value | $56,300 | $96,800 |
| Median Household Income | $36,375 | $32 |
| Monthly Housing Costs | $343 | $0 |
| Real Estate Taxes | $523 | $29 |
Property Value by Mortgage Status in Newark
| Property Value | Without Mortgage | With Mortgage |
| Less than $50,000 | 69 (48.2%) | 53 (25.0%) |
| $50,000 to $99,999 | 40 (28.0%) | 74 (34.9%) |
| $100,000 to $299,999 | 32 (22.4%) | 74 (34.9%) |
| $300,000 to $499,999 | 0 (0.0%) | 11 (5.2%) |
| $500,000 to $749,999 | 2 (1.4%) | 0 (0.0%) |
| $750,000 to $999,999 | 0 (0.0%) | 0 (0.0%) |
| $1,000,000 or more | 0 (0.0%) | 0 (0.0%) |
| Total | 143 (100.0%) | 212 (100.0%) |
Household Income by Mortgage Status in Newark
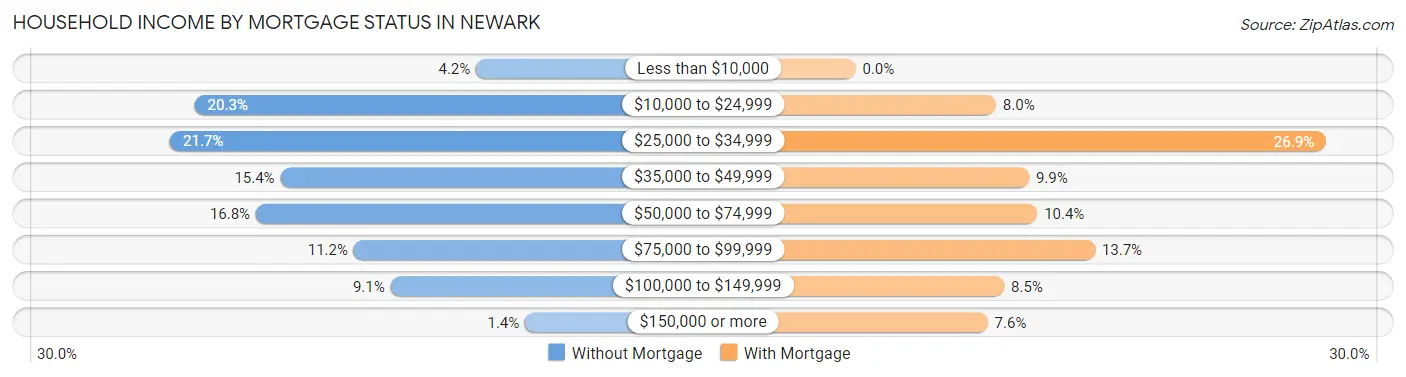
| Household Income | Without Mortgage | With Mortgage |
| Less than $10,000 | 6 (4.2%) | 0 (0.0%) |
| $10,000 to $24,999 | 29 (20.3%) | 17 (8.0%) |
| $25,000 to $34,999 | 31 (21.7%) | 57 (26.9%) |
| $35,000 to $49,999 | 22 (15.4%) | 21 (9.9%) |
| $50,000 to $74,999 | 24 (16.8%) | 22 (10.4%) |
| $75,000 to $99,999 | 16 (11.2%) | 29 (13.7%) |
| $100,000 to $149,999 | 13 (9.1%) | 18 (8.5%) |
| $150,000 or more | 2 (1.4%) | 16 (7.5%) |
| Total | 143 (100.0%) | 212 (100.0%) |
Property Value to Household Income Ratio in Newark
| Value-to-Income Ratio | Without Mortgage | With Mortgage |
| Less than 2.0x | 85 (59.4%) | 42,045 (19,832.6%) |
| 2.0x to 2.9x | 22 (15.4%) | 89 (42.0%) |
| 3.0x to 3.9x | 11 (7.7%) | 31 (14.6%) |
| 4.0x or more | 22 (15.4%) | 10 (4.7%) |
| Total | 143 (100.0%) | 212 (100.0%) |
Real Estate Taxes by Mortgage Status in Newark
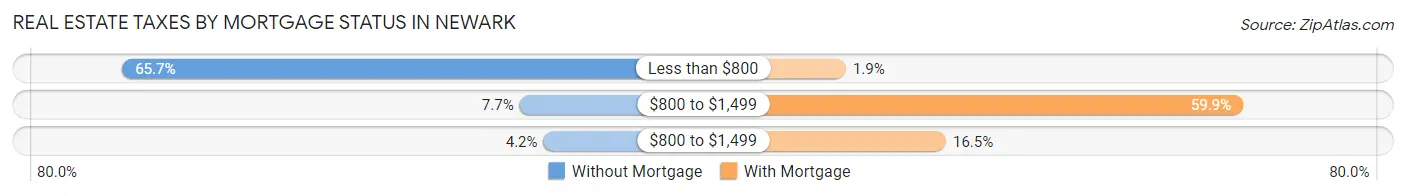
| Property Taxes | Without Mortgage | With Mortgage |
| Less than $800 | 94 (65.7%) | 4 (1.9%) |
| $800 to $1,499 | 11 (7.7%) | 127 (59.9%) |
| $800 to $1,499 | 6 (4.2%) | 35 (16.5%) |
| Total | 143 (100.0%) | 212 (100.0%) |
Health & Disability in Newark
Health Insurance Coverage by Age in Newark
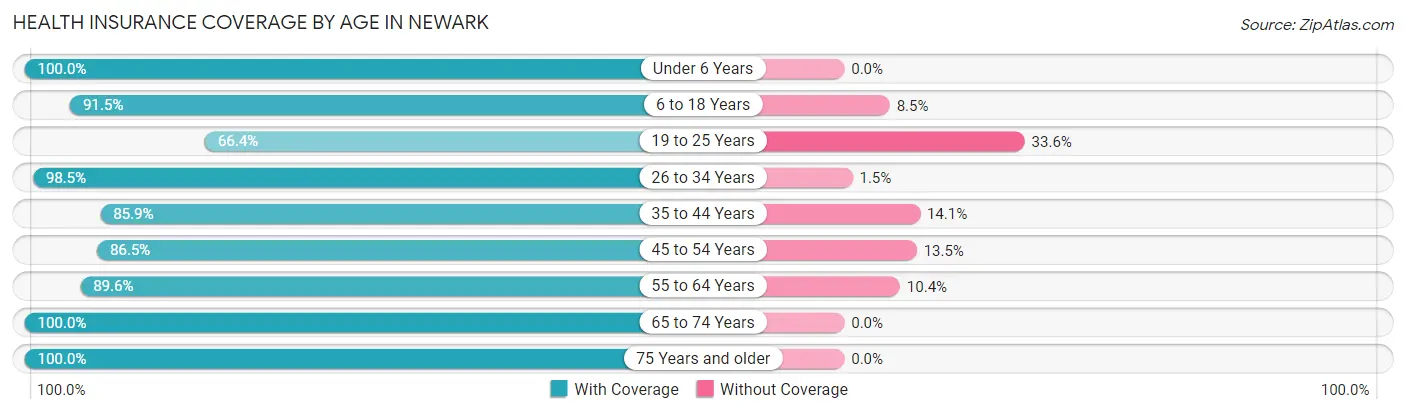
| Age Bracket | With Coverage | Without Coverage |
| Under 6 Years | 34 (100.0%) | 0 (0.0%) |
| 6 to 18 Years | 335 (91.5%) | 31 (8.5%) |
| 19 to 25 Years | 75 (66.4%) | 38 (33.6%) |
| 26 to 34 Years | 192 (98.5%) | 3 (1.5%) |
| 35 to 44 Years | 140 (85.9%) | 23 (14.1%) |
| 45 to 54 Years | 141 (86.5%) | 22 (13.5%) |
| 55 to 64 Years | 121 (89.6%) | 14 (10.4%) |
| 65 to 74 Years | 168 (100.0%) | 0 (0.0%) |
| 75 Years and older | 84 (100.0%) | 0 (0.0%) |
| Total | 1,290 (90.8%) | 131 (9.2%) |
Health Insurance Coverage by Citizenship Status in Newark
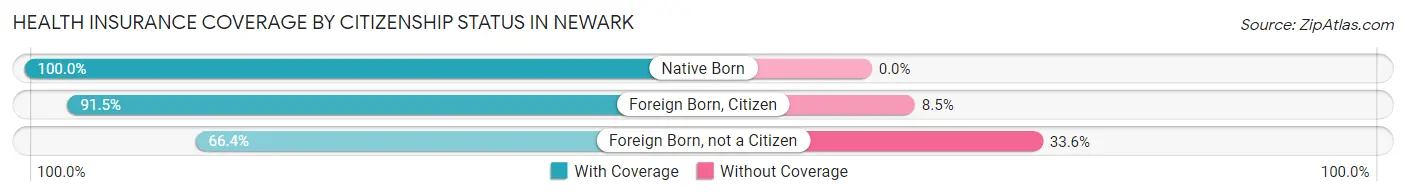
| Citizenship Status | With Coverage | Without Coverage |
| Native Born | 34 (100.0%) | 0 (0.0%) |
| Foreign Born, Citizen | 335 (91.5%) | 31 (8.5%) |
| Foreign Born, not a Citizen | 75 (66.4%) | 38 (33.6%) |
Health Insurance Coverage by Household Income in Newark
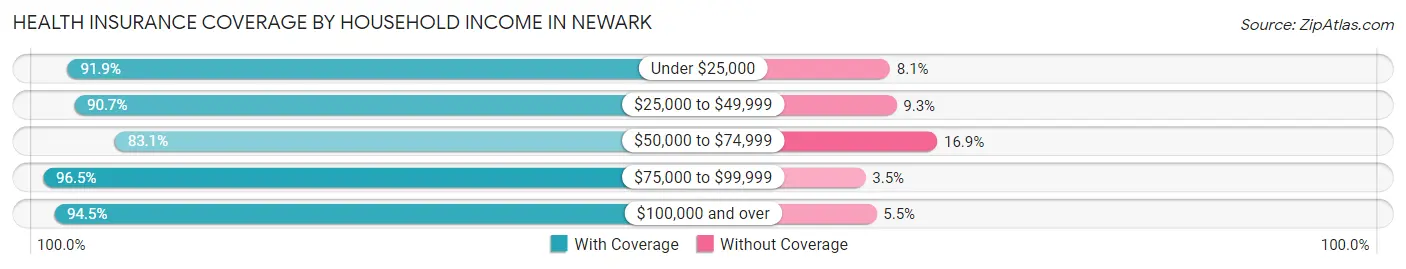
| Household Income | With Coverage | Without Coverage |
| Under $25,000 | 445 (91.9%) | 39 (8.1%) |
| $25,000 to $49,999 | 264 (90.7%) | 27 (9.3%) |
| $50,000 to $74,999 | 231 (83.1%) | 47 (16.9%) |
| $75,000 to $99,999 | 111 (96.5%) | 4 (3.5%) |
| $100,000 and over | 239 (94.5%) | 14 (5.5%) |
Public vs Private Health Insurance Coverage by Age in Newark
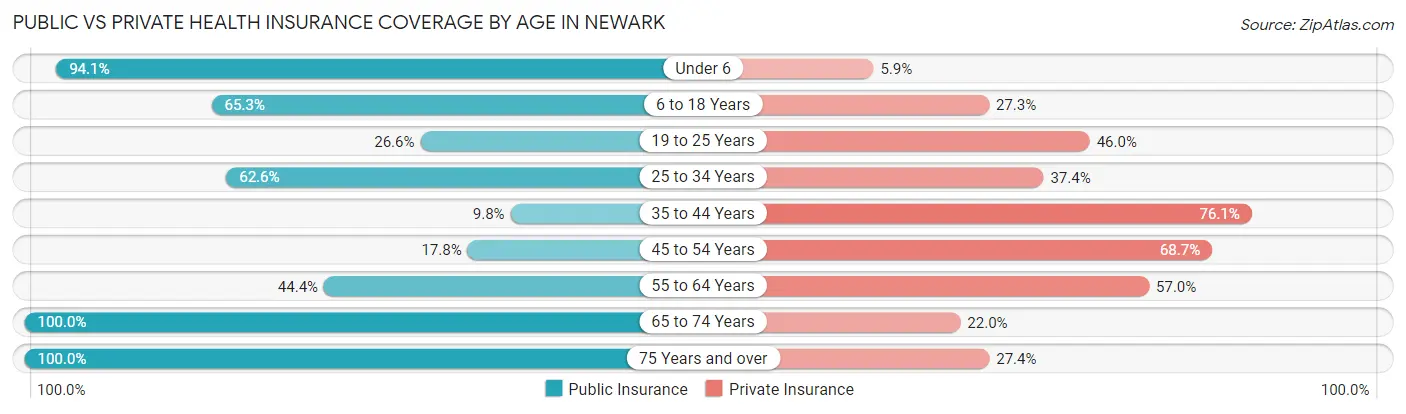
| Age Bracket | Public Insurance | Private Insurance |
| Under 6 | 32 (94.1%) | 2 (5.9%) |
| 6 to 18 Years | 239 (65.3%) | 100 (27.3%) |
| 19 to 25 Years | 30 (26.6%) | 52 (46.0%) |
| 25 to 34 Years | 122 (62.6%) | 73 (37.4%) |
| 35 to 44 Years | 16 (9.8%) | 124 (76.1%) |
| 45 to 54 Years | 29 (17.8%) | 112 (68.7%) |
| 55 to 64 Years | 60 (44.4%) | 77 (57.0%) |
| 65 to 74 Years | 168 (100.0%) | 37 (22.0%) |
| 75 Years and over | 84 (100.0%) | 23 (27.4%) |
| Total | 780 (54.9%) | 600 (42.2%) |
Disability Status by Sex by Age in Newark
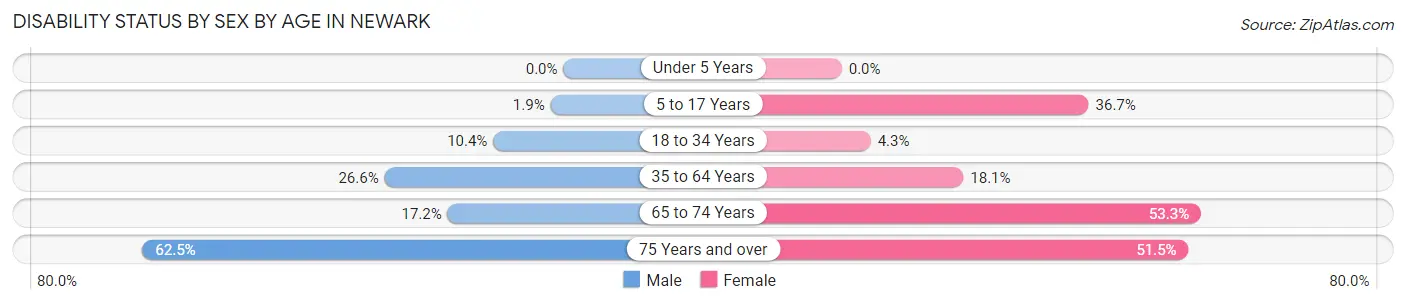
| Age Bracket | Male | Female |
| Under 5 Years | 0 (0.0%) | 0 (0.0%) |
| 5 to 17 Years | 3 (1.9%) | 70 (36.6%) |
| 18 to 34 Years | 15 (10.4%) | 8 (4.3%) |
| 35 to 64 Years | 68 (26.6%) | 37 (18.0%) |
| 65 to 74 Years | 16 (17.2%) | 40 (53.3%) |
| 75 Years and over | 10 (62.5%) | 35 (51.5%) |
Disability Class by Sex by Age in Newark
Disability Class: Hearing Difficulty
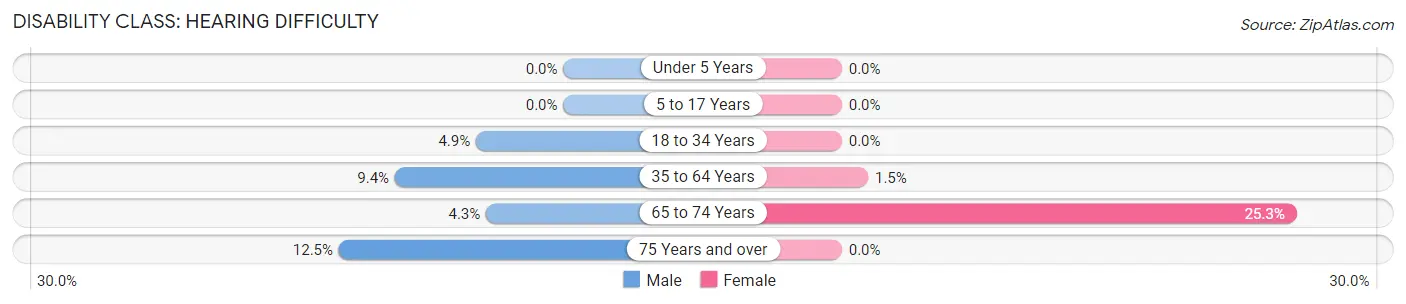
| Age Bracket | Male | Female |
| Under 5 Years | 0 (0.0%) | 0 (0.0%) |
| 5 to 17 Years | 0 (0.0%) | 0 (0.0%) |
| 18 to 34 Years | 7 (4.9%) | 0 (0.0%) |
| 35 to 64 Years | 24 (9.4%) | 3 (1.5%) |
| 65 to 74 Years | 4 (4.3%) | 19 (25.3%) |
| 75 Years and over | 2 (12.5%) | 0 (0.0%) |
Disability Class: Vision Difficulty
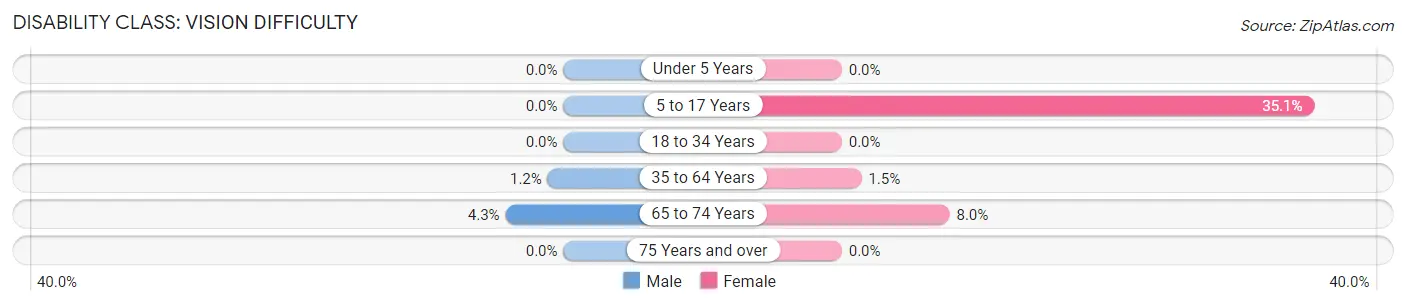
| Age Bracket | Male | Female |
| Under 5 Years | 0 (0.0%) | 0 (0.0%) |
| 5 to 17 Years | 0 (0.0%) | 67 (35.1%) |
| 18 to 34 Years | 0 (0.0%) | 0 (0.0%) |
| 35 to 64 Years | 3 (1.2%) | 3 (1.5%) |
| 65 to 74 Years | 4 (4.3%) | 6 (8.0%) |
| 75 Years and over | 0 (0.0%) | 0 (0.0%) |
Disability Class: Cognitive Difficulty
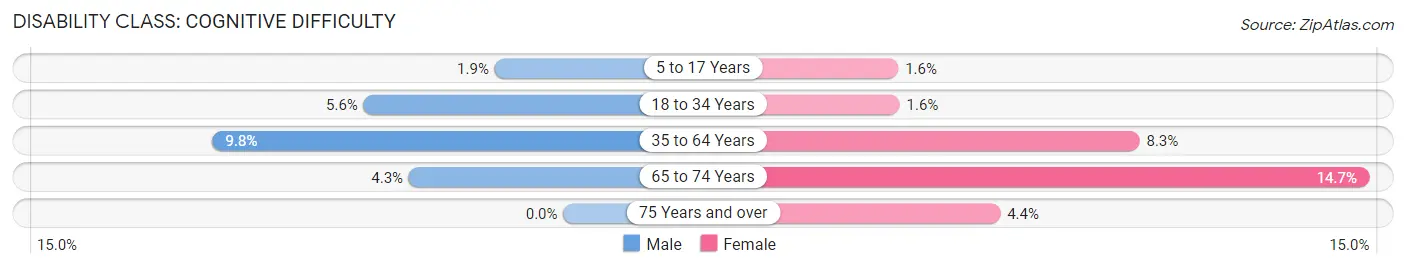
| Age Bracket | Male | Female |
| 5 to 17 Years | 3 (1.9%) | 3 (1.6%) |
| 18 to 34 Years | 8 (5.6%) | 3 (1.6%) |
| 35 to 64 Years | 25 (9.8%) | 17 (8.3%) |
| 65 to 74 Years | 4 (4.3%) | 11 (14.7%) |
| 75 Years and over | 0 (0.0%) | 3 (4.4%) |
Disability Class: Ambulatory Difficulty
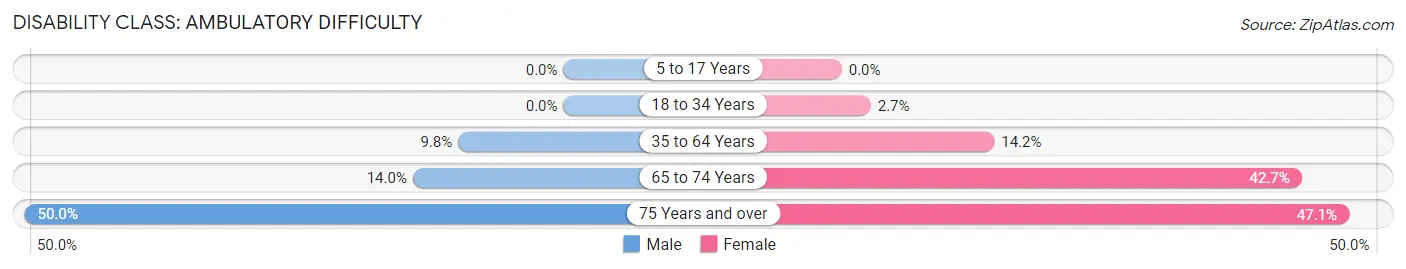
| Age Bracket | Male | Female |
| 5 to 17 Years | 0 (0.0%) | 0 (0.0%) |
| 18 to 34 Years | 0 (0.0%) | 5 (2.7%) |
| 35 to 64 Years | 25 (9.8%) | 29 (14.1%) |
| 65 to 74 Years | 13 (14.0%) | 32 (42.7%) |
| 75 Years and over | 8 (50.0%) | 32 (47.1%) |
Disability Class: Self-Care Difficulty
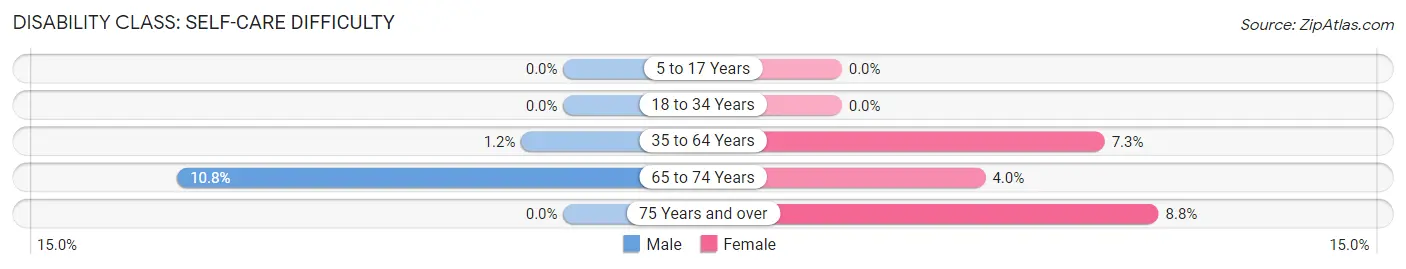
| Age Bracket | Male | Female |
| 5 to 17 Years | 0 (0.0%) | 0 (0.0%) |
| 18 to 34 Years | 0 (0.0%) | 0 (0.0%) |
| 35 to 64 Years | 3 (1.2%) | 15 (7.3%) |
| 65 to 74 Years | 10 (10.7%) | 3 (4.0%) |
| 75 Years and over | 0 (0.0%) | 6 (8.8%) |
Technology Access in Newark
Computing Device Access in Newark
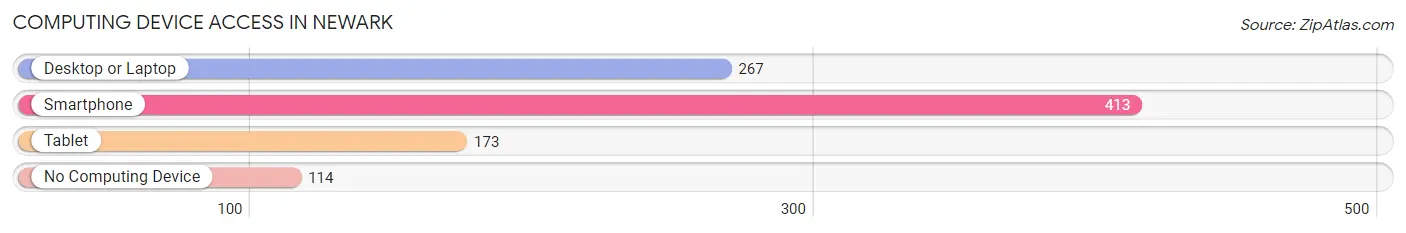
| Device Type | # Households | % Households |
| Desktop or Laptop | 267 | 49.1% |
| Smartphone | 413 | 75.9% |
| Tablet | 173 | 31.8% |
| No Computing Device | 114 | 21.0% |
| Total | 544 | 100.0% |
Internet Access in Newark
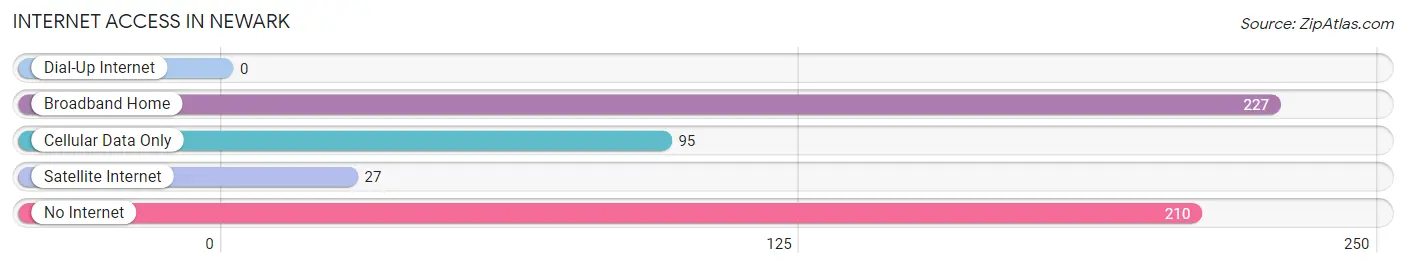
| Internet Type | # Households | % Households |
| Dial-Up Internet | 0 | 0.0% |
| Broadband Home | 227 | 41.7% |
| Cellular Data Only | 95 | 17.5% |
| Satellite Internet | 27 | 5.0% |
| No Internet | 210 | 38.6% |
| Total | 544 | 100.0% |
Newark Summary
Newark is a small city located in the northeast corner of Arkansas, in the foothills of the Ozark Mountains. It is the county seat of Randolph County and is situated on the banks of the Black River. The city has a population of 1,845 people, according to the 2010 census.
History
The area that is now Newark was first settled in the early 1800s by settlers from the nearby town of Pocahontas. The first post office was established in 1837, and the town was officially incorporated in 1883. The city was named after Newark, New Jersey, and was originally known as "Newark Station" due to its location on the St. Louis and Iron Mountain Railroad.
The city was a major center for the timber industry in the late 19th and early 20th centuries. The timber industry was so important to the city that it was nicknamed "The Lumber Capital of the Ozarks." The city also had a thriving agricultural industry, with cotton, corn, and soybeans being the main crops.
Geography
Newark is located in the northeast corner of Arkansas, in the foothills of the Ozark Mountains. It is situated on the banks of the Black River, which flows through the city. The city is located about 30 miles south of Jonesboro and about 50 miles north of Little Rock.
The city has a total area of 2.2 square miles, all of which is land. The city is located at an elevation of 545 feet above sea level.
Economy
The economy of Newark is largely based on agriculture and timber. The city is home to several large timber companies, including Weyerhaeuser and Georgia-Pacific. The city also has a thriving agricultural industry, with cotton, corn, and soybeans being the main crops.
The city also has a growing tourism industry, with several attractions, including the Black River National Wildlife Refuge, the Ozark National Forest, and the historic downtown area.
Demographics
According to the 2010 census, the population of Newark was 1,845 people. The racial makeup of the city was 95.3% White, 0.7% African American, 0.3% Native American, 0.2% Asian, 0.1% Pacific Islander, 1.7% from other races, and 1.9% from two or more races. Hispanic or Latino of any race were 3.2% of the population.
The median household income in the city was $30,938, and the median family income was $37,813. The per capita income for the city was $17,845. About 17.2% of the population was below the poverty line.
Common Questions
What is Per Capita Income in Newark?
Per Capita income in Newark is $20,214.
What is the Median Family Income in Newark?
Median Family Income in Newark is $44,554.
What is the Median Household income in Newark?
Median Household Income in Newark is $33,103.
What is Income or Wage Gap in Newark?
Income or Wage Gap in Newark is 16.5%.
Women in Newark earn 83.5 cents for every dollar earned by a man.
What is Family Income Deficit in Newark?
Family Income Deficit in Newark is $13,801.
Families that are below poverty line in Newark earn $13,801 less on average than the poverty threshold level.
What is Inequality or Gini Index in Newark?
Inequality or Gini Index in Newark is 0.46.
What is the Total Population of Newark?
Total Population of Newark is 1,421.
What is the Total Male Population of Newark?
Total Male Population of Newark is 678.
What is the Total Female Population of Newark?
Total Female Population of Newark is 743.
What is the Ratio of Males per 100 Females in Newark?
There are 91.25 Males per 100 Females in Newark.
What is the Ratio of Females per 100 Males in Newark?
There are 109.59 Females per 100 Males in Newark.
What is the Median Population Age in Newark?
Median Population Age in Newark is 35.1 Years.
What is the Average Family Size in Newark
Average Family Size in Newark is 3.4 People.
What is the Average Household Size in Newark
Average Household Size in Newark is 2.6 People.
How Large is the Labor Force in Newark?
There are 503 People in the Labor Forcein in Newark.
What is the Percentage of People in the Labor Force in Newark?
47.3% of People are in the Labor Force in Newark.
What is the Unemployment Rate in Newark?
Unemployment Rate in Newark is 3.0%.