Maumelle, AR Map & Demographics
Maumelle Map
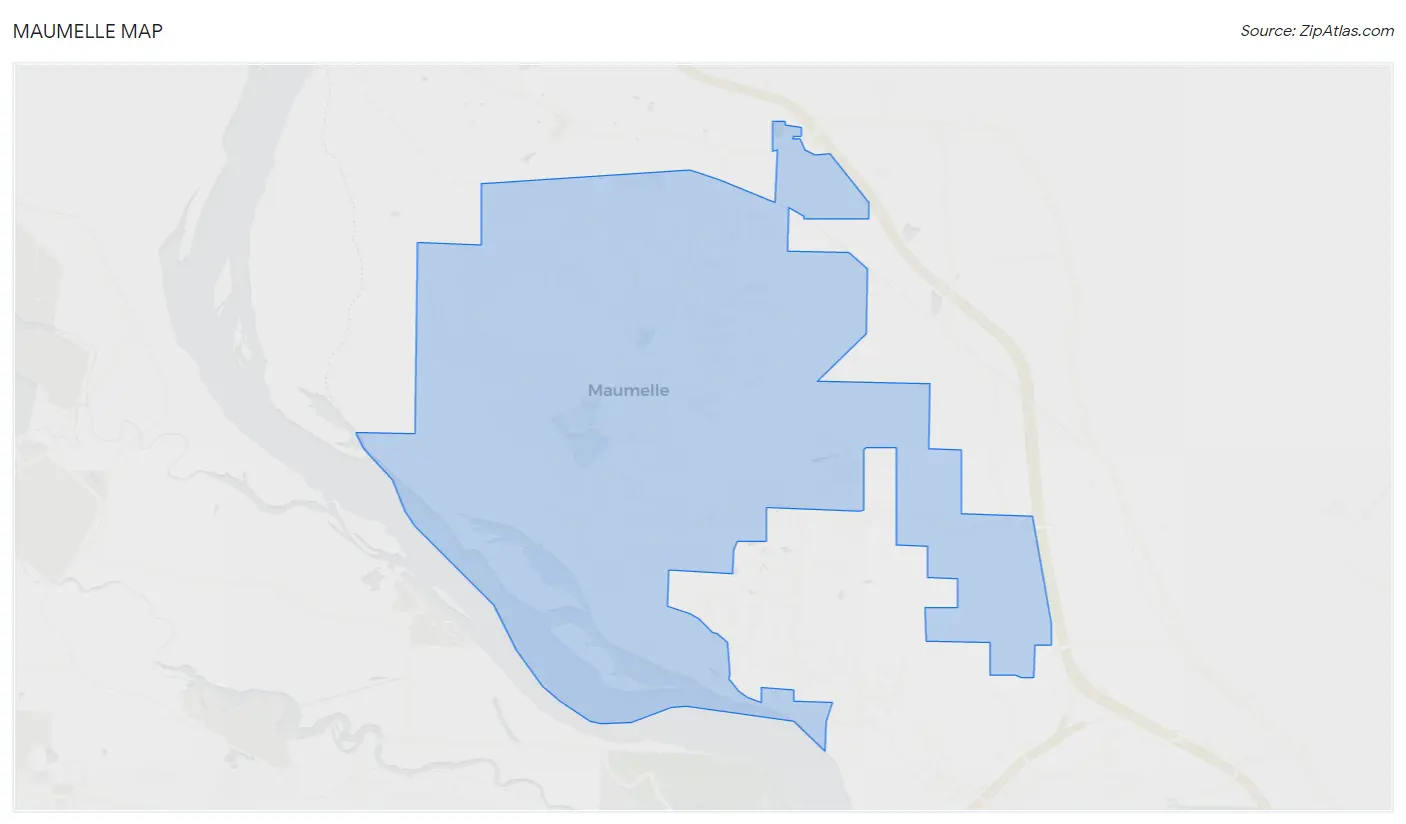
Maumelle Overview
$50,916
PER CAPITA INCOME
$126,057
AVG FAMILY INCOME
$89,880
AVG HOUSEHOLD INCOME
21.0%
WAGE / INCOME GAP [ % ]
79.0¢/ $1
WAGE / INCOME GAP [ $ ]
0.46
INEQUALITY / GINI INDEX
19,183
TOTAL POPULATION
9,003
MALE POPULATION
10,180
FEMALE POPULATION
88.44
MALES / 100 FEMALES
113.07
FEMALES / 100 MALES
38.9
MEDIAN AGE
3.0
AVG FAMILY SIZE
2.5
AVG HOUSEHOLD SIZE
9,767
LABOR FORCE [ PEOPLE ]
64.3%
PERCENT IN LABOR FORCE
4.7%
UNEMPLOYMENT RATE
Maumelle Zip Codes
Maumelle Area Codes
Income in Maumelle
Income Overview in Maumelle
Per Capita Income in Maumelle is $50,916, while median incomes of families and households are $126,057 and $89,880 respectively.
| Characteristic | Number | Measure |
| Per Capita Income | 19,183 | $50,916 |
| Median Family Income | 5,438 | $126,057 |
| Mean Family Income | 5,438 | $155,046 |
| Median Household Income | 7,605 | $89,880 |
| Mean Household Income | 7,605 | $127,181 |
| Income Deficit | 5,438 | $0 |
| Wage / Income Gap (%) | 19,183 | 20.97% |
| Wage / Income Gap ($) | 19,183 | 79.03¢ per $1 |
| Gini / Inequality Index | 19,183 | 0.46 |
Earnings by Sex in Maumelle
Average Earnings in Maumelle are $49,706, $57,773 for men and $45,660 for women, a difference of 21.0%.
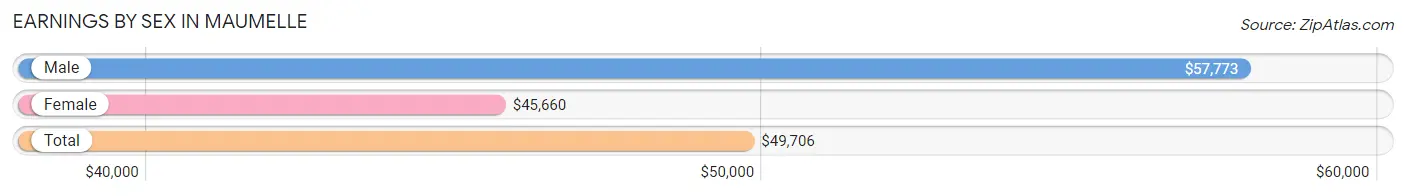
| Sex | Number | Average Earnings |
| Male | 5,250 (52.3%) | $57,773 |
| Female | 4,782 (47.7%) | $45,660 |
| Total | 10,032 (100.0%) | $49,706 |
Earnings by Sex by Income Bracket in Maumelle
The most common earnings brackets in Maumelle are $100,000+ for men (1,370 | 26.1%) and $100,000+ for women (738 | 15.4%).
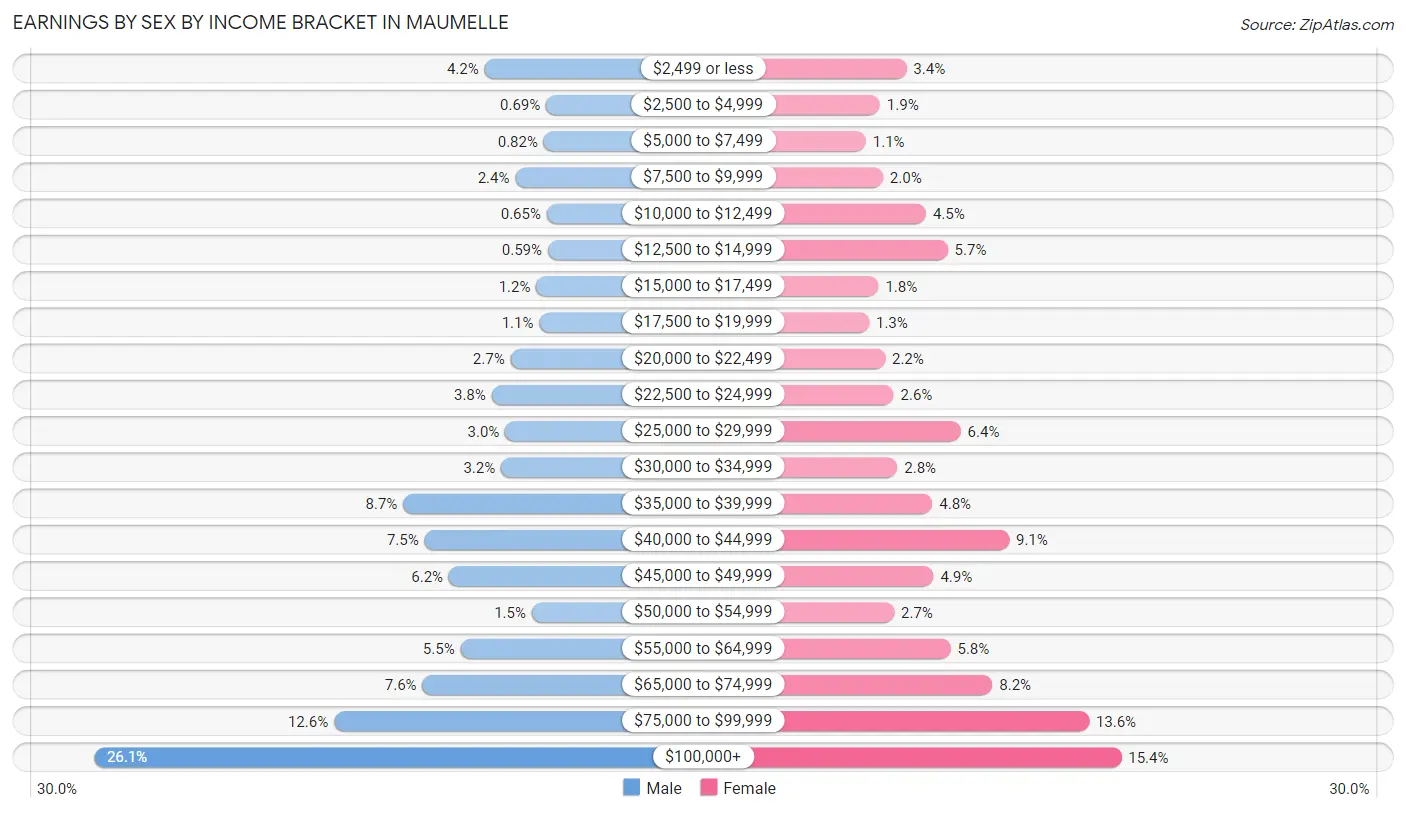
| Income | Male | Female |
| $2,499 or less | 218 (4.2%) | 160 (3.4%) |
| $2,500 to $4,999 | 36 (0.7%) | 89 (1.9%) |
| $5,000 to $7,499 | 43 (0.8%) | 51 (1.1%) |
| $7,500 to $9,999 | 127 (2.4%) | 97 (2.0%) |
| $10,000 to $12,499 | 34 (0.6%) | 213 (4.4%) |
| $12,500 to $14,999 | 31 (0.6%) | 271 (5.7%) |
| $15,000 to $17,499 | 65 (1.2%) | 85 (1.8%) |
| $17,500 to $19,999 | 56 (1.1%) | 60 (1.3%) |
| $20,000 to $22,499 | 141 (2.7%) | 103 (2.1%) |
| $22,500 to $24,999 | 197 (3.7%) | 126 (2.6%) |
| $25,000 to $29,999 | 157 (3.0%) | 306 (6.4%) |
| $30,000 to $34,999 | 169 (3.2%) | 136 (2.8%) |
| $35,000 to $39,999 | 458 (8.7%) | 230 (4.8%) |
| $40,000 to $44,999 | 395 (7.5%) | 436 (9.1%) |
| $45,000 to $49,999 | 323 (6.1%) | 233 (4.9%) |
| $50,000 to $54,999 | 78 (1.5%) | 127 (2.7%) |
| $55,000 to $64,999 | 289 (5.5%) | 279 (5.8%) |
| $65,000 to $74,999 | 401 (7.6%) | 391 (8.2%) |
| $75,000 to $99,999 | 662 (12.6%) | 651 (13.6%) |
| $100,000+ | 1,370 (26.1%) | 738 (15.4%) |
| Total | 5,250 (100.0%) | 4,782 (100.0%) |
Earnings by Sex by Educational Attainment in Maumelle
Average earnings in Maumelle are $70,516 for men and $55,408 for women, a difference of 21.4%. Men with an educational attainment of bachelor's degree enjoy the highest average annual earnings of $106,058, while those with college or associate's degree education earn the least with $46,895. Women with an educational attainment of graduate degree earn the most with the average annual earnings of $78,394, while those with high school diploma education have the smallest earnings of $29,000.
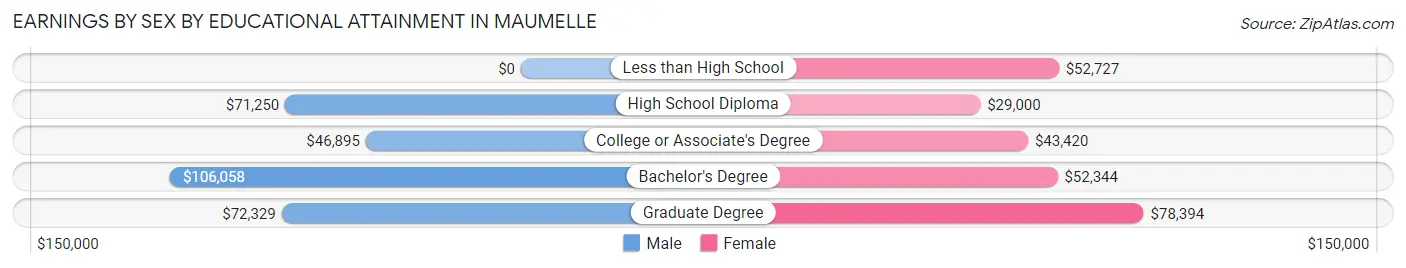
| Educational Attainment | Male Income | Female Income |
| Less than High School | - | - |
| High School Diploma | $71,250 | $29,000 |
| College or Associate's Degree | $46,895 | $43,420 |
| Bachelor's Degree | $106,058 | $52,344 |
| Graduate Degree | $72,329 | $78,394 |
| Total | $70,516 | $55,408 |
Family Income in Maumelle
Family Income Brackets in Maumelle
According to the Maumelle family income data, there are 1,164 families falling into the $100,000 to $149,999 income range, which is the most common income bracket and makes up 21.4% of all families. Conversely, the $15,000 to $24,999 income bracket is the least frequent group with only 22 families (0.4%) belonging to this category.
| Income Bracket | # Families | % Families |
| Less than $10,000 | 125 | 2.3% |
| $10,000 to $14,999 | 125 | 2.3% |
| $15,000 to $24,999 | 22 | 0.4% |
| $25,000 to $34,999 | 141 | 2.6% |
| $35,000 to $49,999 | 397 | 7.3% |
| $50,000 to $74,999 | 642 | 11.8% |
| $75,000 to $99,999 | 805 | 14.8% |
| $100,000 to $149,999 | 1,164 | 21.4% |
| $150,000 to $199,999 | 897 | 16.5% |
| $200,000+ | 1,120 | 20.6% |
Family Income by Famaliy Size in Maumelle
5-person families (543 | 10.0%) account for the highest median family income in Maumelle with $250,001 per family, while 5-person families (543 | 10.0%) have the highest median income of $50,000 per family member.
| Income Bracket | # Families | Median Income |
| 2-Person Families | 2,475 (45.5%) | $90,615 |
| 3-Person Families | 1,626 (29.9%) | $141,027 |
| 4-Person Families | 794 (14.6%) | $138,194 |
| 5-Person Families | 543 (10.0%) | $250,001 |
| 6-Person Families | 0 (0.0%) | $0 |
| 7+ Person Families | 0 (0.0%) | $0 |
| Total | 5,438 (100.0%) | $126,057 |
Family Income by Number of Earners in Maumelle
The median family income in Maumelle is $126,057, with families comprising 3+ earners (436) having the highest median family income of $250,001, while families with no earners (1,152) have the lowest median family income of $68,750, accounting for 8.0% and 21.2% of families, respectively.
| Number of Earners | # Families | Median Income |
| No Earners | 1,152 (21.2%) | $68,750 |
| 1 Earner | 1,161 (21.3%) | $87,257 |
| 2 Earners | 2,689 (49.4%) | $135,765 |
| 3+ Earners | 436 (8.0%) | $250,001 |
| Total | 5,438 (100.0%) | $126,057 |
Household Income in Maumelle
Household Income Brackets in Maumelle
With 1,262 households falling in the category, the $100,000 to $149,999 income range is the most frequent in Maumelle, accounting for 16.6% of all households. In contrast, only 183 households (2.4%) fall into the $10,000 to $14,999 income bracket, making it the least populous group.
| Income Bracket | # Households | % Households |
| Less than $10,000 | 304 | 4.0% |
| $10,000 to $14,999 | 183 | 2.4% |
| $15,000 to $24,999 | 304 | 4.0% |
| $25,000 to $34,999 | 510 | 6.7% |
| $35,000 to $49,999 | 631 | 8.3% |
| $50,000 to $74,999 | 1,255 | 16.5% |
| $75,000 to $99,999 | 973 | 12.8% |
| $100,000 to $149,999 | 1,262 | 16.6% |
| $150,000 to $199,999 | 989 | 13.0% |
| $200,000+ | 1,186 | 15.6% |
Household Income by Householder Age in Maumelle
The median household income in Maumelle is $89,880, with the highest median household income of $127,955 found in the 45 to 64 years age bracket for the primary householder. A total of 2,152 households (28.3%) fall into this category. Meanwhile, the 15 to 24 years age bracket for the primary householder has the lowest median household income of $52,911, with 514 households (6.8%) in this group.
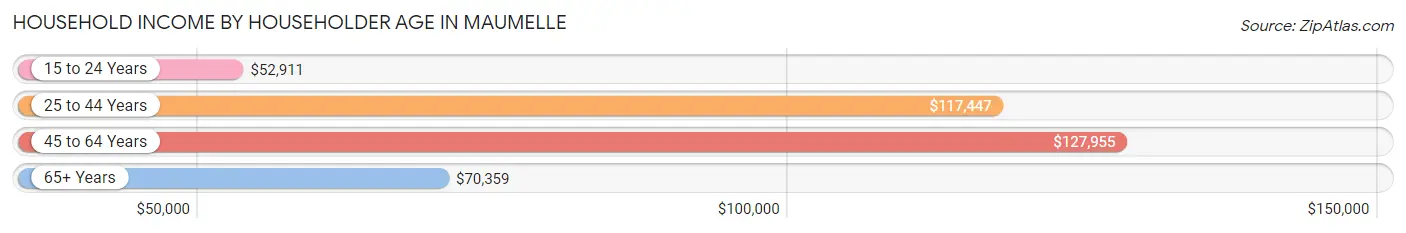
| Income Bracket | # Households | Median Income |
| 15 to 24 Years | 514 (6.8%) | $52,911 |
| 25 to 44 Years | 2,802 (36.8%) | $117,447 |
| 45 to 64 Years | 2,152 (28.3%) | $127,955 |
| 65+ Years | 2,137 (28.1%) | $70,359 |
| Total | 7,605 (100.0%) | $89,880 |
Poverty in Maumelle
Income Below Poverty by Sex and Age in Maumelle
With 2.4% poverty level for males and 10.7% for females among the residents of Maumelle, 45 to 54 year old males and under 5 year old females are the most vulnerable to poverty, with 124 males (11.3%) and 351 females (59.3%) in their respective age groups living below the poverty level.
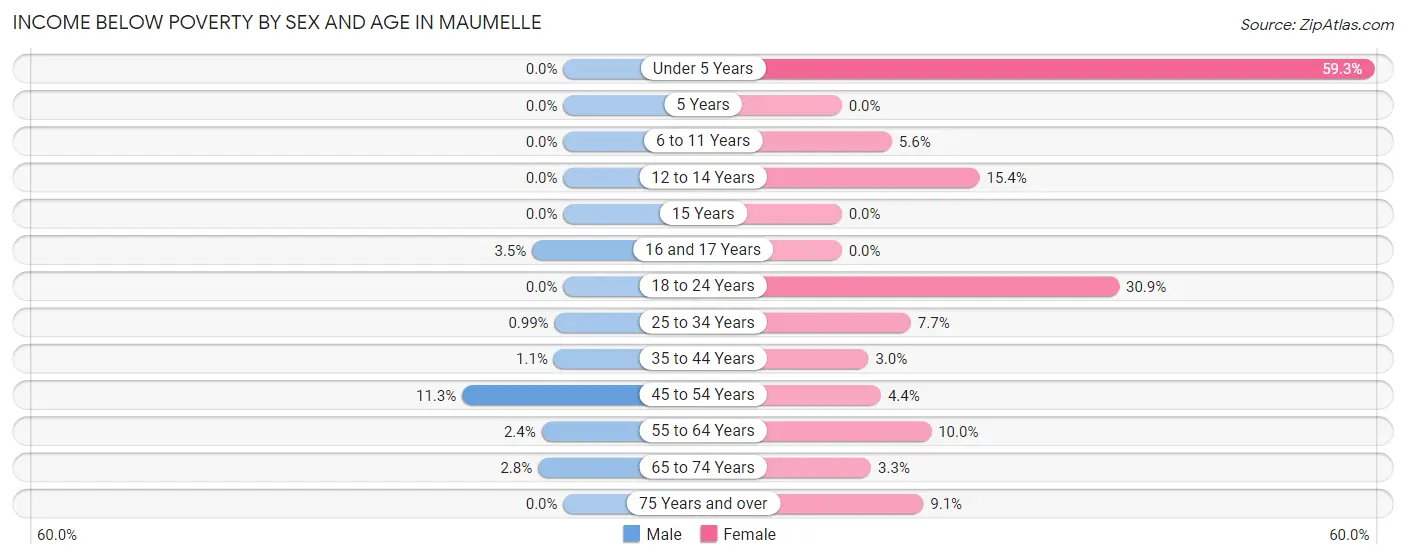
| Age Bracket | Male | Female |
| Under 5 Years | 0 (0.0%) | 351 (59.3%) |
| 5 Years | 0 (0.0%) | 0 (0.0%) |
| 6 to 11 Years | 0 (0.0%) | 44 (5.6%) |
| 12 to 14 Years | 0 (0.0%) | 37 (15.3%) |
| 15 Years | 0 (0.0%) | 0 (0.0%) |
| 16 and 17 Years | 12 (3.5%) | 0 (0.0%) |
| 18 to 24 Years | 0 (0.0%) | 252 (30.9%) |
| 25 to 34 Years | 14 (1.0%) | 72 (7.7%) |
| 35 to 44 Years | 15 (1.1%) | 51 (3.0%) |
| 45 to 54 Years | 124 (11.3%) | 49 (4.4%) |
| 55 to 64 Years | 20 (2.4%) | 130 (10.0%) |
| 65 to 74 Years | 26 (2.8%) | 36 (3.3%) |
| 75 Years and over | 0 (0.0%) | 62 (9.1%) |
| Total | 211 (2.4%) | 1,084 (10.7%) |
Income Above Poverty by Sex and Age in Maumelle
According to the poverty statistics in Maumelle, males aged under 5 years and females aged 5 years are the age groups that are most secure financially, with 100.0% of males and 100.0% of females in these age groups living above the poverty line.
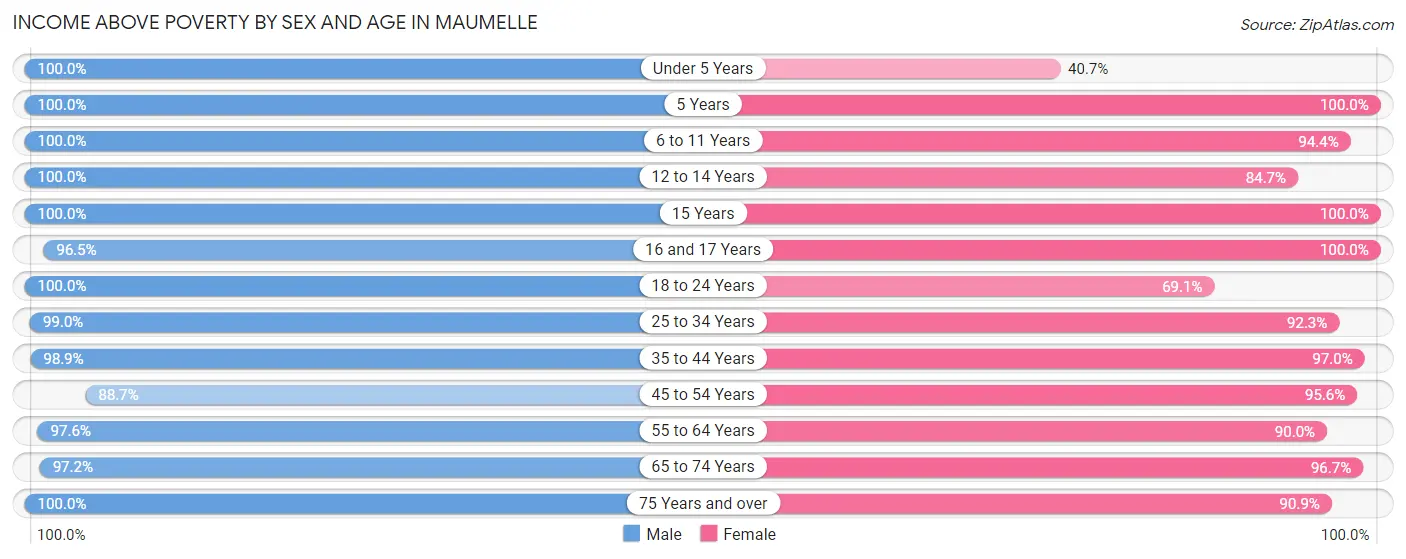
| Age Bracket | Male | Female |
| Under 5 Years | 521 (100.0%) | 241 (40.7%) |
| 5 Years | 106 (100.0%) | 107 (100.0%) |
| 6 to 11 Years | 504 (100.0%) | 744 (94.4%) |
| 12 to 14 Years | 516 (100.0%) | 204 (84.7%) |
| 15 Years | 171 (100.0%) | 420 (100.0%) |
| 16 and 17 Years | 333 (96.5%) | 337 (100.0%) |
| 18 to 24 Years | 543 (100.0%) | 564 (69.1%) |
| 25 to 34 Years | 1,401 (99.0%) | 863 (92.3%) |
| 35 to 44 Years | 1,393 (98.9%) | 1,665 (97.0%) |
| 45 to 54 Years | 975 (88.7%) | 1,074 (95.6%) |
| 55 to 64 Years | 802 (97.6%) | 1,175 (90.0%) |
| 65 to 74 Years | 895 (97.2%) | 1,066 (96.7%) |
| 75 Years and over | 602 (100.0%) | 621 (90.9%) |
| Total | 8,762 (97.7%) | 9,081 (89.3%) |
Income Below Poverty Among Married-Couple Families in Maumelle
The poverty statistics for married-couple families in Maumelle show that 1.4% or 63 of the total 4,499 families live below the poverty line. Families with 1 or 2 children have the highest poverty rate of 2.3%, comprising of 36 families. On the other hand, families with 3 or 4 children have the lowest poverty rate of 0.0%, which includes 0 families.
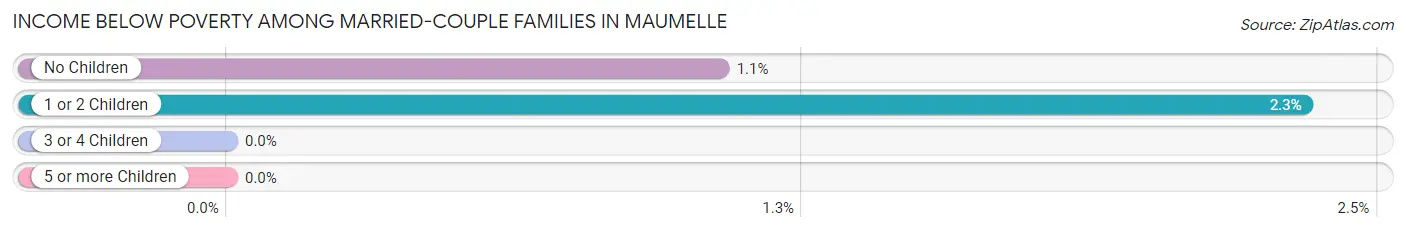
| Children | Above Poverty | Below Poverty |
| No Children | 2,504 (98.9%) | 27 (1.1%) |
| 1 or 2 Children | 1,501 (97.7%) | 36 (2.3%) |
| 3 or 4 Children | 431 (100.0%) | 0 (0.0%) |
| 5 or more Children | 0 (0.0%) | 0 (0.0%) |
| Total | 4,436 (98.6%) | 63 (1.4%) |
Income Below Poverty Among Single-Parent Households in Maumelle
According to the poverty data in Maumelle, 3.6% or 12 single-father households and 30.9% or 188 single-mother households are living below the poverty line. Among single-father households, those with 1 or 2 children have the highest poverty rate, with 12 households (18.2%) experiencing poverty. Likewise, among single-mother households, those with 1 or 2 children have the highest poverty rate, with 169 households (35.6%) falling below the poverty line.
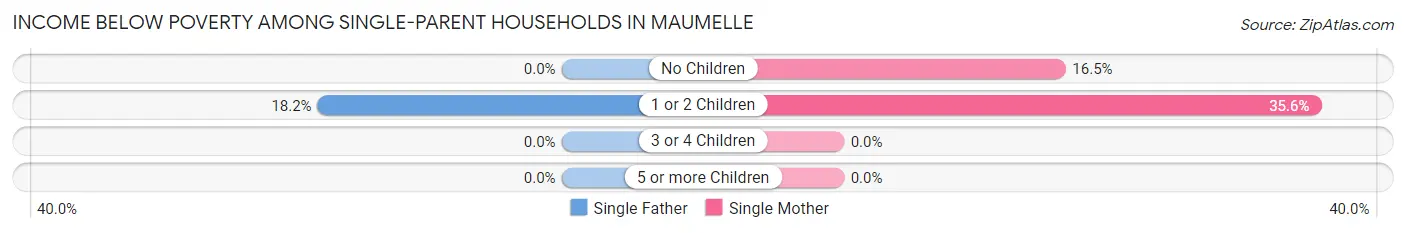
| Children | Single Father | Single Mother |
| No Children | 0 (0.0%) | 19 (16.5%) |
| 1 or 2 Children | 12 (18.2%) | 169 (35.6%) |
| 3 or 4 Children | 0 (0.0%) | 0 (0.0%) |
| 5 or more Children | 0 (0.0%) | 0 (0.0%) |
| Total | 12 (3.6%) | 188 (30.9%) |
Income Below Poverty Among Married-Couple vs Single-Parent Households in Maumelle
The poverty data for Maumelle shows that 63 of the married-couple family households (1.4%) and 200 of the single-parent households (21.3%) are living below the poverty level. Within the married-couple family households, those with 1 or 2 children have the highest poverty rate, with 36 households (2.3%) falling below the poverty line. Among the single-parent households, those with 1 or 2 children have the highest poverty rate, with 181 household (33.5%) living below poverty.
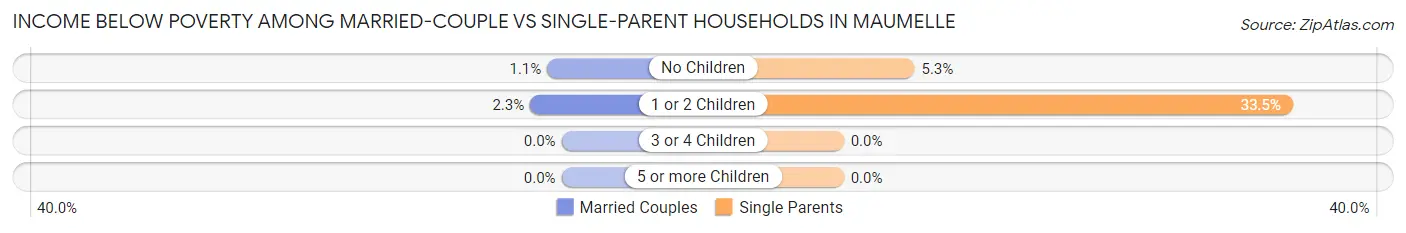
| Children | Married-Couple Families | Single-Parent Households |
| No Children | 27 (1.1%) | 19 (5.3%) |
| 1 or 2 Children | 36 (2.3%) | 181 (33.5%) |
| 3 or 4 Children | 0 (0.0%) | 0 (0.0%) |
| 5 or more Children | 0 (0.0%) | 0 (0.0%) |
| Total | 63 (1.4%) | 200 (21.3%) |
Race in Maumelle
The most populous races in Maumelle are White / Caucasian (13,832 | 72.1%), Black / African American (3,734 | 19.5%), and Two or more Races (860 | 4.5%).
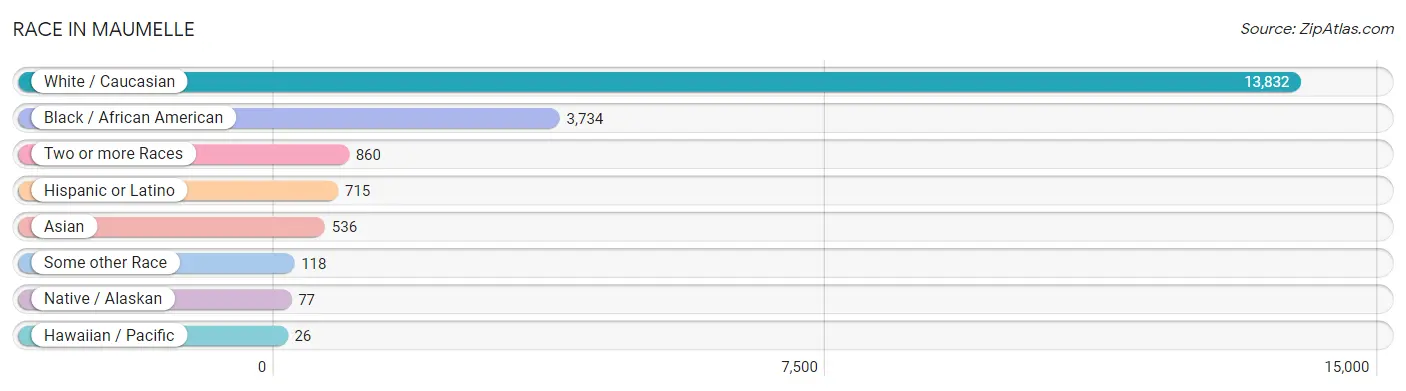
| Race | # Population | % Population |
| Asian | 536 | 2.8% |
| Black / African American | 3,734 | 19.5% |
| Hawaiian / Pacific | 26 | 0.1% |
| Hispanic or Latino | 715 | 3.7% |
| Native / Alaskan | 77 | 0.4% |
| White / Caucasian | 13,832 | 72.1% |
| Two or more Races | 860 | 4.5% |
| Some other Race | 118 | 0.6% |
| Total | 19,183 | 100.0% |
Ancestry in Maumelle
The most populous ancestries reported in Maumelle are German (2,448 | 12.8%), English (2,017 | 10.5%), Irish (1,567 | 8.2%), American (1,193 | 6.2%), and French (526 | 2.7%), together accounting for 40.4% of all Maumelle residents.
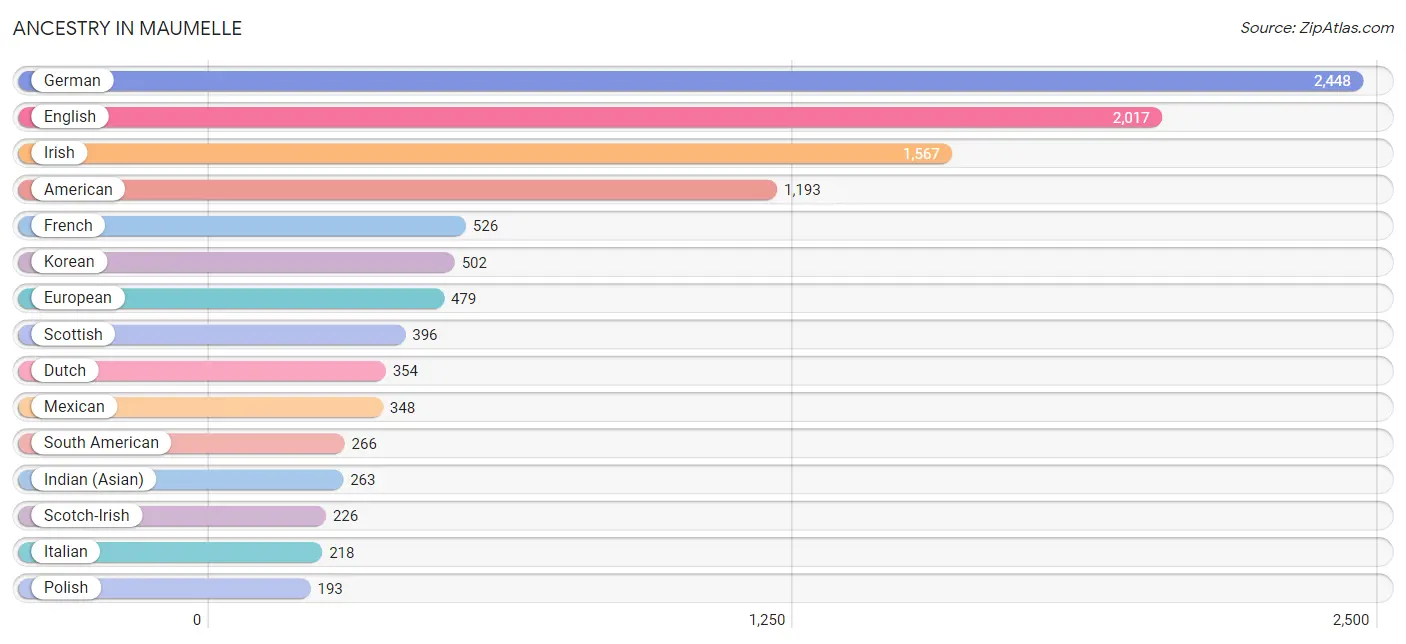
| Ancestry | # Population | % Population |
| African | 23 | 0.1% |
| American | 1,193 | 6.2% |
| Arab | 83 | 0.4% |
| Argentinean | 101 | 0.5% |
| Austrian | 15 | 0.1% |
| Bhutanese | 52 | 0.3% |
| British | 124 | 0.6% |
| Burmese | 51 | 0.3% |
| Central American | 67 | 0.4% |
| Cherokee | 115 | 0.6% |
| Choctaw | 24 | 0.1% |
| Comanche | 36 | 0.2% |
| Czech | 20 | 0.1% |
| Danish | 9 | 0.1% |
| Dutch | 354 | 1.8% |
| Ecuadorian | 69 | 0.4% |
| English | 2,017 | 10.5% |
| Ethiopian | 11 | 0.1% |
| European | 479 | 2.5% |
| Finnish | 17 | 0.1% |
| French | 526 | 2.7% |
| French Canadian | 62 | 0.3% |
| German | 2,448 | 12.8% |
| Guatemalan | 48 | 0.3% |
| Guyanese | 19 | 0.1% |
| Honduran | 19 | 0.1% |
| Hungarian | 30 | 0.2% |
| Indian (Asian) | 263 | 1.4% |
| Irish | 1,567 | 8.2% |
| Italian | 218 | 1.1% |
| Kiowa | 17 | 0.1% |
| Korean | 502 | 2.6% |
| Lithuanian | 116 | 0.6% |
| Mexican | 348 | 1.8% |
| Native Hawaiian | 26 | 0.1% |
| Nigerian | 66 | 0.3% |
| Norwegian | 88 | 0.5% |
| Peruvian | 96 | 0.5% |
| Polish | 193 | 1.0% |
| Puerto Rican | 8 | 0.0% |
| Romanian | 13 | 0.1% |
| Russian | 87 | 0.4% |
| Scotch-Irish | 226 | 1.2% |
| Scottish | 396 | 2.1% |
| Sioux | 8 | 0.0% |
| Slovak | 10 | 0.1% |
| South American | 266 | 1.4% |
| Spaniard | 26 | 0.1% |
| Sri Lankan | 147 | 0.8% |
| Subsaharan African | 141 | 0.7% |
| Swedish | 123 | 0.6% |
| Swiss | 136 | 0.7% |
| Syrian | 72 | 0.4% |
| Thai | 21 | 0.1% |
| U.S. Virgin Islander | 30 | 0.2% |
| Welsh | 83 | 0.4% | View All 56 Rows |
Immigrants in Maumelle
The most numerous immigrant groups reported in Maumelle came from Asia (381 | 2.0%), South Eastern Asia (279 | 1.5%), Latin America (204 | 1.1%), Philippines (188 | 1.0%), and South America (132 | 0.7%), together accounting for 6.2% of all Maumelle residents.
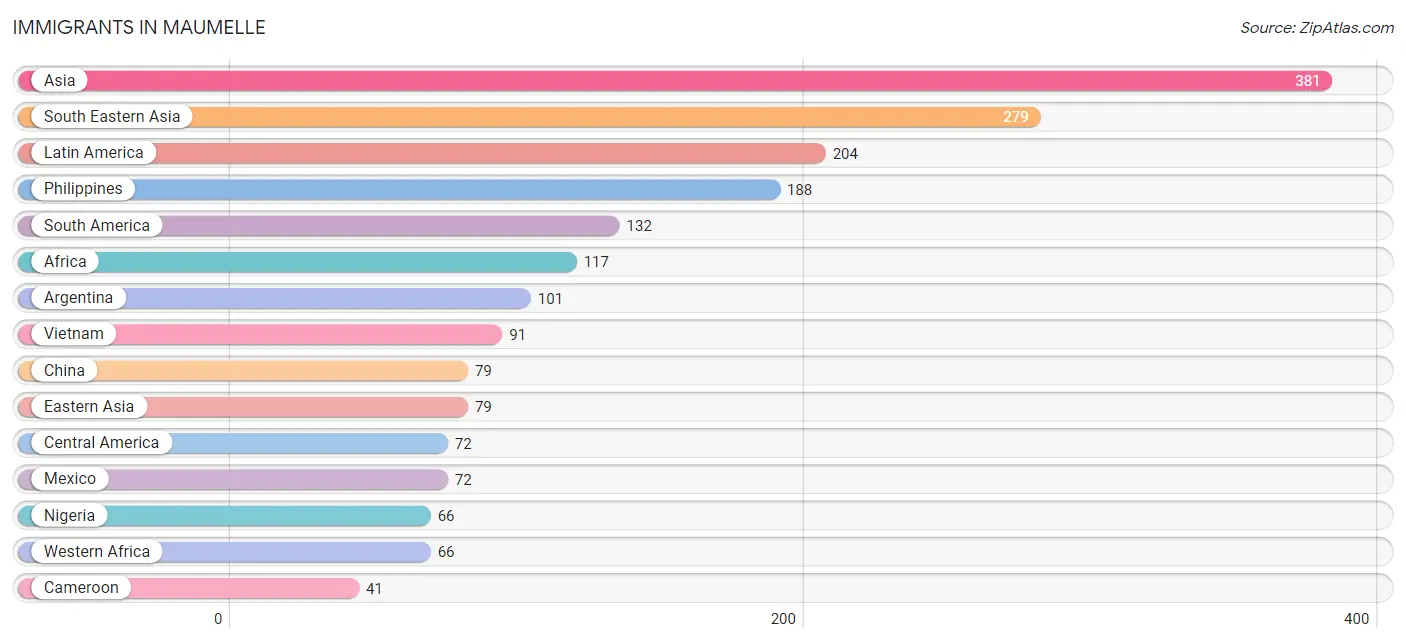
| Immigration Origin | # Population | % Population |
| Africa | 117 | 0.6% |
| Argentina | 101 | 0.5% |
| Asia | 381 | 2.0% |
| Australia | 12 | 0.1% |
| Cameroon | 41 | 0.2% |
| Canada | 25 | 0.1% |
| Central America | 72 | 0.4% |
| China | 79 | 0.4% |
| Eastern Asia | 79 | 0.4% |
| Eastern Europe | 30 | 0.2% |
| Ecuador | 15 | 0.1% |
| Europe | 38 | 0.2% |
| Hong Kong | 16 | 0.1% |
| Hungary | 13 | 0.1% |
| India | 21 | 0.1% |
| Latin America | 204 | 1.1% |
| Mexico | 72 | 0.4% |
| Middle Africa | 41 | 0.2% |
| Nepal | 2 | 0.0% |
| Nigeria | 66 | 0.3% |
| Northern Europe | 8 | 0.0% |
| Oceania | 12 | 0.1% |
| Peru | 16 | 0.1% |
| Philippines | 188 | 1.0% |
| Russia | 17 | 0.1% |
| South Africa | 10 | 0.1% |
| South America | 132 | 0.7% |
| South Central Asia | 23 | 0.1% |
| South Eastern Asia | 279 | 1.5% |
| Vietnam | 91 | 0.5% |
| Western Africa | 66 | 0.3% | View All 31 Rows |
Sex and Age in Maumelle
Sex and Age in Maumelle
The most populous age groups in Maumelle are 35 to 39 Years (752 | 8.4%) for men and 15 to 19 Years (1,000 | 9.8%) for women.
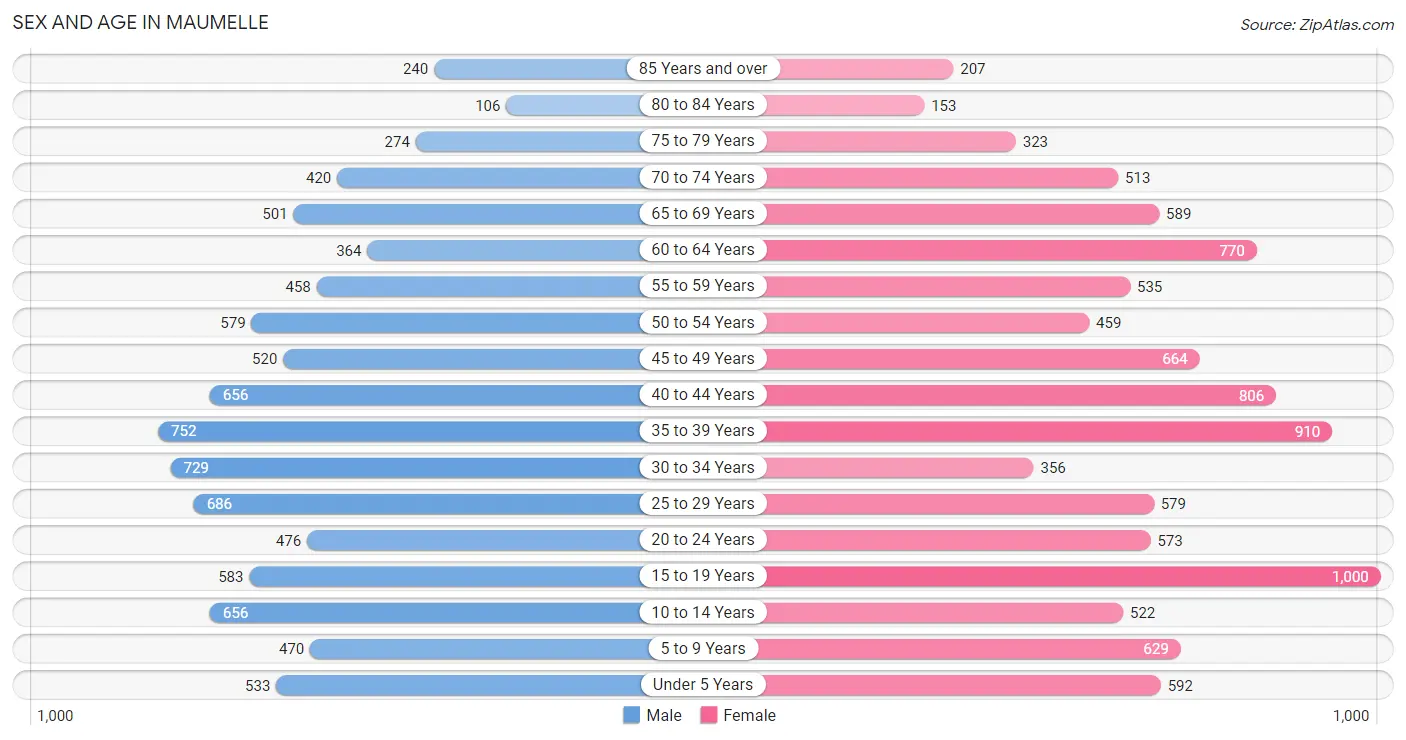
| Age Bracket | Male | Female |
| Under 5 Years | 533 (5.9%) | 592 (5.8%) |
| 5 to 9 Years | 470 (5.2%) | 629 (6.2%) |
| 10 to 14 Years | 656 (7.3%) | 522 (5.1%) |
| 15 to 19 Years | 583 (6.5%) | 1,000 (9.8%) |
| 20 to 24 Years | 476 (5.3%) | 573 (5.6%) |
| 25 to 29 Years | 686 (7.6%) | 579 (5.7%) |
| 30 to 34 Years | 729 (8.1%) | 356 (3.5%) |
| 35 to 39 Years | 752 (8.4%) | 910 (8.9%) |
| 40 to 44 Years | 656 (7.3%) | 806 (7.9%) |
| 45 to 49 Years | 520 (5.8%) | 664 (6.5%) |
| 50 to 54 Years | 579 (6.4%) | 459 (4.5%) |
| 55 to 59 Years | 458 (5.1%) | 535 (5.3%) |
| 60 to 64 Years | 364 (4.0%) | 770 (7.6%) |
| 65 to 69 Years | 501 (5.6%) | 589 (5.8%) |
| 70 to 74 Years | 420 (4.7%) | 513 (5.0%) |
| 75 to 79 Years | 274 (3.0%) | 323 (3.2%) |
| 80 to 84 Years | 106 (1.2%) | 153 (1.5%) |
| 85 Years and over | 240 (2.7%) | 207 (2.0%) |
| Total | 9,003 (100.0%) | 10,180 (100.0%) |
Families and Households in Maumelle
Median Family Size in Maumelle
The median family size in Maumelle is 3.04 persons per family, with single male/father families (331 | 6.1%) accounting for the largest median family size of 3.08 persons per family. On the other hand, single female/mother families (608 | 11.2%) represent the smallest median family size with 3.00 persons per family.
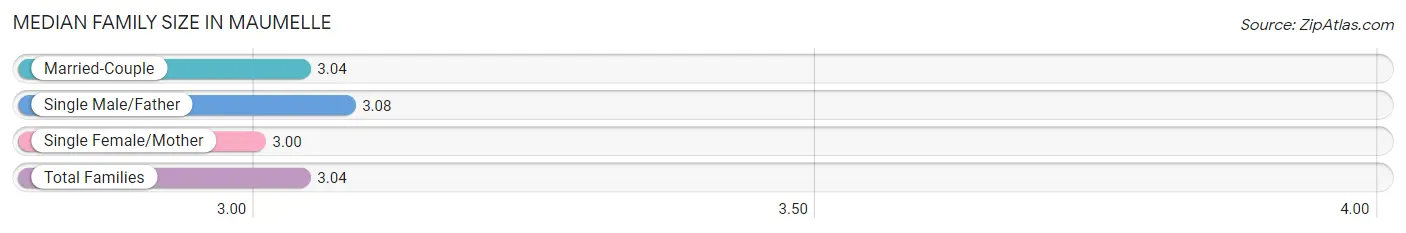
| Family Type | # Families | Family Size |
| Married-Couple | 4,499 (82.7%) | 3.04 |
| Single Male/Father | 331 (6.1%) | 3.08 |
| Single Female/Mother | 608 (11.2%) | 3.00 |
| Total Families | 5,438 (100.0%) | 3.04 |
Median Household Size in Maumelle
The median household size in Maumelle is 2.52 persons per household, with single male/father households (331 | 4.3%) accounting for the largest median household size of 3.23 persons per household. non-family households (2,167 | 28.5%) represent the smallest median household size with 1.13 persons per household.
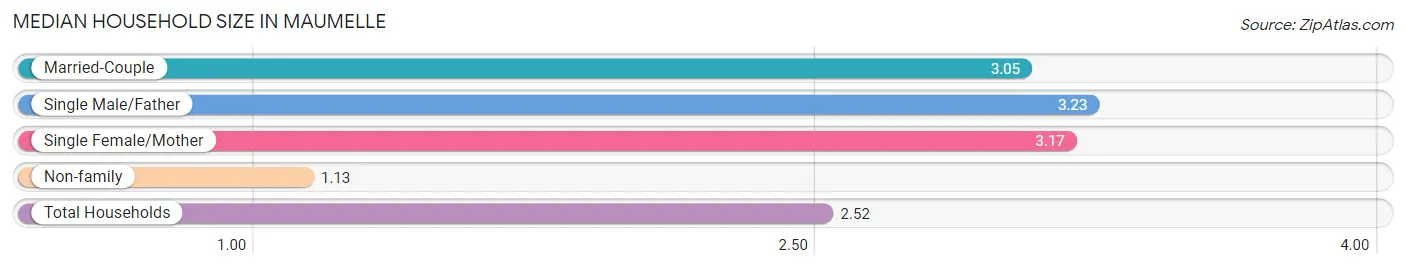
| Household Type | # Households | Household Size |
| Married-Couple | 4,499 (59.2%) | 3.05 |
| Single Male/Father | 331 (4.3%) | 3.23 |
| Single Female/Mother | 608 (8.0%) | 3.17 |
| Non-family | 2,167 (28.5%) | 1.13 |
| Total Households | 7,605 (100.0%) | 2.52 |
Household Size by Marriage Status in Maumelle
Out of a total of 7,605 households in Maumelle, 5,438 (71.5%) are family households, while 2,167 (28.5%) are nonfamily households. The most numerous type of family households are 2-person households, comprising 2,414, and the most common type of nonfamily households are 1-person households, comprising 1,824.
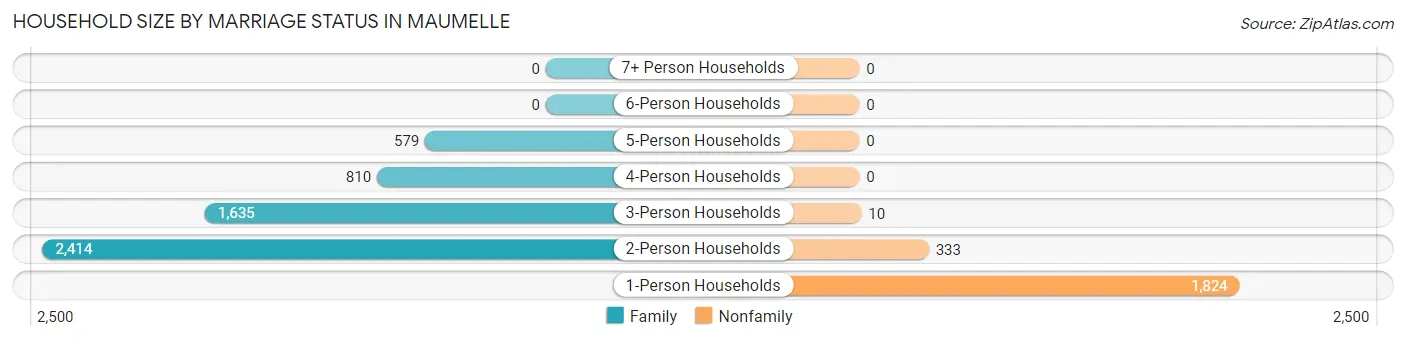
| Household Size | Family Households | Nonfamily Households |
| 1-Person Households | - | 1,824 (24.0%) |
| 2-Person Households | 2,414 (31.7%) | 333 (4.4%) |
| 3-Person Households | 1,635 (21.5%) | 10 (0.1%) |
| 4-Person Households | 810 (10.6%) | 0 (0.0%) |
| 5-Person Households | 579 (7.6%) | 0 (0.0%) |
| 6-Person Households | 0 (0.0%) | 0 (0.0%) |
| 7+ Person Households | 0 (0.0%) | 0 (0.0%) |
| Total | 5,438 (71.5%) | 2,167 (28.5%) |
Female Fertility in Maumelle
Fertility by Age in Maumelle
Average fertility rate in Maumelle is 62.0 births per 1,000 women. Women in the age bracket of 20 to 34 years have the highest fertility rate with 209.0 births per 1,000 women. Women in the age bracket of 20 to 34 years acount for 99.1% of all women with births.
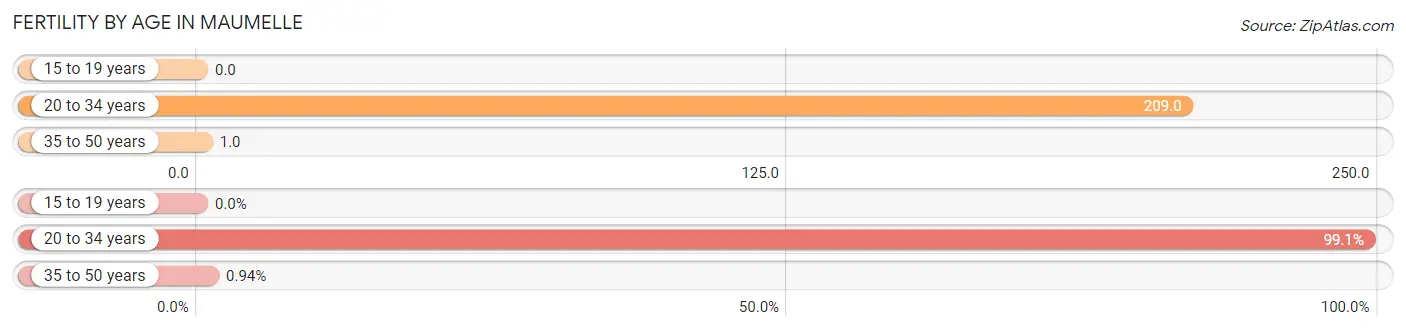
| Age Bracket | Women with Births | Births / 1,000 Women |
| 15 to 19 years | 0 (0.0%) | 0.0 |
| 20 to 34 years | 315 (99.1%) | 209.0 |
| 35 to 50 years | 3 (0.9%) | 1.0 |
| Total | 318 (100.0%) | 62.0 |
Fertility by Age by Marriage Status in Maumelle
66.0% of women with births (318) in Maumelle are married. The highest percentage of unmarried women with births falls into 20 to 34 years age bracket with 34.3% of them unmarried at the time of birth, while the lowest percentage of unmarried women with births belong to 35 to 50 years age bracket with 0.0% of them unmarried.
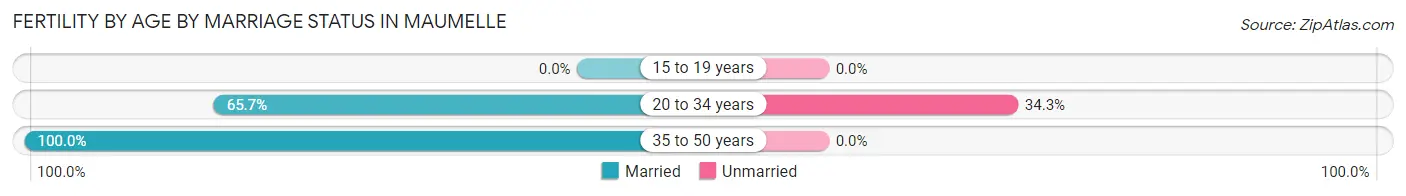
| Age Bracket | Married | Unmarried |
| 15 to 19 years | 0 (0.0%) | 0 (0.0%) |
| 20 to 34 years | 207 (65.7%) | 108 (34.3%) |
| 35 to 50 years | 3 (100.0%) | 0 (0.0%) |
| Total | 210 (66.0%) | 108 (34.0%) |
Fertility by Education in Maumelle
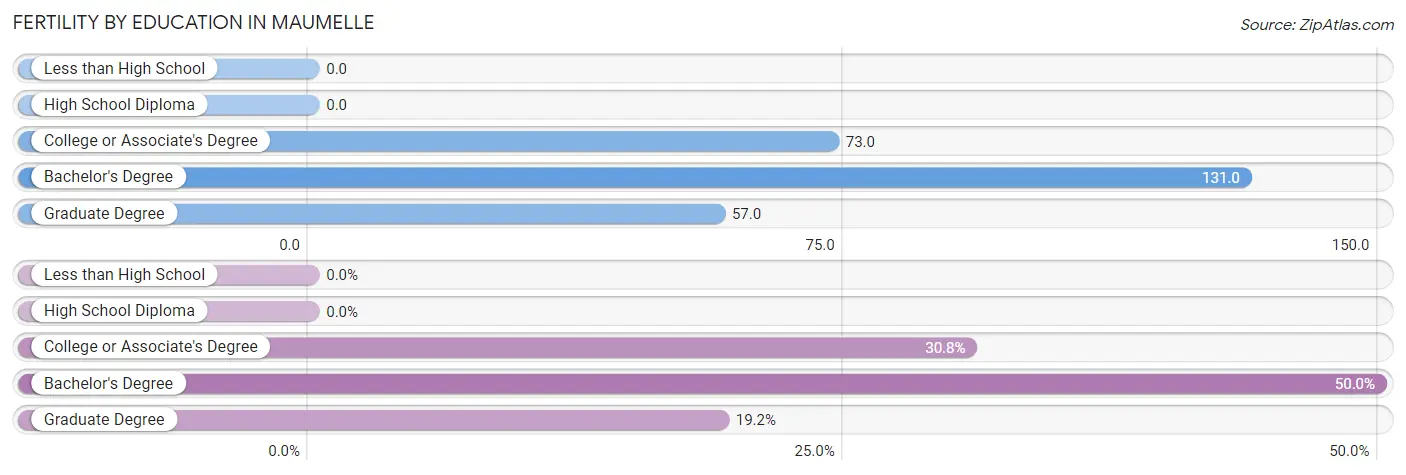
| Educational Attainment | Women with Births | Births / 1,000 Women |
| Less than High School | 0 (0.0%) | 0.0 |
| High School Diploma | 0 (0.0%) | 0.0 |
| College or Associate's Degree | 98 (30.8%) | 73.0 |
| Bachelor's Degree | 159 (50.0%) | 131.0 |
| Graduate Degree | 61 (19.2%) | 57.0 |
| Total | 318 (100.0%) | 62.0 |
Fertility by Education by Marriage Status in Maumelle
34.0% of women with births in Maumelle are unmarried. Women with the educational attainment of college or associate's degree are most likely to be married with 100.0% of them married at childbirth, while women with the educational attainment of bachelor's degree are least likely to be married with 67.9% of them unmarried at childbirth.
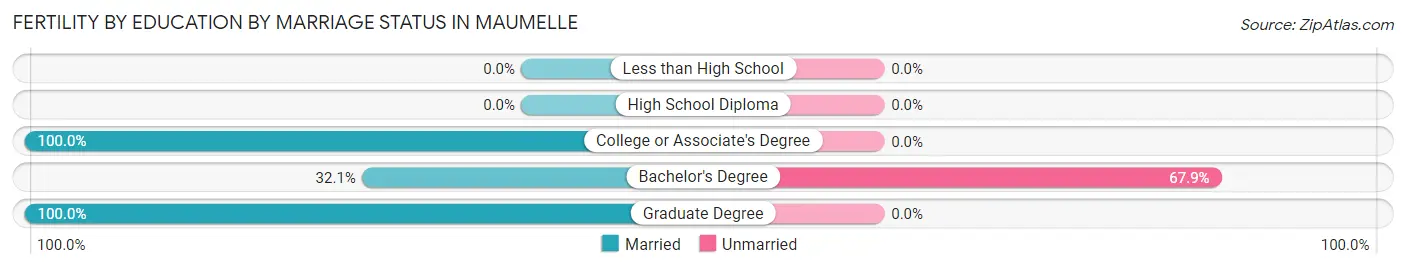
| Educational Attainment | Married | Unmarried |
| Less than High School | 0 (0.0%) | 0 (0.0%) |
| High School Diploma | 0 (0.0%) | 0 (0.0%) |
| College or Associate's Degree | 98 (100.0%) | 0 (0.0%) |
| Bachelor's Degree | 51 (32.1%) | 108 (67.9%) |
| Graduate Degree | 61 (100.0%) | 0 (0.0%) |
| Total | 210 (66.0%) | 108 (34.0%) |
Employment Characteristics in Maumelle
Employment by Class of Employer in Maumelle
Among the 9,259 employed individuals in Maumelle, private company employees (5,449 | 58.9%), not-for-profit organizations (1,036 | 11.2%), and state government employees (901 | 9.7%) make up the most common classes of employment.
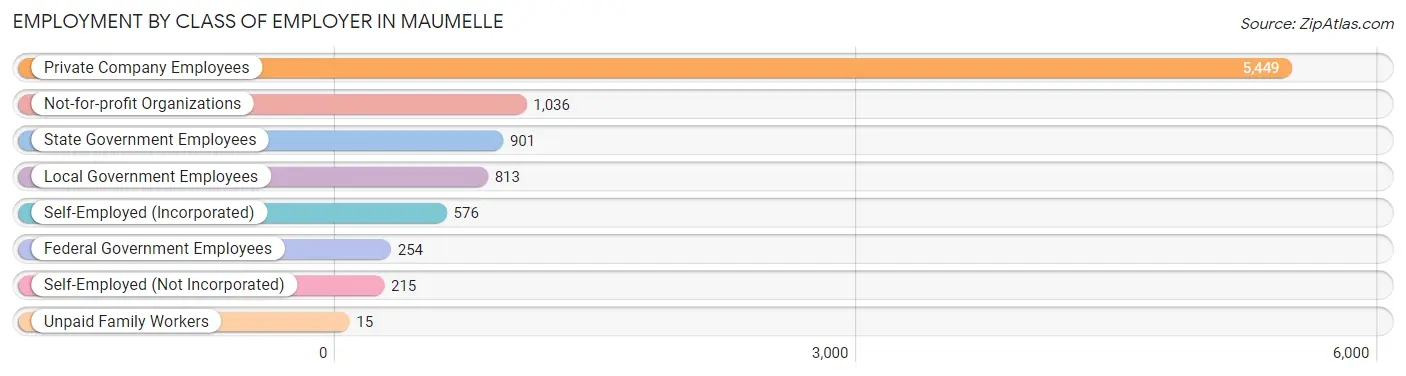
| Employer Class | # Employees | % Employees |
| Private Company Employees | 5,449 | 58.9% |
| Self-Employed (Incorporated) | 576 | 6.2% |
| Self-Employed (Not Incorporated) | 215 | 2.3% |
| Not-for-profit Organizations | 1,036 | 11.2% |
| Local Government Employees | 813 | 8.8% |
| State Government Employees | 901 | 9.7% |
| Federal Government Employees | 254 | 2.7% |
| Unpaid Family Workers | 15 | 0.2% |
| Total | 9,259 | 100.0% |
Employment Status by Age in Maumelle
According to the labor force statistics for Maumelle, out of the total population over 16 years of age (15,190), 64.3% or 9,767 individuals are in the labor force, with 4.7% or 459 of them unemployed. The age group with the highest labor force participation rate is 20 to 24 years, with 95.5% or 1,002 individuals in the labor force. Within the labor force, the 16 to 19 years age range has the highest percentage of unemployed individuals, with 18.2% or 53 of them being unemployed.
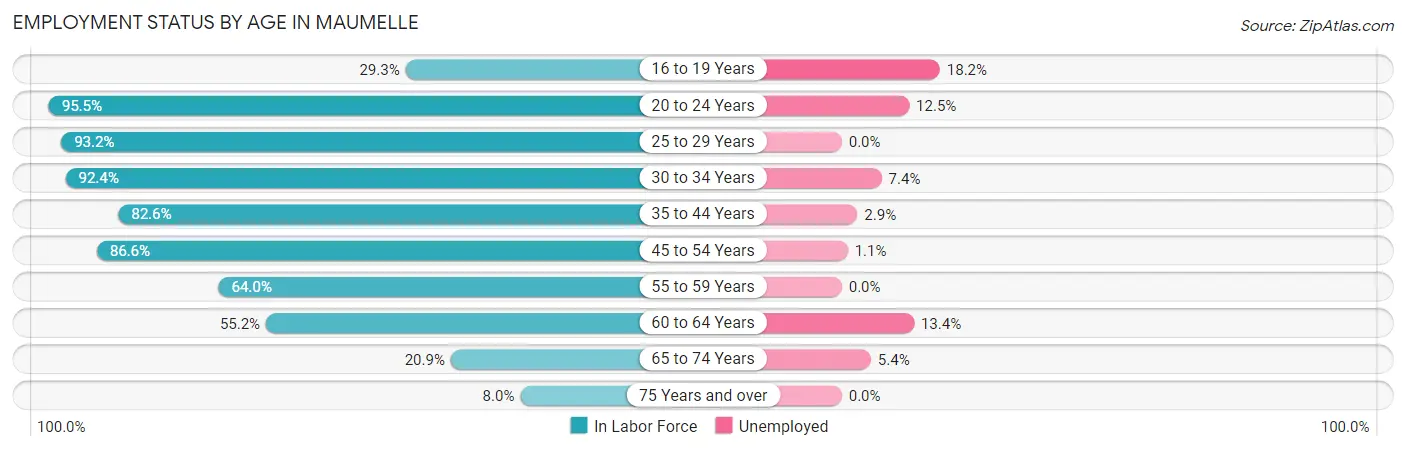
| Age Bracket | In Labor Force | Unemployed |
| 16 to 19 Years | 291 (29.3%) | 53 (18.2%) |
| 20 to 24 Years | 1,002 (95.5%) | 125 (12.5%) |
| 25 to 29 Years | 1,179 (93.2%) | 0 (0.0%) |
| 30 to 34 Years | 1,003 (92.4%) | 74 (7.4%) |
| 35 to 44 Years | 2,580 (82.6%) | 75 (2.9%) |
| 45 to 54 Years | 1,924 (86.6%) | 21 (1.1%) |
| 55 to 59 Years | 636 (64.0%) | 0 (0.0%) |
| 60 to 64 Years | 626 (55.2%) | 84 (13.4%) |
| 65 to 74 Years | 423 (20.9%) | 23 (5.4%) |
| 75 Years and over | 104 (8.0%) | 0 (0.0%) |
| Total | 9,767 (64.3%) | 459 (4.7%) |
Employment Status by Educational Attainment in Maumelle
According to labor force statistics for Maumelle, 80.9% of individuals (7,947) out of the total population between 25 and 64 years of age (9,823) are in the labor force, with 3.2% or 254 of them being unemployed. The group with the highest labor force participation rate are those with the educational attainment of bachelor's degree or higher, with 86.9% or 4,214 individuals in the labor force. Within the labor force, individuals with bachelor's degree or higher education have the highest percentage of unemployment, with 5.5% or 232 of them being unemployed.
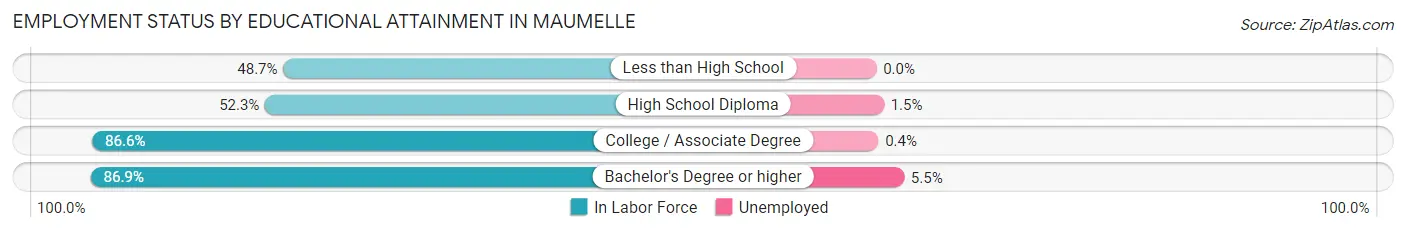
| Educational Attainment | In Labor Force | Unemployed |
| Less than High School | 235 (48.7%) | 0 (0.0%) |
| High School Diploma | 594 (52.3%) | 17 (1.5%) |
| College / Associate Degree | 2,905 (86.6%) | 13 (0.4%) |
| Bachelor's Degree or higher | 4,214 (86.9%) | 267 (5.5%) |
| Total | 7,947 (80.9%) | 314 (3.2%) |
Employment Occupations by Sex in Maumelle
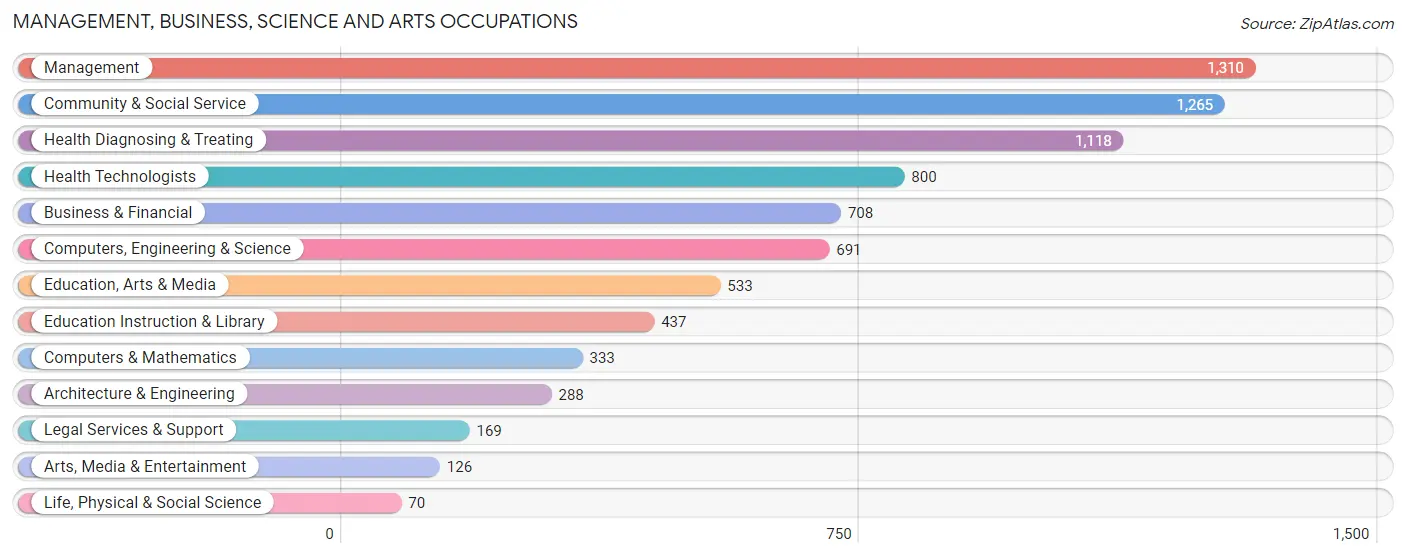
Management, Business, Science and Arts Occupations
The most common Management, Business, Science and Arts occupations in Maumelle are Management (1,310 | 14.1%), Community & Social Service (1,265 | 13.6%), Health Diagnosing & Treating (1,118 | 12.0%), Health Technologists (800 | 8.6%), and Business & Financial (708 | 7.6%).
Management, Business, Science and Arts Occupations by Sex
Within the Management, Business, Science and Arts occupations in Maumelle, the most male-oriented occupations are Architecture & Engineering (93.4%), Computers & Mathematics (91.0%), and Computers, Engineering & Science (88.3%), while the most female-oriented occupations are Education Instruction & Library (84.7%), Legal Services & Support (82.3%), and Health Technologists (72.0%).
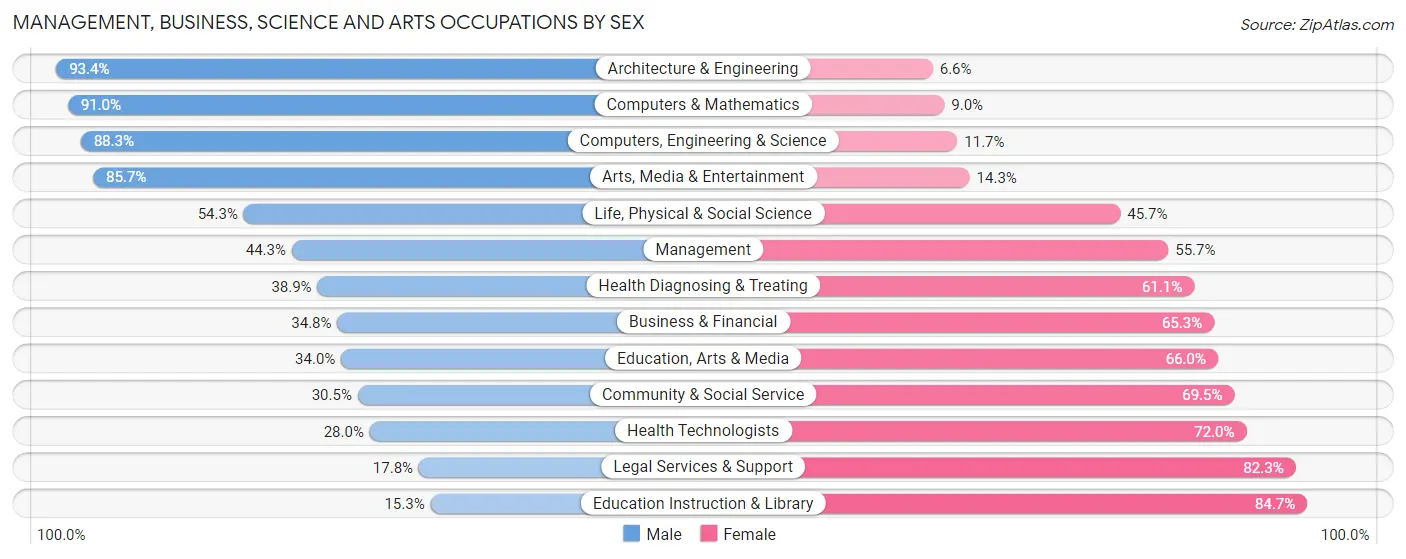
| Occupation | Male | Female |
| Management | 580 (44.3%) | 730 (55.7%) |
| Business & Financial | 246 (34.7%) | 462 (65.2%) |
| Computers, Engineering & Science | 610 (88.3%) | 81 (11.7%) |
| Computers & Mathematics | 303 (91.0%) | 30 (9.0%) |
| Architecture & Engineering | 269 (93.4%) | 19 (6.6%) |
| Life, Physical & Social Science | 38 (54.3%) | 32 (45.7%) |
| Community & Social Service | 386 (30.5%) | 879 (69.5%) |
| Education, Arts & Media | 181 (34.0%) | 352 (66.0%) |
| Legal Services & Support | 30 (17.7%) | 139 (82.3%) |
| Education Instruction & Library | 67 (15.3%) | 370 (84.7%) |
| Arts, Media & Entertainment | 108 (85.7%) | 18 (14.3%) |
| Health Diagnosing & Treating | 435 (38.9%) | 683 (61.1%) |
| Health Technologists | 224 (28.0%) | 576 (72.0%) |
| Total (Category) | 2,257 (44.3%) | 2,835 (55.7%) |
| Total (Overall) | 4,796 (51.7%) | 4,487 (48.3%) |
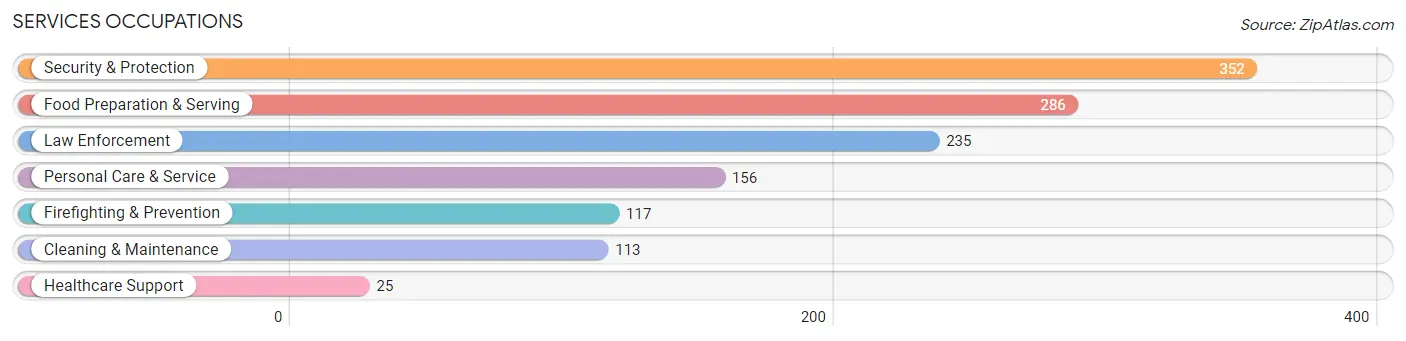
Services Occupations
The most common Services occupations in Maumelle are Security & Protection (352 | 3.8%), Food Preparation & Serving (286 | 3.1%), Law Enforcement (235 | 2.5%), Personal Care & Service (156 | 1.7%), and Firefighting & Prevention (117 | 1.3%).
Services Occupations by Sex
Within the Services occupations in Maumelle, the most male-oriented occupations are Cleaning & Maintenance (100.0%), Law Enforcement (97.0%), and Security & Protection (90.3%), while the most female-oriented occupations are Healthcare Support (100.0%), Personal Care & Service (80.8%), and Food Preparation & Serving (46.9%).
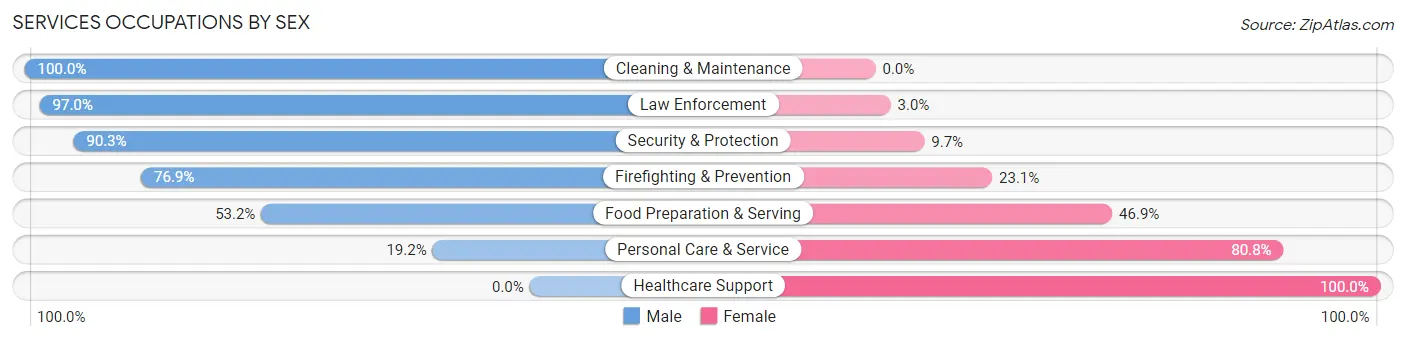
| Occupation | Male | Female |
| Healthcare Support | 0 (0.0%) | 25 (100.0%) |
| Security & Protection | 318 (90.3%) | 34 (9.7%) |
| Firefighting & Prevention | 90 (76.9%) | 27 (23.1%) |
| Law Enforcement | 228 (97.0%) | 7 (3.0%) |
| Food Preparation & Serving | 152 (53.1%) | 134 (46.9%) |
| Cleaning & Maintenance | 113 (100.0%) | 0 (0.0%) |
| Personal Care & Service | 30 (19.2%) | 126 (80.8%) |
| Total (Category) | 613 (65.8%) | 319 (34.2%) |
| Total (Overall) | 4,796 (51.7%) | 4,487 (48.3%) |
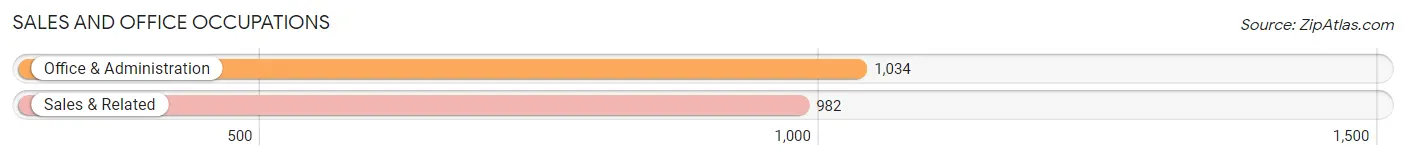
Sales and Office Occupations
The most common Sales and Office occupations in Maumelle are Office & Administration (1,034 | 11.1%), and Sales & Related (982 | 10.6%).
Sales and Office Occupations by Sex
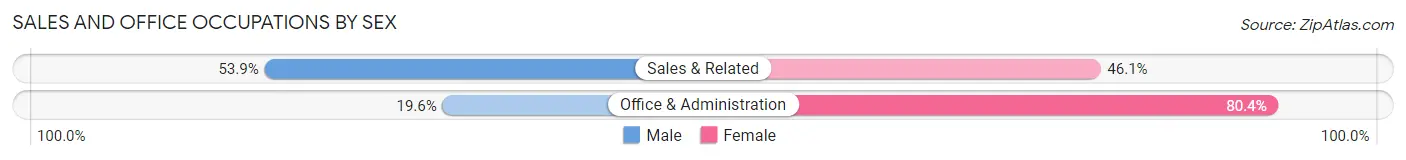
| Occupation | Male | Female |
| Sales & Related | 529 (53.9%) | 453 (46.1%) |
| Office & Administration | 203 (19.6%) | 831 (80.4%) |
| Total (Category) | 732 (36.3%) | 1,284 (63.7%) |
| Total (Overall) | 4,796 (51.7%) | 4,487 (48.3%) |
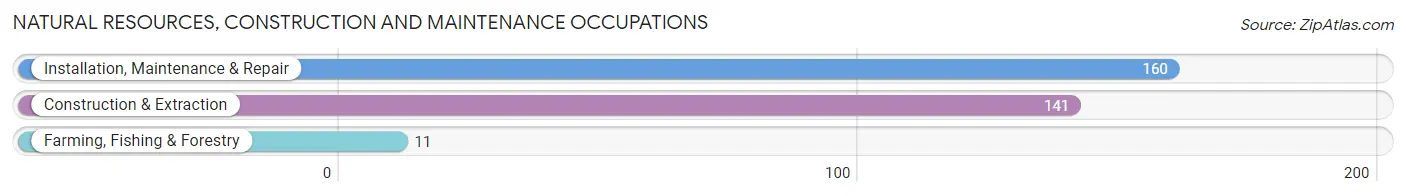
Natural Resources, Construction and Maintenance Occupations
The most common Natural Resources, Construction and Maintenance occupations in Maumelle are Installation, Maintenance & Repair (160 | 1.7%), Construction & Extraction (141 | 1.5%), and Farming, Fishing & Forestry (11 | 0.1%).
Natural Resources, Construction and Maintenance Occupations by Sex
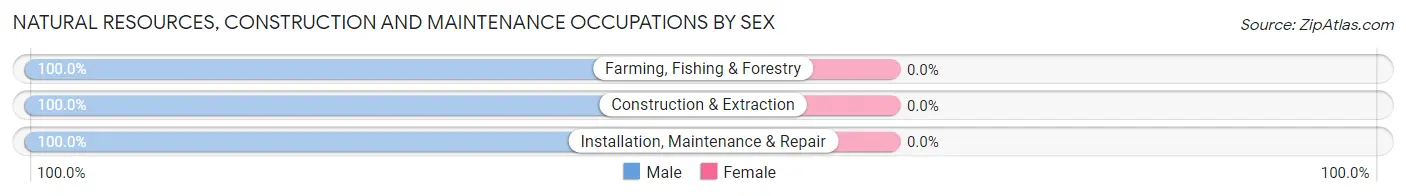
| Occupation | Male | Female |
| Farming, Fishing & Forestry | 11 (100.0%) | 0 (0.0%) |
| Construction & Extraction | 141 (100.0%) | 0 (0.0%) |
| Installation, Maintenance & Repair | 160 (100.0%) | 0 (0.0%) |
| Total (Category) | 312 (100.0%) | 0 (0.0%) |
| Total (Overall) | 4,796 (51.7%) | 4,487 (48.3%) |
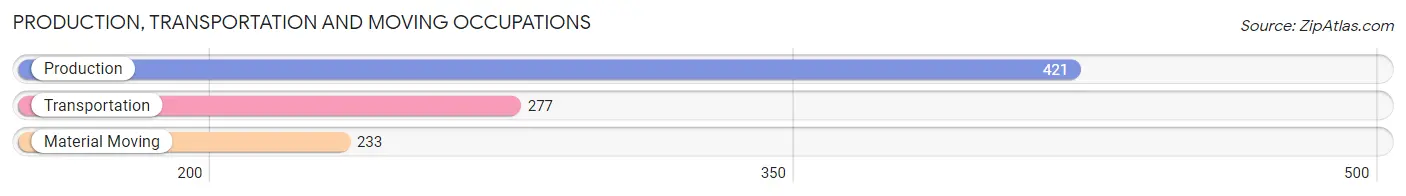
Production, Transportation and Moving Occupations
The most common Production, Transportation and Moving occupations in Maumelle are Production (421 | 4.5%), Transportation (277 | 3.0%), and Material Moving (233 | 2.5%).
Production, Transportation and Moving Occupations by Sex
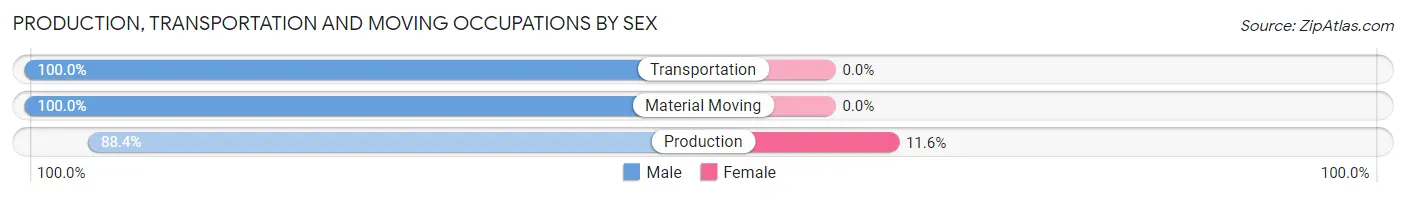
| Occupation | Male | Female |
| Production | 372 (88.4%) | 49 (11.6%) |
| Transportation | 277 (100.0%) | 0 (0.0%) |
| Material Moving | 233 (100.0%) | 0 (0.0%) |
| Total (Category) | 882 (94.7%) | 49 (5.3%) |
| Total (Overall) | 4,796 (51.7%) | 4,487 (48.3%) |
Employment Industries by Sex in Maumelle
Employment Industries in Maumelle
The major employment industries in Maumelle include Health Care & Social Assistance (1,788 | 19.3%), Educational Services (1,036 | 11.2%), Retail Trade (857 | 9.2%), Finance & Insurance (732 | 7.9%), and Public Administration (715 | 7.7%).

Employment Industries by Sex in Maumelle
The Maumelle industries that see more men than women are Agriculture, Fishing & Hunting (100.0%), Information (97.5%), and Construction (83.1%), whereas the industries that tend to have a higher number of women are Real Estate, Rental & Leasing (89.8%), Educational Services (78.4%), and Health Care & Social Assistance (70.4%).
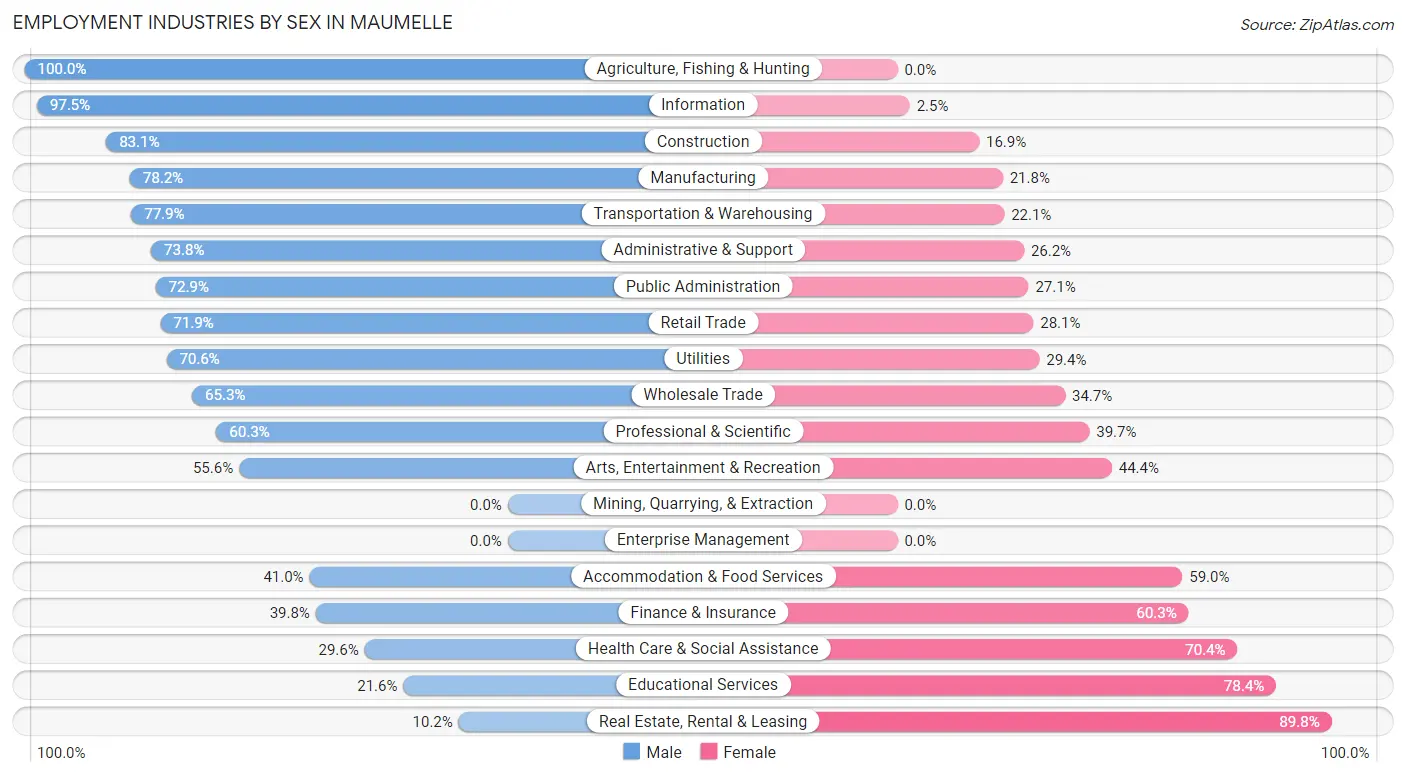
| Industry | Male | Female |
| Agriculture, Fishing & Hunting | 11 (100.0%) | 0 (0.0%) |
| Mining, Quarrying, & Extraction | 0 (0.0%) | 0 (0.0%) |
| Construction | 359 (83.1%) | 73 (16.9%) |
| Manufacturing | 531 (78.2%) | 148 (21.8%) |
| Wholesale Trade | 177 (65.3%) | 94 (34.7%) |
| Retail Trade | 616 (71.9%) | 241 (28.1%) |
| Transportation & Warehousing | 342 (77.9%) | 97 (22.1%) |
| Utilities | 89 (70.6%) | 37 (29.4%) |
| Information | 192 (97.5%) | 5 (2.5%) |
| Finance & Insurance | 291 (39.8%) | 441 (60.3%) |
| Real Estate, Rental & Leasing | 13 (10.2%) | 115 (89.8%) |
| Professional & Scientific | 293 (60.3%) | 193 (39.7%) |
| Enterprise Management | 0 (0.0%) | 0 (0.0%) |
| Administrative & Support | 248 (73.8%) | 88 (26.2%) |
| Educational Services | 224 (21.6%) | 812 (78.4%) |
| Health Care & Social Assistance | 530 (29.6%) | 1,258 (70.4%) |
| Arts, Entertainment & Recreation | 79 (55.6%) | 63 (44.4%) |
| Accommodation & Food Services | 174 (41.0%) | 250 (59.0%) |
| Public Administration | 521 (72.9%) | 194 (27.1%) |
| Total | 4,796 (51.7%) | 4,487 (48.3%) |
Education in Maumelle
School Enrollment in Maumelle
The most common levels of schooling among the 4,597 students in Maumelle are high school (1,462 | 31.8%), middle school (1,018 | 22.1%), and elementary school (823 | 17.9%).
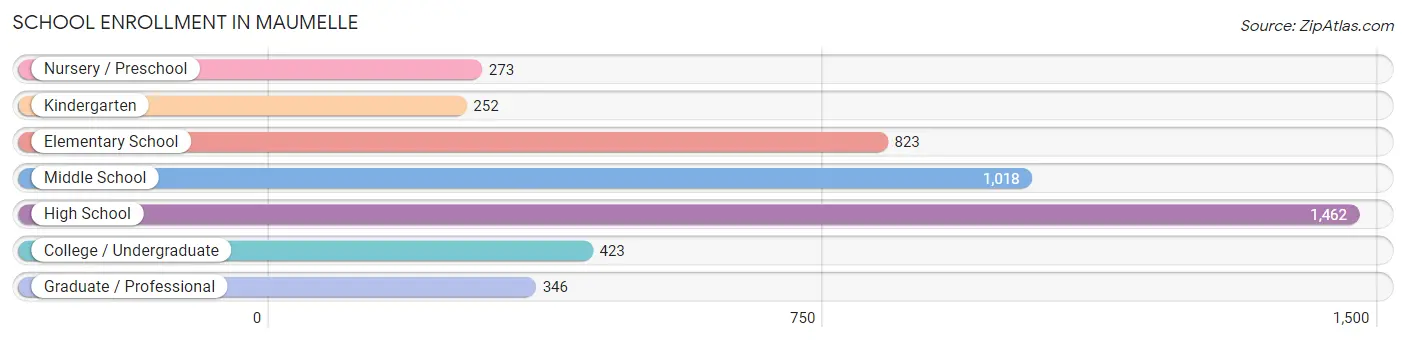
| School Level | # Students | % Students |
| Nursery / Preschool | 273 | 5.9% |
| Kindergarten | 252 | 5.5% |
| Elementary School | 823 | 17.9% |
| Middle School | 1,018 | 22.1% |
| High School | 1,462 | 31.8% |
| College / Undergraduate | 423 | 9.2% |
| Graduate / Professional | 346 | 7.5% |
| Total | 4,597 | 100.0% |
School Enrollment by Age by Funding Source in Maumelle
Out of a total of 4,597 students who are enrolled in schools in Maumelle, 1,347 (29.3%) attend a private institution, while the remaining 3,250 (70.7%) are enrolled in public schools. The age group of 3 to 4 year olds has the highest likelihood of being enrolled in private schools, with 150 (78.1% in the age bracket) enrolled. Conversely, the age group of 18 to 19 year olds has the lowest likelihood of being enrolled in a private school, with 178 (91.7% in the age bracket) attending a public institution.
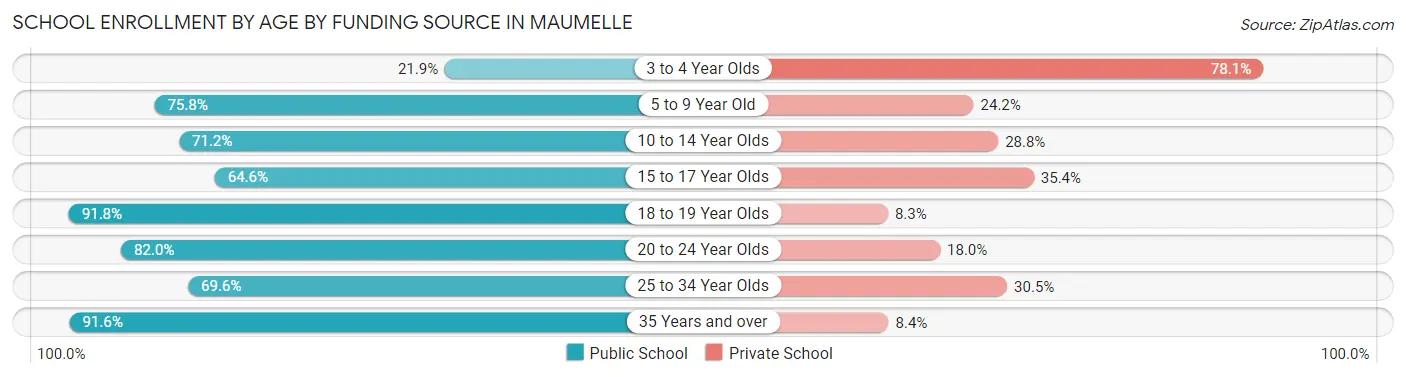
| Age Bracket | Public School | Private School |
| 3 to 4 Year Olds | 42 (21.9%) | 150 (78.1%) |
| 5 to 9 Year Old | 833 (75.8%) | 266 (24.2%) |
| 10 to 14 Year Olds | 839 (71.2%) | 339 (28.8%) |
| 15 to 17 Year Olds | 822 (64.6%) | 451 (35.4%) |
| 18 to 19 Year Olds | 178 (91.7%) | 16 (8.3%) |
| 20 to 24 Year Olds | 137 (82.0%) | 30 (18.0%) |
| 25 to 34 Year Olds | 169 (69.6%) | 74 (30.4%) |
| 35 Years and over | 230 (91.6%) | 21 (8.4%) |
| Total | 3,250 (70.7%) | 1,347 (29.3%) |
Educational Attainment by Field of Study in Maumelle
Business (1,449 | 22.4%), science & technology (1,019 | 15.8%), education (806 | 12.5%), bio, nature & agricultural (572 | 8.8%), and arts & humanities (484 | 7.5%) are the most common fields of study among 6,463 individuals in Maumelle who have obtained a bachelor's degree or higher.
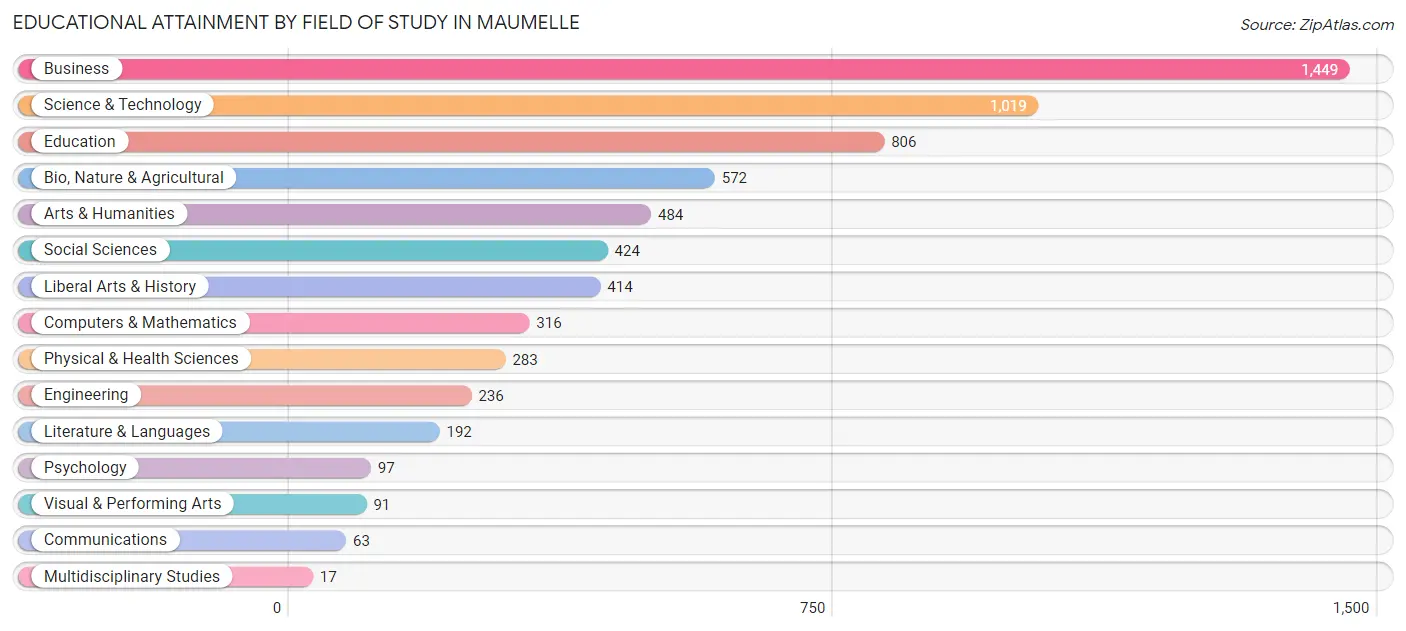
| Field of Study | # Graduates | % Graduates |
| Computers & Mathematics | 316 | 4.9% |
| Bio, Nature & Agricultural | 572 | 8.8% |
| Physical & Health Sciences | 283 | 4.4% |
| Psychology | 97 | 1.5% |
| Social Sciences | 424 | 6.6% |
| Engineering | 236 | 3.6% |
| Multidisciplinary Studies | 17 | 0.3% |
| Science & Technology | 1,019 | 15.8% |
| Business | 1,449 | 22.4% |
| Education | 806 | 12.5% |
| Literature & Languages | 192 | 3.0% |
| Liberal Arts & History | 414 | 6.4% |
| Visual & Performing Arts | 91 | 1.4% |
| Communications | 63 | 1.0% |
| Arts & Humanities | 484 | 7.5% |
| Total | 6,463 | 100.0% |
Transportation & Commute in Maumelle
Vehicle Availability by Sex in Maumelle
The most prevalent vehicle ownership categories in Maumelle are males with 2 vehicles (2,684, accounting for 56.1%) and females with 2 vehicles (1,995, making up 60.0%).
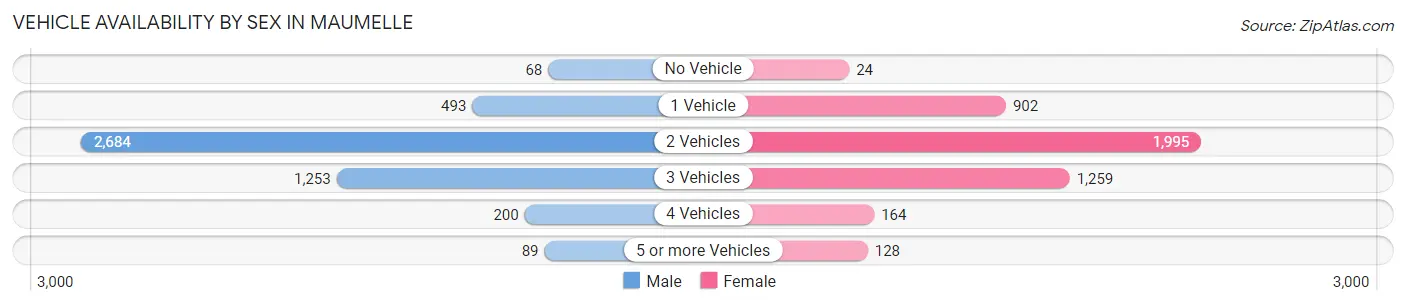
| Vehicles Available | Male | Female |
| No Vehicle | 68 (1.4%) | 24 (0.5%) |
| 1 Vehicle | 493 (10.3%) | 902 (20.2%) |
| 2 Vehicles | 2,684 (56.1%) | 1,995 (44.6%) |
| 3 Vehicles | 1,253 (26.2%) | 1,259 (28.1%) |
| 4 Vehicles | 200 (4.2%) | 164 (3.7%) |
| 5 or more Vehicles | 89 (1.9%) | 128 (2.9%) |
| Total | 4,787 (100.0%) | 4,472 (100.0%) |
Commute Time in Maumelle
The most frequently occuring commute durations in Maumelle are 20 to 24 minutes (2,114 commuters, 27.4%), 30 to 34 minutes (1,565 commuters, 20.3%), and 25 to 29 minutes (958 commuters, 12.4%).
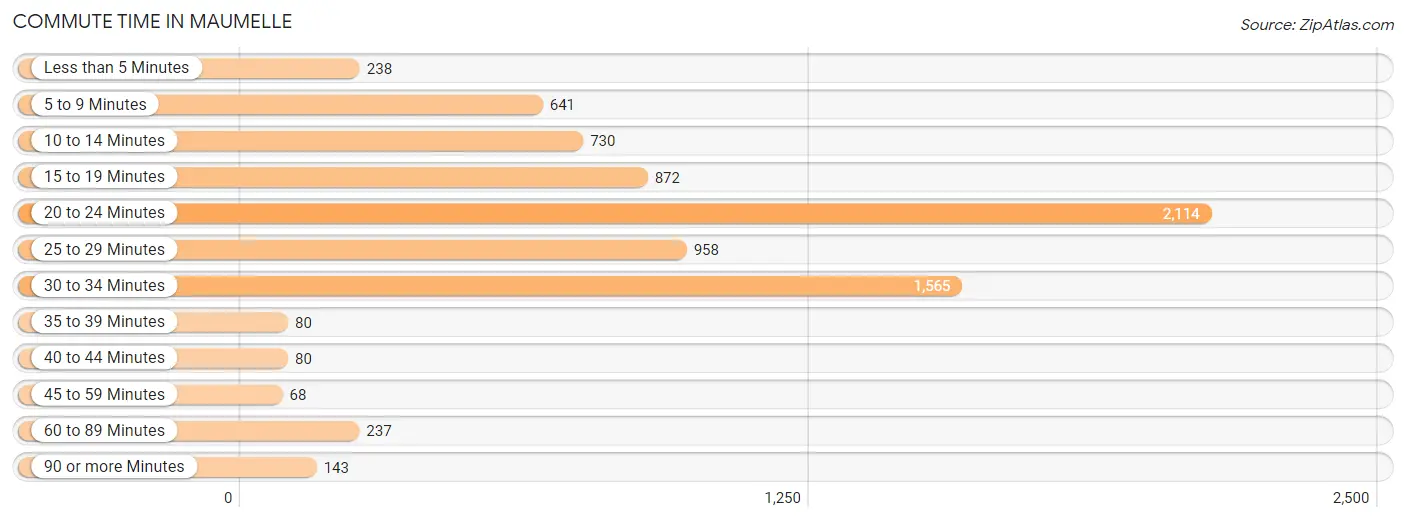
| Commute Time | # Commuters | % Commuters |
| Less than 5 Minutes | 238 | 3.1% |
| 5 to 9 Minutes | 641 | 8.3% |
| 10 to 14 Minutes | 730 | 9.5% |
| 15 to 19 Minutes | 872 | 11.3% |
| 20 to 24 Minutes | 2,114 | 27.4% |
| 25 to 29 Minutes | 958 | 12.4% |
| 30 to 34 Minutes | 1,565 | 20.3% |
| 35 to 39 Minutes | 80 | 1.0% |
| 40 to 44 Minutes | 80 | 1.0% |
| 45 to 59 Minutes | 68 | 0.9% |
| 60 to 89 Minutes | 237 | 3.1% |
| 90 or more Minutes | 143 | 1.8% |
Commute Time by Sex in Maumelle
The most common commute times in Maumelle are 20 to 24 minutes (1,174 commuters, 28.7%) for males and 20 to 24 minutes (940 commuters, 25.9%) for females.
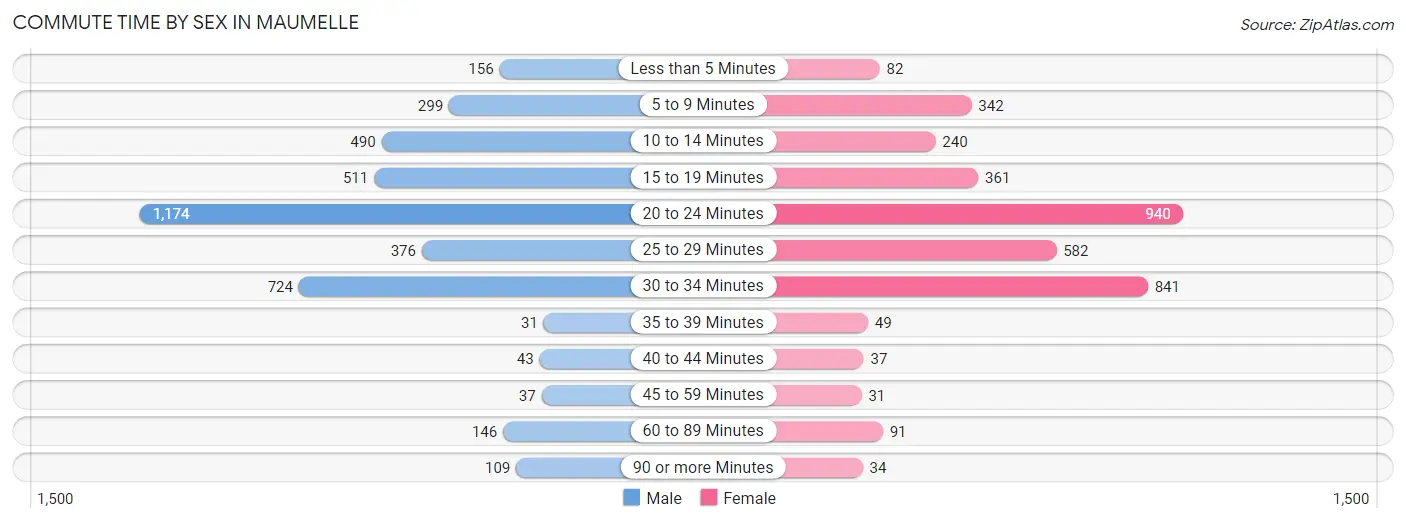
| Commute Time | Male | Female |
| Less than 5 Minutes | 156 (3.8%) | 82 (2.3%) |
| 5 to 9 Minutes | 299 (7.3%) | 342 (9.4%) |
| 10 to 14 Minutes | 490 (12.0%) | 240 (6.6%) |
| 15 to 19 Minutes | 511 (12.5%) | 361 (9.9%) |
| 20 to 24 Minutes | 1,174 (28.7%) | 940 (25.9%) |
| 25 to 29 Minutes | 376 (9.2%) | 582 (16.0%) |
| 30 to 34 Minutes | 724 (17.7%) | 841 (23.2%) |
| 35 to 39 Minutes | 31 (0.8%) | 49 (1.3%) |
| 40 to 44 Minutes | 43 (1.1%) | 37 (1.0%) |
| 45 to 59 Minutes | 37 (0.9%) | 31 (0.9%) |
| 60 to 89 Minutes | 146 (3.6%) | 91 (2.5%) |
| 90 or more Minutes | 109 (2.7%) | 34 (0.9%) |
Time of Departure to Work by Sex in Maumelle
The most frequent times of departure to work in Maumelle are 7:30 AM to 7:59 AM (767, 18.7%) for males and 7:30 AM to 7:59 AM (886, 24.4%) for females.
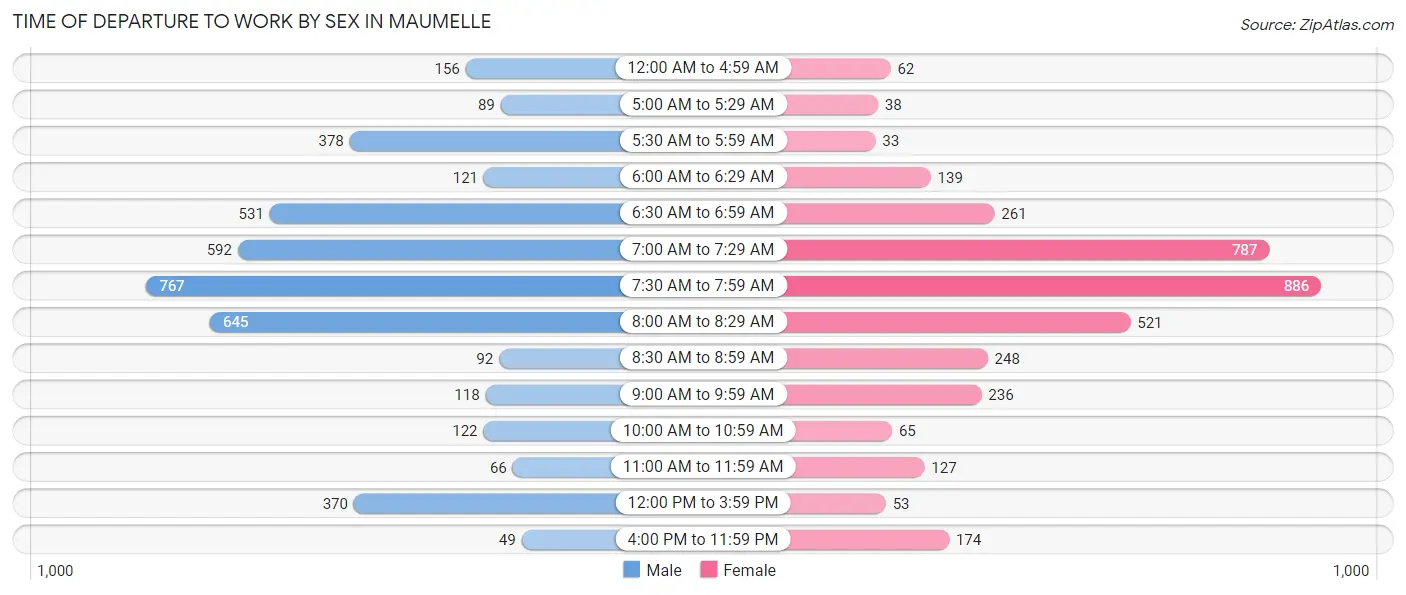
| Time of Departure | Male | Female |
| 12:00 AM to 4:59 AM | 156 (3.8%) | 62 (1.7%) |
| 5:00 AM to 5:29 AM | 89 (2.2%) | 38 (1.1%) |
| 5:30 AM to 5:59 AM | 378 (9.2%) | 33 (0.9%) |
| 6:00 AM to 6:29 AM | 121 (2.9%) | 139 (3.8%) |
| 6:30 AM to 6:59 AM | 531 (13.0%) | 261 (7.2%) |
| 7:00 AM to 7:29 AM | 592 (14.4%) | 787 (21.7%) |
| 7:30 AM to 7:59 AM | 767 (18.7%) | 886 (24.4%) |
| 8:00 AM to 8:29 AM | 645 (15.8%) | 521 (14.3%) |
| 8:30 AM to 8:59 AM | 92 (2.2%) | 248 (6.8%) |
| 9:00 AM to 9:59 AM | 118 (2.9%) | 236 (6.5%) |
| 10:00 AM to 10:59 AM | 122 (3.0%) | 65 (1.8%) |
| 11:00 AM to 11:59 AM | 66 (1.6%) | 127 (3.5%) |
| 12:00 PM to 3:59 PM | 370 (9.0%) | 53 (1.5%) |
| 4:00 PM to 11:59 PM | 49 (1.2%) | 174 (4.8%) |
| Total | 4,096 (100.0%) | 3,630 (100.0%) |
Housing Occupancy in Maumelle
Occupancy by Ownership in Maumelle
Of the total 7,605 dwellings in Maumelle, owner-occupied units account for 5,897 (77.5%), while renter-occupied units make up 1,708 (22.5%).
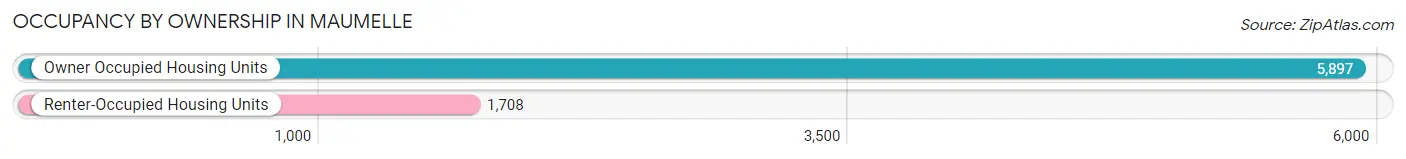
| Occupancy | # Housing Units | % Housing Units |
| Owner Occupied Housing Units | 5,897 | 77.5% |
| Renter-Occupied Housing Units | 1,708 | 22.5% |
| Total Occupied Housing Units | 7,605 | 100.0% |
Occupancy by Household Size in Maumelle
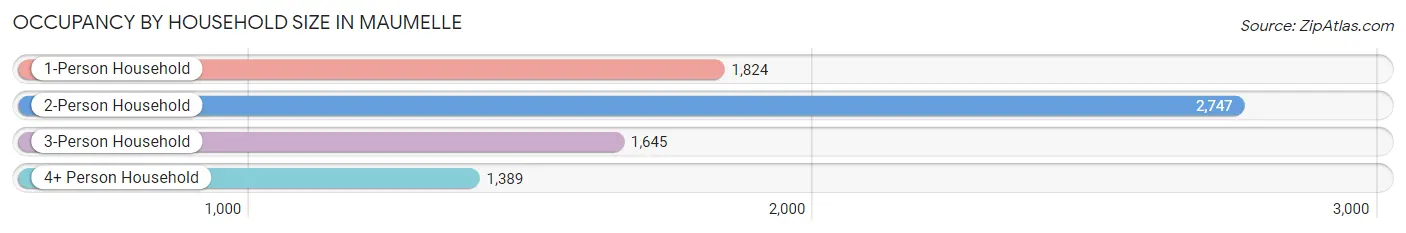
| Household Size | # Housing Units | % Housing Units |
| 1-Person Household | 1,824 | 24.0% |
| 2-Person Household | 2,747 | 36.1% |
| 3-Person Household | 1,645 | 21.6% |
| 4+ Person Household | 1,389 | 18.3% |
| Total Housing Units | 7,605 | 100.0% |
Occupancy by Ownership by Household Size in Maumelle
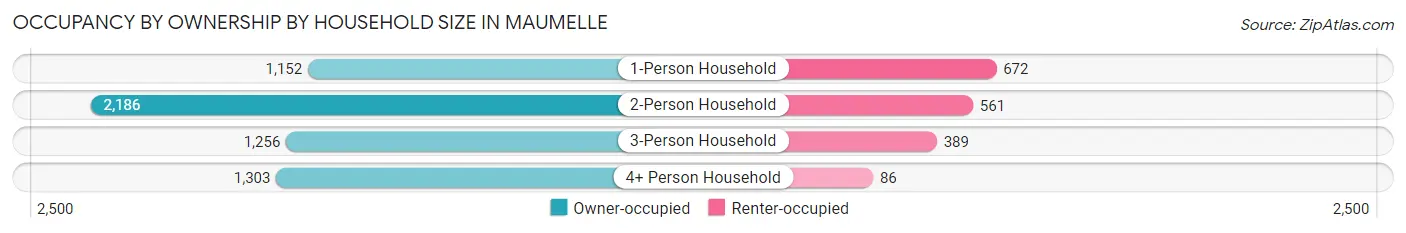
| Household Size | Owner-occupied | Renter-occupied |
| 1-Person Household | 1,152 (63.2%) | 672 (36.8%) |
| 2-Person Household | 2,186 (79.6%) | 561 (20.4%) |
| 3-Person Household | 1,256 (76.3%) | 389 (23.6%) |
| 4+ Person Household | 1,303 (93.8%) | 86 (6.2%) |
| Total Housing Units | 5,897 (77.5%) | 1,708 (22.5%) |
Occupancy by Educational Attainment in Maumelle
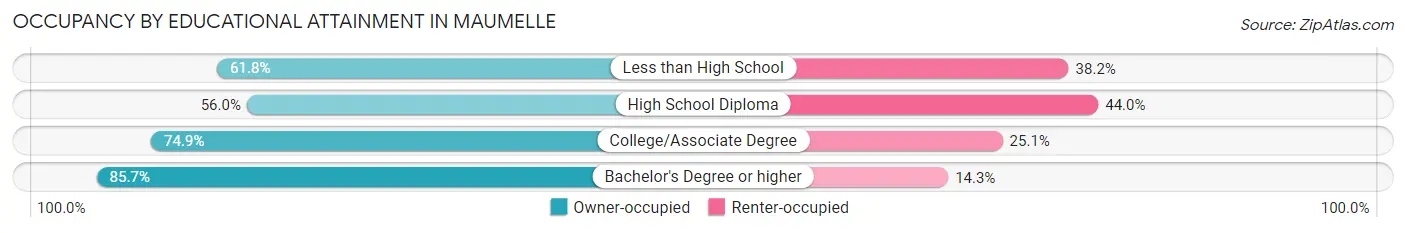
| Household Size | Owner-occupied | Renter-occupied |
| Less than High School | 128 (61.8%) | 79 (38.2%) |
| High School Diploma | 582 (56.0%) | 458 (44.0%) |
| College/Associate Degree | 1,825 (74.9%) | 611 (25.1%) |
| Bachelor's Degree or higher | 3,362 (85.7%) | 560 (14.3%) |
Occupancy by Age of Householder in Maumelle
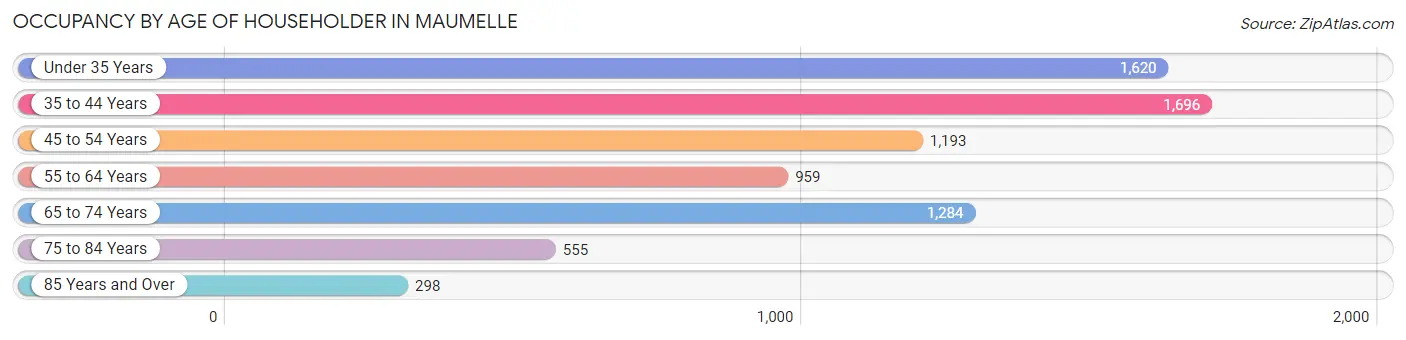
| Age Bracket | # Households | % Households |
| Under 35 Years | 1,620 | 21.3% |
| 35 to 44 Years | 1,696 | 22.3% |
| 45 to 54 Years | 1,193 | 15.7% |
| 55 to 64 Years | 959 | 12.6% |
| 65 to 74 Years | 1,284 | 16.9% |
| 75 to 84 Years | 555 | 7.3% |
| 85 Years and Over | 298 | 3.9% |
| Total | 7,605 | 100.0% |
Housing Finances in Maumelle
Median Income by Occupancy in Maumelle
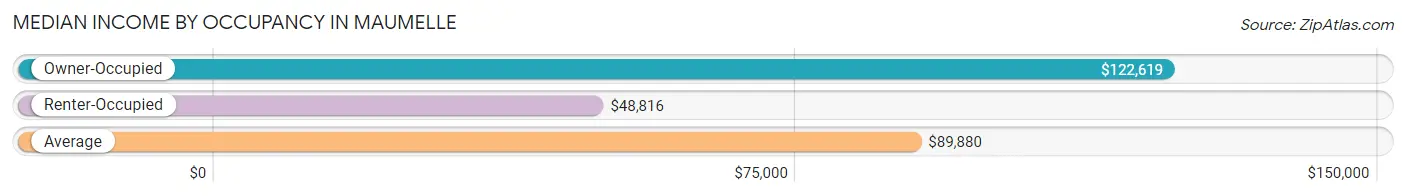
| Occupancy Type | # Households | Median Income |
| Owner-Occupied | 5,897 (77.5%) | $122,619 |
| Renter-Occupied | 1,708 (22.5%) | $48,816 |
| Average | 7,605 (100.0%) | $89,880 |
Occupancy by Householder Income Bracket in Maumelle
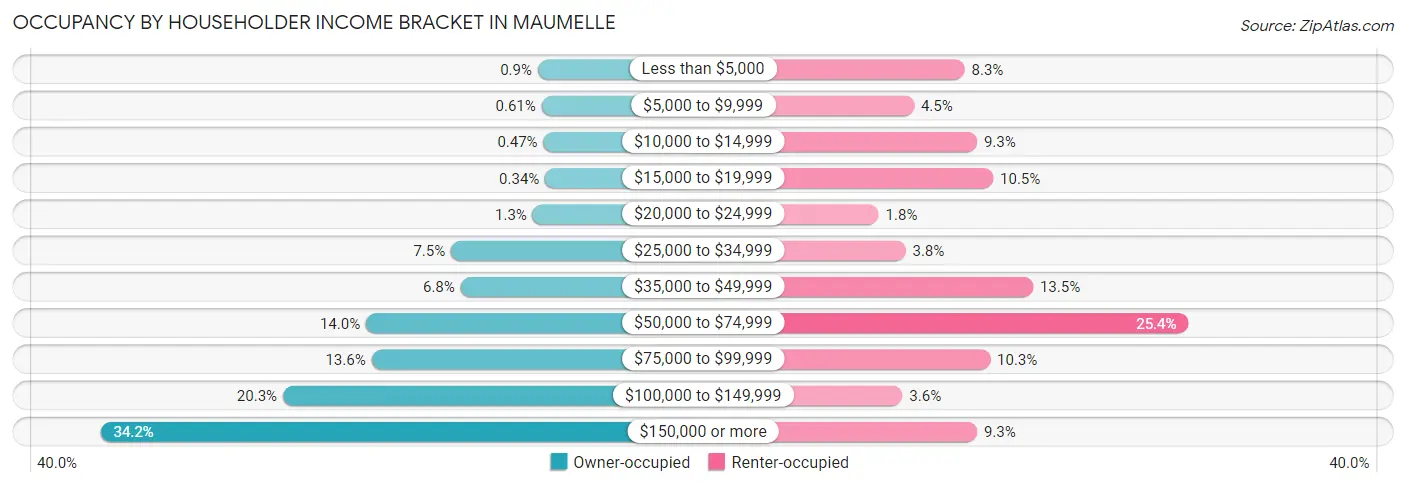
| Income Bracket | Owner-occupied | Renter-occupied |
| Less than $5,000 | 53 (0.9%) | 142 (8.3%) |
| $5,000 to $9,999 | 36 (0.6%) | 76 (4.4%) |
| $10,000 to $14,999 | 28 (0.5%) | 158 (9.2%) |
| $15,000 to $19,999 | 20 (0.3%) | 179 (10.5%) |
| $20,000 to $24,999 | 76 (1.3%) | 30 (1.8%) |
| $25,000 to $34,999 | 443 (7.5%) | 65 (3.8%) |
| $35,000 to $49,999 | 400 (6.8%) | 231 (13.5%) |
| $50,000 to $74,999 | 825 (14.0%) | 433 (25.4%) |
| $75,000 to $99,999 | 800 (13.6%) | 175 (10.2%) |
| $100,000 to $149,999 | 1,198 (20.3%) | 61 (3.6%) |
| $150,000 or more | 2,018 (34.2%) | 158 (9.2%) |
| Total | 5,897 (100.0%) | 1,708 (100.0%) |
Monthly Housing Cost Tiers in Maumelle
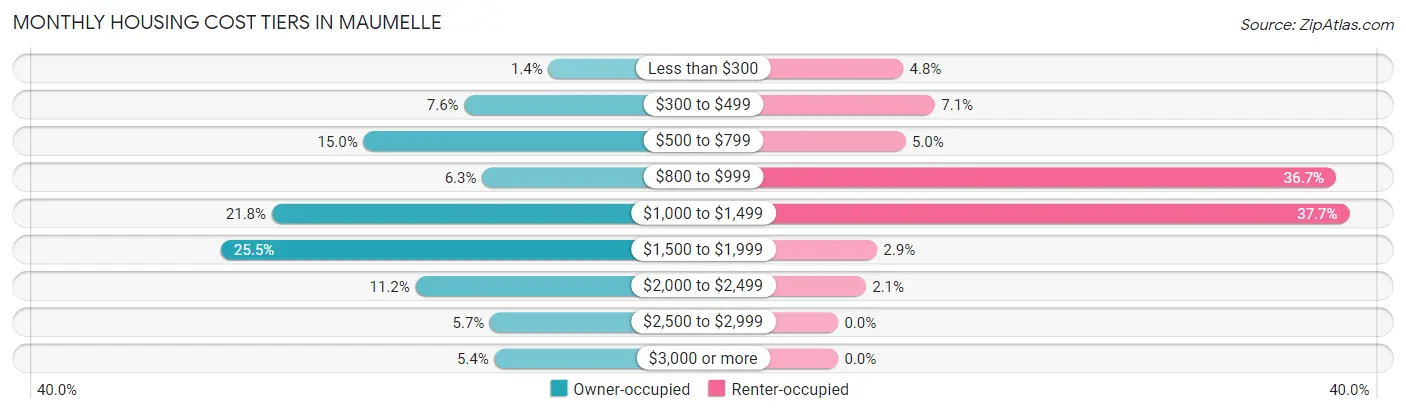
| Monthly Cost | Owner-occupied | Renter-occupied |
| Less than $300 | 83 (1.4%) | 82 (4.8%) |
| $300 to $499 | 449 (7.6%) | 122 (7.1%) |
| $500 to $799 | 887 (15.0%) | 85 (5.0%) |
| $800 to $999 | 371 (6.3%) | 627 (36.7%) |
| $1,000 to $1,499 | 1,285 (21.8%) | 644 (37.7%) |
| $1,500 to $1,999 | 1,506 (25.5%) | 49 (2.9%) |
| $2,000 to $2,499 | 661 (11.2%) | 35 (2.1%) |
| $2,500 to $2,999 | 337 (5.7%) | 0 (0.0%) |
| $3,000 or more | 318 (5.4%) | 0 (0.0%) |
| Total | 5,897 (100.0%) | 1,708 (100.0%) |
Physical Housing Characteristics in Maumelle
Housing Structures in Maumelle
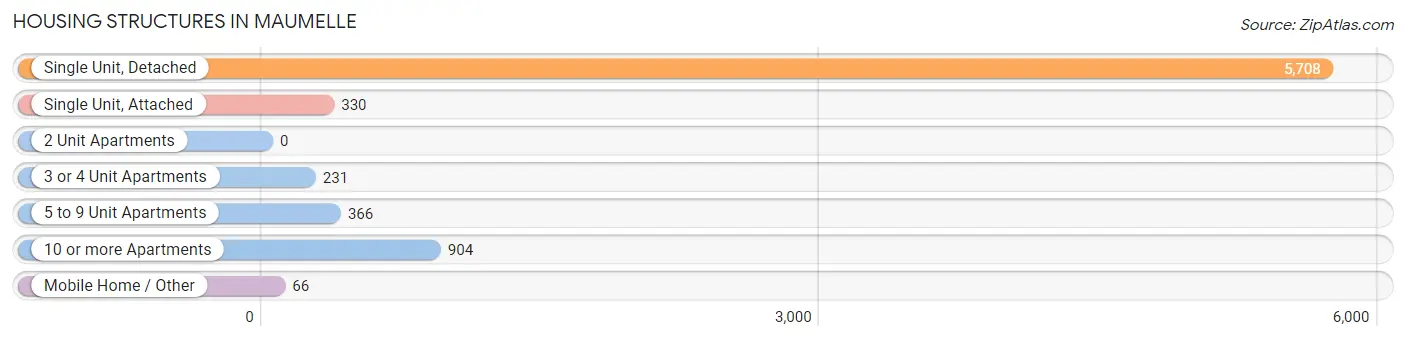
| Structure Type | # Housing Units | % Housing Units |
| Single Unit, Detached | 5,708 | 75.1% |
| Single Unit, Attached | 330 | 4.3% |
| 2 Unit Apartments | 0 | 0.0% |
| 3 or 4 Unit Apartments | 231 | 3.0% |
| 5 to 9 Unit Apartments | 366 | 4.8% |
| 10 or more Apartments | 904 | 11.9% |
| Mobile Home / Other | 66 | 0.9% |
| Total | 7,605 | 100.0% |
Housing Structures by Occupancy in Maumelle
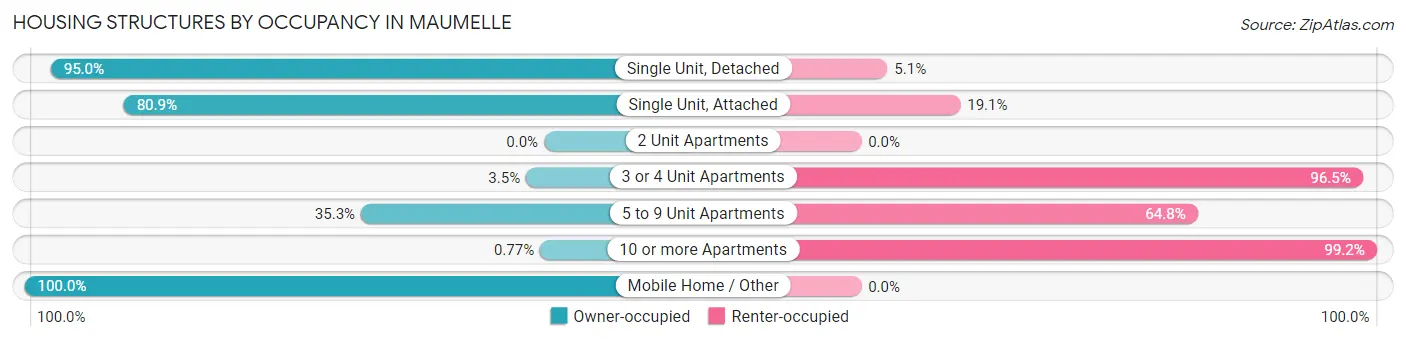
| Structure Type | Owner-occupied | Renter-occupied |
| Single Unit, Detached | 5,420 (95.0%) | 288 (5.1%) |
| Single Unit, Attached | 267 (80.9%) | 63 (19.1%) |
| 2 Unit Apartments | 0 (0.0%) | 0 (0.0%) |
| 3 or 4 Unit Apartments | 8 (3.5%) | 223 (96.5%) |
| 5 to 9 Unit Apartments | 129 (35.2%) | 237 (64.7%) |
| 10 or more Apartments | 7 (0.8%) | 897 (99.2%) |
| Mobile Home / Other | 66 (100.0%) | 0 (0.0%) |
| Total | 5,897 (77.5%) | 1,708 (22.5%) |
Housing Structures by Number of Rooms in Maumelle
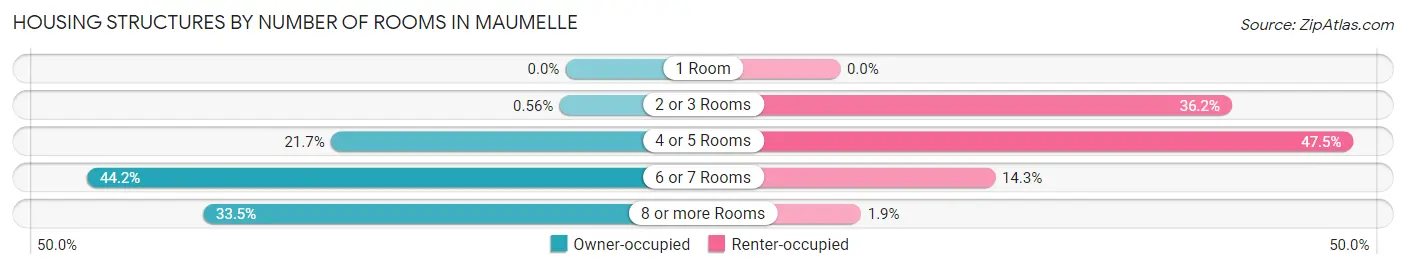
| Number of Rooms | Owner-occupied | Renter-occupied |
| 1 Room | 0 (0.0%) | 0 (0.0%) |
| 2 or 3 Rooms | 33 (0.6%) | 619 (36.2%) |
| 4 or 5 Rooms | 1,280 (21.7%) | 811 (47.5%) |
| 6 or 7 Rooms | 2,608 (44.2%) | 245 (14.3%) |
| 8 or more Rooms | 1,976 (33.5%) | 33 (1.9%) |
| Total | 5,897 (100.0%) | 1,708 (100.0%) |
Housing Structure by Heating Type in Maumelle
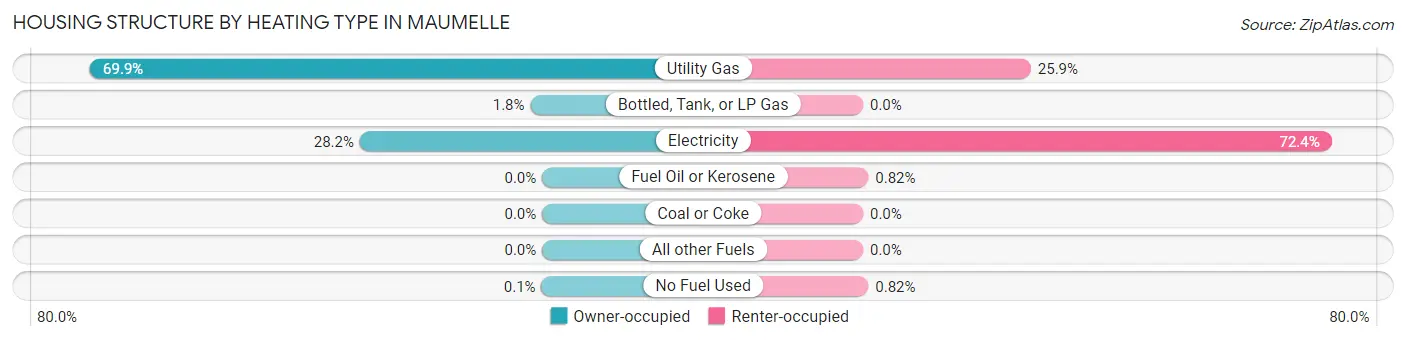
| Heating Type | Owner-occupied | Renter-occupied |
| Utility Gas | 4,122 (69.9%) | 443 (25.9%) |
| Bottled, Tank, or LP Gas | 107 (1.8%) | 0 (0.0%) |
| Electricity | 1,662 (28.2%) | 1,237 (72.4%) |
| Fuel Oil or Kerosene | 0 (0.0%) | 14 (0.8%) |
| Coal or Coke | 0 (0.0%) | 0 (0.0%) |
| All other Fuels | 0 (0.0%) | 0 (0.0%) |
| No Fuel Used | 6 (0.1%) | 14 (0.8%) |
| Total | 5,897 (100.0%) | 1,708 (100.0%) |
Household Vehicle Usage in Maumelle
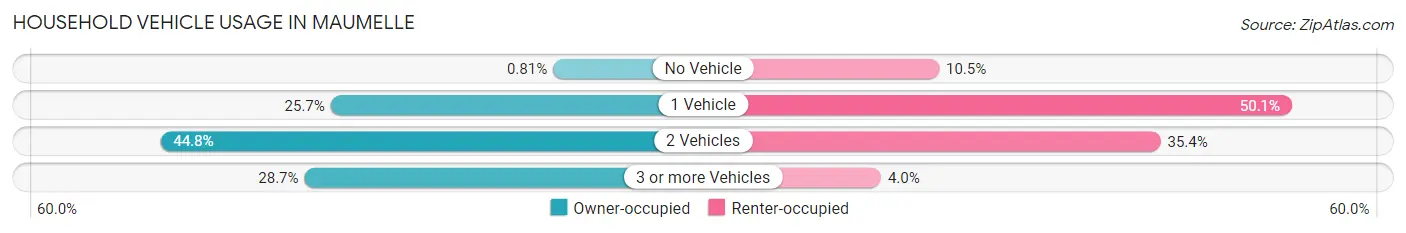
| Vehicles per Household | Owner-occupied | Renter-occupied |
| No Vehicle | 48 (0.8%) | 180 (10.5%) |
| 1 Vehicle | 1,517 (25.7%) | 855 (50.1%) |
| 2 Vehicles | 2,642 (44.8%) | 604 (35.4%) |
| 3 or more Vehicles | 1,690 (28.7%) | 69 (4.0%) |
| Total | 5,897 (100.0%) | 1,708 (100.0%) |
Real Estate & Mortgages in Maumelle
Real Estate and Mortgage Overview in Maumelle
| Characteristic | Without Mortgage | With Mortgage |
| Housing Units | 1,717 | 4,180 |
| Median Property Value | $245,200 | $268,900 |
| Median Household Income | $74,306 | $1,630 |
| Monthly Housing Costs | $579 | $318 |
| Real Estate Taxes | $2,232 | $442 |
Property Value by Mortgage Status in Maumelle
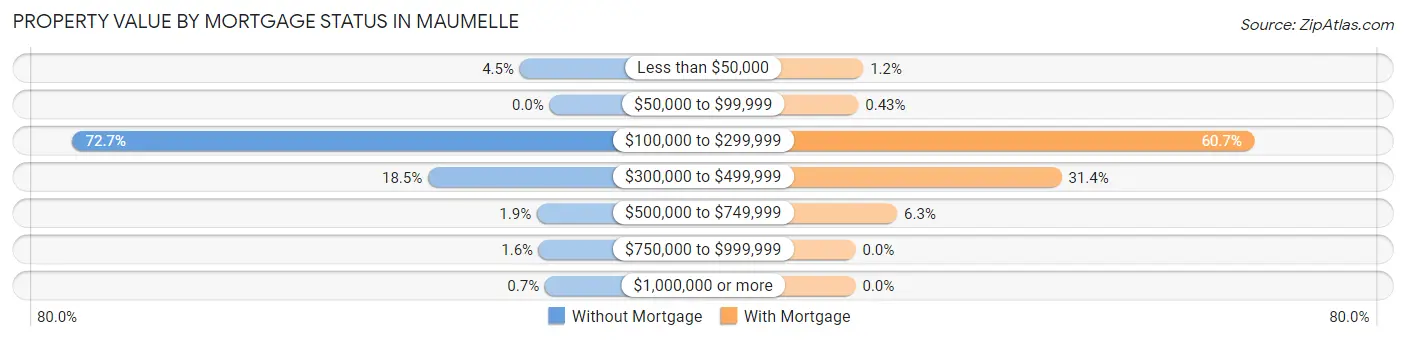
| Property Value | Without Mortgage | With Mortgage |
| Less than $50,000 | 78 (4.5%) | 49 (1.2%) |
| $50,000 to $99,999 | 0 (0.0%) | 18 (0.4%) |
| $100,000 to $299,999 | 1,248 (72.7%) | 2,536 (60.7%) |
| $300,000 to $499,999 | 318 (18.5%) | 1,312 (31.4%) |
| $500,000 to $749,999 | 33 (1.9%) | 265 (6.3%) |
| $750,000 to $999,999 | 28 (1.6%) | 0 (0.0%) |
| $1,000,000 or more | 12 (0.7%) | 0 (0.0%) |
| Total | 1,717 (100.0%) | 4,180 (100.0%) |
Household Income by Mortgage Status in Maumelle
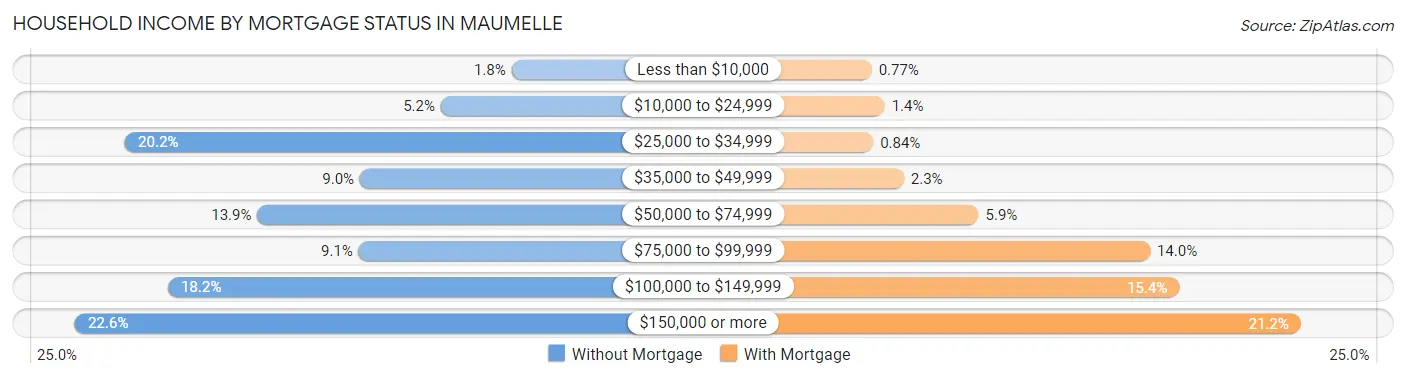
| Household Income | Without Mortgage | With Mortgage |
| Less than $10,000 | 31 (1.8%) | 32 (0.8%) |
| $10,000 to $24,999 | 89 (5.2%) | 58 (1.4%) |
| $25,000 to $34,999 | 347 (20.2%) | 35 (0.8%) |
| $35,000 to $49,999 | 155 (9.0%) | 96 (2.3%) |
| $50,000 to $74,999 | 239 (13.9%) | 245 (5.9%) |
| $75,000 to $99,999 | 156 (9.1%) | 586 (14.0%) |
| $100,000 to $149,999 | 312 (18.2%) | 644 (15.4%) |
| $150,000 or more | 388 (22.6%) | 886 (21.2%) |
| Total | 1,717 (100.0%) | 4,180 (100.0%) |
Property Value to Household Income Ratio in Maumelle
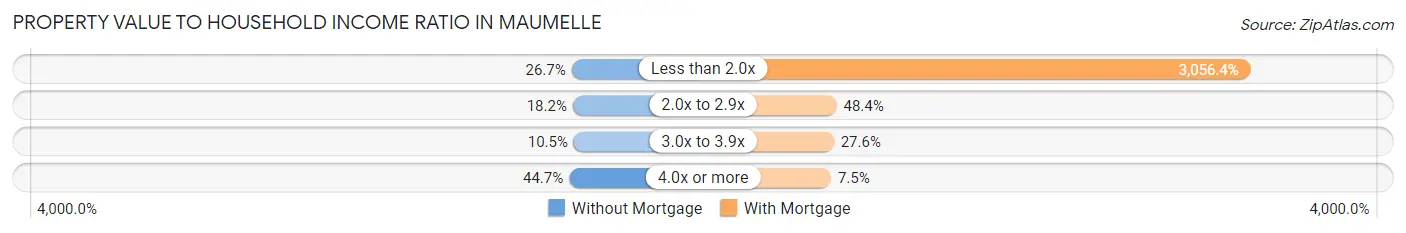
| Value-to-Income Ratio | Without Mortgage | With Mortgage |
| Less than 2.0x | 458 (26.7%) | 127,756 (3,056.4%) |
| 2.0x to 2.9x | 312 (18.2%) | 2,021 (48.3%) |
| 3.0x to 3.9x | 180 (10.5%) | 1,155 (27.6%) |
| 4.0x or more | 767 (44.7%) | 313 (7.5%) |
| Total | 1,717 (100.0%) | 4,180 (100.0%) |
Real Estate Taxes by Mortgage Status in Maumelle
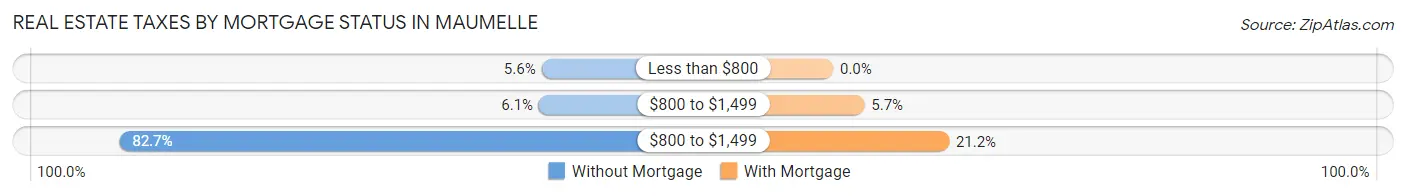
| Property Taxes | Without Mortgage | With Mortgage |
| Less than $800 | 96 (5.6%) | 0 (0.0%) |
| $800 to $1,499 | 104 (6.1%) | 239 (5.7%) |
| $800 to $1,499 | 1,420 (82.7%) | 885 (21.2%) |
| Total | 1,717 (100.0%) | 4,180 (100.0%) |
Health & Disability in Maumelle
Health Insurance Coverage by Age in Maumelle
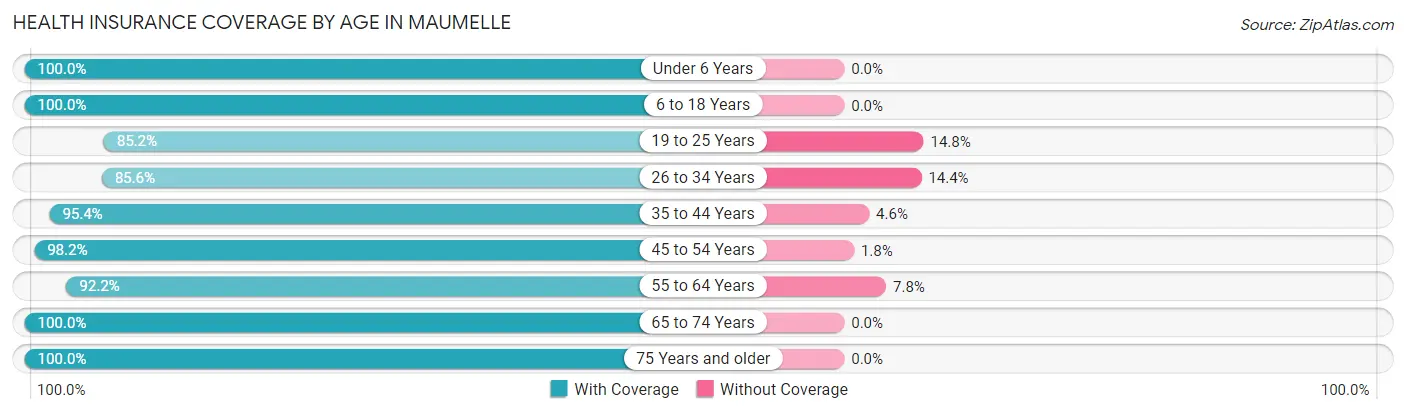
| Age Bracket | With Coverage | Without Coverage |
| Under 6 Years | 1,353 (100.0%) | 0 (0.0%) |
| 6 to 18 Years | 3,426 (100.0%) | 0 (0.0%) |
| 19 to 25 Years | 1,222 (85.2%) | 212 (14.8%) |
| 26 to 34 Years | 1,833 (85.6%) | 308 (14.4%) |
| 35 to 44 Years | 2,979 (95.4%) | 145 (4.6%) |
| 45 to 54 Years | 2,182 (98.2%) | 40 (1.8%) |
| 55 to 64 Years | 1,961 (92.2%) | 166 (7.8%) |
| 65 to 74 Years | 2,023 (100.0%) | 0 (0.0%) |
| 75 Years and older | 1,285 (100.0%) | 0 (0.0%) |
| Total | 18,264 (95.5%) | 871 (4.5%) |
Health Insurance Coverage by Citizenship Status in Maumelle
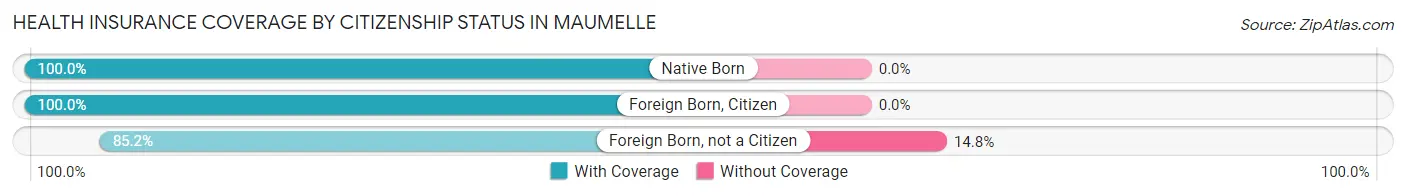
| Citizenship Status | With Coverage | Without Coverage |
| Native Born | 1,353 (100.0%) | 0 (0.0%) |
| Foreign Born, Citizen | 3,426 (100.0%) | 0 (0.0%) |
| Foreign Born, not a Citizen | 1,222 (85.2%) | 212 (14.8%) |
Health Insurance Coverage by Household Income in Maumelle
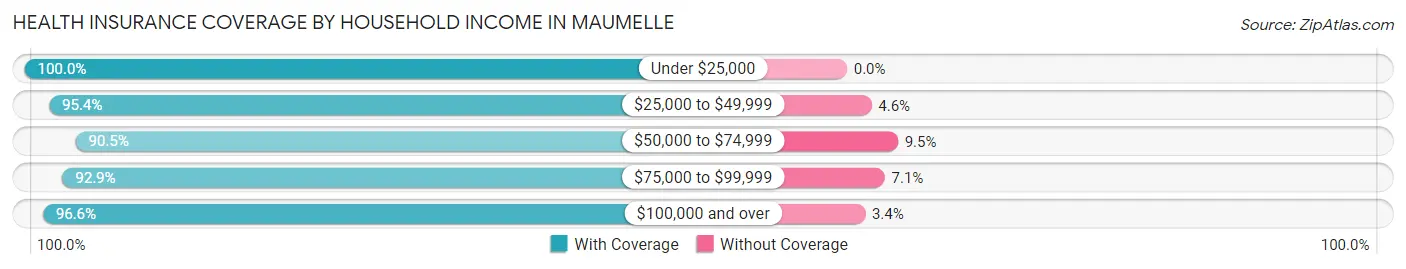
| Household Income | With Coverage | Without Coverage |
| Under $25,000 | 1,337 (100.0%) | 0 (0.0%) |
| $25,000 to $49,999 | 2,137 (95.4%) | 103 (4.6%) |
| $50,000 to $74,999 | 2,200 (90.5%) | 232 (9.5%) |
| $75,000 to $99,999 | 2,230 (92.9%) | 170 (7.1%) |
| $100,000 and over | 10,360 (96.6%) | 366 (3.4%) |
Public vs Private Health Insurance Coverage by Age in Maumelle
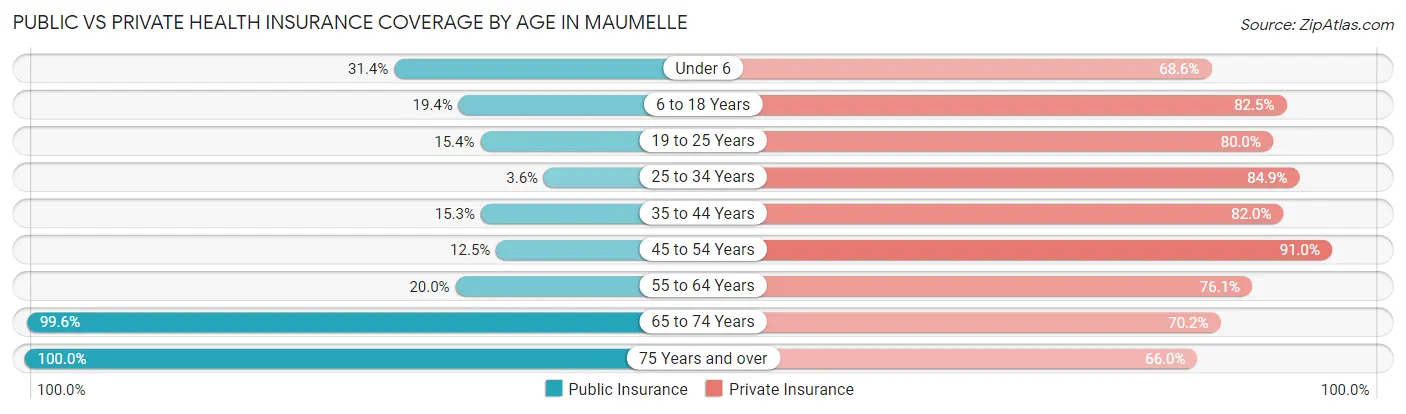
| Age Bracket | Public Insurance | Private Insurance |
| Under 6 | 425 (31.4%) | 928 (68.6%) |
| 6 to 18 Years | 666 (19.4%) | 2,826 (82.5%) |
| 19 to 25 Years | 221 (15.4%) | 1,147 (80.0%) |
| 25 to 34 Years | 77 (3.6%) | 1,818 (84.9%) |
| 35 to 44 Years | 479 (15.3%) | 2,560 (82.0%) |
| 45 to 54 Years | 277 (12.5%) | 2,021 (90.9%) |
| 55 to 64 Years | 426 (20.0%) | 1,619 (76.1%) |
| 65 to 74 Years | 2,015 (99.6%) | 1,421 (70.2%) |
| 75 Years and over | 1,285 (100.0%) | 848 (66.0%) |
| Total | 5,871 (30.7%) | 15,188 (79.4%) |
Disability Status by Sex by Age in Maumelle
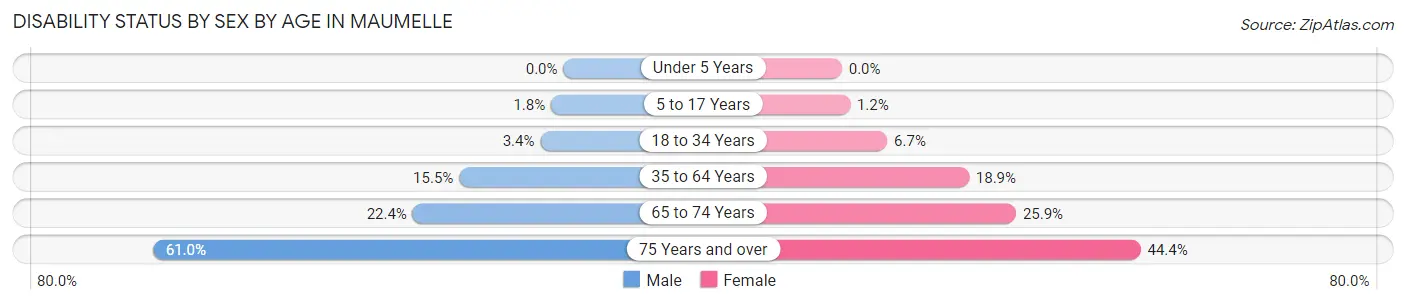
| Age Bracket | Male | Female |
| Under 5 Years | 0 (0.0%) | 0 (0.0%) |
| 5 to 17 Years | 30 (1.8%) | 23 (1.2%) |
| 18 to 34 Years | 66 (3.4%) | 118 (6.7%) |
| 35 to 64 Years | 515 (15.5%) | 782 (18.9%) |
| 65 to 74 Years | 206 (22.4%) | 285 (25.9%) |
| 75 Years and over | 367 (61.0%) | 303 (44.4%) |
Disability Class by Sex by Age in Maumelle
Disability Class: Hearing Difficulty
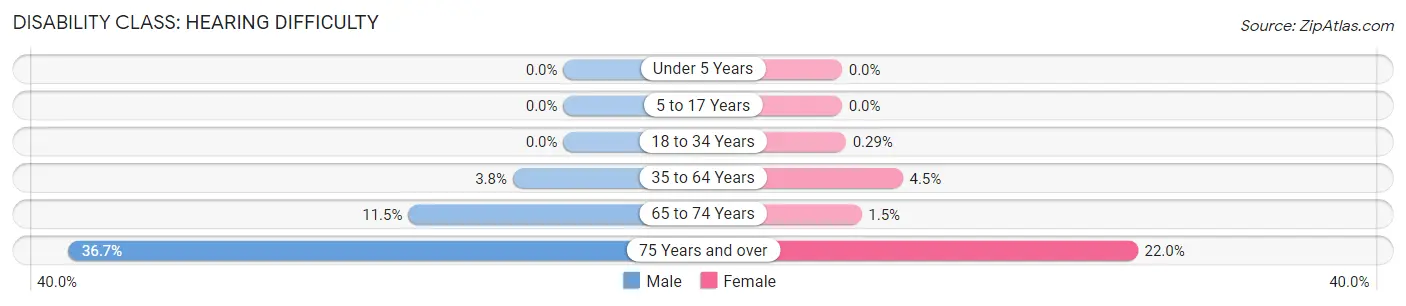
| Age Bracket | Male | Female |
| Under 5 Years | 0 (0.0%) | 0 (0.0%) |
| 5 to 17 Years | 0 (0.0%) | 0 (0.0%) |
| 18 to 34 Years | 0 (0.0%) | 5 (0.3%) |
| 35 to 64 Years | 125 (3.7%) | 187 (4.5%) |
| 65 to 74 Years | 106 (11.5%) | 16 (1.5%) |
| 75 Years and over | 221 (36.7%) | 150 (22.0%) |
Disability Class: Vision Difficulty
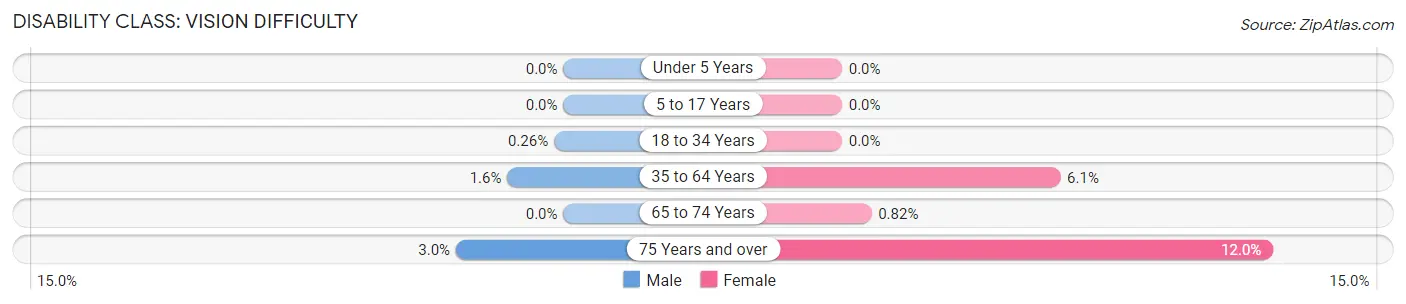
| Age Bracket | Male | Female |
| Under 5 Years | 0 (0.0%) | 0 (0.0%) |
| 5 to 17 Years | 0 (0.0%) | 0 (0.0%) |
| 18 to 34 Years | 5 (0.3%) | 0 (0.0%) |
| 35 to 64 Years | 52 (1.6%) | 252 (6.1%) |
| 65 to 74 Years | 0 (0.0%) | 9 (0.8%) |
| 75 Years and over | 18 (3.0%) | 82 (12.0%) |
Disability Class: Cognitive Difficulty
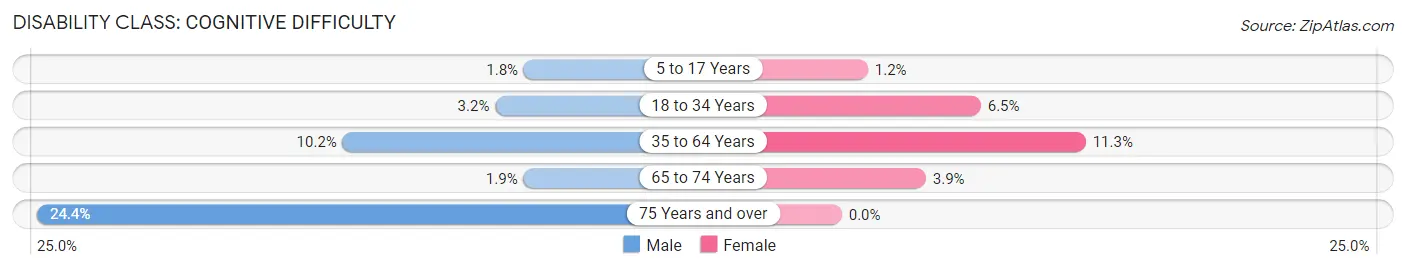
| Age Bracket | Male | Female |
| 5 to 17 Years | 30 (1.8%) | 23 (1.2%) |
| 18 to 34 Years | 61 (3.2%) | 113 (6.5%) |
| 35 to 64 Years | 341 (10.2%) | 469 (11.3%) |
| 65 to 74 Years | 17 (1.8%) | 43 (3.9%) |
| 75 Years and over | 147 (24.4%) | 0 (0.0%) |
Disability Class: Ambulatory Difficulty
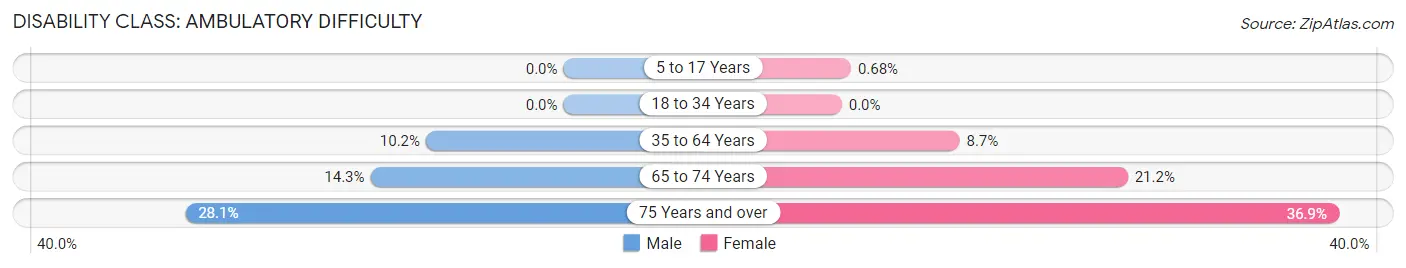
| Age Bracket | Male | Female |
| 5 to 17 Years | 0 (0.0%) | 13 (0.7%) |
| 18 to 34 Years | 0 (0.0%) | 0 (0.0%) |
| 35 to 64 Years | 340 (10.2%) | 362 (8.7%) |
| 65 to 74 Years | 132 (14.3%) | 234 (21.2%) |
| 75 Years and over | 169 (28.1%) | 252 (36.9%) |
Disability Class: Self-Care Difficulty
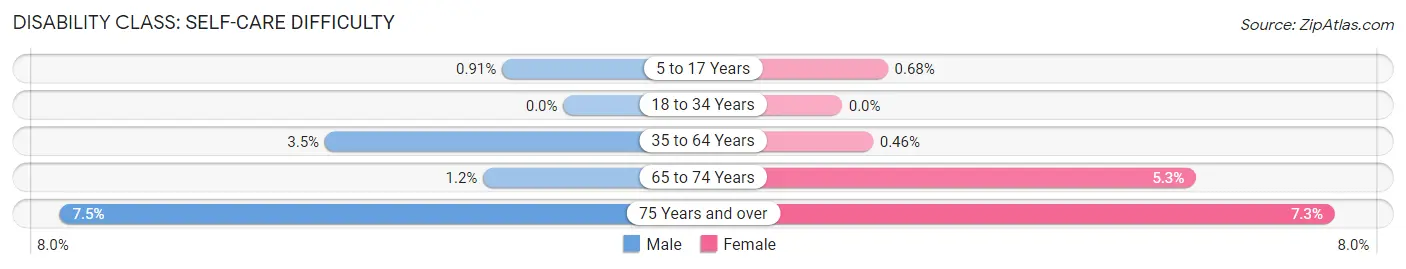
| Age Bracket | Male | Female |
| 5 to 17 Years | 15 (0.9%) | 13 (0.7%) |
| 18 to 34 Years | 0 (0.0%) | 0 (0.0%) |
| 35 to 64 Years | 118 (3.5%) | 19 (0.5%) |
| 65 to 74 Years | 11 (1.2%) | 58 (5.3%) |
| 75 Years and over | 45 (7.5%) | 50 (7.3%) |
Technology Access in Maumelle
Computing Device Access in Maumelle
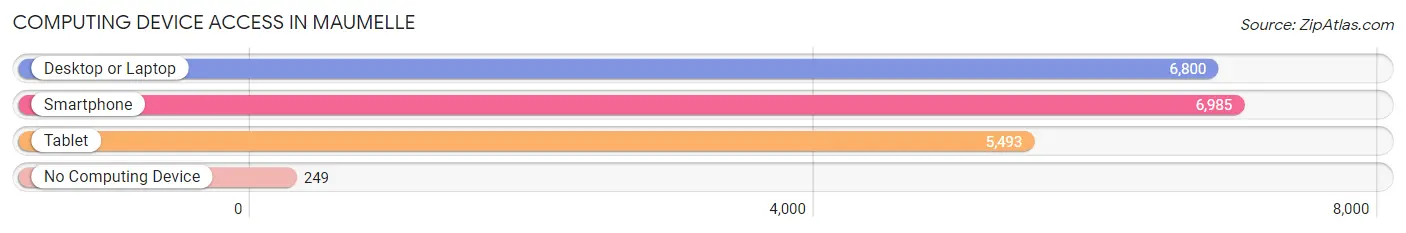
| Device Type | # Households | % Households |
| Desktop or Laptop | 6,800 | 89.4% |
| Smartphone | 6,985 | 91.8% |
| Tablet | 5,493 | 72.2% |
| No Computing Device | 249 | 3.3% |
| Total | 7,605 | 100.0% |
Internet Access in Maumelle
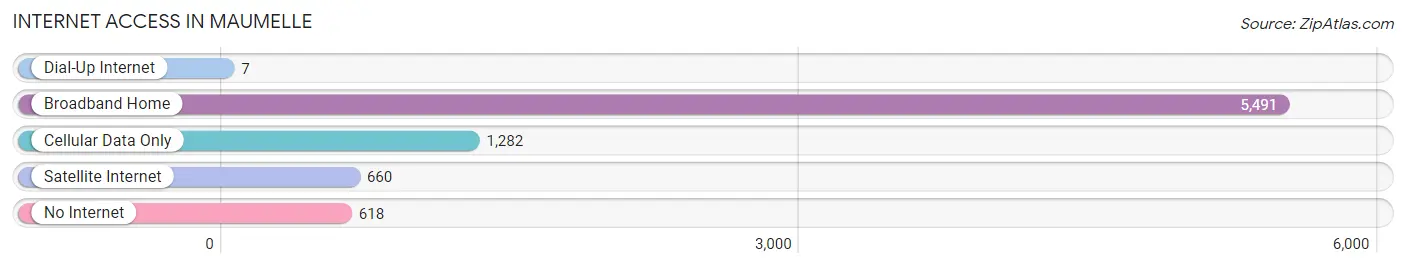
| Internet Type | # Households | % Households |
| Dial-Up Internet | 7 | 0.1% |
| Broadband Home | 5,491 | 72.2% |
| Cellular Data Only | 1,282 | 16.9% |
| Satellite Internet | 660 | 8.7% |
| No Internet | 618 | 8.1% |
| Total | 7,605 | 100.0% |
Maumelle Summary
Maumelle, Arkansas is a city located in Pulaski County, Arkansas. It is situated on the Arkansas River, just north of Little Rock. The city was incorporated in 1985 and has a population of approximately 19,000 people.
History
Maumelle was first settled in the early 1800s by French-Canadian fur trappers. The area was originally known as “La Petite Roche”, which translates to “the little rock”. The area was later renamed “Maumelle”, which is derived from the French word for “mother”.
In the late 1800s, the area was developed as a resort town. The area was known for its natural beauty and was a popular destination for tourists. The area was also home to a number of resorts, including the Maumelle Hotel, which was built in 1891.
In the early 1900s, the area began to experience rapid growth. The city was incorporated in 1985 and has since become a popular suburb of Little Rock.
Geography
Maumelle is located in Pulaski County, Arkansas. It is situated on the Arkansas River, just north of Little Rock. The city covers an area of approximately 16 square miles and has an elevation of approximately 500 feet.
The city is located in a humid subtropical climate zone and experiences hot, humid summers and mild winters. The average annual temperature is approximately 63 degrees Fahrenheit.
Economy
Maumelle’s economy is largely based on the service industry. The city is home to a number of retail stores, restaurants, and other businesses. The city is also home to a number of corporate headquarters, including Dillard’s, Inc., and the Arkansas Department of Human Services.
The city is also home to a number of manufacturing companies, including the Maumelle Manufacturing Company, which produces a variety of products, including furniture, clothing, and electronics.
Demographics
As of the 2010 census, Maumelle had a population of 19,208 people. The racial makeup of the city was 79.3% White, 15.2% African American, 0.5% Native American, 1.7% Asian, 0.1% Pacific Islander, and 2.2% from other races. Hispanic or Latino of any race were 4.2% of the population.
The median household income in Maumelle was $60,945, and the median family income was $71,945. The per capita income for the city was $30,945. Approximately 8.3% of the population was below the poverty line.
Conclusion
Maumelle, Arkansas is a city located in Pulaski County, Arkansas. It is situated on the Arkansas River, just north of Little Rock. The city was incorporated in 1985 and has a population of approximately 19,000 people. The city’s economy is largely based on the service industry, and it is home to a number of corporate headquarters and manufacturing companies. The racial makeup of the city is 79.3% White, 15.2% African American, 0.5% Native American, 1.7% Asian, 0.1% Pacific Islander, and 2.2% from other races. The median household income in Maumelle was $60,945, and the median family income was $71,945.
Common Questions
What is Per Capita Income in Maumelle?
Per Capita income in Maumelle is $50,916.
What is the Median Family Income in Maumelle?
Median Family Income in Maumelle is $126,057.
What is the Median Household income in Maumelle?
Median Household Income in Maumelle is $89,880.
What is Income or Wage Gap in Maumelle?
Income or Wage Gap in Maumelle is 21.0%.
Women in Maumelle earn 79.0 cents for every dollar earned by a man.
What is Inequality or Gini Index in Maumelle?
Inequality or Gini Index in Maumelle is 0.46.
What is the Total Population of Maumelle?
Total Population of Maumelle is 19,183.
What is the Total Male Population of Maumelle?
Total Male Population of Maumelle is 9,003.
What is the Total Female Population of Maumelle?
Total Female Population of Maumelle is 10,180.
What is the Ratio of Males per 100 Females in Maumelle?
There are 88.44 Males per 100 Females in Maumelle.
What is the Ratio of Females per 100 Males in Maumelle?
There are 113.07 Females per 100 Males in Maumelle.
What is the Median Population Age in Maumelle?
Median Population Age in Maumelle is 38.9 Years.
What is the Average Family Size in Maumelle
Average Family Size in Maumelle is 3.0 People.
What is the Average Household Size in Maumelle
Average Household Size in Maumelle is 2.5 People.
How Large is the Labor Force in Maumelle?
There are 9,767 People in the Labor Forcein in Maumelle.
What is the Percentage of People in the Labor Force in Maumelle?
64.3% of People are in the Labor Force in Maumelle.
What is the Unemployment Rate in Maumelle?
Unemployment Rate in Maumelle is 4.7%.