Gentry, AR Map & Demographics
Gentry Map
Gentry Overview
$30,430
PER CAPITA INCOME
$63,727
AVG FAMILY INCOME
$62,981
AVG HOUSEHOLD INCOME
2.2%
WAGE / INCOME GAP [ % ]
97.8¢/ $1
WAGE / INCOME GAP [ $ ]
0.44
INEQUALITY / GINI INDEX
3,912
TOTAL POPULATION
2,028
MALE POPULATION
1,884
FEMALE POPULATION
107.64
MALES / 100 FEMALES
92.90
FEMALES / 100 MALES
35.0
MEDIAN AGE
2.9
AVG FAMILY SIZE
2.6
AVG HOUSEHOLD SIZE
1,847
LABOR FORCE [ PEOPLE ]
59.1%
PERCENT IN LABOR FORCE
Gentry Zip Codes
Gentry Area Codes
Income in Gentry
Income Overview in Gentry
Per Capita Income in Gentry is $30,430, while median incomes of families and households are $63,727 and $62,981 respectively.
| Characteristic | Number | Measure |
| Per Capita Income | 3,912 | $30,430 |
| Median Family Income | 1,157 | $63,727 |
| Mean Family Income | 1,157 | $68,365 |
| Median Household Income | 1,505 | $62,981 |
| Mean Household Income | 1,505 | $77,206 |
| Income Deficit | 1,157 | $0 |
| Wage / Income Gap (%) | 3,912 | 2.24% |
| Wage / Income Gap ($) | 3,912 | 97.76¢ per $1 |
| Gini / Inequality Index | 3,912 | 0.44 |
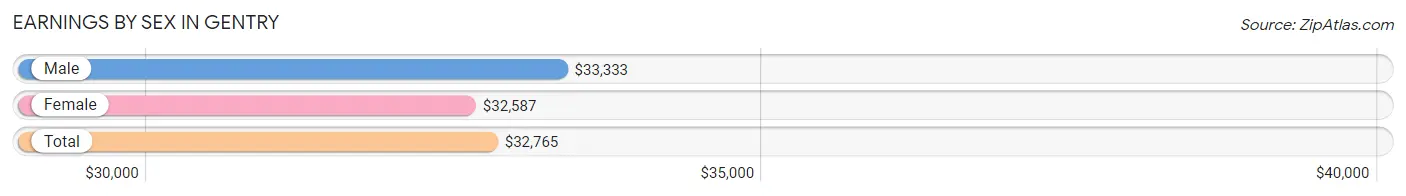
Earnings by Sex in Gentry
Average Earnings in Gentry are $32,765, $33,333 for men and $32,587 for women, a difference of 2.2%.
| Sex | Number | Average Earnings |
| Male | 1,148 (57.6%) | $33,333 |
| Female | 846 (42.4%) | $32,587 |
| Total | 1,994 (100.0%) | $32,765 |
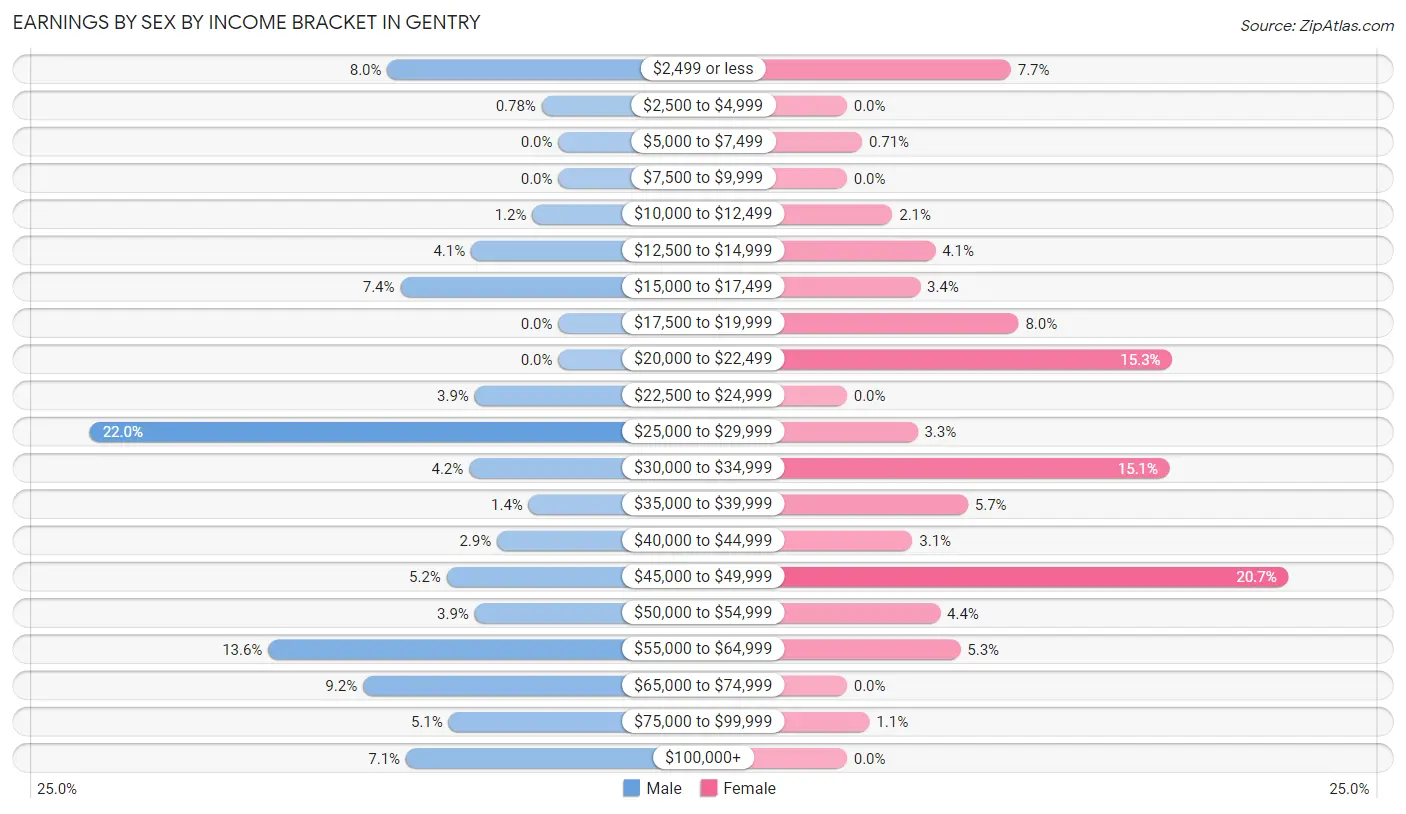
Earnings by Sex by Income Bracket in Gentry
The most common earnings brackets in Gentry are $25,000 to $29,999 for men (252 | 22.0%) and $45,000 to $49,999 for women (175 | 20.7%).
| Income | Male | Female |
| $2,499 or less | 92 (8.0%) | 65 (7.7%) |
| $2,500 to $4,999 | 9 (0.8%) | 0 (0.0%) |
| $5,000 to $7,499 | 0 (0.0%) | 6 (0.7%) |
| $7,500 to $9,999 | 0 (0.0%) | 0 (0.0%) |
| $10,000 to $12,499 | 14 (1.2%) | 18 (2.1%) |
| $12,500 to $14,999 | 47 (4.1%) | 35 (4.1%) |
| $15,000 to $17,499 | 85 (7.4%) | 29 (3.4%) |
| $17,500 to $19,999 | 0 (0.0%) | 68 (8.0%) |
| $20,000 to $22,499 | 0 (0.0%) | 129 (15.2%) |
| $22,500 to $24,999 | 45 (3.9%) | 0 (0.0%) |
| $25,000 to $29,999 | 252 (22.0%) | 28 (3.3%) |
| $30,000 to $34,999 | 48 (4.2%) | 128 (15.1%) |
| $35,000 to $39,999 | 16 (1.4%) | 48 (5.7%) |
| $40,000 to $44,999 | 33 (2.9%) | 26 (3.1%) |
| $45,000 to $49,999 | 60 (5.2%) | 175 (20.7%) |
| $50,000 to $54,999 | 45 (3.9%) | 37 (4.4%) |
| $55,000 to $64,999 | 156 (13.6%) | 45 (5.3%) |
| $65,000 to $74,999 | 105 (9.1%) | 0 (0.0%) |
| $75,000 to $99,999 | 59 (5.1%) | 9 (1.1%) |
| $100,000+ | 82 (7.1%) | 0 (0.0%) |
| Total | 1,148 (100.0%) | 846 (100.0%) |
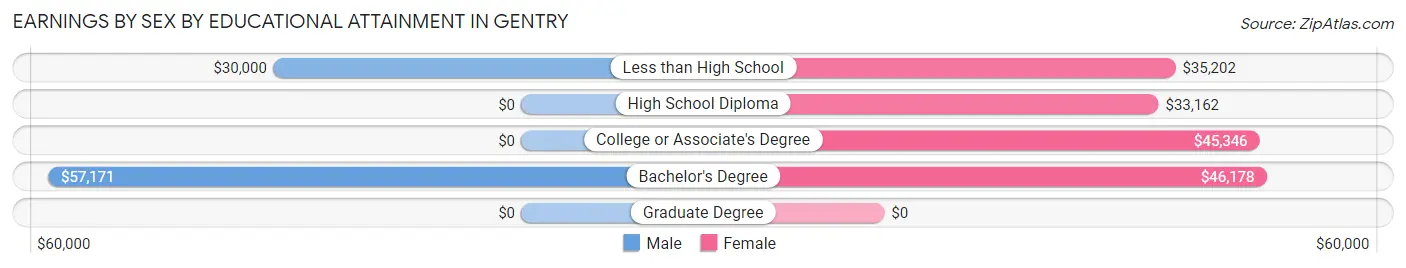
Earnings by Sex by Educational Attainment in Gentry
Average earnings in Gentry are $43,152 for men and $36,589 for women, a difference of 15.2%. Men with an educational attainment of bachelor's degree enjoy the highest average annual earnings of $57,171, while those with less than high school education earn the least with $30,000. Women with an educational attainment of bachelor's degree earn the most with the average annual earnings of $46,178, while those with high school diploma education have the smallest earnings of $33,162.
| Educational Attainment | Male Income | Female Income |
| Less than High School | $30,000 | $35,202 |
| High School Diploma | - | - |
| College or Associate's Degree | - | - |
| Bachelor's Degree | $57,171 | $46,178 |
| Graduate Degree | - | - |
| Total | $43,152 | $36,589 |
Family Income in Gentry
Family Income Brackets in Gentry
According to the Gentry family income data, there are 405 families falling into the $50,000 to $74,999 income range, which is the most common income bracket and makes up 35.0% of all families.
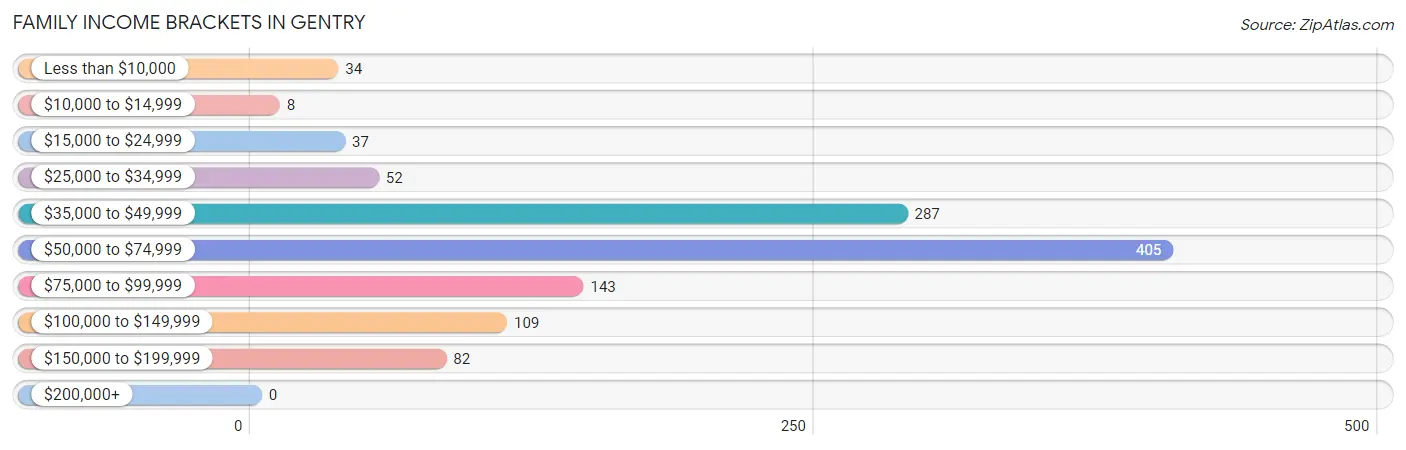
| Income Bracket | # Families | % Families |
| Less than $10,000 | 34 | 2.9% |
| $10,000 to $14,999 | 8 | 0.7% |
| $15,000 to $24,999 | 37 | 3.2% |
| $25,000 to $34,999 | 52 | 4.5% |
| $35,000 to $49,999 | 287 | 24.8% |
| $50,000 to $74,999 | 405 | 35.0% |
| $75,000 to $99,999 | 143 | 12.4% |
| $100,000 to $149,999 | 109 | 9.4% |
| $150,000 to $199,999 | 82 | 7.1% |
| $200,000+ | 0 | 0.0% |
Family Income by Famaliy Size in Gentry
2-person families (542 | 46.9%) account for the highest median family income in Gentry with $67,418 per family, while 2-person families (542 | 46.9%) have the highest median income of $33,709 per family member.
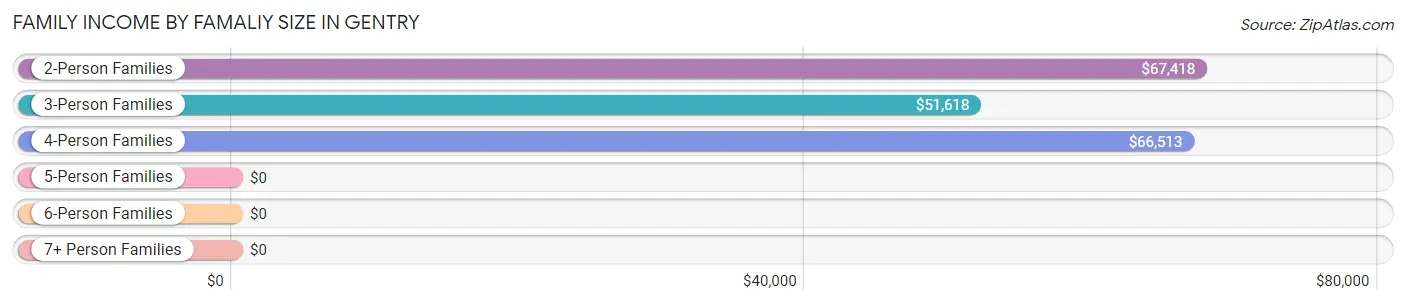
| Income Bracket | # Families | Median Income |
| 2-Person Families | 542 (46.9%) | $67,418 |
| 3-Person Families | 278 (24.0%) | $51,618 |
| 4-Person Families | 85 (7.3%) | $66,513 |
| 5-Person Families | 208 (18.0%) | $0 |
| 6-Person Families | 38 (3.3%) | $0 |
| 7+ Person Families | 6 (0.5%) | $0 |
| Total | 1,157 (100.0%) | $63,727 |
Family Income by Number of Earners in Gentry
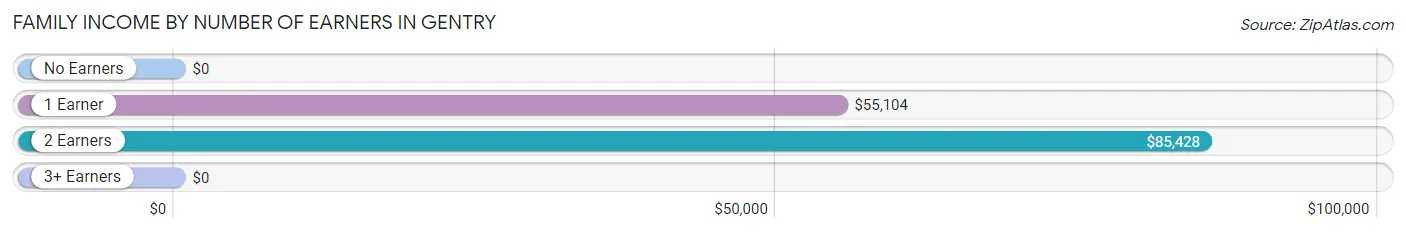
| Number of Earners | # Families | Median Income |
| No Earners | 233 (20.1%) | $0 |
| 1 Earner | 382 (33.0%) | $55,104 |
| 2 Earners | 485 (41.9%) | $85,428 |
| 3+ Earners | 57 (4.9%) | $0 |
| Total | 1,157 (100.0%) | $63,727 |
Household Income in Gentry
Household Income Brackets in Gentry
With 528 households falling in the category, the $50,000 to $74,999 income range is the most frequent in Gentry, accounting for 35.1% of all households. In contrast, only 17 households (1.1%) fall into the $200,000+ income bracket, making it the least populous group.
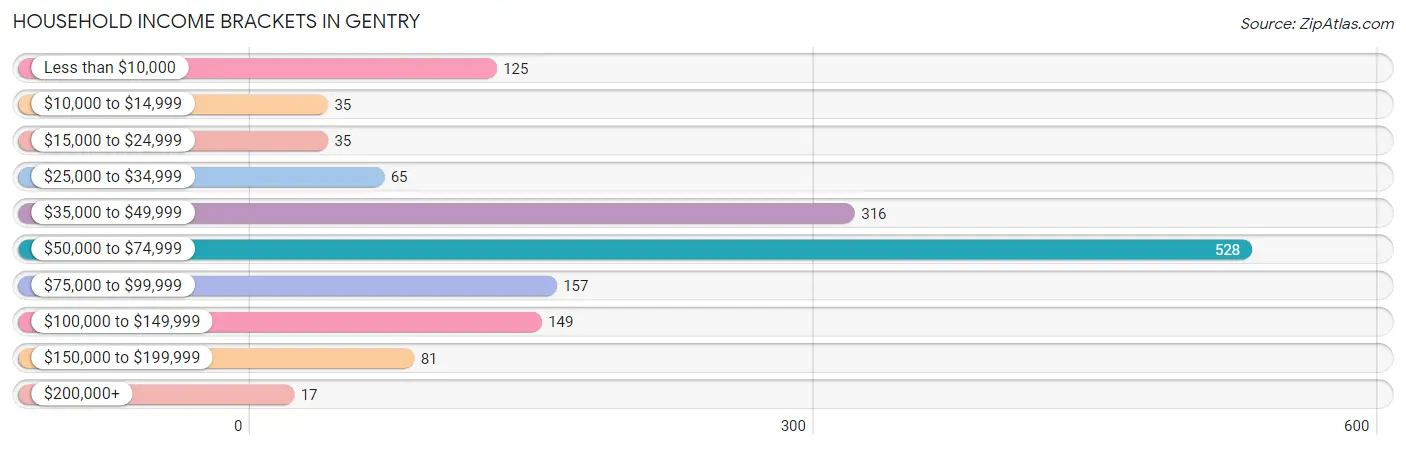
| Income Bracket | # Households | % Households |
| Less than $10,000 | 125 | 8.3% |
| $10,000 to $14,999 | 35 | 2.3% |
| $15,000 to $24,999 | 35 | 2.3% |
| $25,000 to $34,999 | 65 | 4.3% |
| $35,000 to $49,999 | 316 | 21.0% |
| $50,000 to $74,999 | 528 | 35.1% |
| $75,000 to $99,999 | 157 | 10.4% |
| $100,000 to $149,999 | 149 | 9.9% |
| $150,000 to $199,999 | 81 | 5.4% |
| $200,000+ | 17 | 1.1% |
Household Income by Householder Age in Gentry
The median household income in Gentry is $62,981, with the highest median household income of $70,385 found in the 65+ years age bracket for the primary householder. A total of 342 households (22.7%) fall into this category. Meanwhile, the 15 to 24 years age bracket for the primary householder has the lowest median household income of $36,468, with 148 households (9.8%) in this group.
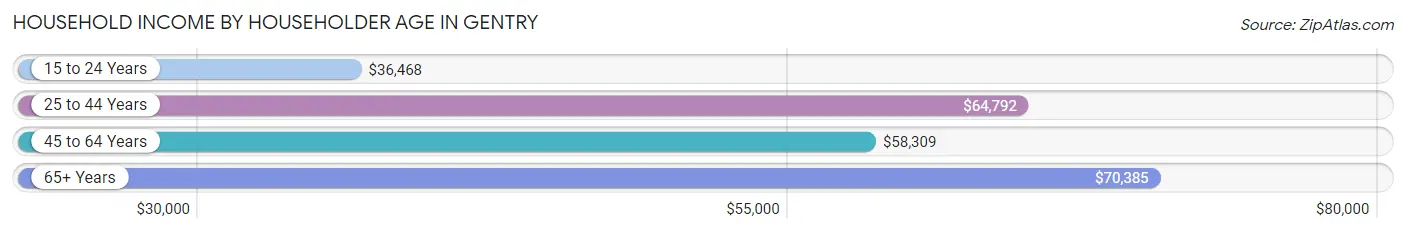
| Income Bracket | # Households | Median Income |
| 15 to 24 Years | 148 (9.8%) | $36,468 |
| 25 to 44 Years | 432 (28.7%) | $64,792 |
| 45 to 64 Years | 583 (38.7%) | $58,309 |
| 65+ Years | 342 (22.7%) | $70,385 |
| Total | 1,505 (100.0%) | $62,981 |
Poverty in Gentry
Income Below Poverty by Sex and Age in Gentry
With 9.0% poverty level for males and 6.0% for females among the residents of Gentry, 55 to 64 year old males and 16 and 17 year old females are the most vulnerable to poverty, with 106 males (36.3%) and 18 females (78.3%) in their respective age groups living below the poverty level.
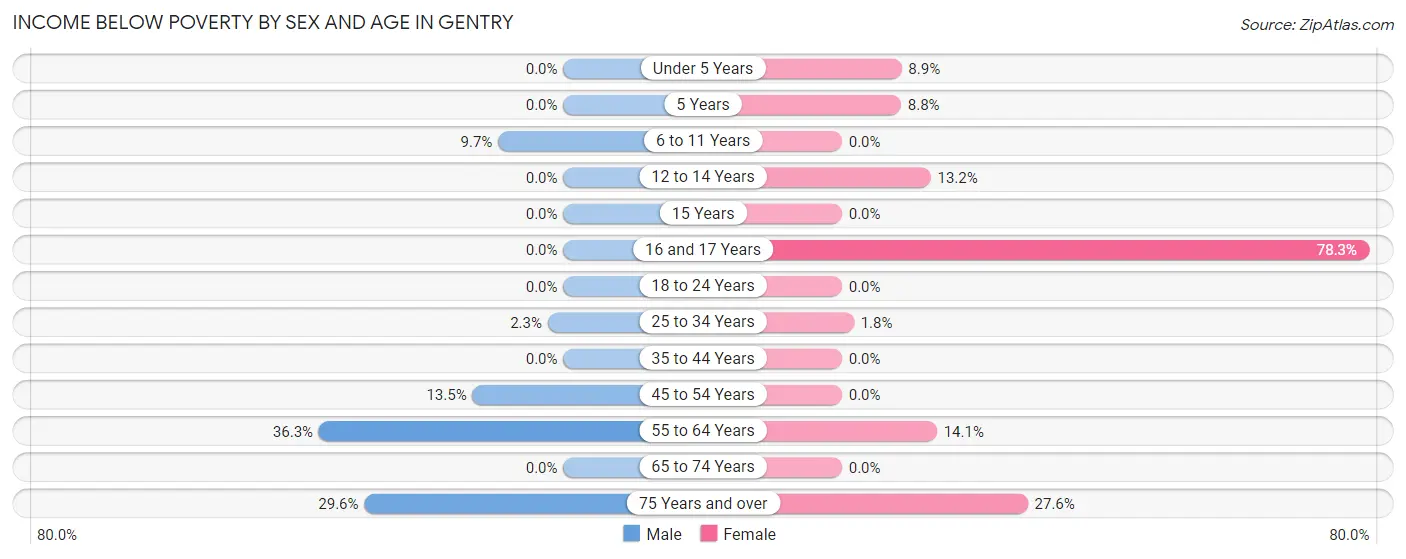
| Age Bracket | Male | Female |
| Under 5 Years | 0 (0.0%) | 10 (8.8%) |
| 5 Years | 0 (0.0%) | 5 (8.8%) |
| 6 to 11 Years | 12 (9.7%) | 0 (0.0%) |
| 12 to 14 Years | 0 (0.0%) | 17 (13.2%) |
| 15 Years | 0 (0.0%) | 0 (0.0%) |
| 16 and 17 Years | 0 (0.0%) | 18 (78.3%) |
| 18 to 24 Years | 0 (0.0%) | 0 (0.0%) |
| 25 to 34 Years | 9 (2.3%) | 5 (1.8%) |
| 35 to 44 Years | 0 (0.0%) | 0 (0.0%) |
| 45 to 54 Years | 29 (13.5%) | 0 (0.0%) |
| 55 to 64 Years | 106 (36.3%) | 11 (14.1%) |
| 65 to 74 Years | 0 (0.0%) | 0 (0.0%) |
| 75 Years and over | 26 (29.5%) | 48 (27.6%) |
| Total | 182 (9.0%) | 114 (6.0%) |
Income Above Poverty by Sex and Age in Gentry
According to the poverty statistics in Gentry, males aged under 5 years and females aged 6 to 11 years are the age groups that are most secure financially, with 100.0% of males and 100.0% of females in these age groups living above the poverty line.
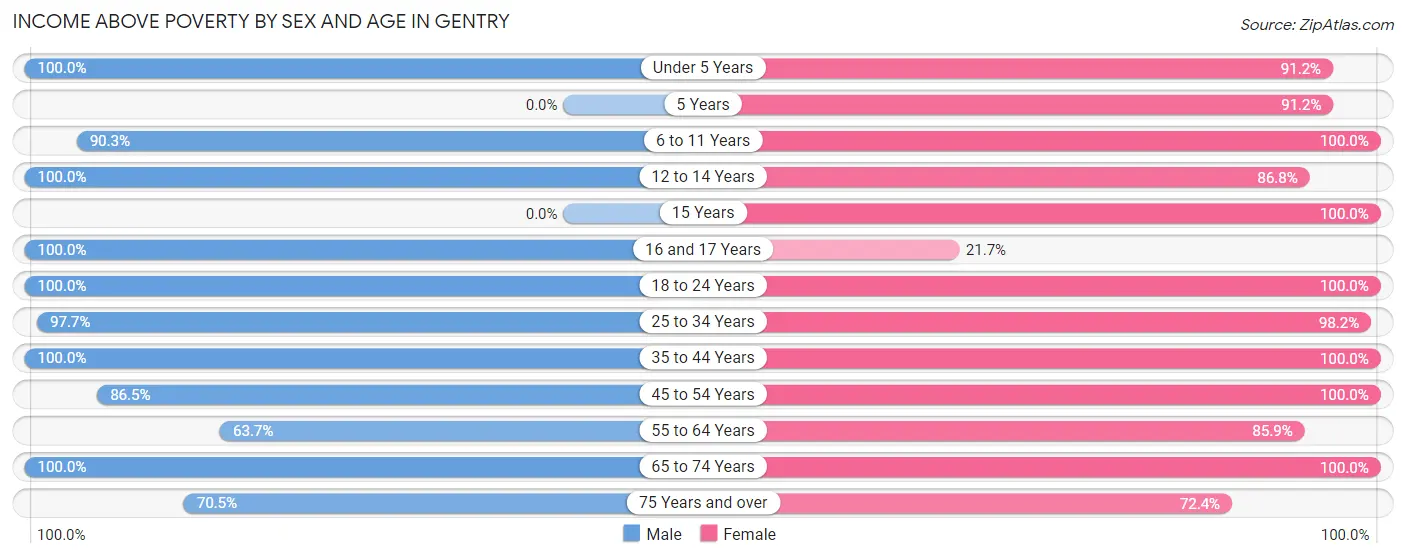
| Age Bracket | Male | Female |
| Under 5 Years | 145 (100.0%) | 103 (91.1%) |
| 5 Years | 0 (0.0%) | 52 (91.2%) |
| 6 to 11 Years | 112 (90.3%) | 169 (100.0%) |
| 12 to 14 Years | 45 (100.0%) | 112 (86.8%) |
| 15 Years | 0 (0.0%) | 5 (100.0%) |
| 16 and 17 Years | 61 (100.0%) | 5 (21.7%) |
| 18 to 24 Years | 173 (100.0%) | 241 (100.0%) |
| 25 to 34 Years | 380 (97.7%) | 277 (98.2%) |
| 35 to 44 Years | 201 (100.0%) | 186 (100.0%) |
| 45 to 54 Years | 186 (86.5%) | 343 (100.0%) |
| 55 to 64 Years | 186 (63.7%) | 67 (85.9%) |
| 65 to 74 Years | 295 (100.0%) | 84 (100.0%) |
| 75 Years and over | 62 (70.5%) | 126 (72.4%) |
| Total | 1,846 (91.0%) | 1,770 (94.0%) |
Income Below Poverty Among Married-Couple Families in Gentry
The poverty statistics for married-couple families in Gentry show that 4.5% or 37 of the total 817 families live below the poverty line. Families with no children have the highest poverty rate of 6.7%, comprising of 28 families. On the other hand, families with 3 or 4 children have the lowest poverty rate of 0.0%, which includes 0 families.
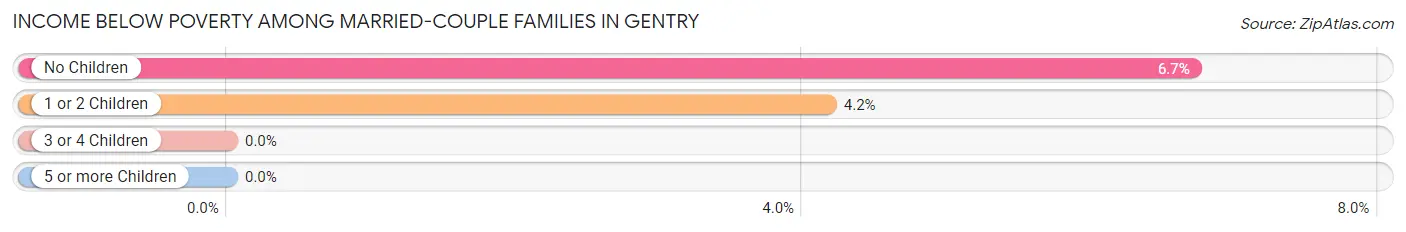
| Children | Above Poverty | Below Poverty |
| No Children | 389 (93.3%) | 28 (6.7%) |
| 1 or 2 Children | 207 (95.8%) | 9 (4.2%) |
| 3 or 4 Children | 178 (100.0%) | 0 (0.0%) |
| 5 or more Children | 6 (100.0%) | 0 (0.0%) |
| Total | 780 (95.5%) | 37 (4.5%) |
Income Below Poverty Among Single-Parent Households in Gentry
According to the poverty data in Gentry, 16.4% or 17 single-father households and 5.5% or 13 single-mother households are living below the poverty line. Among single-father households, those with 1 or 2 children have the highest poverty rate, with 17 households (37.0%) experiencing poverty. Likewise, among single-mother households, those with 3 or 4 children have the highest poverty rate, with 5 households (15.1%) falling below the poverty line.
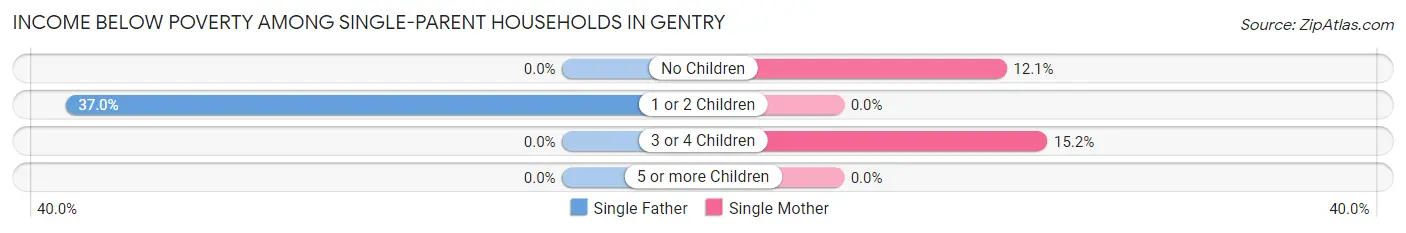
| Children | Single Father | Single Mother |
| No Children | 0 (0.0%) | 8 (12.1%) |
| 1 or 2 Children | 17 (37.0%) | 0 (0.0%) |
| 3 or 4 Children | 0 (0.0%) | 5 (15.1%) |
| 5 or more Children | 0 (0.0%) | 0 (0.0%) |
| Total | 17 (16.4%) | 13 (5.5%) |
Income Below Poverty Among Married-Couple vs Single-Parent Households in Gentry
The poverty data for Gentry shows that 37 of the married-couple family households (4.5%) and 30 of the single-parent households (8.8%) are living below the poverty level. Within the married-couple family households, those with no children have the highest poverty rate, with 28 households (6.7%) falling below the poverty line. Among the single-parent households, those with 3 or 4 children have the highest poverty rate, with 5 household (15.1%) living below poverty.
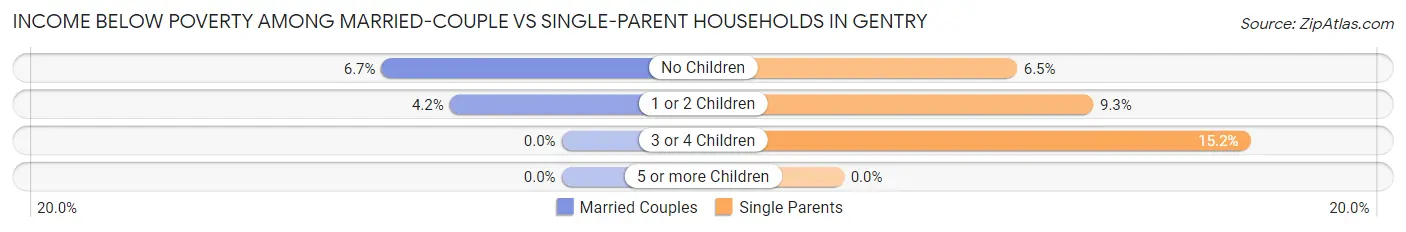
| Children | Married-Couple Families | Single-Parent Households |
| No Children | 28 (6.7%) | 8 (6.5%) |
| 1 or 2 Children | 9 (4.2%) | 17 (9.3%) |
| 3 or 4 Children | 0 (0.0%) | 5 (15.1%) |
| 5 or more Children | 0 (0.0%) | 0 (0.0%) |
| Total | 37 (4.5%) | 30 (8.8%) |
Race in Gentry
The most populous races in Gentry are White / Caucasian (2,837 | 72.5%), Hispanic or Latino (904 | 23.1%), and Two or more Races (846 | 21.6%).
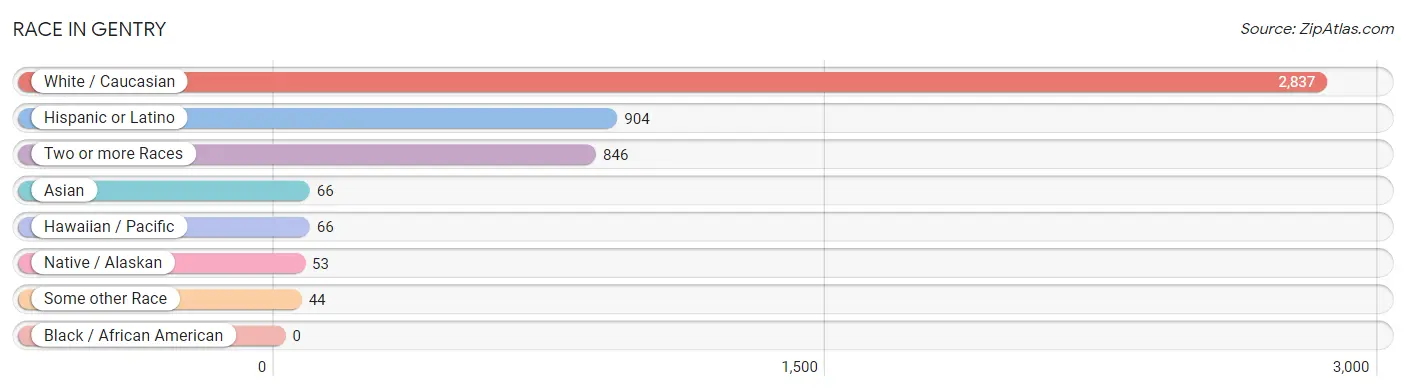
| Race | # Population | % Population |
| Asian | 66 | 1.7% |
| Black / African American | 0 | 0.0% |
| Hawaiian / Pacific | 66 | 1.7% |
| Hispanic or Latino | 904 | 23.1% |
| Native / Alaskan | 53 | 1.3% |
| White / Caucasian | 2,837 | 72.5% |
| Two or more Races | 846 | 21.6% |
| Some other Race | 44 | 1.1% |
| Total | 3,912 | 100.0% |
Ancestry in Gentry
The most populous ancestries reported in Gentry are German (575 | 14.7%), English (446 | 11.4%), Central American (294 | 7.5%), Salvadoran (294 | 7.5%), and Mexican (292 | 7.5%), together accounting for 48.6% of all Gentry residents.
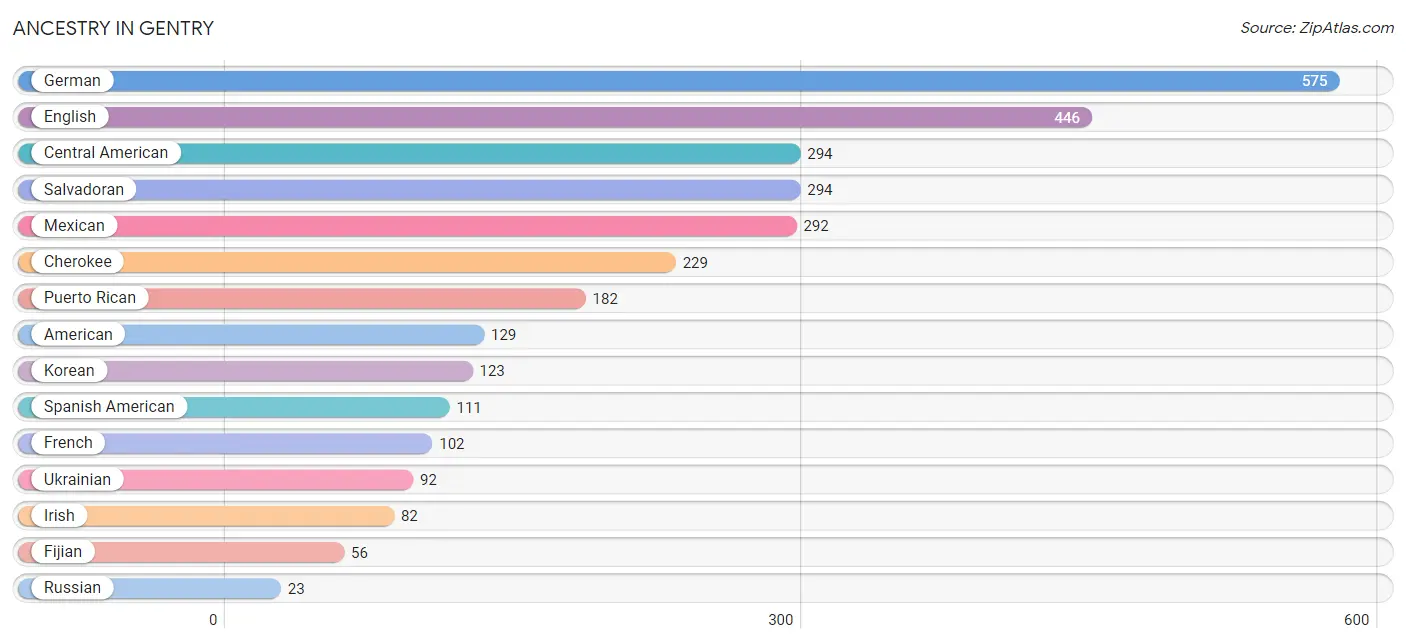
| Ancestry | # Population | % Population |
| American | 129 | 3.3% |
| Bangladeshi | 11 | 0.3% |
| British | 19 | 0.5% |
| Central American | 294 | 7.5% |
| Cherokee | 229 | 5.9% |
| Choctaw | 16 | 0.4% |
| English | 446 | 11.4% |
| Fijian | 56 | 1.4% |
| French | 102 | 2.6% |
| German | 575 | 14.7% |
| Irish | 82 | 2.1% |
| Italian | 11 | 0.3% |
| Korean | 123 | 3.1% |
| Mexican | 292 | 7.5% |
| Polish | 5 | 0.1% |
| Puerto Rican | 182 | 4.6% |
| Russian | 23 | 0.6% |
| Salvadoran | 294 | 7.5% |
| Scotch-Irish | 12 | 0.3% |
| Scottish | 16 | 0.4% |
| South African | 13 | 0.3% |
| Spanish American | 111 | 2.8% |
| Subsaharan African | 13 | 0.3% |
| Swedish | 17 | 0.4% |
| Ukrainian | 92 | 2.4% | View All 25 Rows |
Immigrants in Gentry
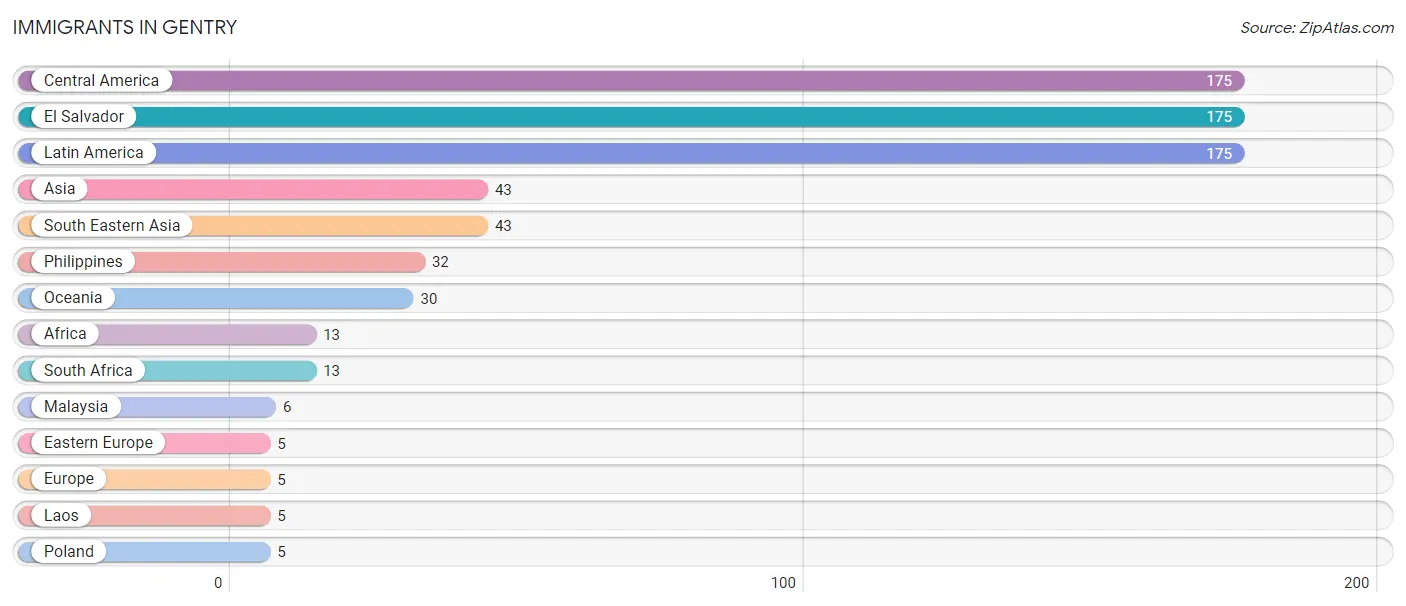
The most numerous immigrant groups reported in Gentry came from Central America (175 | 4.5%), El Salvador (175 | 4.5%), Latin America (175 | 4.5%), Asia (43 | 1.1%), and South Eastern Asia (43 | 1.1%), together accounting for 15.6% of all Gentry residents.
| Immigration Origin | # Population | % Population |
| Africa | 13 | 0.3% |
| Asia | 43 | 1.1% |
| Central America | 175 | 4.5% |
| Eastern Europe | 5 | 0.1% |
| El Salvador | 175 | 4.5% |
| Europe | 5 | 0.1% |
| Laos | 5 | 0.1% |
| Latin America | 175 | 4.5% |
| Malaysia | 6 | 0.2% |
| Oceania | 30 | 0.8% |
| Philippines | 32 | 0.8% |
| Poland | 5 | 0.1% |
| South Africa | 13 | 0.3% |
| South Eastern Asia | 43 | 1.1% | View All 14 Rows |
Sex and Age in Gentry
Sex and Age in Gentry
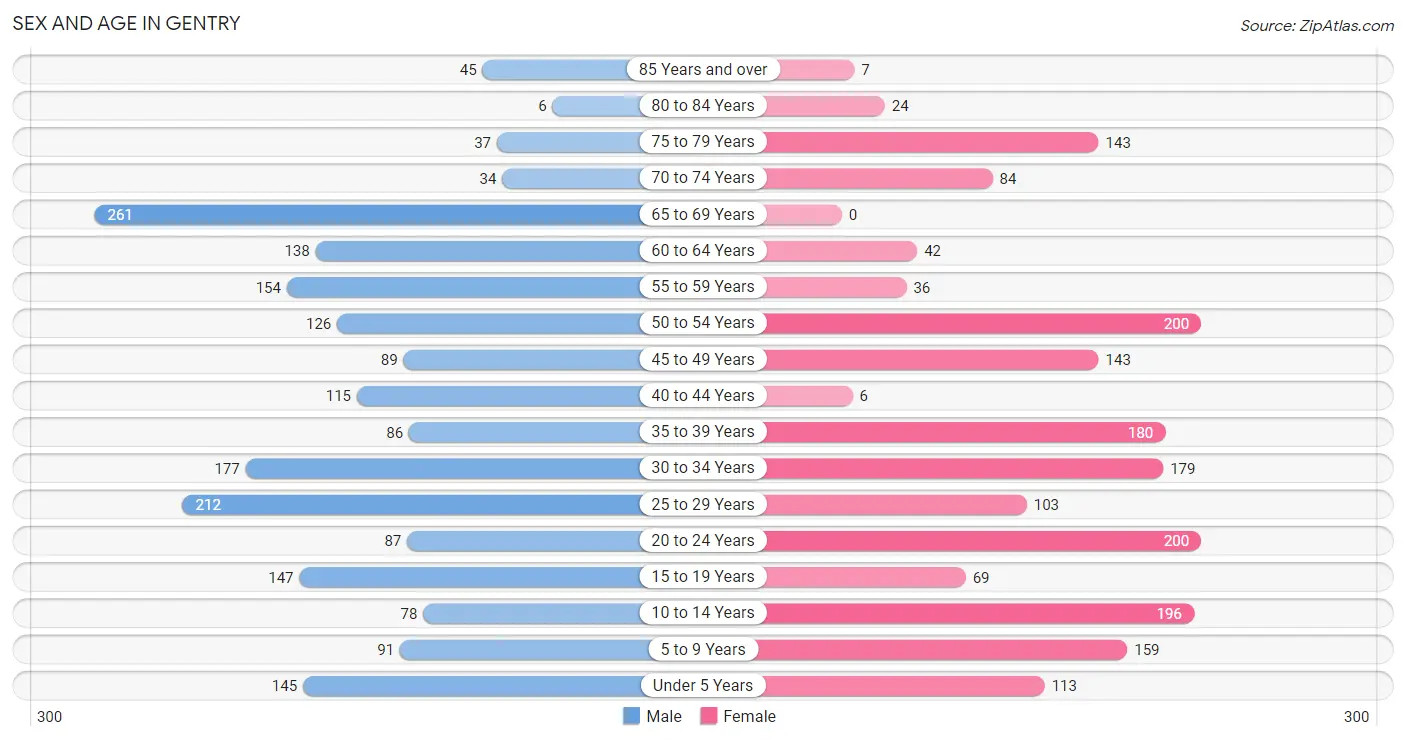
The most populous age groups in Gentry are 65 to 69 Years (261 | 12.9%) for men and 20 to 24 Years (200 | 10.6%) for women.
| Age Bracket | Male | Female |
| Under 5 Years | 145 (7.1%) | 113 (6.0%) |
| 5 to 9 Years | 91 (4.5%) | 159 (8.4%) |
| 10 to 14 Years | 78 (3.8%) | 196 (10.4%) |
| 15 to 19 Years | 147 (7.2%) | 69 (3.7%) |
| 20 to 24 Years | 87 (4.3%) | 200 (10.6%) |
| 25 to 29 Years | 212 (10.4%) | 103 (5.5%) |
| 30 to 34 Years | 177 (8.7%) | 179 (9.5%) |
| 35 to 39 Years | 86 (4.2%) | 180 (9.6%) |
| 40 to 44 Years | 115 (5.7%) | 6 (0.3%) |
| 45 to 49 Years | 89 (4.4%) | 143 (7.6%) |
| 50 to 54 Years | 126 (6.2%) | 200 (10.6%) |
| 55 to 59 Years | 154 (7.6%) | 36 (1.9%) |
| 60 to 64 Years | 138 (6.8%) | 42 (2.2%) |
| 65 to 69 Years | 261 (12.9%) | 0 (0.0%) |
| 70 to 74 Years | 34 (1.7%) | 84 (4.5%) |
| 75 to 79 Years | 37 (1.8%) | 143 (7.6%) |
| 80 to 84 Years | 6 (0.3%) | 24 (1.3%) |
| 85 Years and over | 45 (2.2%) | 7 (0.4%) |
| Total | 2,028 (100.0%) | 1,884 (100.0%) |
Families and Households in Gentry
Median Family Size in Gentry
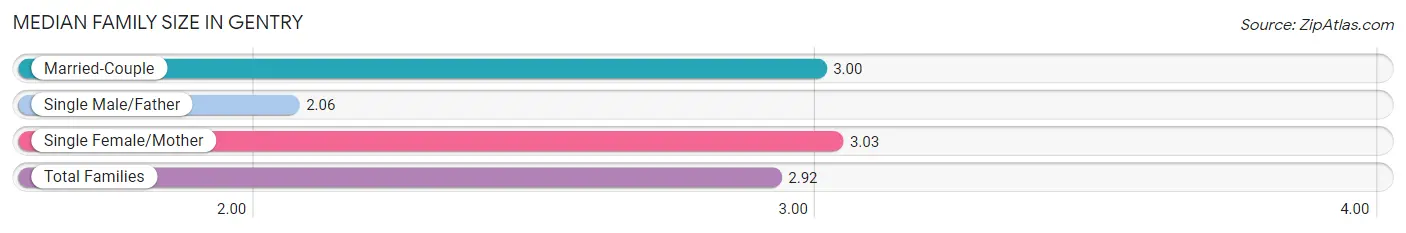
The median family size in Gentry is 2.92 persons per family, with single female/mother families (236 | 20.4%) accounting for the largest median family size of 3.03 persons per family. On the other hand, single male/father families (104 | 9.0%) represent the smallest median family size with 2.06 persons per family.
| Family Type | # Families | Family Size |
| Married-Couple | 817 (70.6%) | 3.00 |
| Single Male/Father | 104 (9.0%) | 2.06 |
| Single Female/Mother | 236 (20.4%) | 3.03 |
| Total Families | 1,157 (100.0%) | 2.92 |
Median Household Size in Gentry
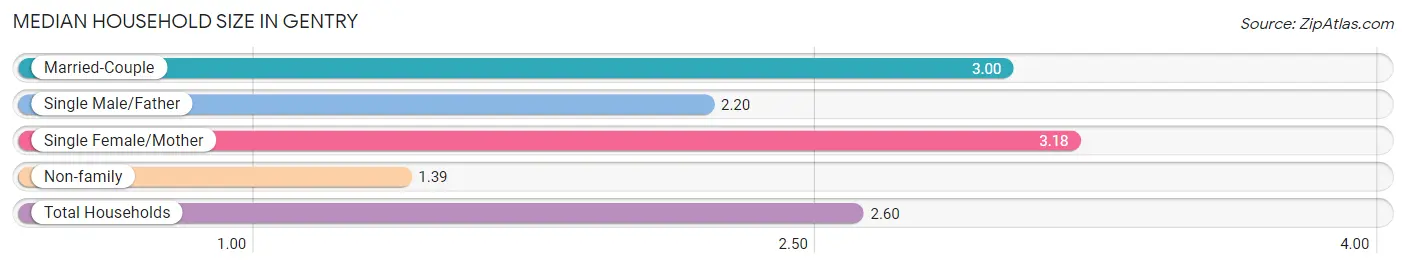
The median household size in Gentry is 2.60 persons per household, with single female/mother households (236 | 15.7%) accounting for the largest median household size of 3.18 persons per household. non-family households (348 | 23.1%) represent the smallest median household size with 1.39 persons per household.
| Household Type | # Households | Household Size |
| Married-Couple | 817 (54.3%) | 3.00 |
| Single Male/Father | 104 (6.9%) | 2.20 |
| Single Female/Mother | 236 (15.7%) | 3.18 |
| Non-family | 348 (23.1%) | 1.39 |
| Total Households | 1,505 (100.0%) | 2.60 |
Household Size by Marriage Status in Gentry
Out of a total of 1,505 households in Gentry, 1,157 (76.9%) are family households, while 348 (23.1%) are nonfamily households. The most numerous type of family households are 2-person households, comprising 542, and the most common type of nonfamily households are 1-person households, comprising 290.
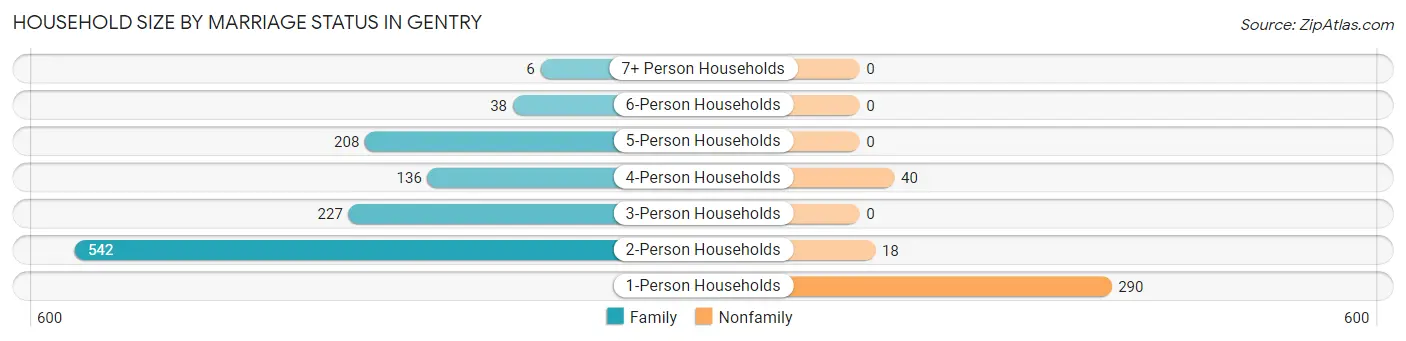
| Household Size | Family Households | Nonfamily Households |
| 1-Person Households | - | 290 (19.3%) |
| 2-Person Households | 542 (36.0%) | 18 (1.2%) |
| 3-Person Households | 227 (15.1%) | 0 (0.0%) |
| 4-Person Households | 136 (9.0%) | 40 (2.7%) |
| 5-Person Households | 208 (13.8%) | 0 (0.0%) |
| 6-Person Households | 38 (2.5%) | 0 (0.0%) |
| 7+ Person Households | 6 (0.4%) | 0 (0.0%) |
| Total | 1,157 (76.9%) | 348 (23.1%) |
Female Fertility in Gentry
Fertility by Age in Gentry
Average fertility rate in Gentry is 65.0 births per 1,000 women. Women in the age bracket of 20 to 34 years have the highest fertility rate with 98.0 births per 1,000 women. Women in the age bracket of 20 to 34 years acount for 82.5% of all women with births.
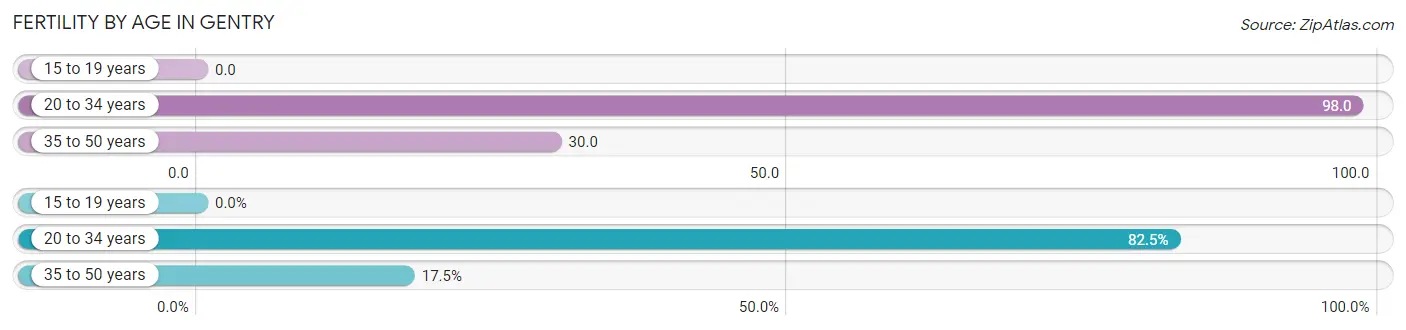
| Age Bracket | Women with Births | Births / 1,000 Women |
| 15 to 19 years | 0 (0.0%) | 0.0 |
| 20 to 34 years | 47 (82.5%) | 98.0 |
| 35 to 50 years | 10 (17.5%) | 30.0 |
| Total | 57 (100.0%) | 65.0 |
Fertility by Age by Marriage Status in Gentry
87.7% of women with births (57) in Gentry are married. The highest percentage of unmarried women with births falls into 20 to 34 years age bracket with 14.9% of them unmarried at the time of birth, while the lowest percentage of unmarried women with births belong to 35 to 50 years age bracket with 0.0% of them unmarried.
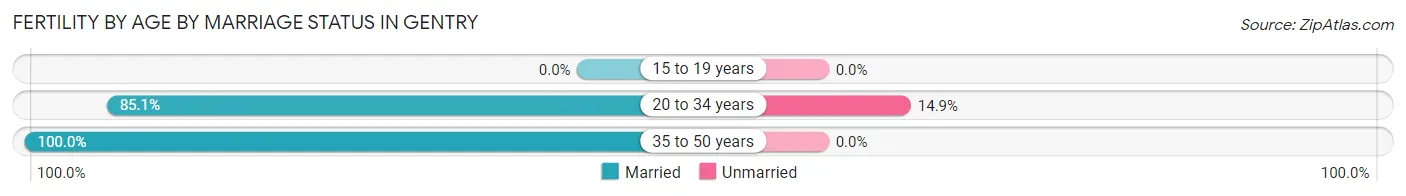
| Age Bracket | Married | Unmarried |
| 15 to 19 years | 0 (0.0%) | 0 (0.0%) |
| 20 to 34 years | 40 (85.1%) | 7 (14.9%) |
| 35 to 50 years | 10 (100.0%) | 0 (0.0%) |
| Total | 50 (87.7%) | 7 (12.3%) |
Fertility by Education in Gentry
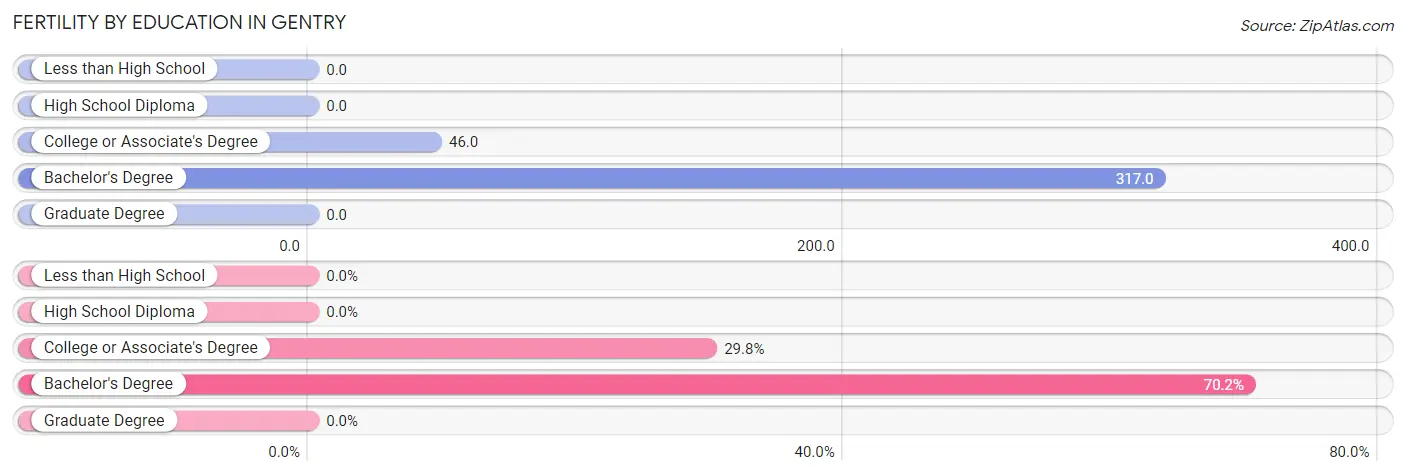
| Educational Attainment | Women with Births | Births / 1,000 Women |
| Less than High School | 0 (0.0%) | 0.0 |
| High School Diploma | 0 (0.0%) | 0.0 |
| College or Associate's Degree | 17 (29.8%) | 46.0 |
| Bachelor's Degree | 40 (70.2%) | 317.0 |
| Graduate Degree | 0 (0.0%) | 0.0 |
| Total | 57 (100.0%) | 65.0 |
Fertility by Education by Marriage Status in Gentry
12.3% of women with births in Gentry are unmarried. Women with the educational attainment of bachelor's degree are most likely to be married with 100.0% of them married at childbirth, while women with the educational attainment of college or associate's degree are least likely to be married with 41.2% of them unmarried at childbirth.
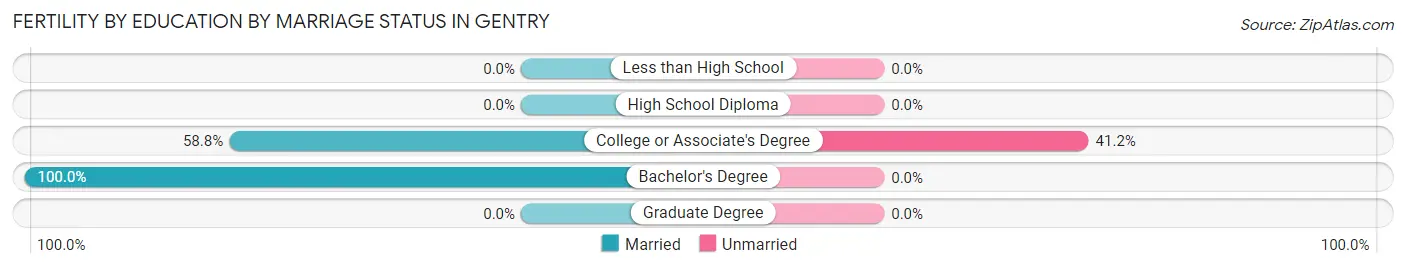
| Educational Attainment | Married | Unmarried |
| Less than High School | 0 (0.0%) | 0 (0.0%) |
| High School Diploma | 0 (0.0%) | 0 (0.0%) |
| College or Associate's Degree | 10 (58.8%) | 7 (41.2%) |
| Bachelor's Degree | 40 (100.0%) | 0 (0.0%) |
| Graduate Degree | 0 (0.0%) | 0 (0.0%) |
| Total | 50 (87.7%) | 7 (12.3%) |
Employment Characteristics in Gentry
Employment by Class of Employer in Gentry
Among the 1,847 employed individuals in Gentry, private company employees (1,288 | 69.7%), not-for-profit organizations (295 | 16.0%), and self-employed (not incorporated) (192 | 10.4%) make up the most common classes of employment.
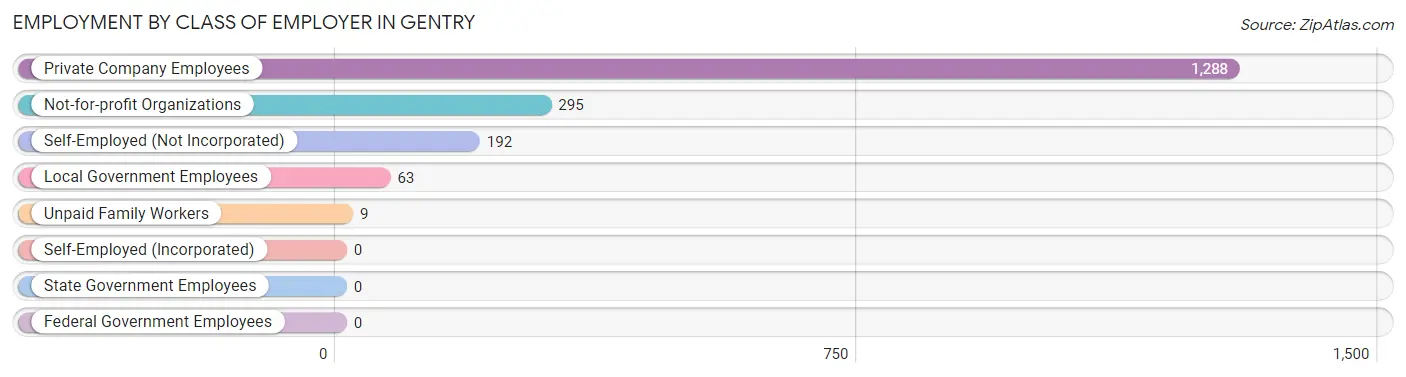
| Employer Class | # Employees | % Employees |
| Private Company Employees | 1,288 | 69.7% |
| Self-Employed (Incorporated) | 0 | 0.0% |
| Self-Employed (Not Incorporated) | 192 | 10.4% |
| Not-for-profit Organizations | 295 | 16.0% |
| Local Government Employees | 63 | 3.4% |
| State Government Employees | 0 | 0.0% |
| Federal Government Employees | 0 | 0.0% |
| Unpaid Family Workers | 9 | 0.5% |
| Total | 1,847 | 100.0% |
Employment Status by Age in Gentry
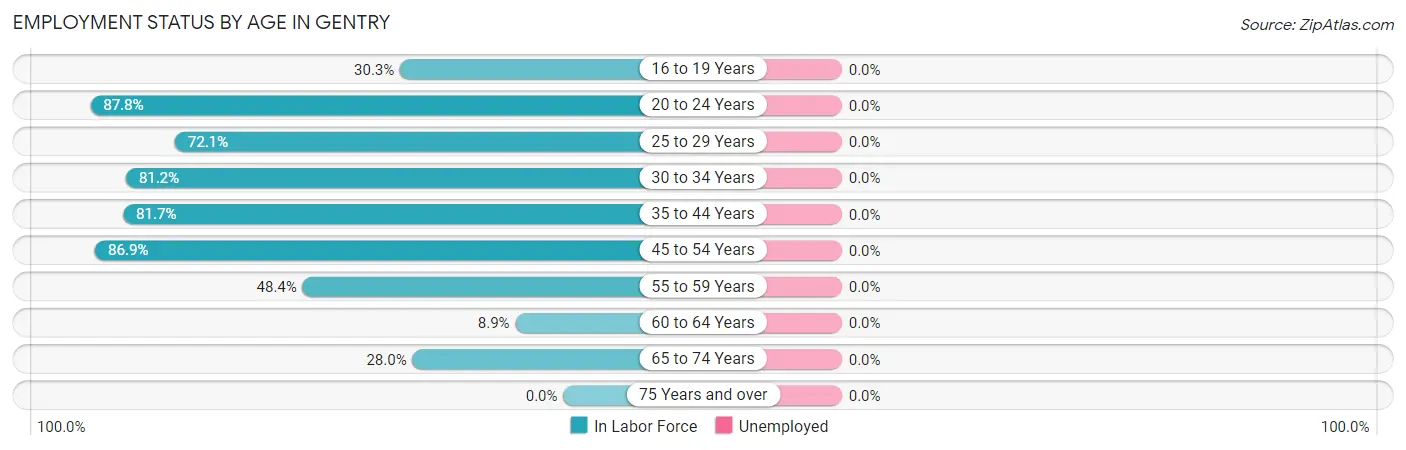
| Age Bracket | In Labor Force | Unemployed |
| 16 to 19 Years | 64 (30.3%) | 0 (0.0%) |
| 20 to 24 Years | 252 (87.8%) | 0 (0.0%) |
| 25 to 29 Years | 227 (72.1%) | 0 (0.0%) |
| 30 to 34 Years | 289 (81.2%) | 0 (0.0%) |
| 35 to 44 Years | 316 (81.7%) | 0 (0.0%) |
| 45 to 54 Years | 485 (86.9%) | 0 (0.0%) |
| 55 to 59 Years | 92 (48.4%) | 0 (0.0%) |
| 60 to 64 Years | 16 (8.9%) | 0 (0.0%) |
| 65 to 74 Years | 106 (28.0%) | 0 (0.0%) |
| 75 Years and over | 0 (0.0%) | 0 (0.0%) |
| Total | 1,847 (59.1%) | 0 (0.0%) |
Employment Status by Educational Attainment in Gentry
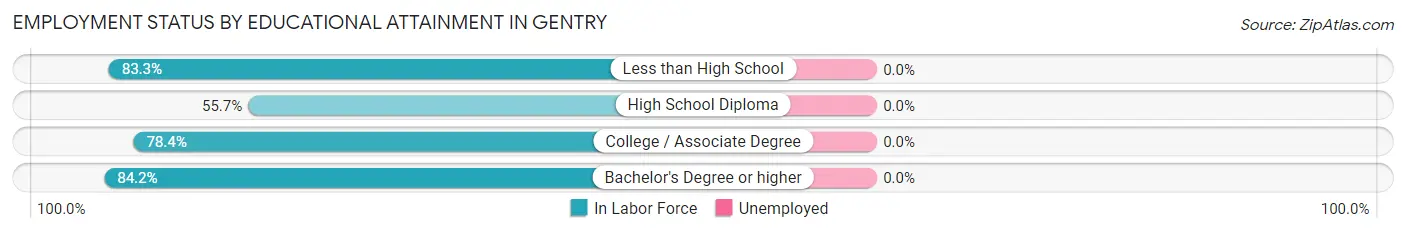
| Educational Attainment | In Labor Force | Unemployed |
| Less than High School | 205 (83.3%) | 0 (0.0%) |
| High School Diploma | 413 (55.7%) | 0 (0.0%) |
| College / Associate Degree | 454 (78.4%) | 0 (0.0%) |
| Bachelor's Degree or higher | 353 (84.2%) | 0 (0.0%) |
| Total | 1,426 (71.8%) | 0 (0.0%) |
Employment Occupations by Sex in Gentry
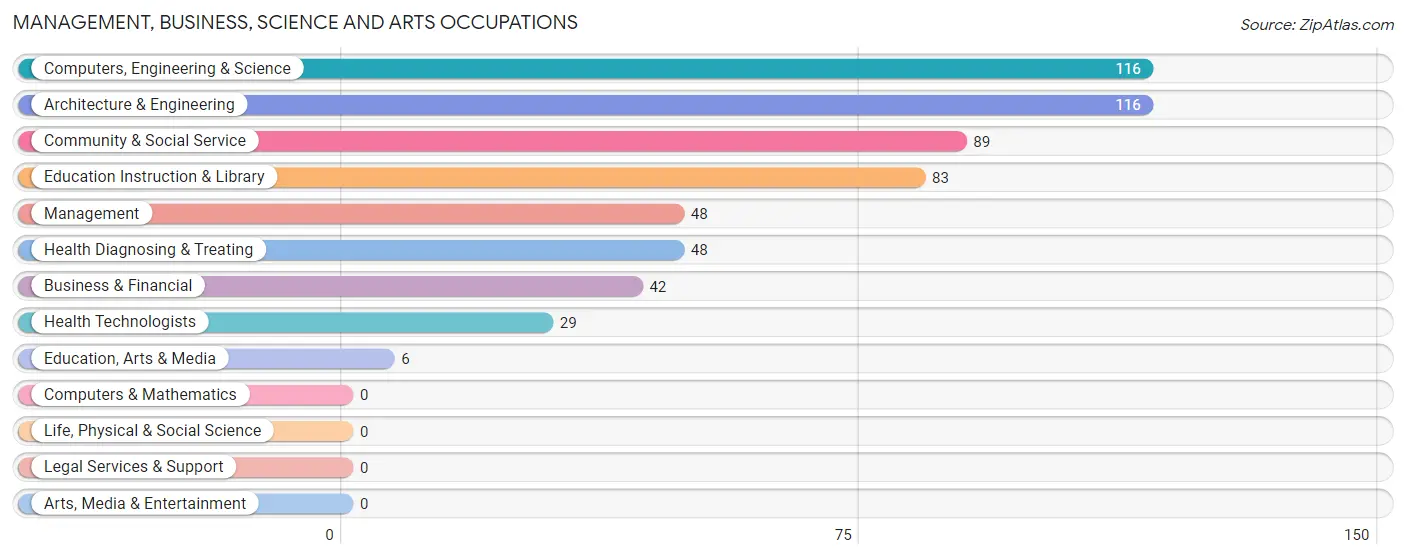
Management, Business, Science and Arts Occupations
The most common Management, Business, Science and Arts occupations in Gentry are Computers, Engineering & Science (116 | 6.3%), Architecture & Engineering (116 | 6.3%), Community & Social Service (89 | 4.8%), Education Instruction & Library (83 | 4.5%), and Management (48 | 2.6%).
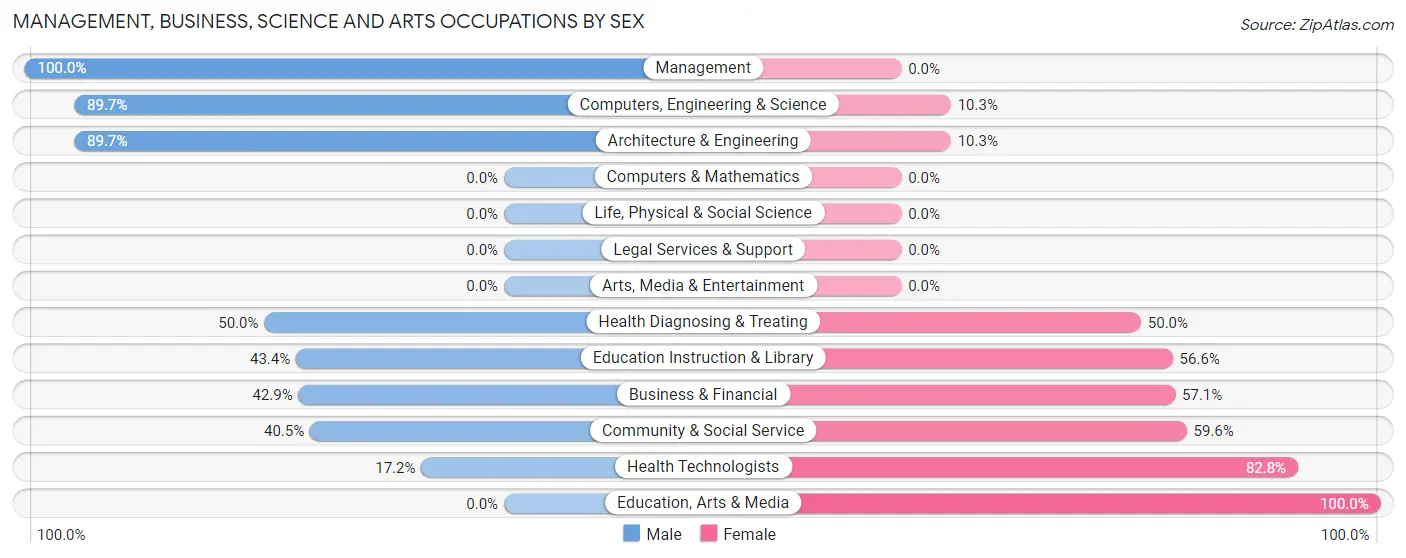
Management, Business, Science and Arts Occupations by Sex
Within the Management, Business, Science and Arts occupations in Gentry, the most male-oriented occupations are Management (100.0%), Computers, Engineering & Science (89.7%), and Architecture & Engineering (89.7%), while the most female-oriented occupations are Education, Arts & Media (100.0%), Health Technologists (82.8%), and Community & Social Service (59.6%).
| Occupation | Male | Female |
| Management | 48 (100.0%) | 0 (0.0%) |
| Business & Financial | 18 (42.9%) | 24 (57.1%) |
| Computers, Engineering & Science | 104 (89.7%) | 12 (10.3%) |
| Computers & Mathematics | 0 (0.0%) | 0 (0.0%) |
| Architecture & Engineering | 104 (89.7%) | 12 (10.3%) |
| Life, Physical & Social Science | 0 (0.0%) | 0 (0.0%) |
| Community & Social Service | 36 (40.5%) | 53 (59.6%) |
| Education, Arts & Media | 0 (0.0%) | 6 (100.0%) |
| Legal Services & Support | 0 (0.0%) | 0 (0.0%) |
| Education Instruction & Library | 36 (43.4%) | 47 (56.6%) |
| Arts, Media & Entertainment | 0 (0.0%) | 0 (0.0%) |
| Health Diagnosing & Treating | 24 (50.0%) | 24 (50.0%) |
| Health Technologists | 5 (17.2%) | 24 (82.8%) |
| Total (Category) | 230 (67.1%) | 113 (32.9%) |
| Total (Overall) | 1,056 (57.2%) | 791 (42.8%) |
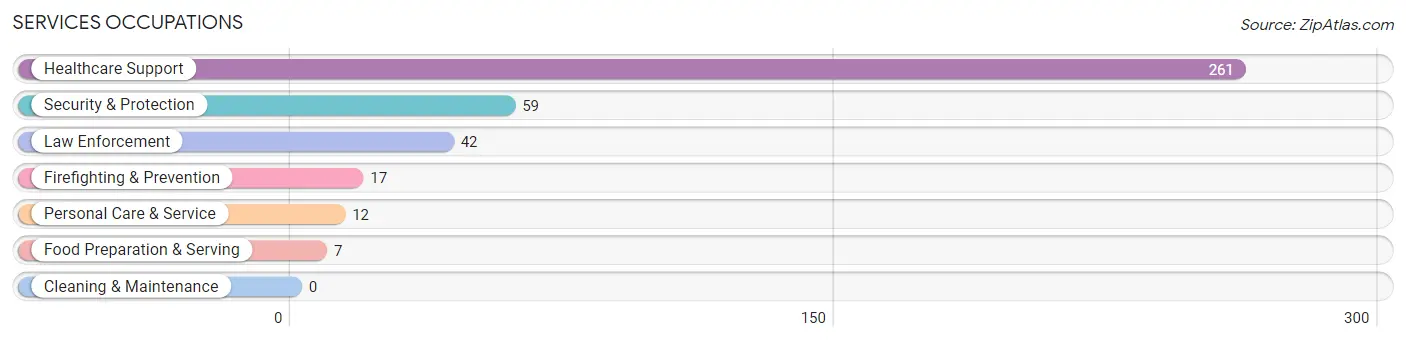
Services Occupations
The most common Services occupations in Gentry are Healthcare Support (261 | 14.1%), Security & Protection (59 | 3.2%), Law Enforcement (42 | 2.3%), Firefighting & Prevention (17 | 0.9%), and Personal Care & Service (12 | 0.6%).
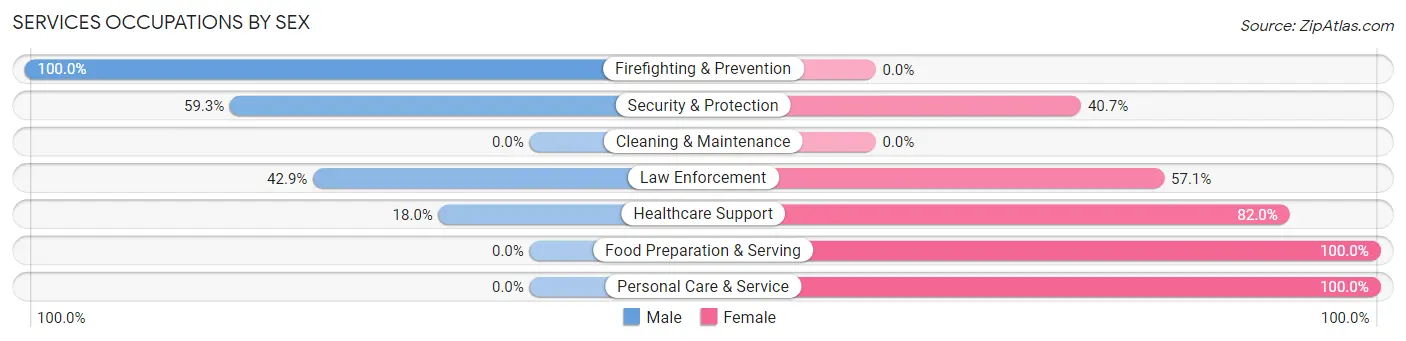
Services Occupations by Sex
Within the Services occupations in Gentry, the most male-oriented occupations are Firefighting & Prevention (100.0%), Security & Protection (59.3%), and Law Enforcement (42.9%), while the most female-oriented occupations are Food Preparation & Serving (100.0%), Personal Care & Service (100.0%), and Healthcare Support (82.0%).
| Occupation | Male | Female |
| Healthcare Support | 47 (18.0%) | 214 (82.0%) |
| Security & Protection | 35 (59.3%) | 24 (40.7%) |
| Firefighting & Prevention | 17 (100.0%) | 0 (0.0%) |
| Law Enforcement | 18 (42.9%) | 24 (57.1%) |
| Food Preparation & Serving | 0 (0.0%) | 7 (100.0%) |
| Cleaning & Maintenance | 0 (0.0%) | 0 (0.0%) |
| Personal Care & Service | 0 (0.0%) | 12 (100.0%) |
| Total (Category) | 82 (24.2%) | 257 (75.8%) |
| Total (Overall) | 1,056 (57.2%) | 791 (42.8%) |
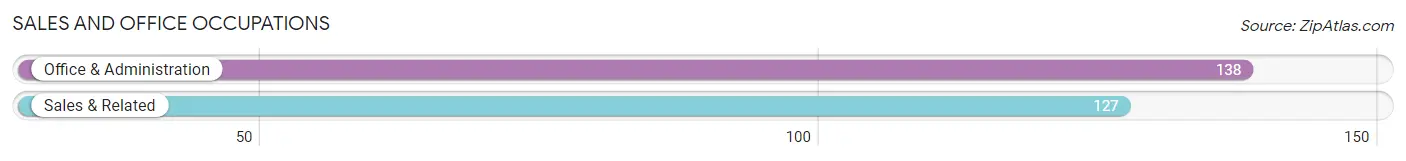
Sales and Office Occupations
The most common Sales and Office occupations in Gentry are Office & Administration (138 | 7.5%), and Sales & Related (127 | 6.9%).
Sales and Office Occupations by Sex
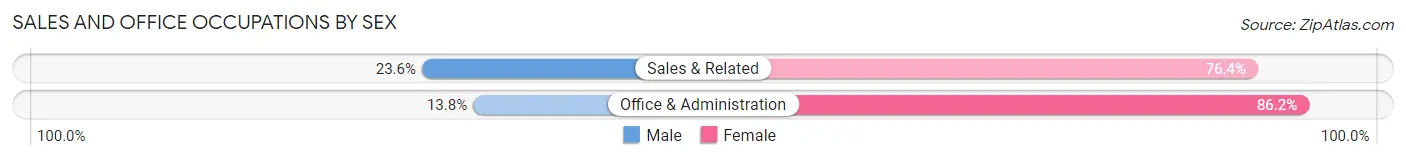
| Occupation | Male | Female |
| Sales & Related | 30 (23.6%) | 97 (76.4%) |
| Office & Administration | 19 (13.8%) | 119 (86.2%) |
| Total (Category) | 49 (18.5%) | 216 (81.5%) |
| Total (Overall) | 1,056 (57.2%) | 791 (42.8%) |
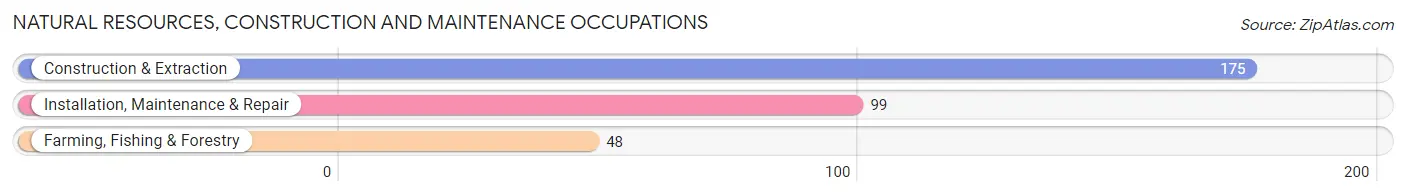
Natural Resources, Construction and Maintenance Occupations
The most common Natural Resources, Construction and Maintenance occupations in Gentry are Construction & Extraction (175 | 9.5%), Installation, Maintenance & Repair (99 | 5.4%), and Farming, Fishing & Forestry (48 | 2.6%).
Natural Resources, Construction and Maintenance Occupations by Sex
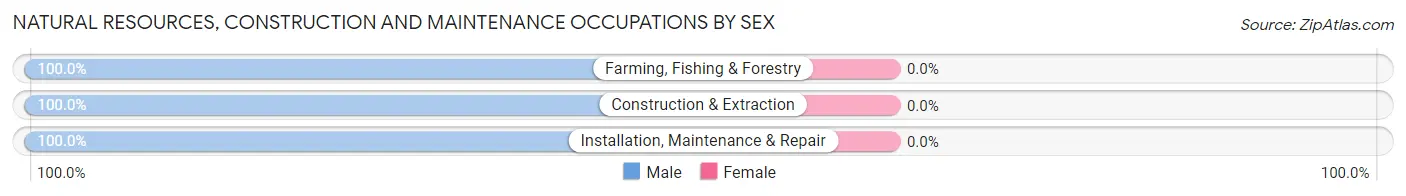
| Occupation | Male | Female |
| Farming, Fishing & Forestry | 48 (100.0%) | 0 (0.0%) |
| Construction & Extraction | 175 (100.0%) | 0 (0.0%) |
| Installation, Maintenance & Repair | 99 (100.0%) | 0 (0.0%) |
| Total (Category) | 322 (100.0%) | 0 (0.0%) |
| Total (Overall) | 1,056 (57.2%) | 791 (42.8%) |
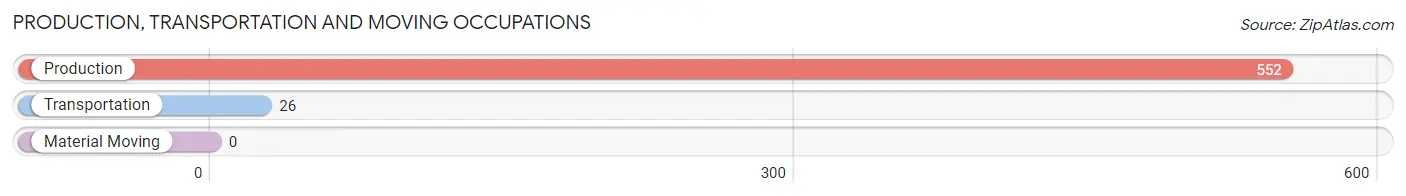
Production, Transportation and Moving Occupations
The most common Production, Transportation and Moving occupations in Gentry are Production (552 | 29.9%), and Transportation (26 | 1.4%).
Production, Transportation and Moving Occupations by Sex
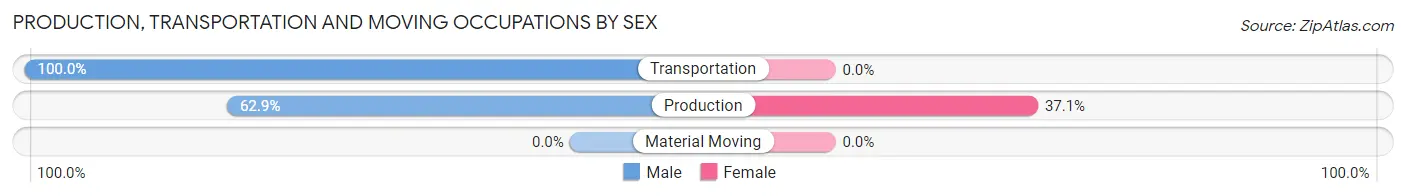
| Occupation | Male | Female |
| Production | 347 (62.9%) | 205 (37.1%) |
| Transportation | 26 (100.0%) | 0 (0.0%) |
| Material Moving | 0 (0.0%) | 0 (0.0%) |
| Total (Category) | 373 (64.5%) | 205 (35.5%) |
| Total (Overall) | 1,056 (57.2%) | 791 (42.8%) |
Employment Industries by Sex in Gentry
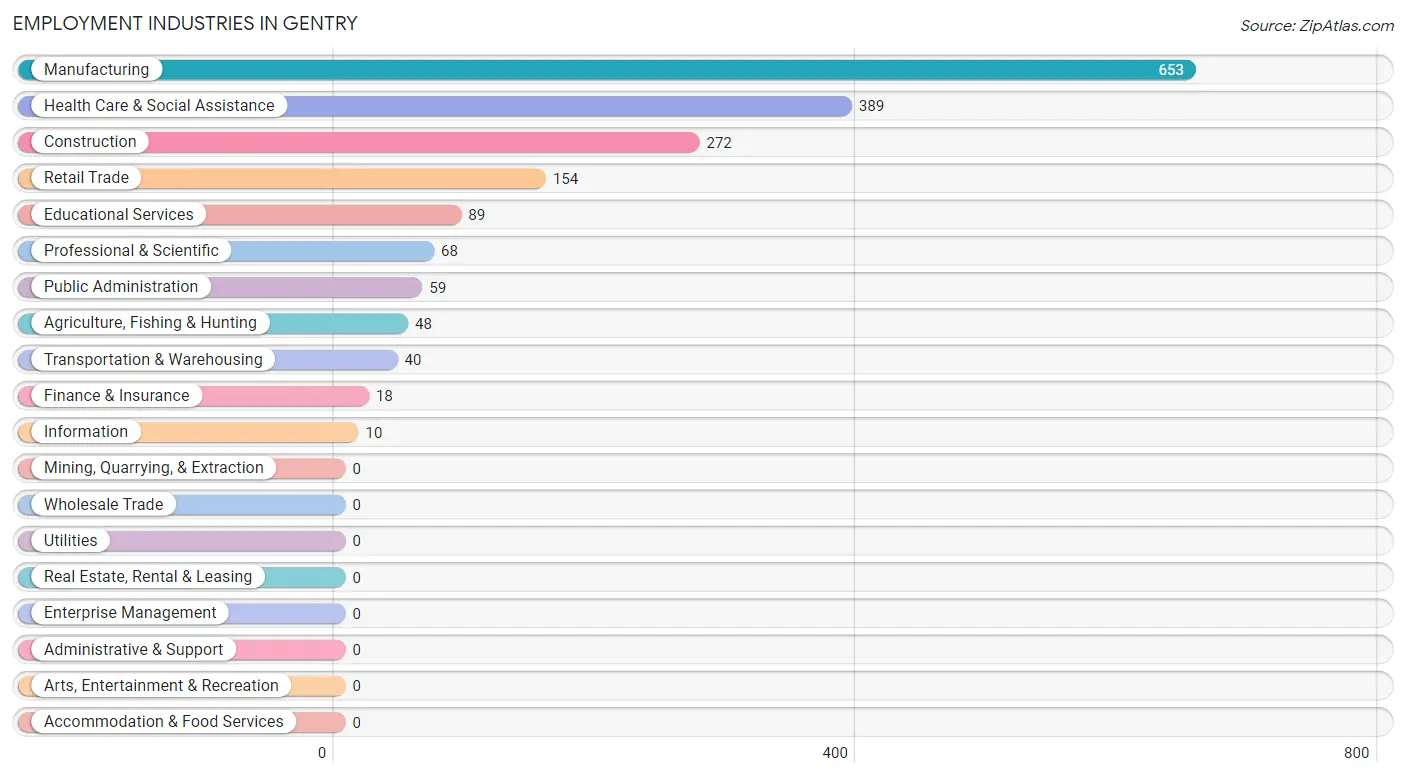
Employment Industries in Gentry
The major employment industries in Gentry include Manufacturing (653 | 35.3%), Health Care & Social Assistance (389 | 21.1%), Construction (272 | 14.7%), Retail Trade (154 | 8.3%), and Educational Services (89 | 4.8%).
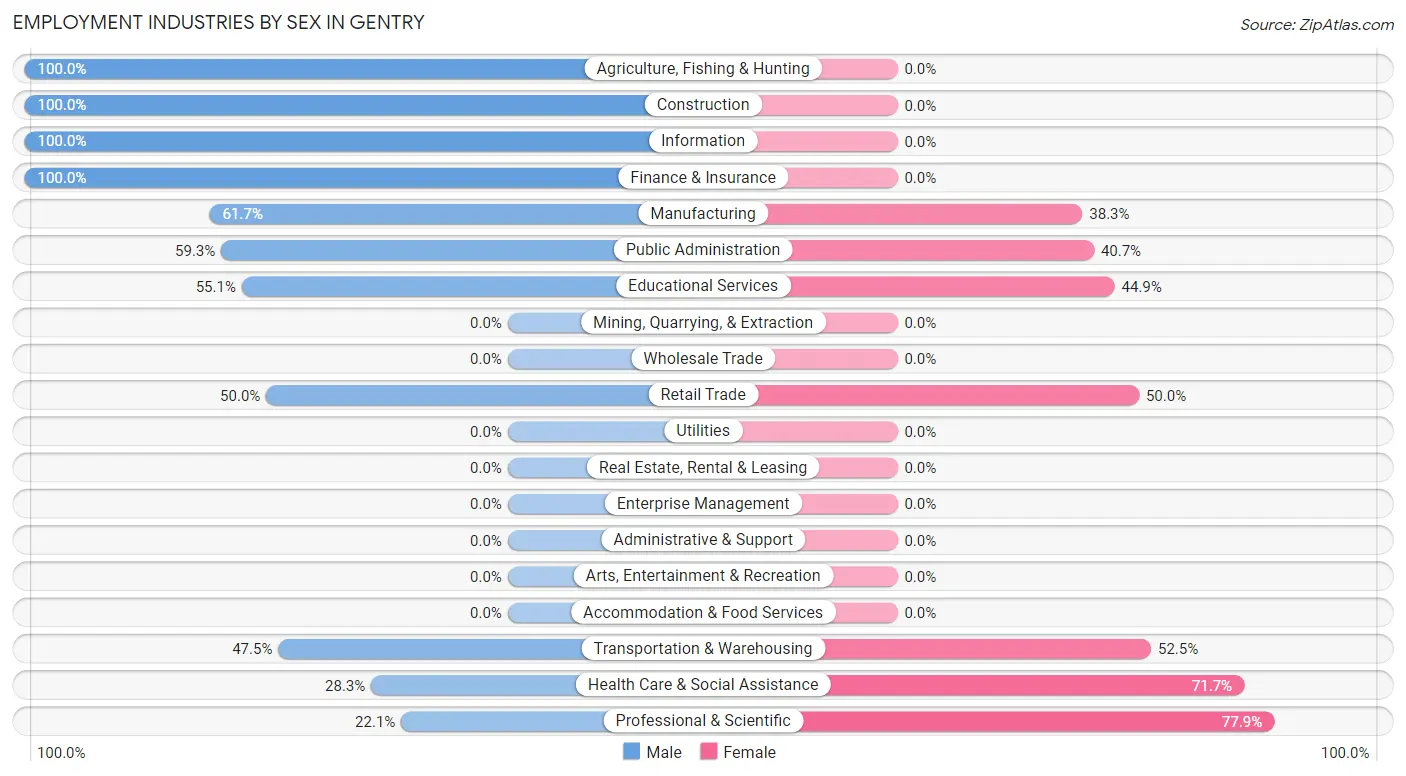
Employment Industries by Sex in Gentry
The Gentry industries that see more men than women are Agriculture, Fishing & Hunting (100.0%), Construction (100.0%), and Information (100.0%), whereas the industries that tend to have a higher number of women are Professional & Scientific (77.9%), Health Care & Social Assistance (71.7%), and Transportation & Warehousing (52.5%).
| Industry | Male | Female |
| Agriculture, Fishing & Hunting | 48 (100.0%) | 0 (0.0%) |
| Mining, Quarrying, & Extraction | 0 (0.0%) | 0 (0.0%) |
| Construction | 272 (100.0%) | 0 (0.0%) |
| Manufacturing | 403 (61.7%) | 250 (38.3%) |
| Wholesale Trade | 0 (0.0%) | 0 (0.0%) |
| Retail Trade | 77 (50.0%) | 77 (50.0%) |
| Transportation & Warehousing | 19 (47.5%) | 21 (52.5%) |
| Utilities | 0 (0.0%) | 0 (0.0%) |
| Information | 10 (100.0%) | 0 (0.0%) |
| Finance & Insurance | 18 (100.0%) | 0 (0.0%) |
| Real Estate, Rental & Leasing | 0 (0.0%) | 0 (0.0%) |
| Professional & Scientific | 15 (22.1%) | 53 (77.9%) |
| Enterprise Management | 0 (0.0%) | 0 (0.0%) |
| Administrative & Support | 0 (0.0%) | 0 (0.0%) |
| Educational Services | 49 (55.1%) | 40 (44.9%) |
| Health Care & Social Assistance | 110 (28.3%) | 279 (71.7%) |
| Arts, Entertainment & Recreation | 0 (0.0%) | 0 (0.0%) |
| Accommodation & Food Services | 0 (0.0%) | 0 (0.0%) |
| Public Administration | 35 (59.3%) | 24 (40.7%) |
| Total | 1,056 (57.2%) | 791 (42.8%) |
Education in Gentry
School Enrollment in Gentry
The most common levels of schooling among the 699 students in Gentry are middle school (241 | 34.5%), elementary school (200 | 28.6%), and high school (130 | 18.6%).
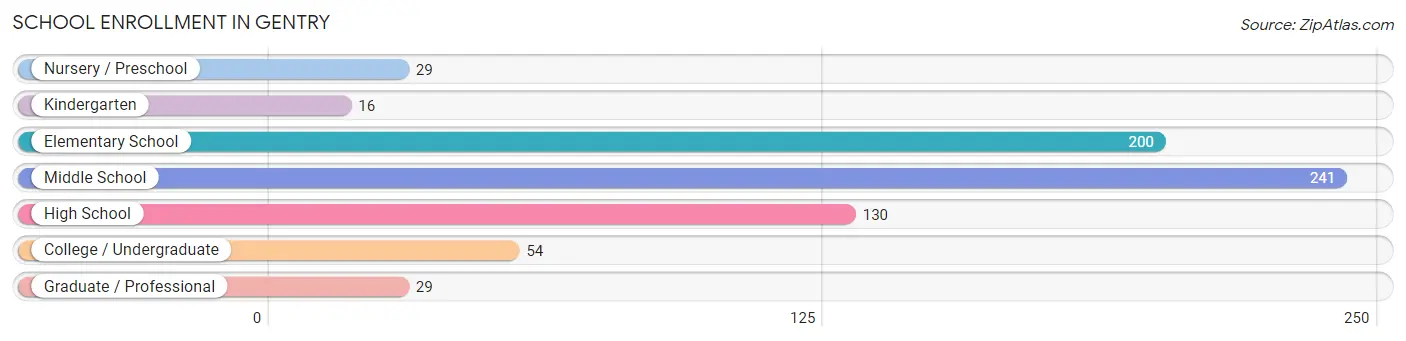
| School Level | # Students | % Students |
| Nursery / Preschool | 29 | 4.2% |
| Kindergarten | 16 | 2.3% |
| Elementary School | 200 | 28.6% |
| Middle School | 241 | 34.5% |
| High School | 130 | 18.6% |
| College / Undergraduate | 54 | 7.7% |
| Graduate / Professional | 29 | 4.2% |
| Total | 699 | 100.0% |
School Enrollment by Age by Funding Source in Gentry
Out of a total of 699 students who are enrolled in schools in Gentry, 155 (22.2%) attend a private institution, while the remaining 544 (77.8%) are enrolled in public schools. The age group of 3 to 4 year olds has the highest likelihood of being enrolled in private schools, with 7 (100.0% in the age bracket) enrolled. Conversely, the age group of 25 to 34 year olds has the lowest likelihood of being enrolled in a private school, with 31 (100.0% in the age bracket) attending a public institution.
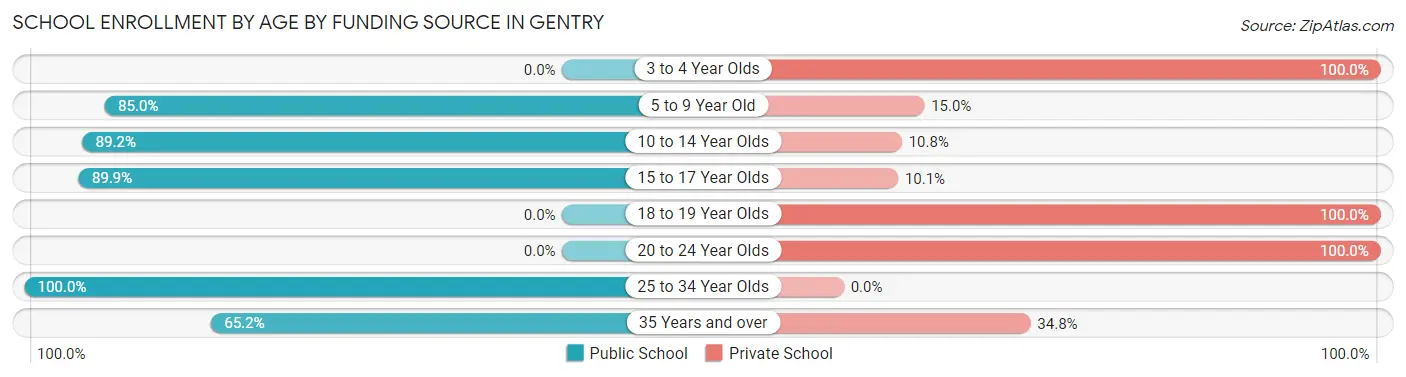
| Age Bracket | Public School | Private School |
| 3 to 4 Year Olds | 0 (0.0%) | 7 (100.0%) |
| 5 to 9 Year Old | 187 (85.0%) | 33 (15.0%) |
| 10 to 14 Year Olds | 231 (89.2%) | 28 (10.8%) |
| 15 to 17 Year Olds | 80 (89.9%) | 9 (10.1%) |
| 18 to 19 Year Olds | 0 (0.0%) | 41 (100.0%) |
| 20 to 24 Year Olds | 0 (0.0%) | 29 (100.0%) |
| 25 to 34 Year Olds | 31 (100.0%) | 0 (0.0%) |
| 35 Years and over | 15 (65.2%) | 8 (34.8%) |
| Total | 544 (77.8%) | 155 (22.2%) |
Educational Attainment by Field of Study in Gentry
Bio, nature & agricultural (116 | 23.2%), science & technology (113 | 22.6%), business (81 | 16.2%), visual & performing arts (52 | 10.4%), and computers & mathematics (40 | 8.0%) are the most common fields of study among 501 individuals in Gentry who have obtained a bachelor's degree or higher.
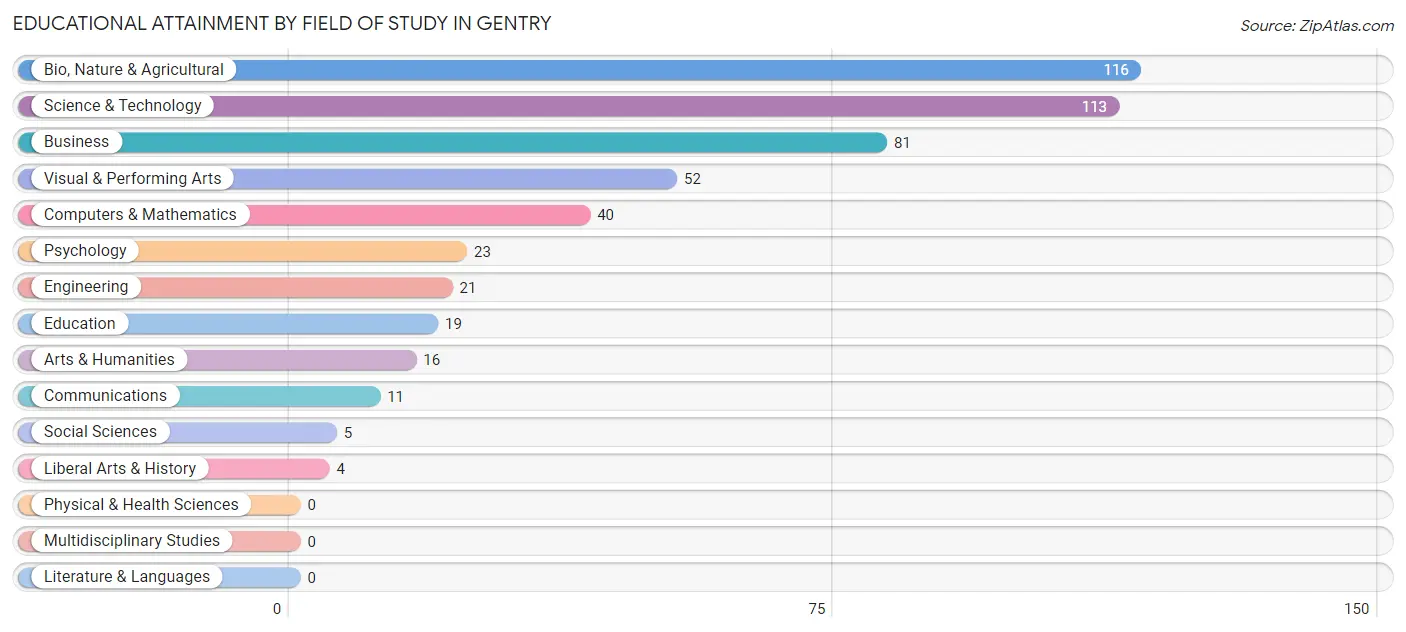
| Field of Study | # Graduates | % Graduates |
| Computers & Mathematics | 40 | 8.0% |
| Bio, Nature & Agricultural | 116 | 23.2% |
| Physical & Health Sciences | 0 | 0.0% |
| Psychology | 23 | 4.6% |
| Social Sciences | 5 | 1.0% |
| Engineering | 21 | 4.2% |
| Multidisciplinary Studies | 0 | 0.0% |
| Science & Technology | 113 | 22.6% |
| Business | 81 | 16.2% |
| Education | 19 | 3.8% |
| Literature & Languages | 0 | 0.0% |
| Liberal Arts & History | 4 | 0.8% |
| Visual & Performing Arts | 52 | 10.4% |
| Communications | 11 | 2.2% |
| Arts & Humanities | 16 | 3.2% |
| Total | 501 | 100.0% |
Transportation & Commute in Gentry
Vehicle Availability by Sex in Gentry
The most prevalent vehicle ownership categories in Gentry are males with 2 vehicles (423, accounting for 40.1%) and females with 2 vehicles (348, making up 53.5%).
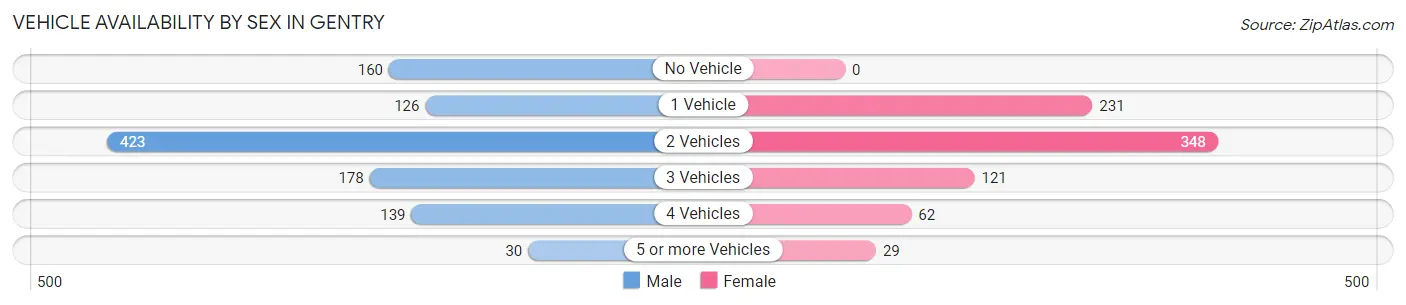
| Vehicles Available | Male | Female |
| No Vehicle | 160 (15.1%) | 0 (0.0%) |
| 1 Vehicle | 126 (11.9%) | 231 (29.2%) |
| 2 Vehicles | 423 (40.1%) | 348 (44.0%) |
| 3 Vehicles | 178 (16.9%) | 121 (15.3%) |
| 4 Vehicles | 139 (13.2%) | 62 (7.8%) |
| 5 or more Vehicles | 30 (2.8%) | 29 (3.7%) |
| Total | 1,056 (100.0%) | 791 (100.0%) |
Commute Time in Gentry
The most frequently occuring commute durations in Gentry are 15 to 19 minutes (373 commuters, 21.3%), 10 to 14 minutes (317 commuters, 18.1%), and 45 to 59 minutes (237 commuters, 13.5%).
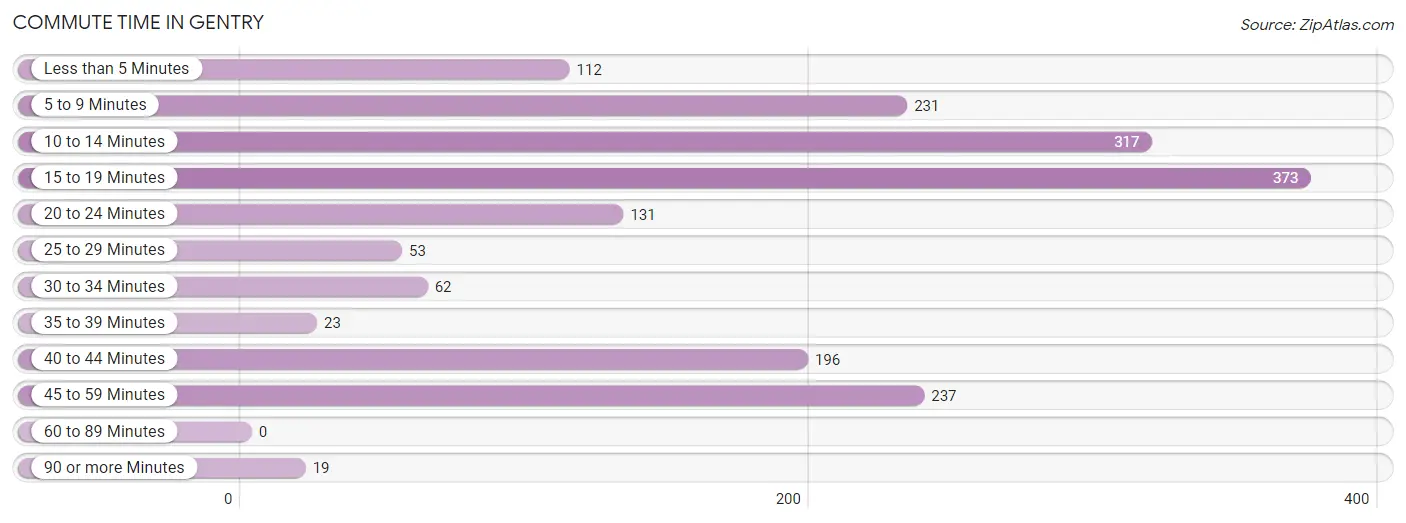
| Commute Time | # Commuters | % Commuters |
| Less than 5 Minutes | 112 | 6.4% |
| 5 to 9 Minutes | 231 | 13.2% |
| 10 to 14 Minutes | 317 | 18.1% |
| 15 to 19 Minutes | 373 | 21.3% |
| 20 to 24 Minutes | 131 | 7.5% |
| 25 to 29 Minutes | 53 | 3.0% |
| 30 to 34 Minutes | 62 | 3.5% |
| 35 to 39 Minutes | 23 | 1.3% |
| 40 to 44 Minutes | 196 | 11.2% |
| 45 to 59 Minutes | 237 | 13.5% |
| 60 to 89 Minutes | 0 | 0.0% |
| 90 or more Minutes | 19 | 1.1% |
Commute Time by Sex in Gentry
The most common commute times in Gentry are 10 to 14 minutes (252 commuters, 25.4%) for males and 15 to 19 minutes (246 commuters, 32.3%) for females.
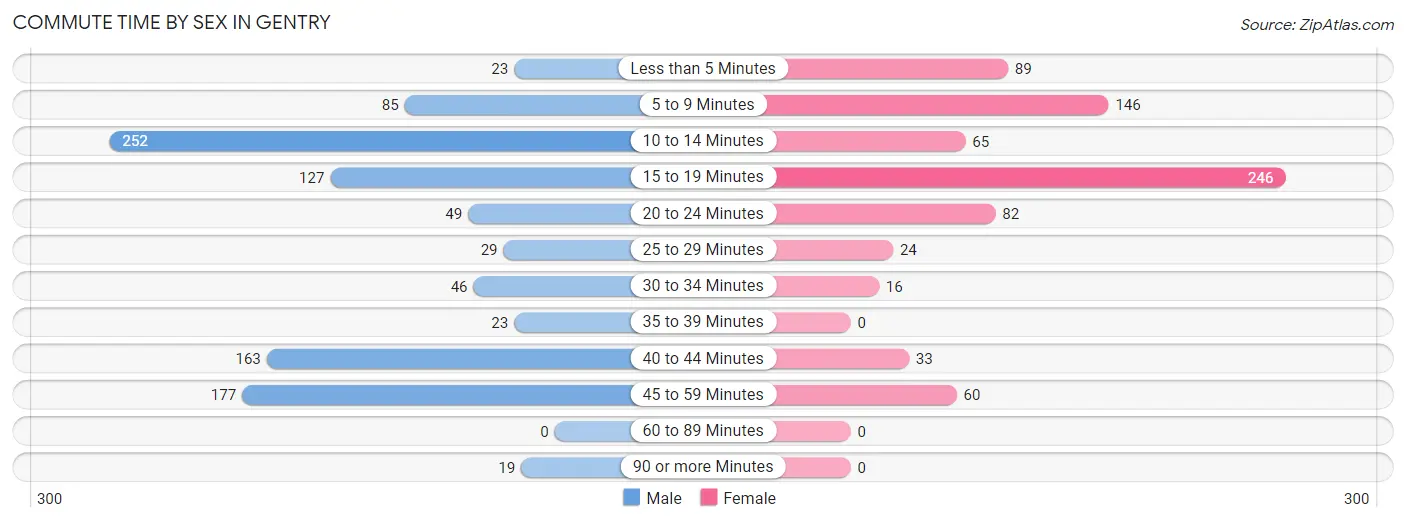
| Commute Time | Male | Female |
| Less than 5 Minutes | 23 (2.3%) | 89 (11.7%) |
| 5 to 9 Minutes | 85 (8.6%) | 146 (19.2%) |
| 10 to 14 Minutes | 252 (25.4%) | 65 (8.5%) |
| 15 to 19 Minutes | 127 (12.8%) | 246 (32.3%) |
| 20 to 24 Minutes | 49 (4.9%) | 82 (10.8%) |
| 25 to 29 Minutes | 29 (2.9%) | 24 (3.2%) |
| 30 to 34 Minutes | 46 (4.6%) | 16 (2.1%) |
| 35 to 39 Minutes | 23 (2.3%) | 0 (0.0%) |
| 40 to 44 Minutes | 163 (16.4%) | 33 (4.3%) |
| 45 to 59 Minutes | 177 (17.8%) | 60 (7.9%) |
| 60 to 89 Minutes | 0 (0.0%) | 0 (0.0%) |
| 90 or more Minutes | 19 (1.9%) | 0 (0.0%) |
Time of Departure to Work by Sex in Gentry
The most frequent times of departure to work in Gentry are 7:00 AM to 7:29 AM (406, 40.9%) for males and 7:00 AM to 7:29 AM (222, 29.2%) for females.
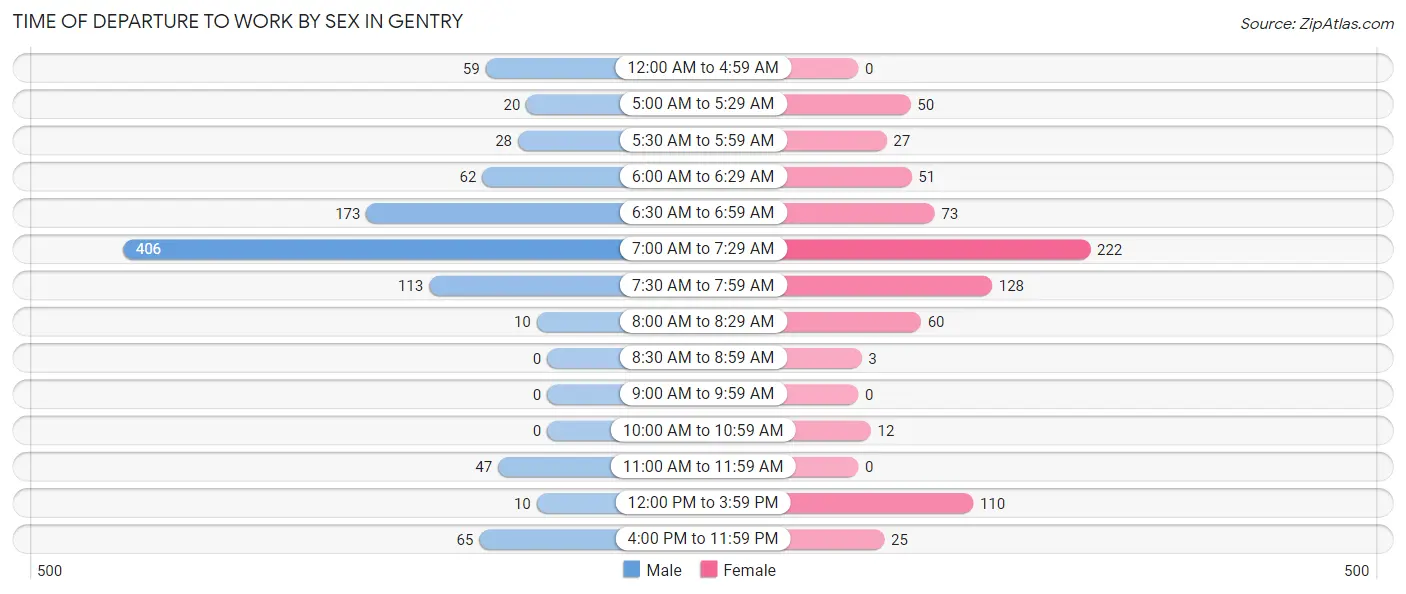
| Time of Departure | Male | Female |
| 12:00 AM to 4:59 AM | 59 (5.9%) | 0 (0.0%) |
| 5:00 AM to 5:29 AM | 20 (2.0%) | 50 (6.6%) |
| 5:30 AM to 5:59 AM | 28 (2.8%) | 27 (3.5%) |
| 6:00 AM to 6:29 AM | 62 (6.2%) | 51 (6.7%) |
| 6:30 AM to 6:59 AM | 173 (17.4%) | 73 (9.6%) |
| 7:00 AM to 7:29 AM | 406 (40.9%) | 222 (29.2%) |
| 7:30 AM to 7:59 AM | 113 (11.4%) | 128 (16.8%) |
| 8:00 AM to 8:29 AM | 10 (1.0%) | 60 (7.9%) |
| 8:30 AM to 8:59 AM | 0 (0.0%) | 3 (0.4%) |
| 9:00 AM to 9:59 AM | 0 (0.0%) | 0 (0.0%) |
| 10:00 AM to 10:59 AM | 0 (0.0%) | 12 (1.6%) |
| 11:00 AM to 11:59 AM | 47 (4.7%) | 0 (0.0%) |
| 12:00 PM to 3:59 PM | 10 (1.0%) | 110 (14.4%) |
| 4:00 PM to 11:59 PM | 65 (6.6%) | 25 (3.3%) |
| Total | 993 (100.0%) | 761 (100.0%) |
Housing Occupancy in Gentry
Occupancy by Ownership in Gentry
Of the total 1,505 dwellings in Gentry, owner-occupied units account for 968 (64.3%), while renter-occupied units make up 537 (35.7%).
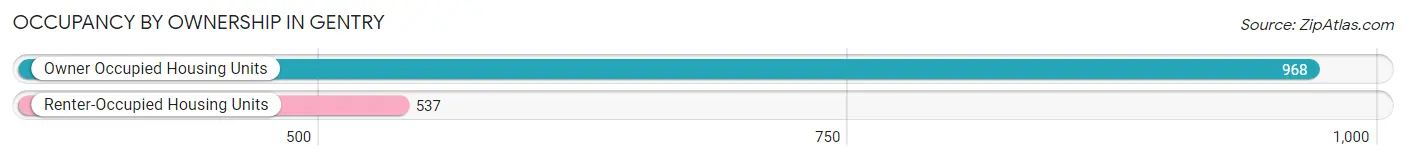
| Occupancy | # Housing Units | % Housing Units |
| Owner Occupied Housing Units | 968 | 64.3% |
| Renter-Occupied Housing Units | 537 | 35.7% |
| Total Occupied Housing Units | 1,505 | 100.0% |
Occupancy by Household Size in Gentry
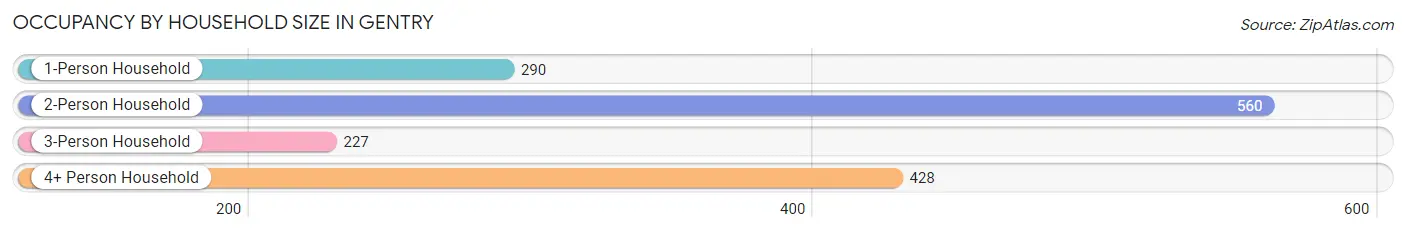
| Household Size | # Housing Units | % Housing Units |
| 1-Person Household | 290 | 19.3% |
| 2-Person Household | 560 | 37.2% |
| 3-Person Household | 227 | 15.1% |
| 4+ Person Household | 428 | 28.4% |
| Total Housing Units | 1,505 | 100.0% |
Occupancy by Ownership by Household Size in Gentry
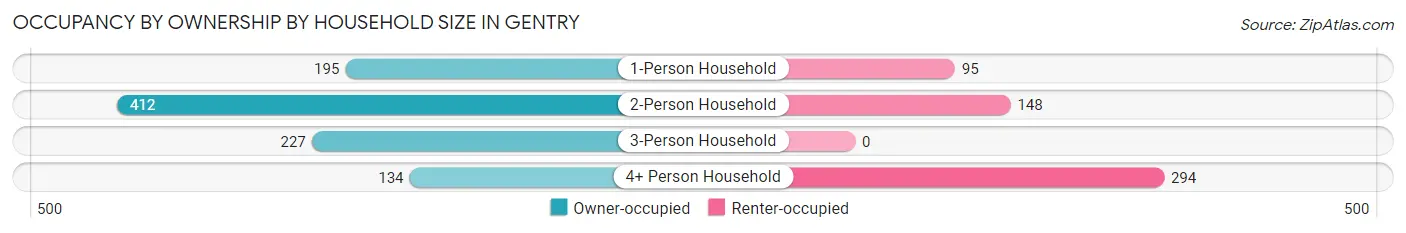
| Household Size | Owner-occupied | Renter-occupied |
| 1-Person Household | 195 (67.2%) | 95 (32.8%) |
| 2-Person Household | 412 (73.6%) | 148 (26.4%) |
| 3-Person Household | 227 (100.0%) | 0 (0.0%) |
| 4+ Person Household | 134 (31.3%) | 294 (68.7%) |
| Total Housing Units | 968 (64.3%) | 537 (35.7%) |
Occupancy by Educational Attainment in Gentry
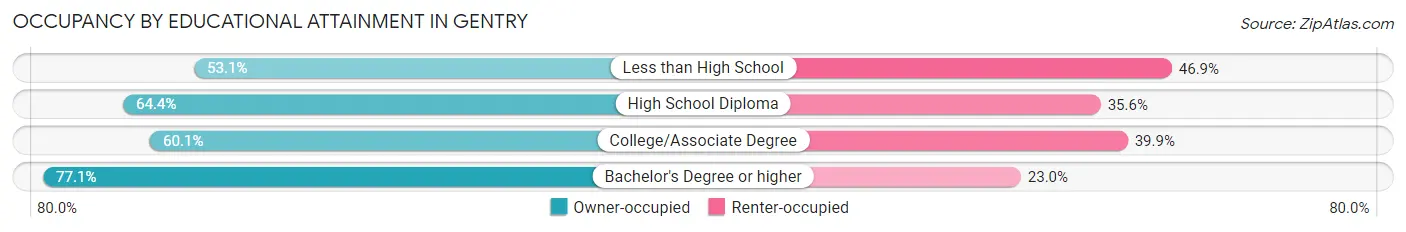
| Household Size | Owner-occupied | Renter-occupied |
| Less than High School | 60 (53.1%) | 53 (46.9%) |
| High School Diploma | 329 (64.4%) | 182 (35.6%) |
| College/Associate Degree | 354 (60.1%) | 235 (39.9%) |
| Bachelor's Degree or higher | 225 (77.0%) | 67 (23.0%) |
Occupancy by Age of Householder in Gentry
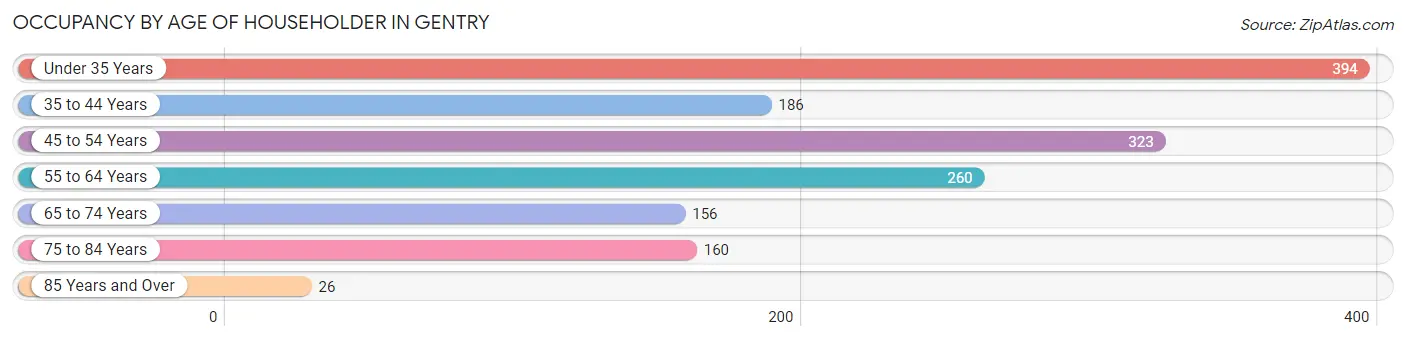
| Age Bracket | # Households | % Households |
| Under 35 Years | 394 | 26.2% |
| 35 to 44 Years | 186 | 12.4% |
| 45 to 54 Years | 323 | 21.5% |
| 55 to 64 Years | 260 | 17.3% |
| 65 to 74 Years | 156 | 10.4% |
| 75 to 84 Years | 160 | 10.6% |
| 85 Years and Over | 26 | 1.7% |
| Total | 1,505 | 100.0% |
Housing Finances in Gentry
Median Income by Occupancy in Gentry
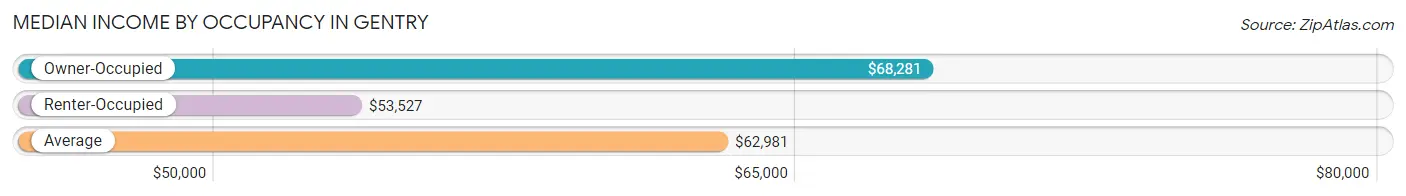
| Occupancy Type | # Households | Median Income |
| Owner-Occupied | 968 (64.3%) | $68,281 |
| Renter-Occupied | 537 (35.7%) | $53,527 |
| Average | 1,505 (100.0%) | $62,981 |
Occupancy by Householder Income Bracket in Gentry
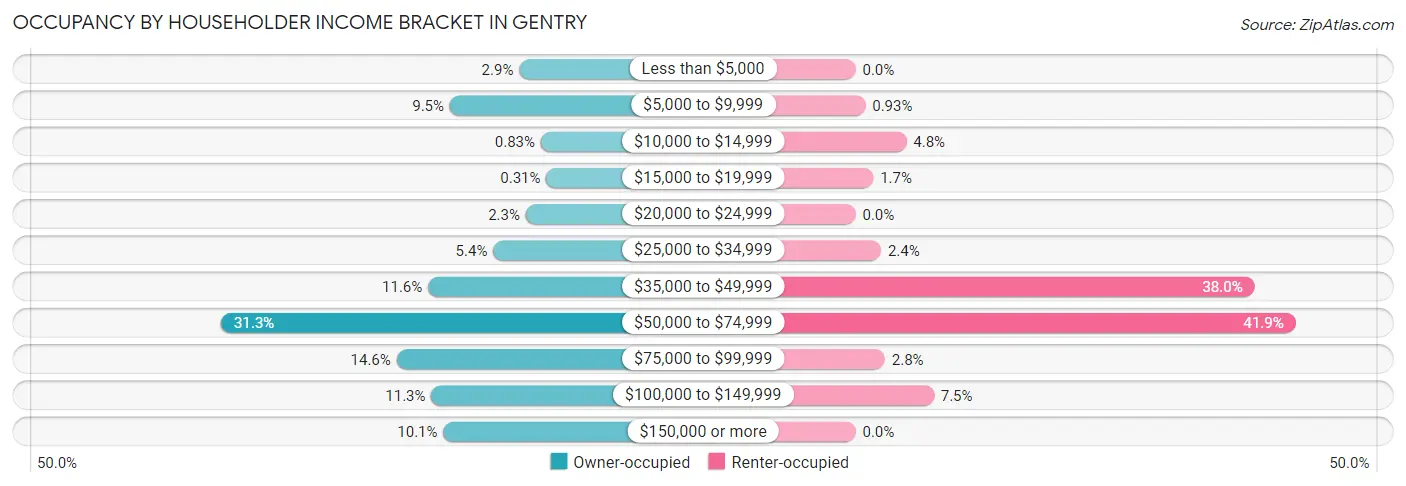
| Income Bracket | Owner-occupied | Renter-occupied |
| Less than $5,000 | 28 (2.9%) | 0 (0.0%) |
| $5,000 to $9,999 | 92 (9.5%) | 5 (0.9%) |
| $10,000 to $14,999 | 8 (0.8%) | 26 (4.8%) |
| $15,000 to $19,999 | 3 (0.3%) | 9 (1.7%) |
| $20,000 to $24,999 | 22 (2.3%) | 0 (0.0%) |
| $25,000 to $34,999 | 52 (5.4%) | 13 (2.4%) |
| $35,000 to $49,999 | 112 (11.6%) | 204 (38.0%) |
| $50,000 to $74,999 | 303 (31.3%) | 225 (41.9%) |
| $75,000 to $99,999 | 141 (14.6%) | 15 (2.8%) |
| $100,000 to $149,999 | 109 (11.3%) | 40 (7.4%) |
| $150,000 or more | 98 (10.1%) | 0 (0.0%) |
| Total | 968 (100.0%) | 537 (100.0%) |
Monthly Housing Cost Tiers in Gentry
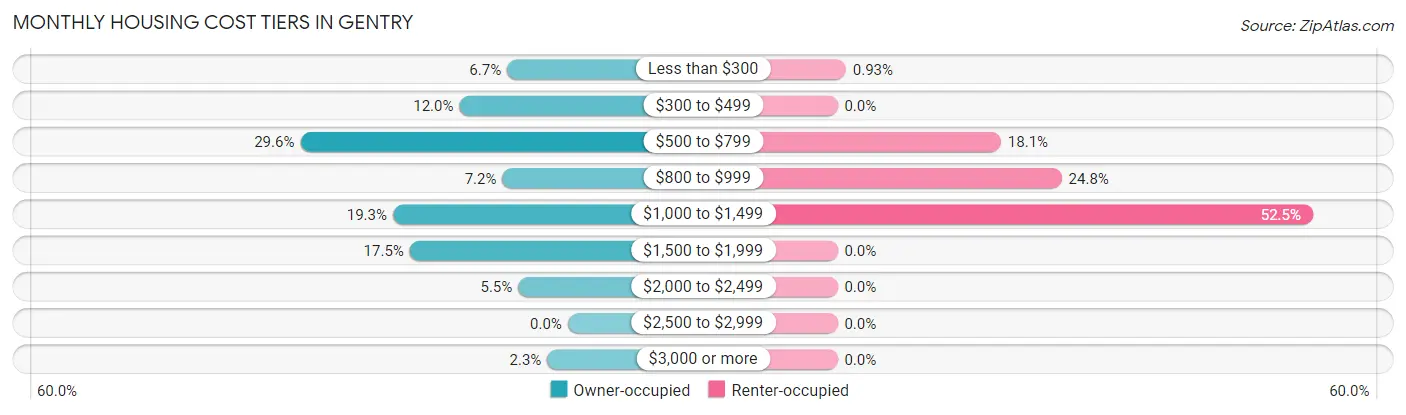
| Monthly Cost | Owner-occupied | Renter-occupied |
| Less than $300 | 65 (6.7%) | 5 (0.9%) |
| $300 to $499 | 116 (12.0%) | 0 (0.0%) |
| $500 to $799 | 286 (29.5%) | 97 (18.1%) |
| $800 to $999 | 70 (7.2%) | 133 (24.8%) |
| $1,000 to $1,499 | 187 (19.3%) | 282 (52.5%) |
| $1,500 to $1,999 | 169 (17.5%) | 0 (0.0%) |
| $2,000 to $2,499 | 53 (5.5%) | 0 (0.0%) |
| $2,500 to $2,999 | 0 (0.0%) | 0 (0.0%) |
| $3,000 or more | 22 (2.3%) | 0 (0.0%) |
| Total | 968 (100.0%) | 537 (100.0%) |
Physical Housing Characteristics in Gentry
Housing Structures in Gentry
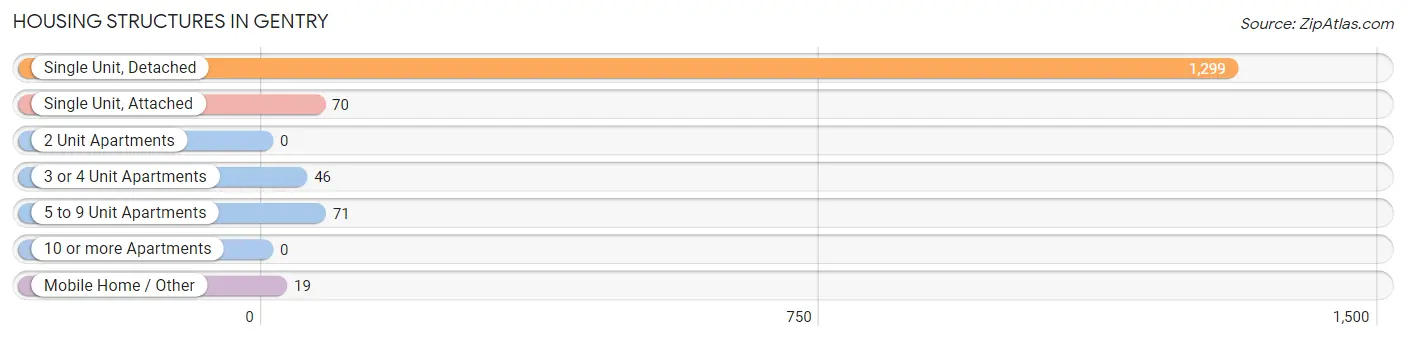
| Structure Type | # Housing Units | % Housing Units |
| Single Unit, Detached | 1,299 | 86.3% |
| Single Unit, Attached | 70 | 4.6% |
| 2 Unit Apartments | 0 | 0.0% |
| 3 or 4 Unit Apartments | 46 | 3.1% |
| 5 to 9 Unit Apartments | 71 | 4.7% |
| 10 or more Apartments | 0 | 0.0% |
| Mobile Home / Other | 19 | 1.3% |
| Total | 1,505 | 100.0% |
Housing Structures by Occupancy in Gentry
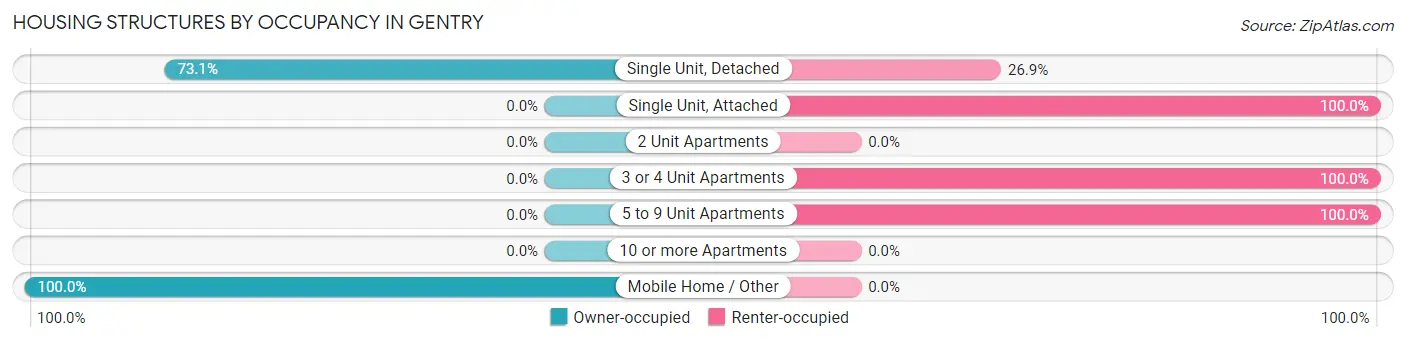
| Structure Type | Owner-occupied | Renter-occupied |
| Single Unit, Detached | 949 (73.1%) | 350 (26.9%) |
| Single Unit, Attached | 0 (0.0%) | 70 (100.0%) |
| 2 Unit Apartments | 0 (0.0%) | 0 (0.0%) |
| 3 or 4 Unit Apartments | 0 (0.0%) | 46 (100.0%) |
| 5 to 9 Unit Apartments | 0 (0.0%) | 71 (100.0%) |
| 10 or more Apartments | 0 (0.0%) | 0 (0.0%) |
| Mobile Home / Other | 19 (100.0%) | 0 (0.0%) |
| Total | 968 (64.3%) | 537 (35.7%) |
Housing Structures by Number of Rooms in Gentry
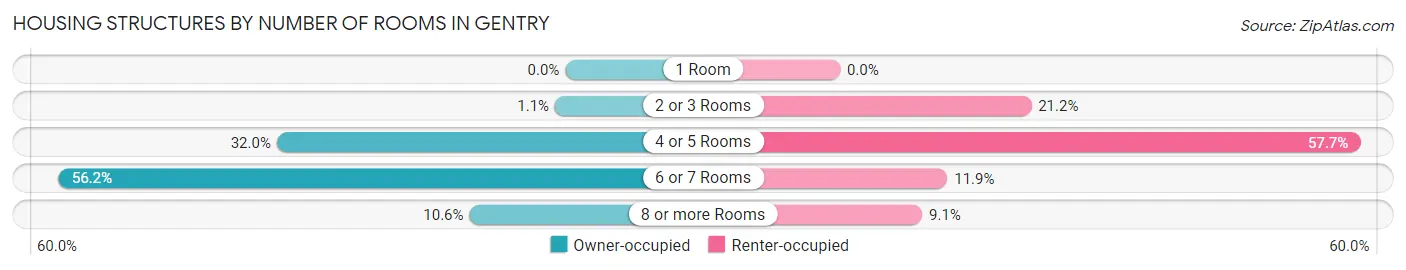
| Number of Rooms | Owner-occupied | Renter-occupied |
| 1 Room | 0 (0.0%) | 0 (0.0%) |
| 2 or 3 Rooms | 11 (1.1%) | 114 (21.2%) |
| 4 or 5 Rooms | 310 (32.0%) | 310 (57.7%) |
| 6 or 7 Rooms | 544 (56.2%) | 64 (11.9%) |
| 8 or more Rooms | 103 (10.6%) | 49 (9.1%) |
| Total | 968 (100.0%) | 537 (100.0%) |
Housing Structure by Heating Type in Gentry
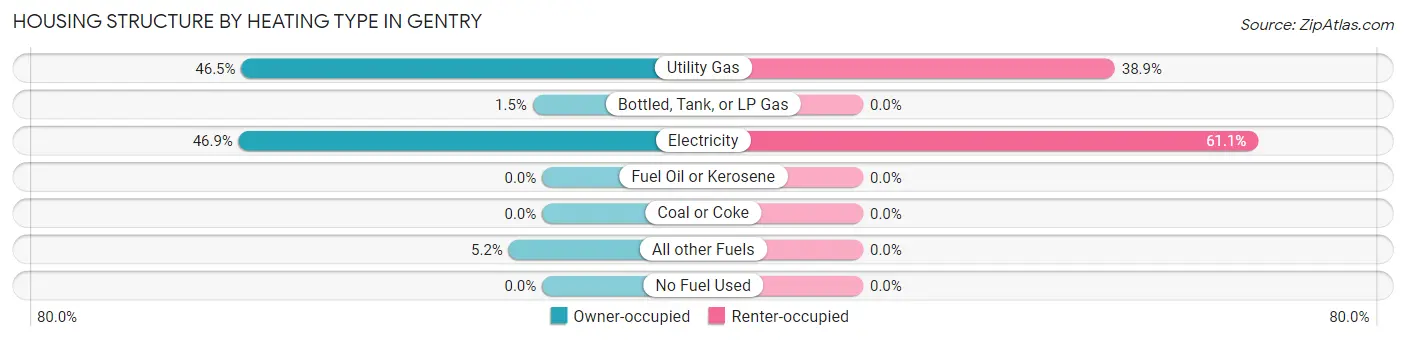
| Heating Type | Owner-occupied | Renter-occupied |
| Utility Gas | 450 (46.5%) | 209 (38.9%) |
| Bottled, Tank, or LP Gas | 14 (1.5%) | 0 (0.0%) |
| Electricity | 454 (46.9%) | 328 (61.1%) |
| Fuel Oil or Kerosene | 0 (0.0%) | 0 (0.0%) |
| Coal or Coke | 0 (0.0%) | 0 (0.0%) |
| All other Fuels | 50 (5.2%) | 0 (0.0%) |
| No Fuel Used | 0 (0.0%) | 0 (0.0%) |
| Total | 968 (100.0%) | 537 (100.0%) |
Household Vehicle Usage in Gentry
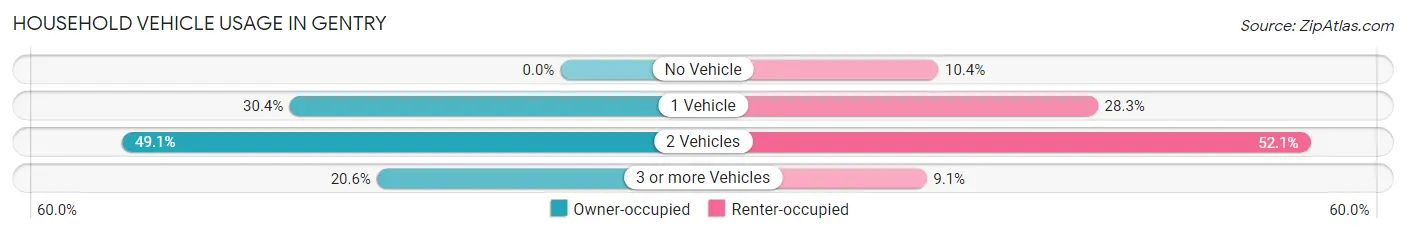
| Vehicles per Household | Owner-occupied | Renter-occupied |
| No Vehicle | 0 (0.0%) | 56 (10.4%) |
| 1 Vehicle | 294 (30.4%) | 152 (28.3%) |
| 2 Vehicles | 475 (49.1%) | 280 (52.1%) |
| 3 or more Vehicles | 199 (20.6%) | 49 (9.1%) |
| Total | 968 (100.0%) | 537 (100.0%) |
Real Estate & Mortgages in Gentry
Real Estate and Mortgage Overview in Gentry
| Characteristic | Without Mortgage | With Mortgage |
| Housing Units | 252 | 716 |
| Median Property Value | $165,700 | $140,300 |
| Median Household Income | $51,522 | $63 |
| Monthly Housing Costs | $371 | $22 |
| Real Estate Taxes | $1,007 | $0 |
Property Value by Mortgage Status in Gentry
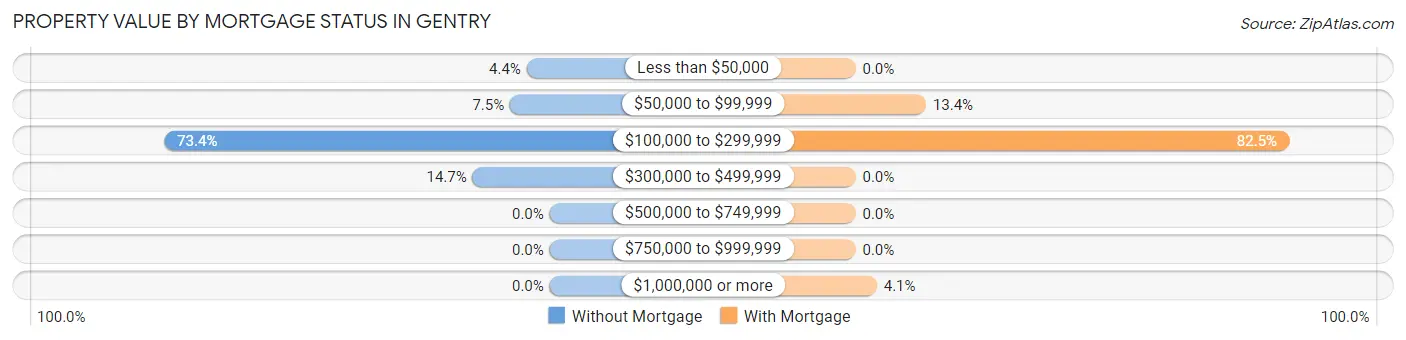
| Property Value | Without Mortgage | With Mortgage |
| Less than $50,000 | 11 (4.4%) | 0 (0.0%) |
| $50,000 to $99,999 | 19 (7.5%) | 96 (13.4%) |
| $100,000 to $299,999 | 185 (73.4%) | 591 (82.5%) |
| $300,000 to $499,999 | 37 (14.7%) | 0 (0.0%) |
| $500,000 to $749,999 | 0 (0.0%) | 0 (0.0%) |
| $750,000 to $999,999 | 0 (0.0%) | 0 (0.0%) |
| $1,000,000 or more | 0 (0.0%) | 29 (4.1%) |
| Total | 252 (100.0%) | 716 (100.0%) |
Household Income by Mortgage Status in Gentry
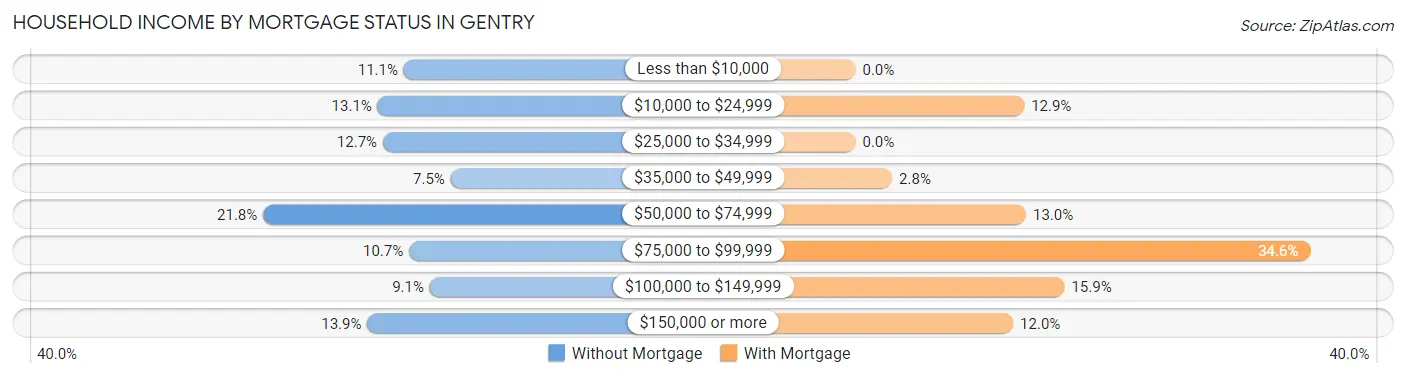
| Household Income | Without Mortgage | With Mortgage |
| Less than $10,000 | 28 (11.1%) | 0 (0.0%) |
| $10,000 to $24,999 | 33 (13.1%) | 92 (12.9%) |
| $25,000 to $34,999 | 32 (12.7%) | 0 (0.0%) |
| $35,000 to $49,999 | 19 (7.5%) | 20 (2.8%) |
| $50,000 to $74,999 | 55 (21.8%) | 93 (13.0%) |
| $75,000 to $99,999 | 27 (10.7%) | 248 (34.6%) |
| $100,000 to $149,999 | 23 (9.1%) | 114 (15.9%) |
| $150,000 or more | 35 (13.9%) | 86 (12.0%) |
| Total | 252 (100.0%) | 716 (100.0%) |
Property Value to Household Income Ratio in Gentry
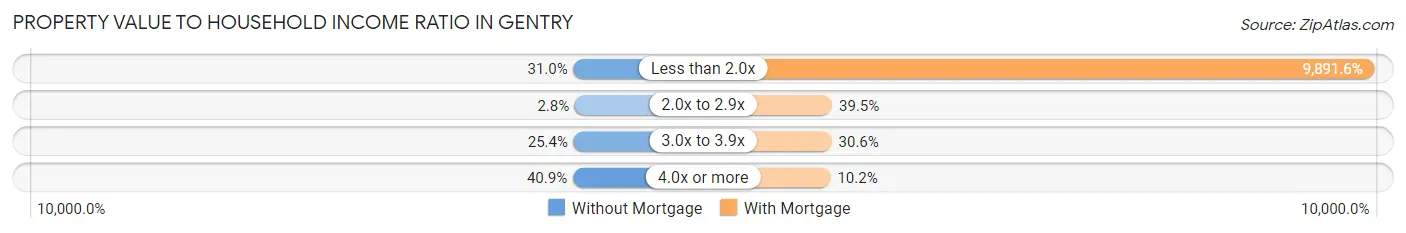
| Value-to-Income Ratio | Without Mortgage | With Mortgage |
| Less than 2.0x | 78 (30.9%) | 70,824 (9,891.6%) |
| 2.0x to 2.9x | 7 (2.8%) | 283 (39.5%) |
| 3.0x to 3.9x | 64 (25.4%) | 219 (30.6%) |
| 4.0x or more | 103 (40.9%) | 73 (10.2%) |
| Total | 252 (100.0%) | 716 (100.0%) |
Real Estate Taxes by Mortgage Status in Gentry
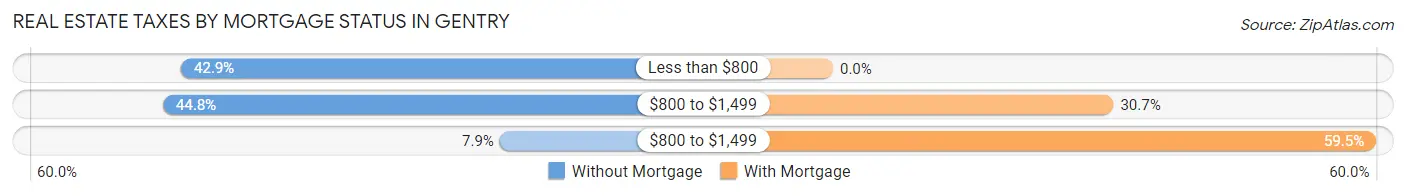
| Property Taxes | Without Mortgage | With Mortgage |
| Less than $800 | 108 (42.9%) | 0 (0.0%) |
| $800 to $1,499 | 113 (44.8%) | 220 (30.7%) |
| $800 to $1,499 | 20 (7.9%) | 426 (59.5%) |
| Total | 252 (100.0%) | 716 (100.0%) |
Health & Disability in Gentry
Health Insurance Coverage by Age in Gentry
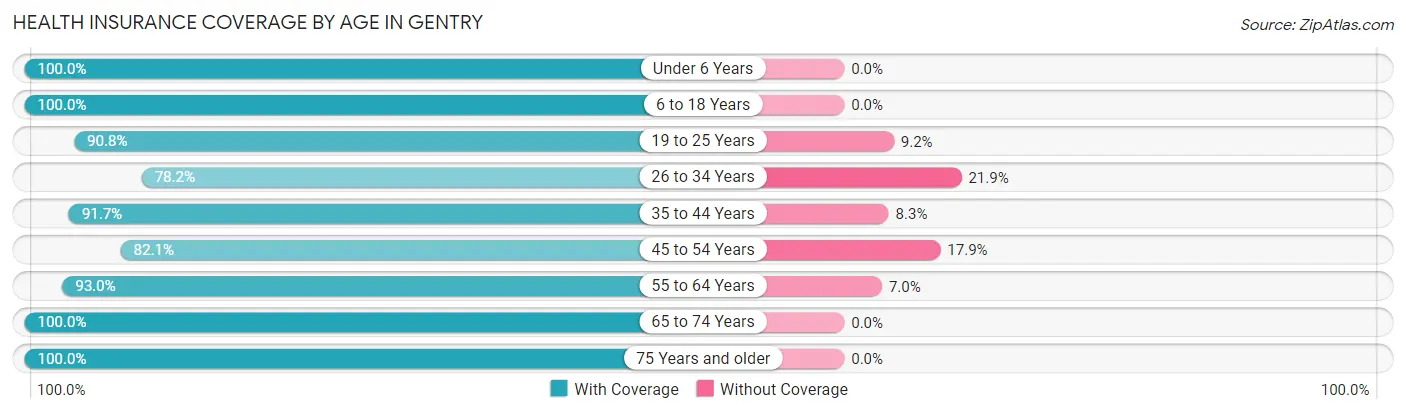
| Age Bracket | With Coverage | Without Coverage |
| Under 6 Years | 315 (100.0%) | 0 (0.0%) |
| 6 to 18 Years | 613 (100.0%) | 0 (0.0%) |
| 19 to 25 Years | 393 (90.8%) | 40 (9.2%) |
| 26 to 34 Years | 465 (78.1%) | 130 (21.8%) |
| 35 to 44 Years | 355 (91.7%) | 32 (8.3%) |
| 45 to 54 Years | 458 (82.1%) | 100 (17.9%) |
| 55 to 64 Years | 344 (93.0%) | 26 (7.0%) |
| 65 to 74 Years | 379 (100.0%) | 0 (0.0%) |
| 75 Years and older | 262 (100.0%) | 0 (0.0%) |
| Total | 3,584 (91.6%) | 328 (8.4%) |
Health Insurance Coverage by Citizenship Status in Gentry
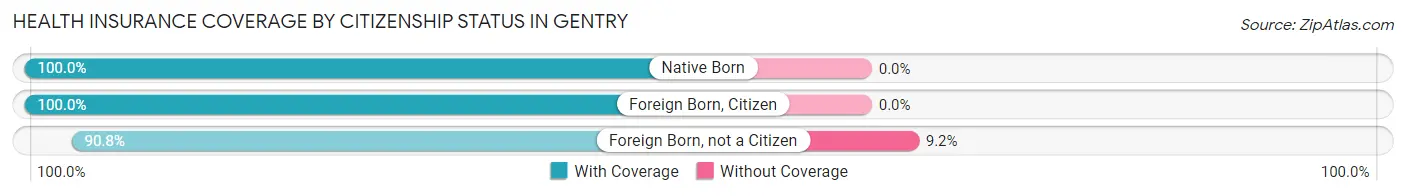
| Citizenship Status | With Coverage | Without Coverage |
| Native Born | 315 (100.0%) | 0 (0.0%) |
| Foreign Born, Citizen | 613 (100.0%) | 0 (0.0%) |
| Foreign Born, not a Citizen | 393 (90.8%) | 40 (9.2%) |
Health Insurance Coverage by Household Income in Gentry
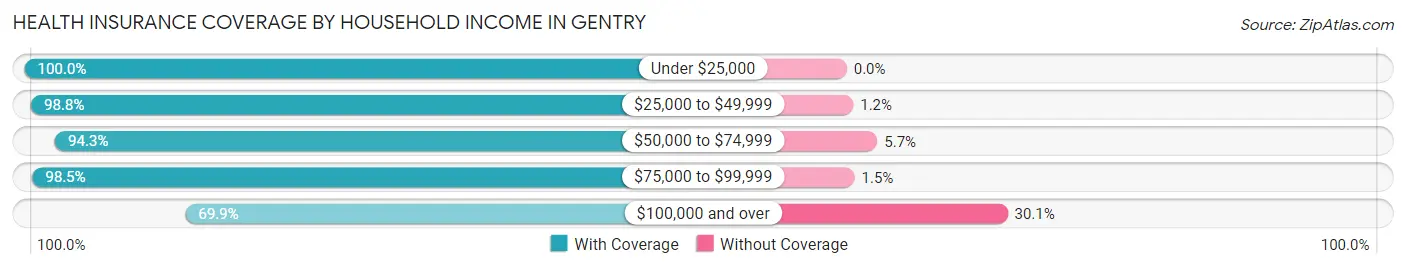
| Household Income | With Coverage | Without Coverage |
| Under $25,000 | 279 (100.0%) | 0 (0.0%) |
| $25,000 to $49,999 | 810 (98.8%) | 10 (1.2%) |
| $50,000 to $74,999 | 1,515 (94.3%) | 92 (5.7%) |
| $75,000 to $99,999 | 472 (98.5%) | 7 (1.5%) |
| $100,000 and over | 508 (69.9%) | 219 (30.1%) |
Public vs Private Health Insurance Coverage by Age in Gentry
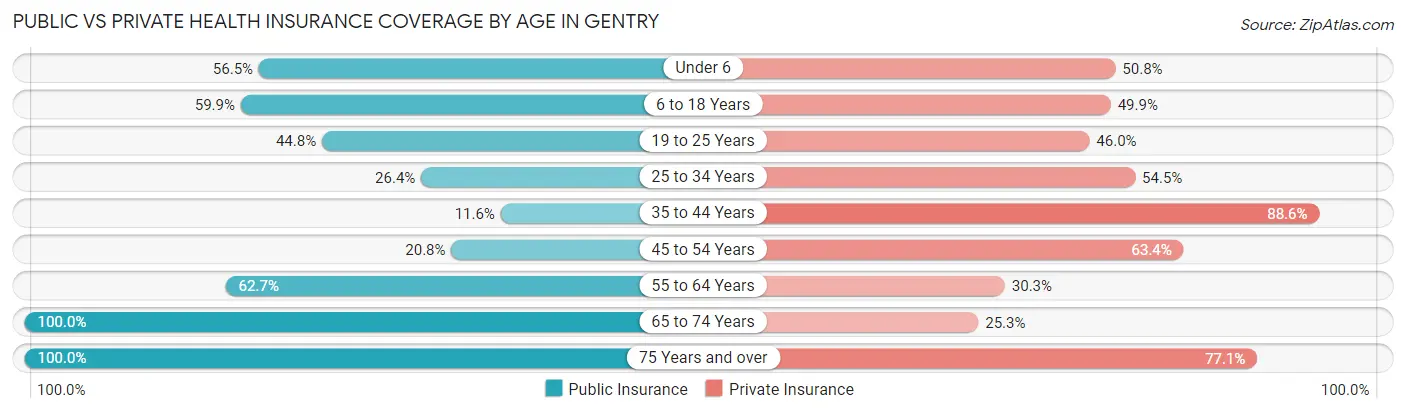
| Age Bracket | Public Insurance | Private Insurance |
| Under 6 | 178 (56.5%) | 160 (50.8%) |
| 6 to 18 Years | 367 (59.9%) | 306 (49.9%) |
| 19 to 25 Years | 194 (44.8%) | 199 (46.0%) |
| 25 to 34 Years | 157 (26.4%) | 324 (54.4%) |
| 35 to 44 Years | 45 (11.6%) | 343 (88.6%) |
| 45 to 54 Years | 116 (20.8%) | 354 (63.4%) |
| 55 to 64 Years | 232 (62.7%) | 112 (30.3%) |
| 65 to 74 Years | 379 (100.0%) | 96 (25.3%) |
| 75 Years and over | 262 (100.0%) | 202 (77.1%) |
| Total | 1,930 (49.3%) | 2,096 (53.6%) |
Disability Status by Sex by Age in Gentry
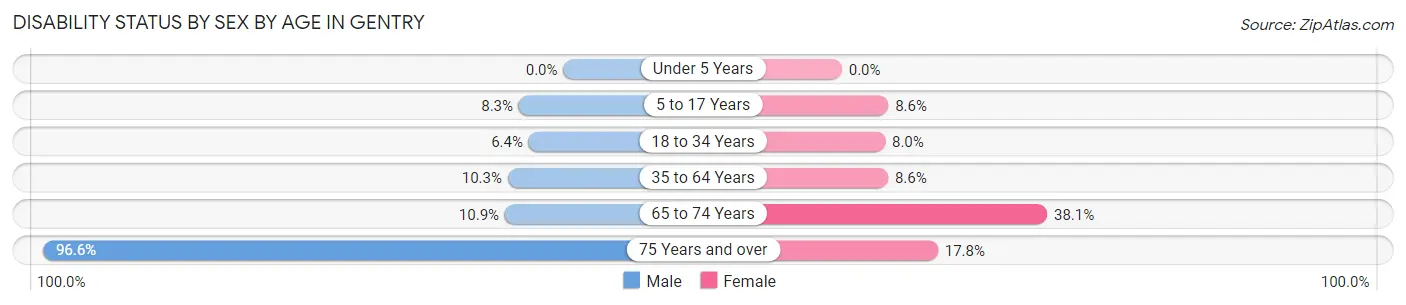
| Age Bracket | Male | Female |
| Under 5 Years | 0 (0.0%) | 0 (0.0%) |
| 5 to 17 Years | 19 (8.3%) | 33 (8.6%) |
| 18 to 34 Years | 36 (6.4%) | 42 (8.0%) |
| 35 to 64 Years | 73 (10.3%) | 52 (8.6%) |
| 65 to 74 Years | 32 (10.8%) | 32 (38.1%) |
| 75 Years and over | 85 (96.6%) | 31 (17.8%) |
Disability Class by Sex by Age in Gentry
Disability Class: Hearing Difficulty
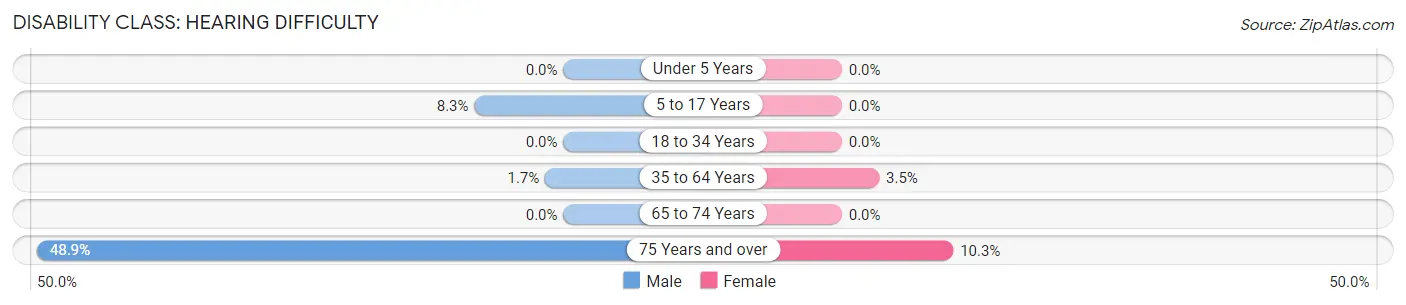
| Age Bracket | Male | Female |
| Under 5 Years | 0 (0.0%) | 0 (0.0%) |
| 5 to 17 Years | 19 (8.3%) | 0 (0.0%) |
| 18 to 34 Years | 0 (0.0%) | 0 (0.0%) |
| 35 to 64 Years | 12 (1.7%) | 21 (3.5%) |
| 65 to 74 Years | 0 (0.0%) | 0 (0.0%) |
| 75 Years and over | 43 (48.9%) | 18 (10.3%) |
Disability Class: Vision Difficulty
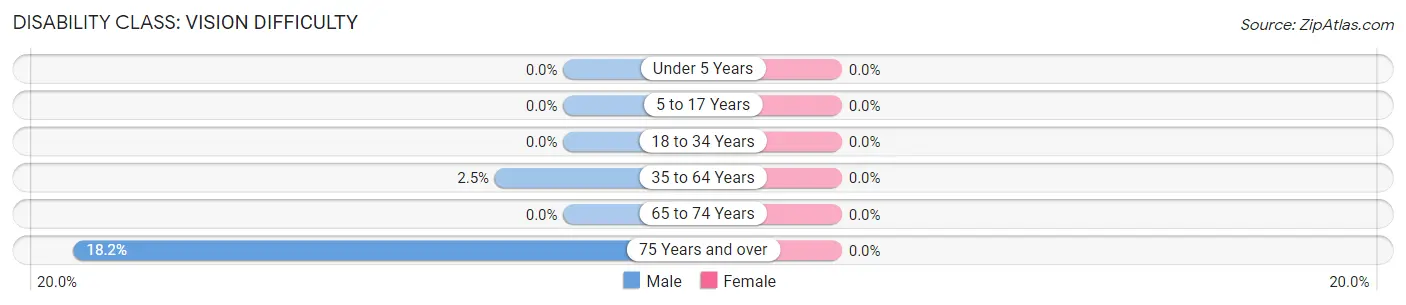
| Age Bracket | Male | Female |
| Under 5 Years | 0 (0.0%) | 0 (0.0%) |
| 5 to 17 Years | 0 (0.0%) | 0 (0.0%) |
| 18 to 34 Years | 0 (0.0%) | 0 (0.0%) |
| 35 to 64 Years | 18 (2.5%) | 0 (0.0%) |
| 65 to 74 Years | 0 (0.0%) | 0 (0.0%) |
| 75 Years and over | 16 (18.2%) | 0 (0.0%) |
Disability Class: Cognitive Difficulty
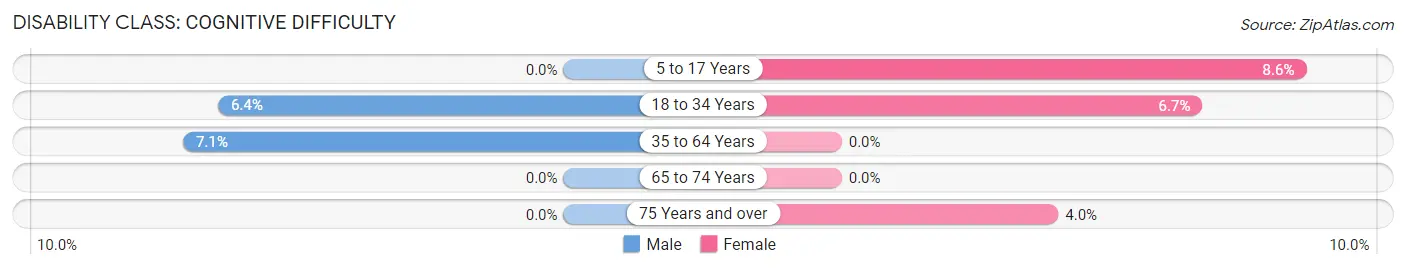
| Age Bracket | Male | Female |
| 5 to 17 Years | 0 (0.0%) | 33 (8.6%) |
| 18 to 34 Years | 36 (6.4%) | 35 (6.7%) |
| 35 to 64 Years | 50 (7.1%) | 0 (0.0%) |
| 65 to 74 Years | 0 (0.0%) | 0 (0.0%) |
| 75 Years and over | 0 (0.0%) | 7 (4.0%) |
Disability Class: Ambulatory Difficulty
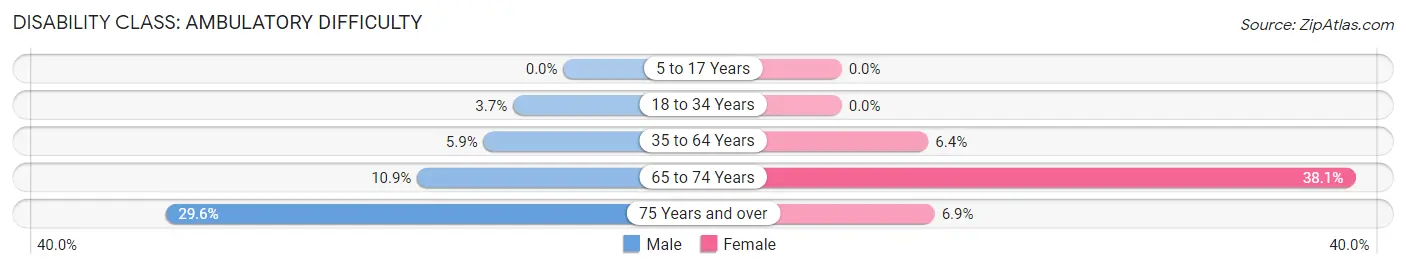
| Age Bracket | Male | Female |
| 5 to 17 Years | 0 (0.0%) | 0 (0.0%) |
| 18 to 34 Years | 21 (3.7%) | 0 (0.0%) |
| 35 to 64 Years | 42 (5.9%) | 39 (6.4%) |
| 65 to 74 Years | 32 (10.8%) | 32 (38.1%) |
| 75 Years and over | 26 (29.5%) | 12 (6.9%) |
Disability Class: Self-Care Difficulty
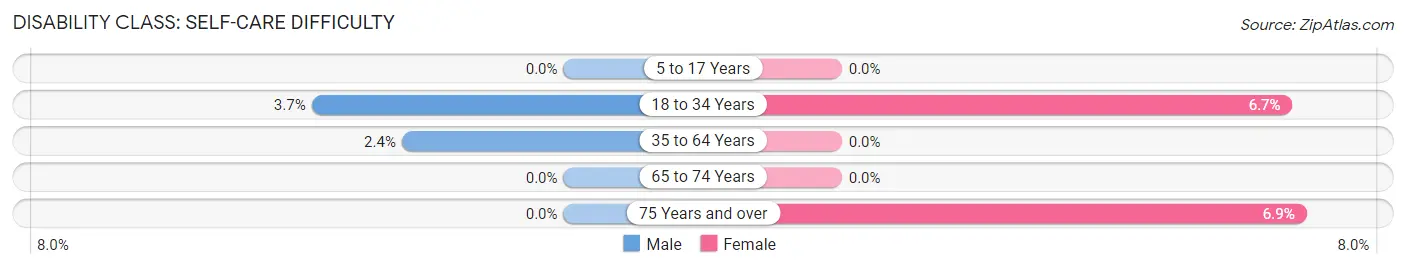
| Age Bracket | Male | Female |
| 5 to 17 Years | 0 (0.0%) | 0 (0.0%) |
| 18 to 34 Years | 21 (3.7%) | 35 (6.7%) |
| 35 to 64 Years | 17 (2.4%) | 0 (0.0%) |
| 65 to 74 Years | 0 (0.0%) | 0 (0.0%) |
| 75 Years and over | 0 (0.0%) | 12 (6.9%) |
Technology Access in Gentry
Computing Device Access in Gentry
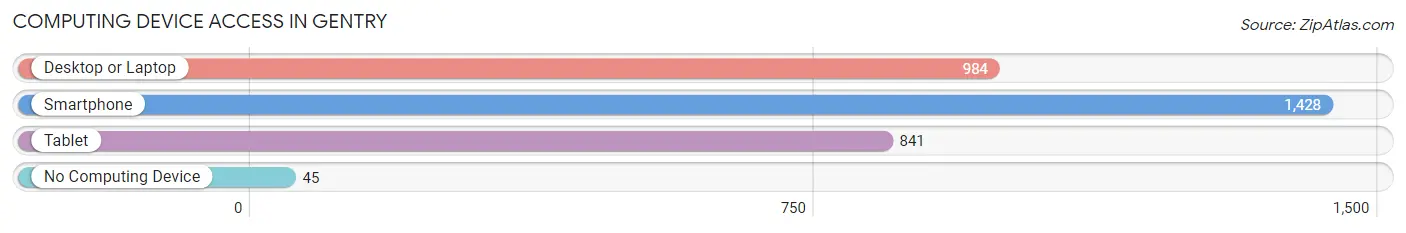
| Device Type | # Households | % Households |
| Desktop or Laptop | 984 | 65.4% |
| Smartphone | 1,428 | 94.9% |
| Tablet | 841 | 55.9% |
| No Computing Device | 45 | 3.0% |
| Total | 1,505 | 100.0% |
Internet Access in Gentry
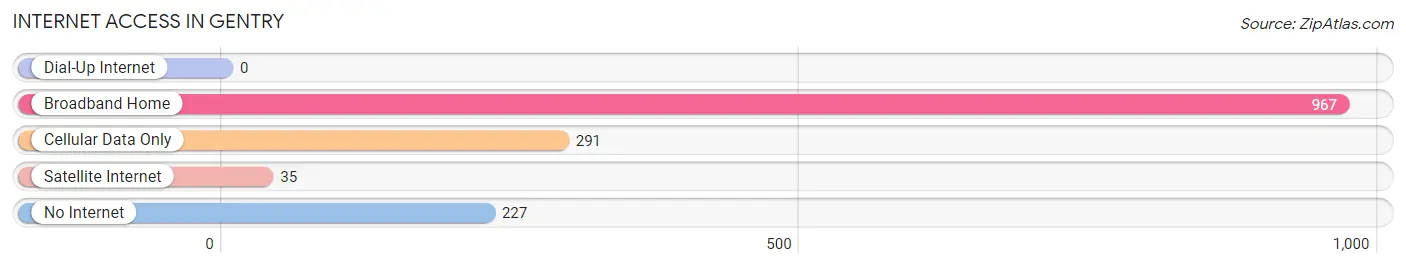
| Internet Type | # Households | % Households |
| Dial-Up Internet | 0 | 0.0% |
| Broadband Home | 967 | 64.2% |
| Cellular Data Only | 291 | 19.3% |
| Satellite Internet | 35 | 2.3% |
| No Internet | 227 | 15.1% |
| Total | 1,505 | 100.0% |
Gentry Summary
Gentry, Arkansas is a small city located in Benton County in the northwest corner of the state. It is part of the Fayetteville-Springdale-Rogers Metropolitan Statistical Area and is home to approximately 3,000 people. The city was founded in 1872 and was named after the Gentry family, who were early settlers in the area.
Geography
Gentry is located in the Ozark Mountains of northwest Arkansas. The city is situated on the western edge of the Ozark Plateau, which is characterized by rolling hills and valleys. The city is located at the intersection of two major highways, US Highway 71 and Arkansas Highway 12. The city is surrounded by the cities of Decatur, Gravette, and Siloam Springs.
The climate in Gentry is humid subtropical, with hot, humid summers and mild winters. The average annual temperature is around 63°F (17°C). The average annual precipitation is around 45 inches (114 cm).
Economy
Gentry’s economy is largely based on agriculture and manufacturing. The city is home to several large poultry processing plants, as well as a number of smaller businesses. The city is also home to a number of retail stores, restaurants, and other businesses.
Demographics
As of the 2010 census, Gentry had a population of 3,158. The racial makeup of the city was 92.3% White, 0.7% African American, 0.3% Native American, 0.3% Asian, 0.1% Pacific Islander, 4.2% from other races, and 2.3% from two or more races. Hispanic or Latino of any race were 8.2% of the population.
The median income for a household in Gentry was $37,917, and the median income for a family was $45,938. The per capita income for the city was $17,945. About 11.3% of families and 14.2% of the population were below the poverty line, including 19.2% of those under age 18 and 8.2% of those age 65 or over.
Education
Gentry is served by the Gentry School District, which includes Gentry High School, Gentry Middle School, and Gentry Elementary School. The district also operates a number of alternative education programs, including a virtual school and a home school program.
Gentry is also home to a branch of Northwest Arkansas Community College, which offers a variety of associate degree and certificate programs.
Conclusion
Gentry, Arkansas is a small city located in the northwest corner of the state. It is part of the Fayetteville-Springdale-Rogers Metropolitan Statistical Area and is home to approximately 3,000 people. The city’s economy is largely based on agriculture and manufacturing, and it is served by the Gentry School District. Gentry is a great place to live, work, and raise a family.
Common Questions
What is Per Capita Income in Gentry?
Per Capita income in Gentry is $30,430.
What is the Median Family Income in Gentry?
Median Family Income in Gentry is $63,727.
What is the Median Household income in Gentry?
Median Household Income in Gentry is $62,981.
What is Income or Wage Gap in Gentry?
Income or Wage Gap in Gentry is 2.2%.
Women in Gentry earn 97.8 cents for every dollar earned by a man.
What is Inequality or Gini Index in Gentry?
Inequality or Gini Index in Gentry is 0.44.
What is the Total Population of Gentry?
Total Population of Gentry is 3,912.
What is the Total Male Population of Gentry?
Total Male Population of Gentry is 2,028.
What is the Total Female Population of Gentry?
Total Female Population of Gentry is 1,884.
What is the Ratio of Males per 100 Females in Gentry?
There are 107.64 Males per 100 Females in Gentry.
What is the Ratio of Females per 100 Males in Gentry?
There are 92.90 Females per 100 Males in Gentry.
What is the Median Population Age in Gentry?
Median Population Age in Gentry is 35.0 Years.
What is the Average Family Size in Gentry
Average Family Size in Gentry is 2.9 People.
What is the Average Household Size in Gentry
Average Household Size in Gentry is 2.6 People.
How Large is the Labor Force in Gentry?
There are 1,847 People in the Labor Forcein in Gentry.
What is the Percentage of People in the Labor Force in Gentry?
59.1% of People are in the Labor Force in Gentry.