Tichigan, WI Map & Demographics
Tichigan Map
Tichigan Overview
$52,746
PER CAPITA INCOME
$138,023
AVG FAMILY INCOME
$128,352
AVG HOUSEHOLD INCOME
44.6%
WAGE / INCOME GAP [ % ]
55.4¢/ $1
WAGE / INCOME GAP [ $ ]
0.36
INEQUALITY / GINI INDEX
5,060
TOTAL POPULATION
2,590
MALE POPULATION
2,470
FEMALE POPULATION
104.86
MALES / 100 FEMALES
95.37
FEMALES / 100 MALES
47.1
MEDIAN AGE
3.2
AVG FAMILY SIZE
2.9
AVG HOUSEHOLD SIZE
2,932
LABOR FORCE [ PEOPLE ]
74.4%
PERCENT IN LABOR FORCE
2.8%
UNEMPLOYMENT RATE
Income in Tichigan
Income Overview in Tichigan
Per Capita Income in Tichigan is $52,746, while median incomes of families and households are $138,023 and $128,352 respectively.
| Characteristic | Number | Measure |
| Per Capita Income | 5,060 | $52,746 |
| Median Family Income | 1,466 | $138,023 |
| Mean Family Income | 1,466 | $152,358 |
| Median Household Income | 1,745 | $128,352 |
| Mean Household Income | 1,745 | $144,981 |
| Income Deficit | 1,466 | $0 |
| Wage / Income Gap (%) | 5,060 | 44.56% |
| Wage / Income Gap ($) | 5,060 | 55.44¢ per $1 |
| Gini / Inequality Index | 5,060 | 0.36 |
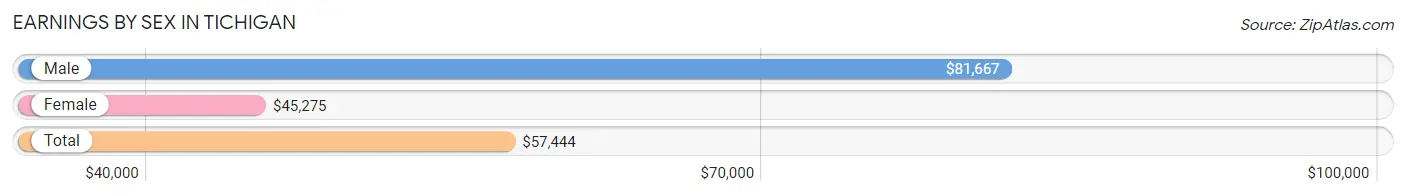
Earnings by Sex in Tichigan
Average Earnings in Tichigan are $57,444, $81,667 for men and $45,275 for women, a difference of 44.6%.
| Sex | Number | Average Earnings |
| Male | 1,656 (55.6%) | $81,667 |
| Female | 1,323 (44.4%) | $45,275 |
| Total | 2,979 (100.0%) | $57,444 |
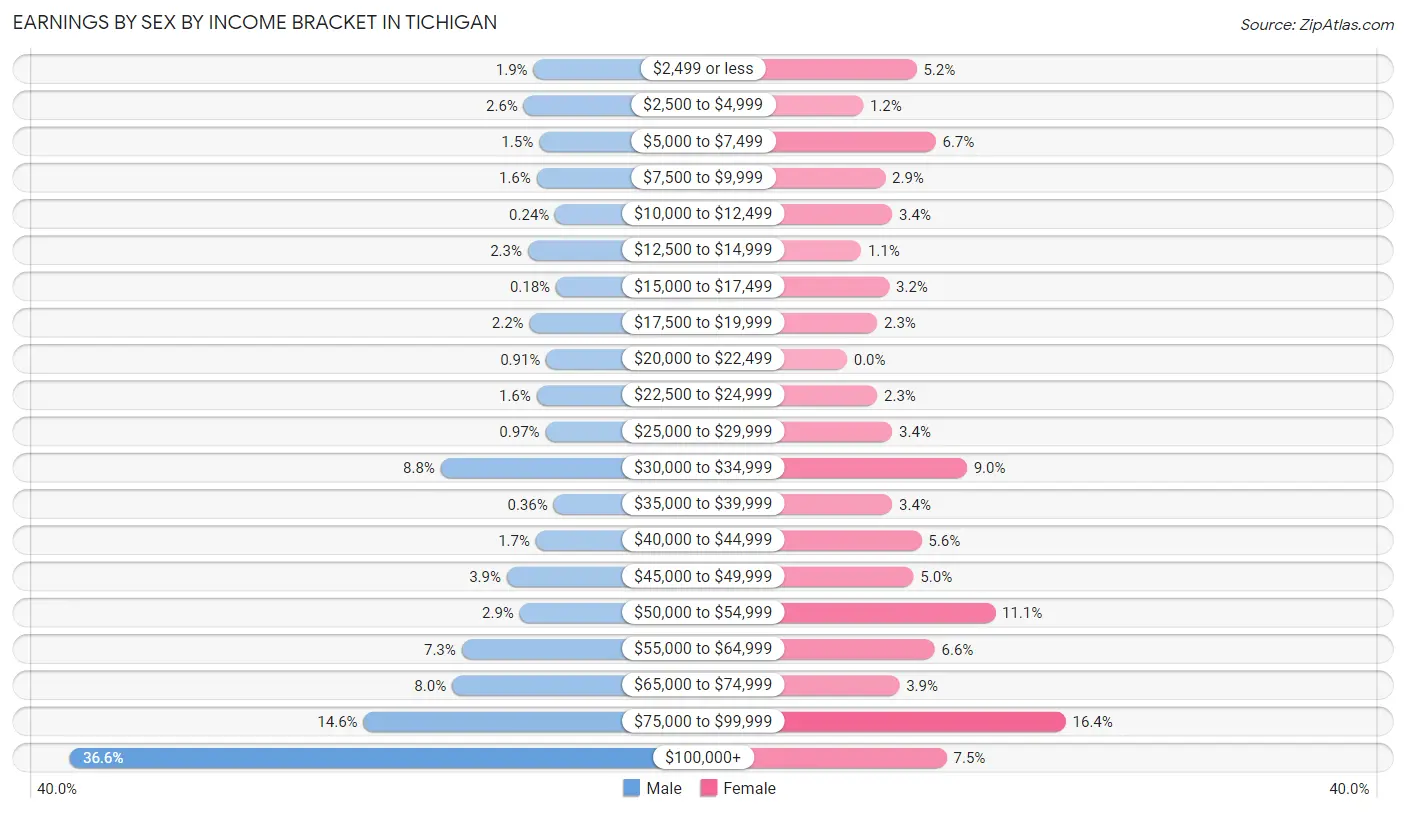
Earnings by Sex by Income Bracket in Tichigan
The most common earnings brackets in Tichigan are $100,000+ for men (606 | 36.6%) and $75,000 to $99,999 for women (217 | 16.4%).
| Income | Male | Female |
| $2,499 or less | 31 (1.9%) | 69 (5.2%) |
| $2,500 to $4,999 | 43 (2.6%) | 16 (1.2%) |
| $5,000 to $7,499 | 24 (1.5%) | 88 (6.7%) |
| $7,500 to $9,999 | 27 (1.6%) | 38 (2.9%) |
| $10,000 to $12,499 | 4 (0.2%) | 45 (3.4%) |
| $12,500 to $14,999 | 38 (2.3%) | 14 (1.1%) |
| $15,000 to $17,499 | 3 (0.2%) | 42 (3.2%) |
| $17,500 to $19,999 | 36 (2.2%) | 30 (2.3%) |
| $20,000 to $22,499 | 15 (0.9%) | 0 (0.0%) |
| $22,500 to $24,999 | 27 (1.6%) | 30 (2.3%) |
| $25,000 to $29,999 | 16 (1.0%) | 45 (3.4%) |
| $30,000 to $34,999 | 146 (8.8%) | 119 (9.0%) |
| $35,000 to $39,999 | 6 (0.4%) | 45 (3.4%) |
| $40,000 to $44,999 | 28 (1.7%) | 74 (5.6%) |
| $45,000 to $49,999 | 64 (3.9%) | 66 (5.0%) |
| $50,000 to $54,999 | 48 (2.9%) | 147 (11.1%) |
| $55,000 to $64,999 | 120 (7.2%) | 87 (6.6%) |
| $65,000 to $74,999 | 132 (8.0%) | 52 (3.9%) |
| $75,000 to $99,999 | 242 (14.6%) | 217 (16.4%) |
| $100,000+ | 606 (36.6%) | 99 (7.5%) |
| Total | 1,656 (100.0%) | 1,323 (100.0%) |
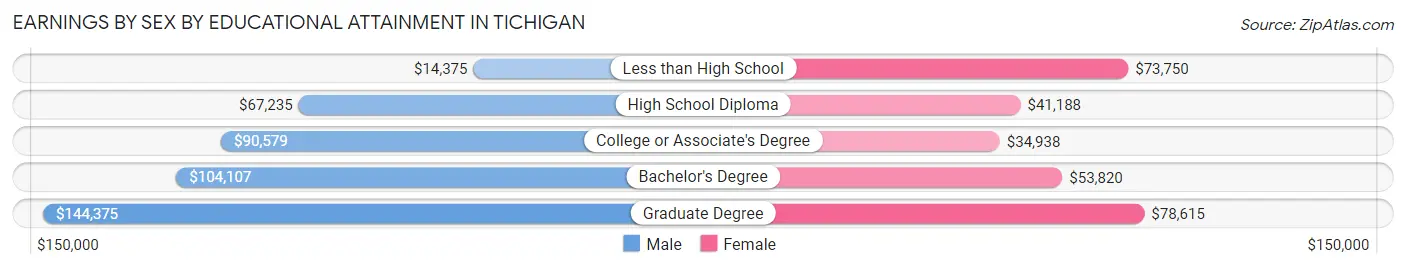
Earnings by Sex by Educational Attainment in Tichigan
Average earnings in Tichigan are $86,196 for men and $52,674 for women, a difference of 38.9%. Men with an educational attainment of graduate degree enjoy the highest average annual earnings of $144,375, while those with less than high school education earn the least with $14,375. Women with an educational attainment of graduate degree earn the most with the average annual earnings of $78,615, while those with college or associate's degree education have the smallest earnings of $34,938.
| Educational Attainment | Male Income | Female Income |
| Less than High School | $14,375 | $73,750 |
| High School Diploma | $67,235 | $41,188 |
| College or Associate's Degree | $90,579 | $34,938 |
| Bachelor's Degree | $104,107 | $53,820 |
| Graduate Degree | $144,375 | $78,615 |
| Total | $86,196 | $52,674 |
Family Income in Tichigan
Family Income Brackets in Tichigan
According to the Tichigan family income data, there are 496 families falling into the $100,000 to $149,999 income range, which is the most common income bracket and makes up 33.8% of all families.
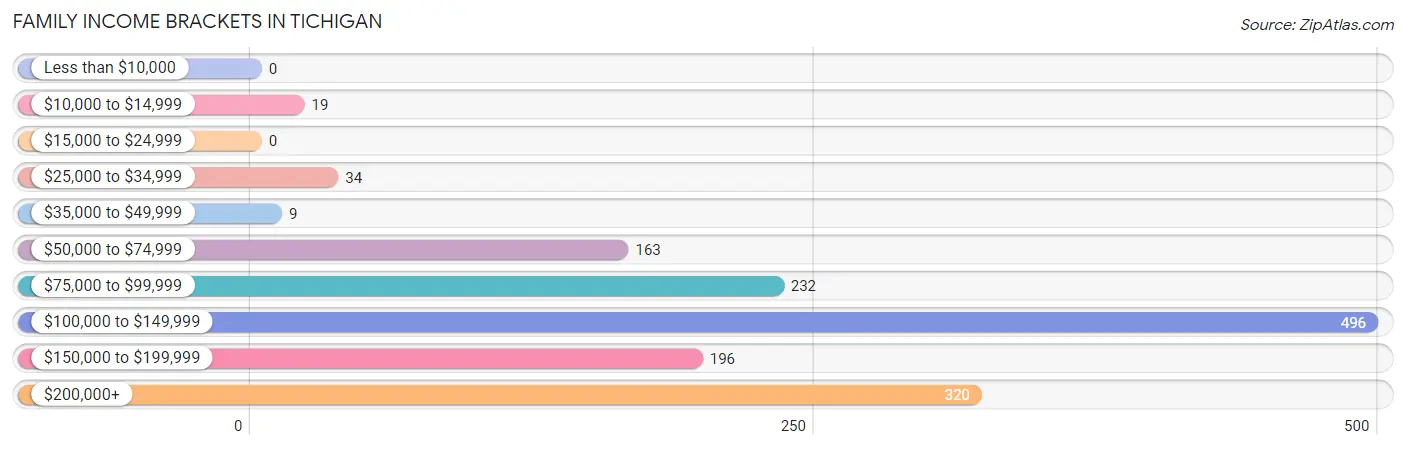
| Income Bracket | # Families | % Families |
| Less than $10,000 | 0 | 0.0% |
| $10,000 to $14,999 | 19 | 1.3% |
| $15,000 to $24,999 | 0 | 0.0% |
| $25,000 to $34,999 | 34 | 2.3% |
| $35,000 to $49,999 | 9 | 0.6% |
| $50,000 to $74,999 | 163 | 11.1% |
| $75,000 to $99,999 | 232 | 15.8% |
| $100,000 to $149,999 | 496 | 33.8% |
| $150,000 to $199,999 | 196 | 13.4% |
| $200,000+ | 320 | 21.8% |
Family Income by Famaliy Size in Tichigan
5-person families (99 | 6.8%) account for the highest median family income in Tichigan with $213,750 per family, while 2-person families (699 | 47.7%) have the highest median income of $57,702 per family member.
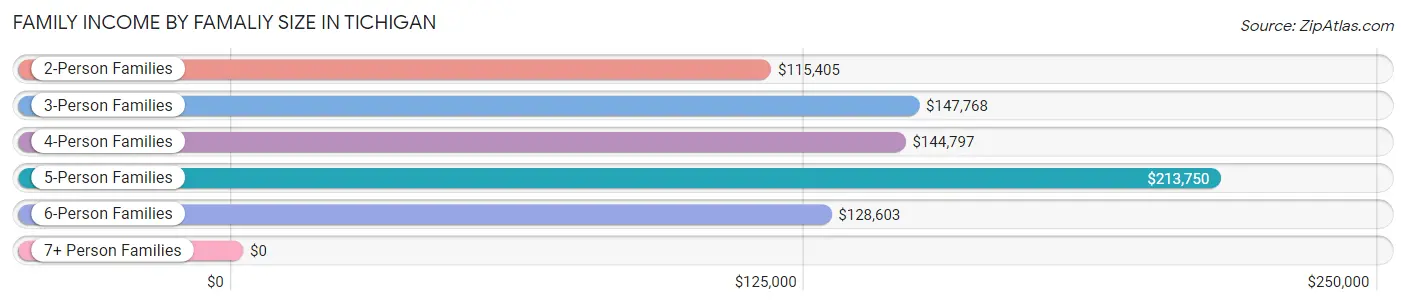
| Income Bracket | # Families | Median Income |
| 2-Person Families | 699 (47.7%) | $115,405 |
| 3-Person Families | 229 (15.6%) | $147,768 |
| 4-Person Families | 389 (26.5%) | $144,797 |
| 5-Person Families | 99 (6.8%) | $213,750 |
| 6-Person Families | 33 (2.2%) | $128,603 |
| 7+ Person Families | 17 (1.2%) | $0 |
| Total | 1,466 (100.0%) | $138,023 |
Family Income by Number of Earners in Tichigan
The median family income in Tichigan is $138,023, with families comprising 3+ earners (226) having the highest median family income of $194,327, while families with 1 earner (252) have the lowest median family income of $83,500, accounting for 15.4% and 17.2% of families, respectively.
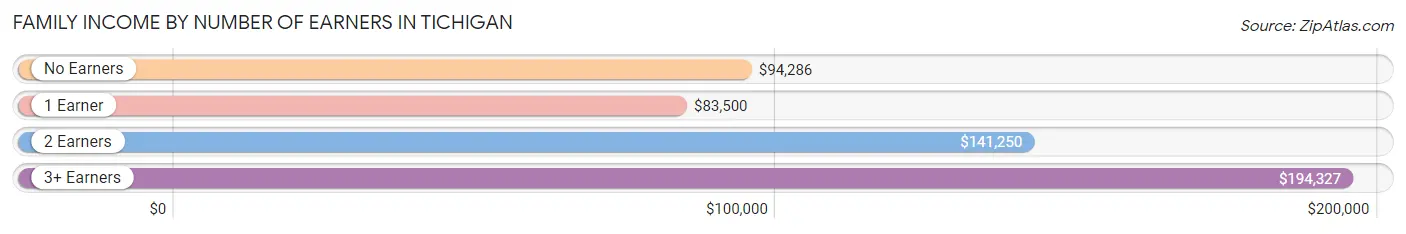
| Number of Earners | # Families | Median Income |
| No Earners | 204 (13.9%) | $94,286 |
| 1 Earner | 252 (17.2%) | $83,500 |
| 2 Earners | 784 (53.5%) | $141,250 |
| 3+ Earners | 226 (15.4%) | $194,327 |
| Total | 1,466 (100.0%) | $138,023 |
Household Income in Tichigan
Household Income Brackets in Tichigan
With 518 households falling in the category, the $100,000 to $149,999 income range is the most frequent in Tichigan, accounting for 29.7% of all households. In contrast, only 5 households (0.3%) fall into the less than $10,000 income bracket, making it the least populous group.
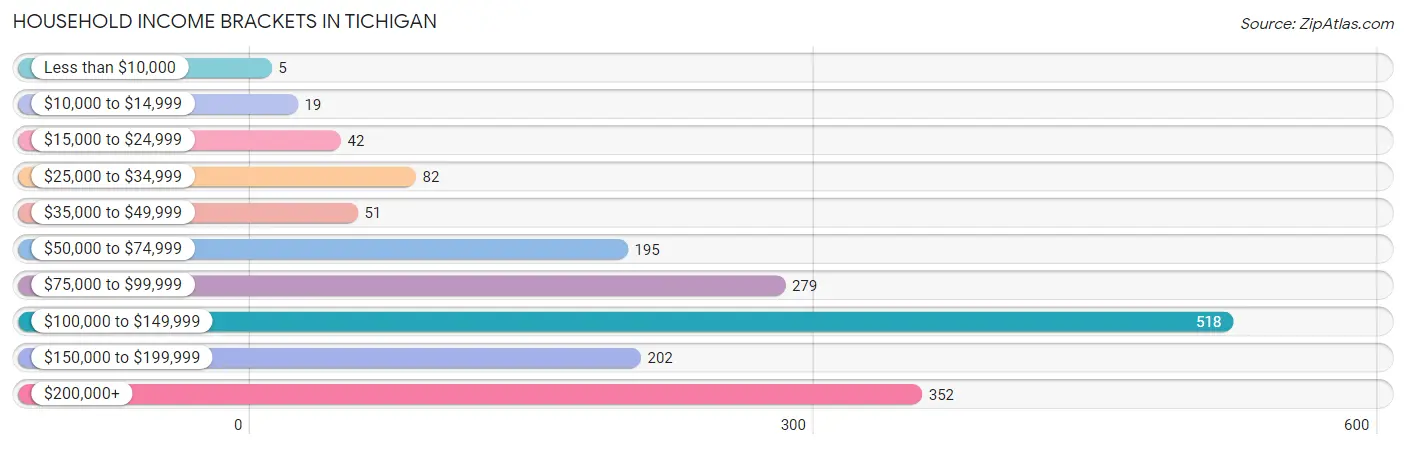
| Income Bracket | # Households | % Households |
| Less than $10,000 | 5 | 0.3% |
| $10,000 to $14,999 | 19 | 1.1% |
| $15,000 to $24,999 | 42 | 2.4% |
| $25,000 to $34,999 | 82 | 4.7% |
| $35,000 to $49,999 | 51 | 2.9% |
| $50,000 to $74,999 | 195 | 11.2% |
| $75,000 to $99,999 | 279 | 16.0% |
| $100,000 to $149,999 | 518 | 29.7% |
| $150,000 to $199,999 | 202 | 11.6% |
| $200,000+ | 352 | 20.2% |
Household Income by Householder Age in Tichigan
The median household income in Tichigan is $128,352, with the highest median household income of $145,515 found in the 45 to 64 years age bracket for the primary householder. A total of 890 households (51.0%) fall into this category.
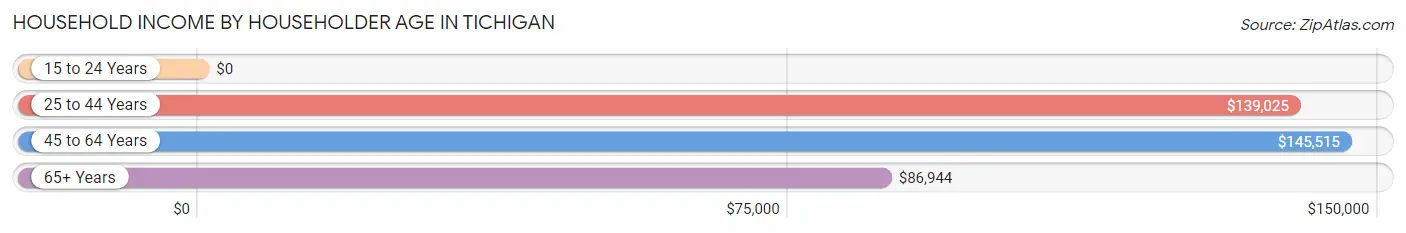
| Income Bracket | # Households | Median Income |
| 15 to 24 Years | 0 (0.0%) | $0 |
| 25 to 44 Years | 443 (25.4%) | $139,025 |
| 45 to 64 Years | 890 (51.0%) | $145,515 |
| 65+ Years | 412 (23.6%) | $86,944 |
| Total | 1,745 (100.0%) | $128,352 |
Poverty in Tichigan
Income Below Poverty by Sex and Age in Tichigan
With 4.0% poverty level for males and 2.5% for females among the residents of Tichigan, 5 year old males and 18 to 24 year old females are the most vulnerable to poverty, with 8 males (53.3%) and 18 females (10.5%) in their respective age groups living below the poverty level.
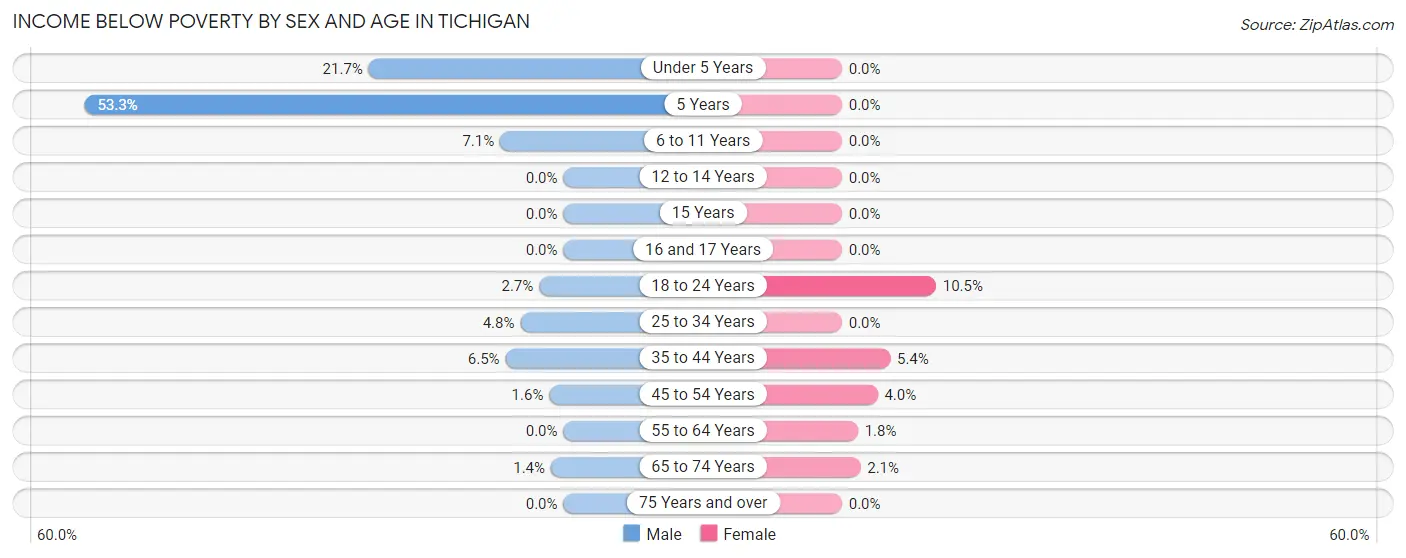
| Age Bracket | Male | Female |
| Under 5 Years | 31 (21.7%) | 0 (0.0%) |
| 5 Years | 8 (53.3%) | 0 (0.0%) |
| 6 to 11 Years | 22 (7.0%) | 0 (0.0%) |
| 12 to 14 Years | 0 (0.0%) | 0 (0.0%) |
| 15 Years | 0 (0.0%) | 0 (0.0%) |
| 16 and 17 Years | 0 (0.0%) | 0 (0.0%) |
| 18 to 24 Years | 4 (2.7%) | 18 (10.5%) |
| 25 to 34 Years | 9 (4.8%) | 0 (0.0%) |
| 35 to 44 Years | 16 (6.5%) | 16 (5.4%) |
| 45 to 54 Years | 8 (1.6%) | 15 (4.0%) |
| 55 to 64 Years | 0 (0.0%) | 8 (1.8%) |
| 65 to 74 Years | 5 (1.4%) | 5 (2.1%) |
| 75 Years and over | 0 (0.0%) | 0 (0.0%) |
| Total | 103 (4.0%) | 62 (2.5%) |
Income Above Poverty by Sex and Age in Tichigan
According to the poverty statistics in Tichigan, males aged 12 to 14 years and females aged under 5 years are the age groups that are most secure financially, with 100.0% of males and 100.0% of females in these age groups living above the poverty line.
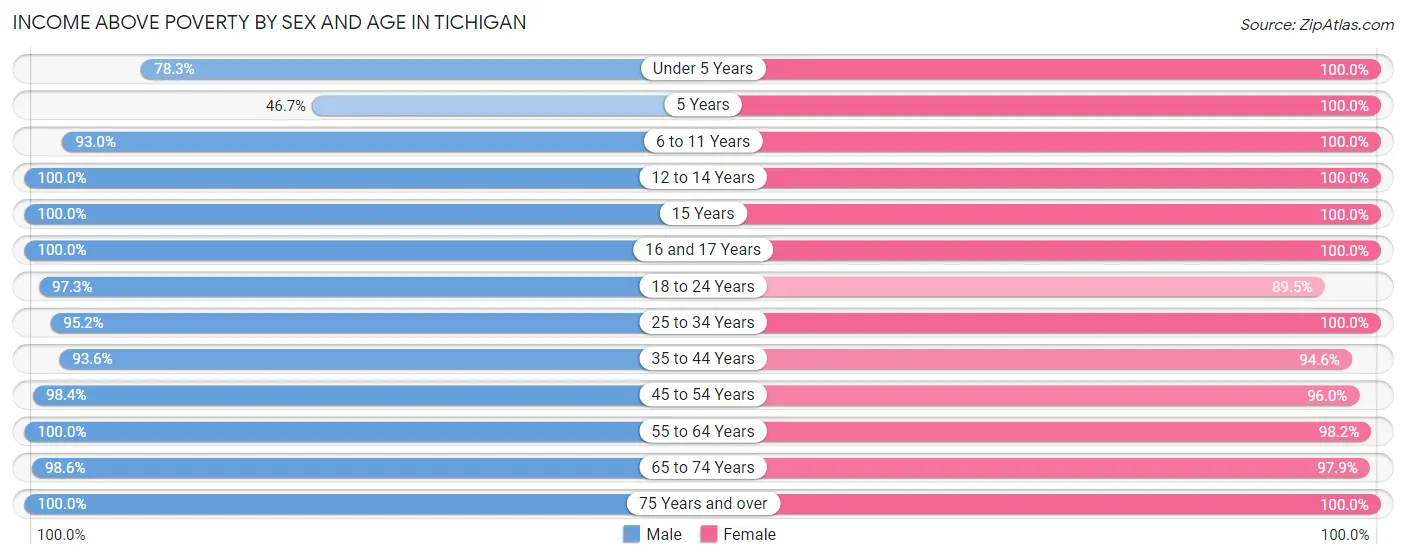
| Age Bracket | Male | Female |
| Under 5 Years | 112 (78.3%) | 141 (100.0%) |
| 5 Years | 7 (46.7%) | 19 (100.0%) |
| 6 to 11 Years | 290 (92.9%) | 221 (100.0%) |
| 12 to 14 Years | 65 (100.0%) | 123 (100.0%) |
| 15 Years | 39 (100.0%) | 41 (100.0%) |
| 16 and 17 Years | 94 (100.0%) | 55 (100.0%) |
| 18 to 24 Years | 144 (97.3%) | 154 (89.5%) |
| 25 to 34 Years | 179 (95.2%) | 161 (100.0%) |
| 35 to 44 Years | 232 (93.5%) | 282 (94.6%) |
| 45 to 54 Years | 500 (98.4%) | 363 (96.0%) |
| 55 to 64 Years | 393 (100.0%) | 444 (98.2%) |
| 65 to 74 Years | 354 (98.6%) | 238 (97.9%) |
| 75 Years and over | 78 (100.0%) | 166 (100.0%) |
| Total | 2,487 (96.0%) | 2,408 (97.5%) |
Income Below Poverty Among Married-Couple Families in Tichigan
The poverty statistics for married-couple families in Tichigan show that 1.4% or 19 of the total 1,339 families live below the poverty line. Families with 3 or 4 children have the highest poverty rate of 11.9%, comprising of 14 families. On the other hand, families with 1 or 2 children have the lowest poverty rate of 0.0%, which includes 0 families.
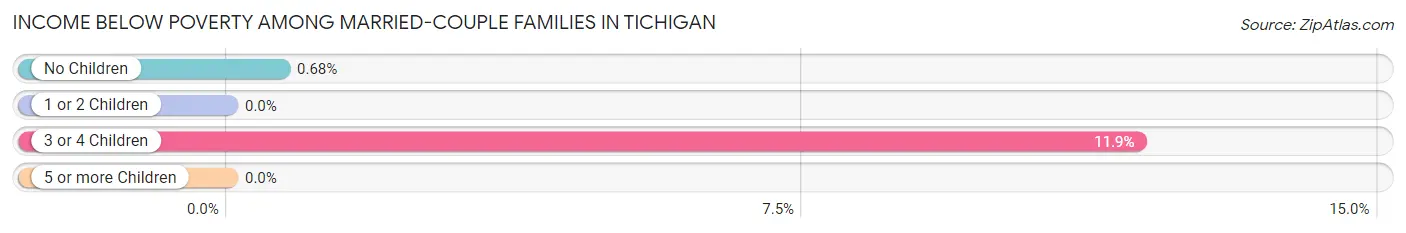
| Children | Above Poverty | Below Poverty |
| No Children | 728 (99.3%) | 5 (0.7%) |
| 1 or 2 Children | 488 (100.0%) | 0 (0.0%) |
| 3 or 4 Children | 104 (88.1%) | 14 (11.9%) |
| 5 or more Children | 0 (0.0%) | 0 (0.0%) |
| Total | 1,320 (98.6%) | 19 (1.4%) |
Income Below Poverty Among Single-Parent Households in Tichigan
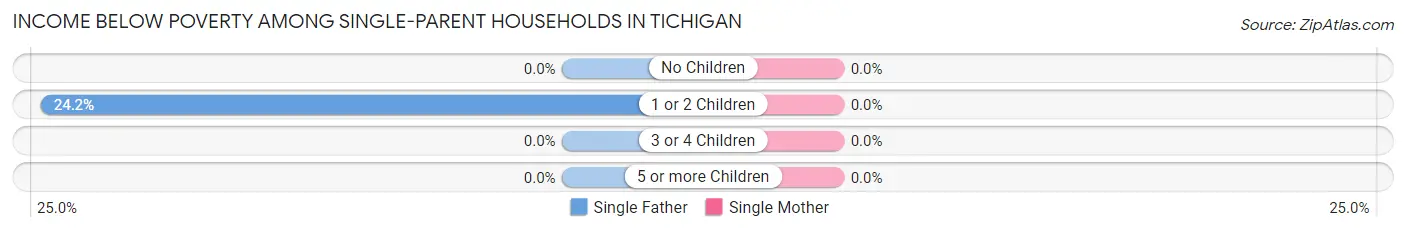
| Children | Single Father | Single Mother |
| No Children | 0 (0.0%) | 0 (0.0%) |
| 1 or 2 Children | 8 (24.2%) | 0 (0.0%) |
| 3 or 4 Children | 0 (0.0%) | 0 (0.0%) |
| 5 or more Children | 0 (0.0%) | 0 (0.0%) |
| Total | 8 (11.8%) | 0 (0.0%) |
Income Below Poverty Among Married-Couple vs Single-Parent Households in Tichigan
The poverty data for Tichigan shows that 19 of the married-couple family households (1.4%) and 8 of the single-parent households (6.3%) are living below the poverty level. Within the married-couple family households, those with 3 or 4 children have the highest poverty rate, with 14 households (11.9%) falling below the poverty line. Among the single-parent households, those with 1 or 2 children have the highest poverty rate, with 8 household (16.0%) living below poverty.
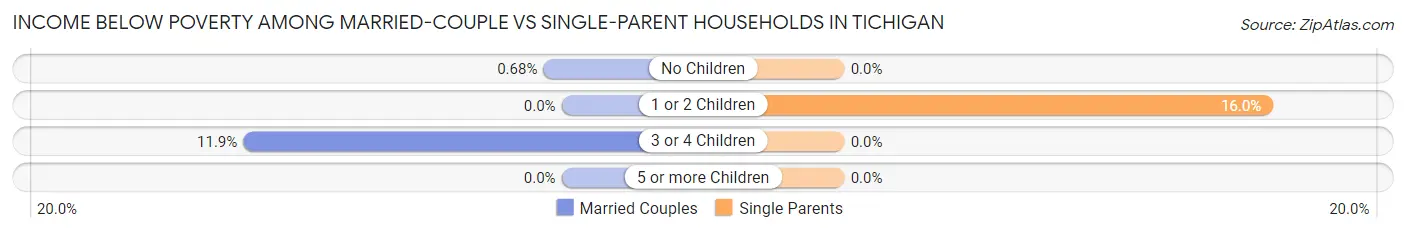
| Children | Married-Couple Families | Single-Parent Households |
| No Children | 5 (0.7%) | 0 (0.0%) |
| 1 or 2 Children | 0 (0.0%) | 8 (16.0%) |
| 3 or 4 Children | 14 (11.9%) | 0 (0.0%) |
| 5 or more Children | 0 (0.0%) | 0 (0.0%) |
| Total | 19 (1.4%) | 8 (6.3%) |
Race in Tichigan
The most populous races in Tichigan are White / Caucasian (4,728 | 93.4%), Hispanic or Latino (268 | 5.3%), and Two or more Races (226 | 4.5%).
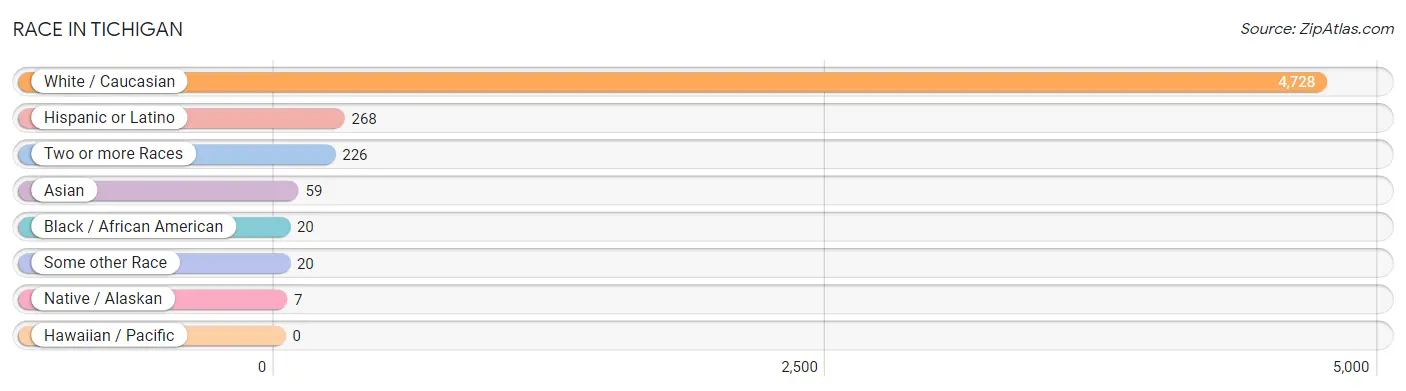
| Race | # Population | % Population |
| Asian | 59 | 1.2% |
| Black / African American | 20 | 0.4% |
| Hawaiian / Pacific | 0 | 0.0% |
| Hispanic or Latino | 268 | 5.3% |
| Native / Alaskan | 7 | 0.1% |
| White / Caucasian | 4,728 | 93.4% |
| Two or more Races | 226 | 4.5% |
| Some other Race | 20 | 0.4% |
| Total | 5,060 | 100.0% |
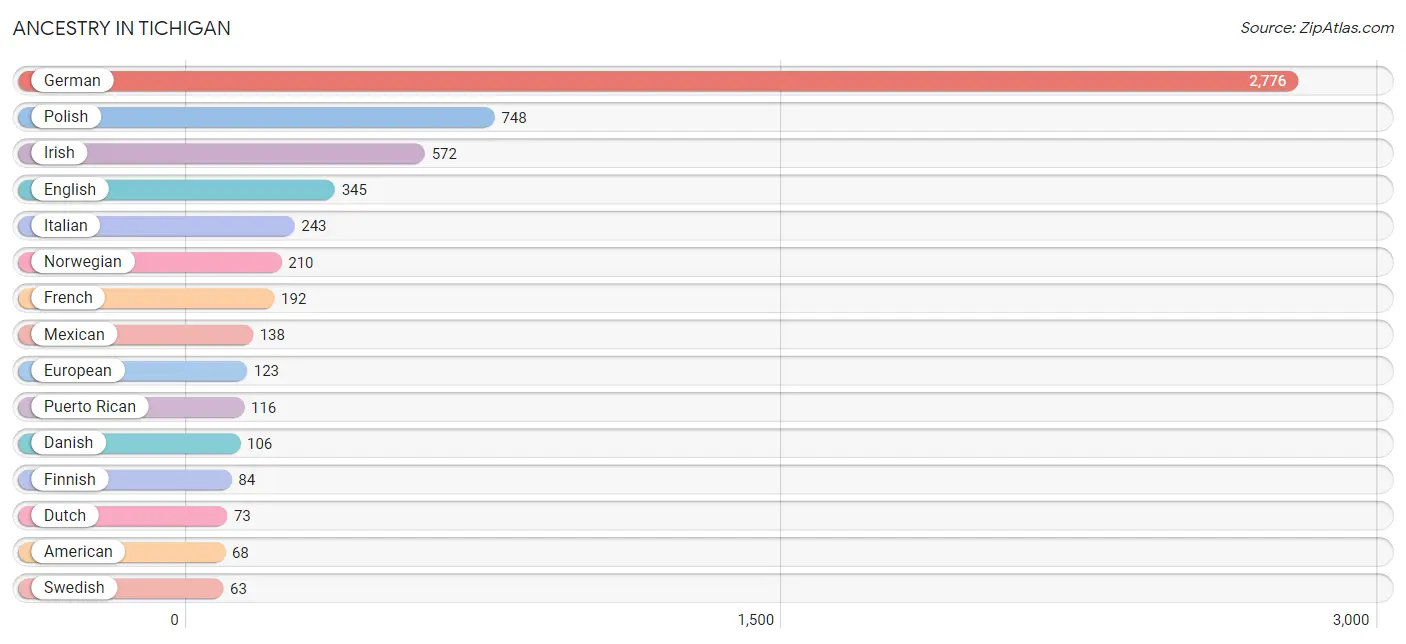
Ancestry in Tichigan
The most populous ancestries reported in Tichigan are German (2,776 | 54.9%), Polish (748 | 14.8%), Irish (572 | 11.3%), English (345 | 6.8%), and Italian (243 | 4.8%), together accounting for 92.6% of all Tichigan residents.
| Ancestry | # Population | % Population |
| American | 68 | 1.3% |
| Argentinean | 2 | 0.0% |
| Armenian | 34 | 0.7% |
| Austrian | 19 | 0.4% |
| Belgian | 2 | 0.0% |
| Burmese | 53 | 1.1% |
| Cherokee | 2 | 0.0% |
| Croatian | 7 | 0.1% |
| Czech | 38 | 0.7% |
| Danish | 106 | 2.1% |
| Dutch | 73 | 1.4% |
| English | 345 | 6.8% |
| European | 123 | 2.4% |
| Finnish | 84 | 1.7% |
| French | 192 | 3.8% |
| French American Indian | 21 | 0.4% |
| French Canadian | 22 | 0.4% |
| German | 2,776 | 54.9% |
| Greek | 18 | 0.4% |
| Haitian | 12 | 0.2% |
| Hungarian | 52 | 1.0% |
| Irish | 572 | 11.3% |
| Italian | 243 | 4.8% |
| Latvian | 19 | 0.4% |
| Lithuanian | 3 | 0.1% |
| Luxembourger | 17 | 0.3% |
| Mexican | 138 | 2.7% |
| Norwegian | 210 | 4.2% |
| Pennsylvania German | 3 | 0.1% |
| Polish | 748 | 14.8% |
| Puerto Rican | 116 | 2.3% |
| Russian | 20 | 0.4% |
| Scandinavian | 22 | 0.4% |
| Scotch-Irish | 49 | 1.0% |
| Scottish | 48 | 0.9% |
| Sioux | 5 | 0.1% |
| Slavic | 6 | 0.1% |
| Slovak | 9 | 0.2% |
| Slovene | 29 | 0.6% |
| South American | 2 | 0.0% |
| South American Indian | 2 | 0.0% |
| Swedish | 63 | 1.3% |
| Swiss | 17 | 0.3% |
| Thai | 6 | 0.1% |
| Ukrainian | 15 | 0.3% |
| Welsh | 18 | 0.4% | View All 46 Rows |
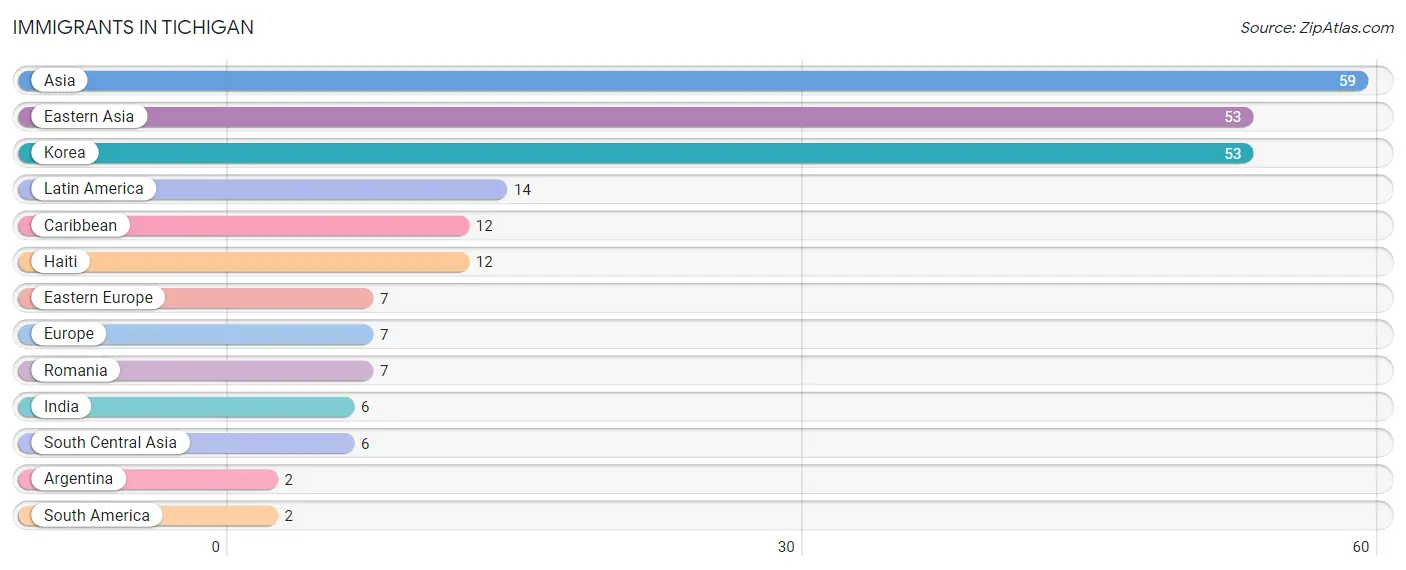
Immigrants in Tichigan
The most numerous immigrant groups reported in Tichigan came from Asia (59 | 1.2%), Eastern Asia (53 | 1.1%), Korea (53 | 1.1%), Latin America (14 | 0.3%), and Caribbean (12 | 0.2%), together accounting for 3.8% of all Tichigan residents.
| Immigration Origin | # Population | % Population |
| Argentina | 2 | 0.0% |
| Asia | 59 | 1.2% |
| Caribbean | 12 | 0.2% |
| Eastern Asia | 53 | 1.1% |
| Eastern Europe | 7 | 0.1% |
| Europe | 7 | 0.1% |
| Haiti | 12 | 0.2% |
| India | 6 | 0.1% |
| Korea | 53 | 1.1% |
| Latin America | 14 | 0.3% |
| Romania | 7 | 0.1% |
| South America | 2 | 0.0% |
| South Central Asia | 6 | 0.1% | View All 13 Rows |
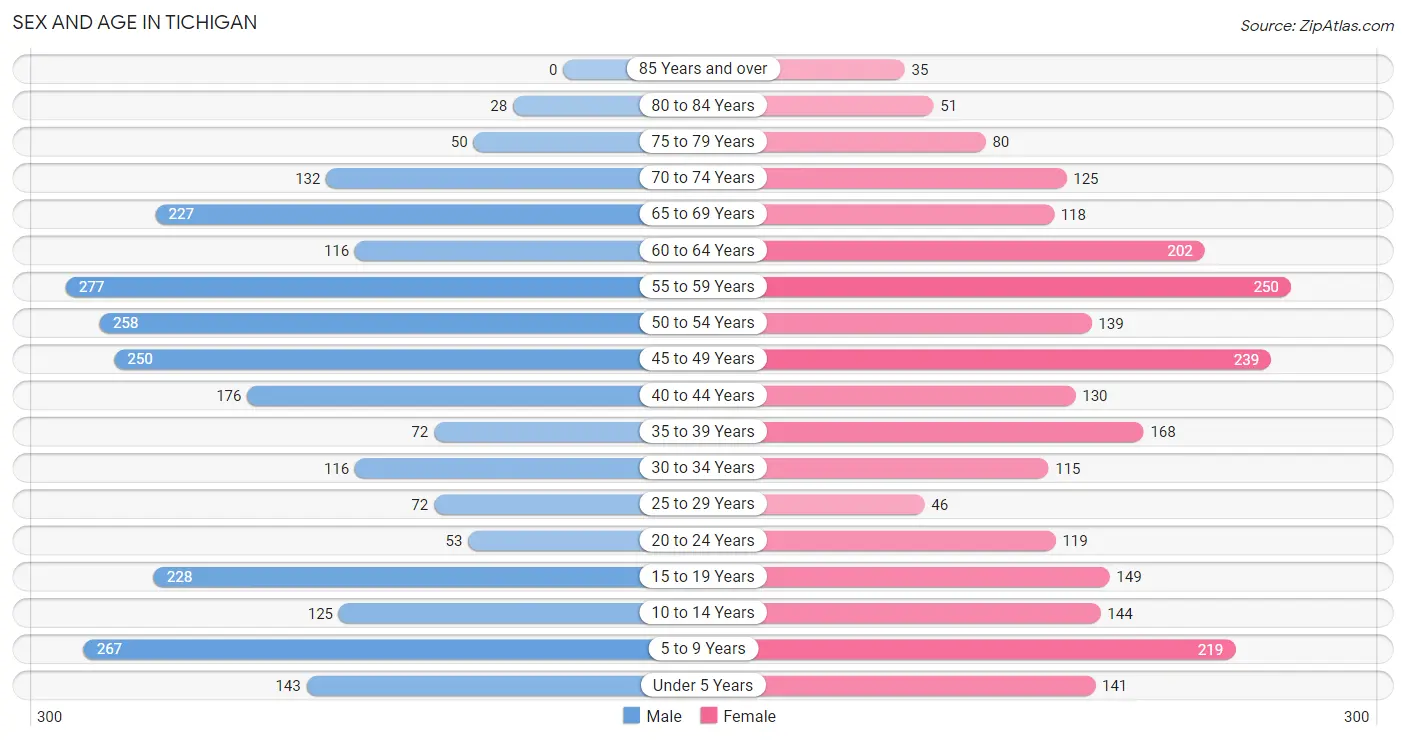
Sex and Age in Tichigan
Sex and Age in Tichigan
The most populous age groups in Tichigan are 55 to 59 Years (277 | 10.7%) for men and 55 to 59 Years (250 | 10.1%) for women.
| Age Bracket | Male | Female |
| Under 5 Years | 143 (5.5%) | 141 (5.7%) |
| 5 to 9 Years | 267 (10.3%) | 219 (8.9%) |
| 10 to 14 Years | 125 (4.8%) | 144 (5.8%) |
| 15 to 19 Years | 228 (8.8%) | 149 (6.0%) |
| 20 to 24 Years | 53 (2.1%) | 119 (4.8%) |
| 25 to 29 Years | 72 (2.8%) | 46 (1.9%) |
| 30 to 34 Years | 116 (4.5%) | 115 (4.7%) |
| 35 to 39 Years | 72 (2.8%) | 168 (6.8%) |
| 40 to 44 Years | 176 (6.8%) | 130 (5.3%) |
| 45 to 49 Years | 250 (9.7%) | 239 (9.7%) |
| 50 to 54 Years | 258 (10.0%) | 139 (5.6%) |
| 55 to 59 Years | 277 (10.7%) | 250 (10.1%) |
| 60 to 64 Years | 116 (4.5%) | 202 (8.2%) |
| 65 to 69 Years | 227 (8.8%) | 118 (4.8%) |
| 70 to 74 Years | 132 (5.1%) | 125 (5.1%) |
| 75 to 79 Years | 50 (1.9%) | 80 (3.2%) |
| 80 to 84 Years | 28 (1.1%) | 51 (2.1%) |
| 85 Years and over | 0 (0.0%) | 35 (1.4%) |
| Total | 2,590 (100.0%) | 2,470 (100.0%) |
Families and Households in Tichigan
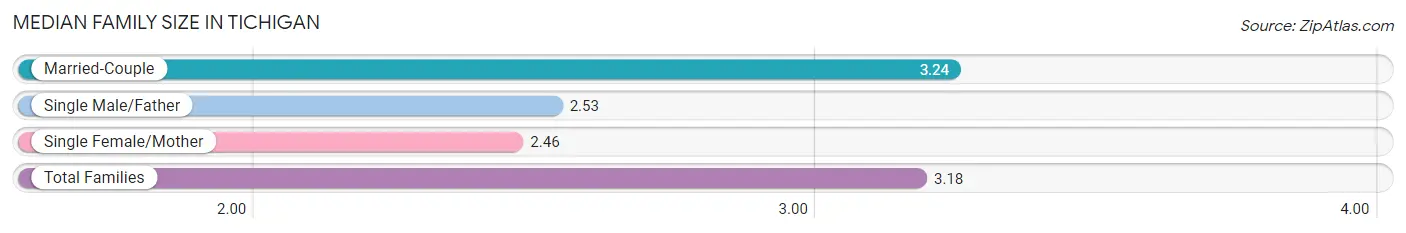
Median Family Size in Tichigan
The median family size in Tichigan is 3.18 persons per family, with married-couple families (1,339 | 91.3%) accounting for the largest median family size of 3.24 persons per family. On the other hand, single female/mother families (59 | 4.0%) represent the smallest median family size with 2.46 persons per family.
| Family Type | # Families | Family Size |
| Married-Couple | 1,339 (91.3%) | 3.24 |
| Single Male/Father | 68 (4.6%) | 2.53 |
| Single Female/Mother | 59 (4.0%) | 2.46 |
| Total Families | 1,466 (100.0%) | 3.18 |
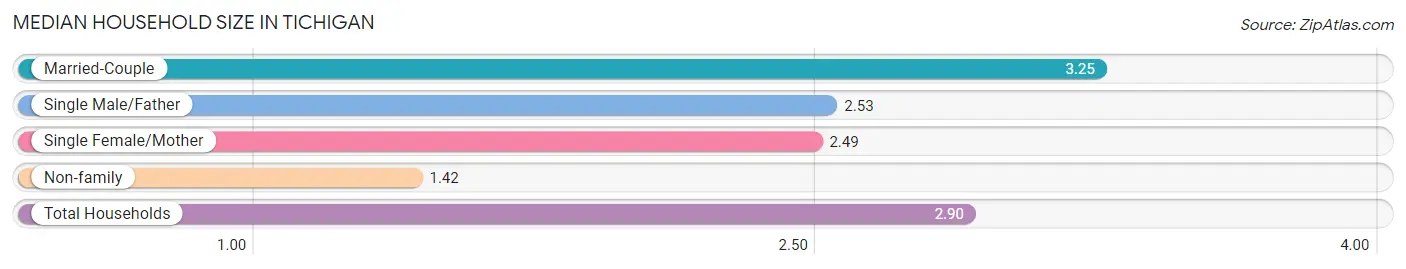
Median Household Size in Tichigan
The median household size in Tichigan is 2.90 persons per household, with married-couple households (1,339 | 76.7%) accounting for the largest median household size of 3.25 persons per household. non-family households (279 | 16.0%) represent the smallest median household size with 1.42 persons per household.
| Household Type | # Households | Household Size |
| Married-Couple | 1,339 (76.7%) | 3.25 |
| Single Male/Father | 68 (3.9%) | 2.53 |
| Single Female/Mother | 59 (3.4%) | 2.49 |
| Non-family | 279 (16.0%) | 1.42 |
| Total Households | 1,745 (100.0%) | 2.90 |
Household Size by Marriage Status in Tichigan
Out of a total of 1,745 households in Tichigan, 1,466 (84.0%) are family households, while 279 (16.0%) are nonfamily households. The most numerous type of family households are 2-person households, comprising 696, and the most common type of nonfamily households are 1-person households, comprising 204.
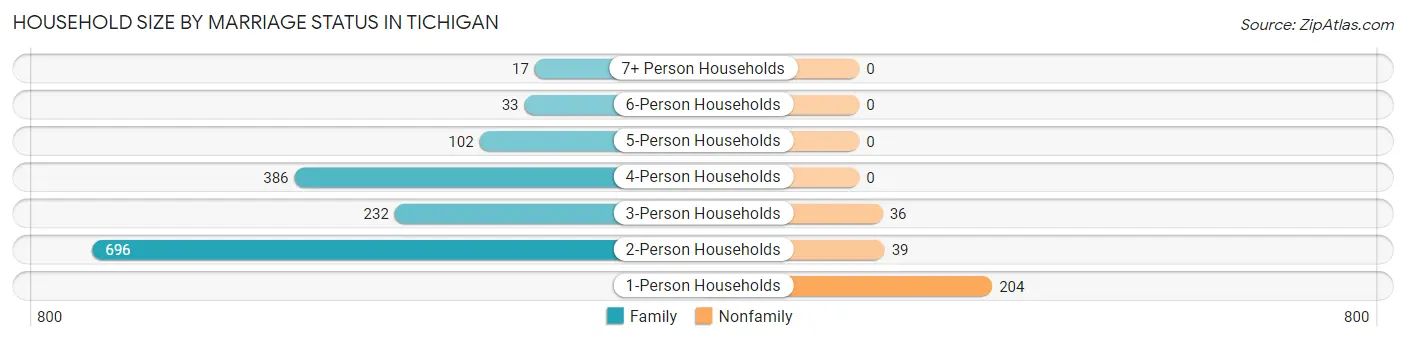
| Household Size | Family Households | Nonfamily Households |
| 1-Person Households | - | 204 (11.7%) |
| 2-Person Households | 696 (39.9%) | 39 (2.2%) |
| 3-Person Households | 232 (13.3%) | 36 (2.1%) |
| 4-Person Households | 386 (22.1%) | 0 (0.0%) |
| 5-Person Households | 102 (5.9%) | 0 (0.0%) |
| 6-Person Households | 33 (1.9%) | 0 (0.0%) |
| 7+ Person Households | 17 (1.0%) | 0 (0.0%) |
| Total | 1,466 (84.0%) | 279 (16.0%) |
Female Fertility in Tichigan
Fertility by Age in Tichigan
Average fertility rate in Tichigan is 9.0 births per 1,000 women. Women in the age bracket of 35 to 50 years have the highest fertility rate with 16.0 births per 1,000 women. Women in the age bracket of 35 to 50 years acount for 100.0% of all women with births.
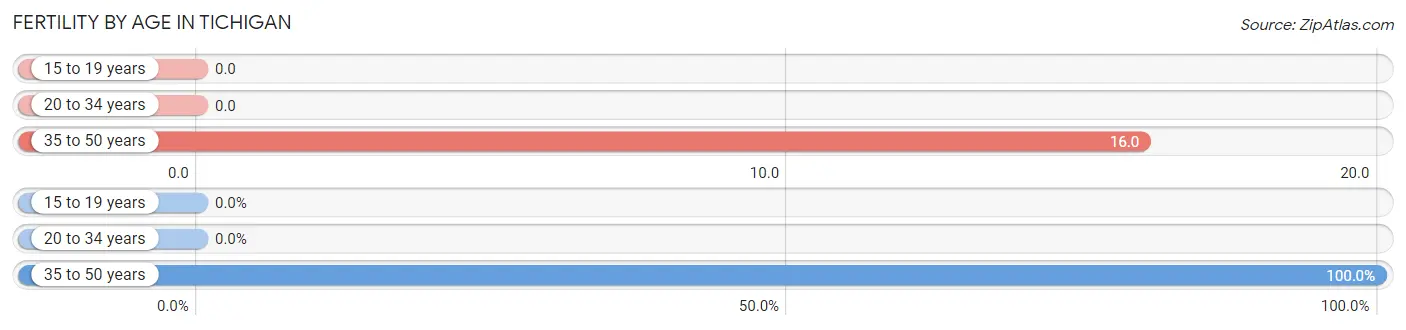
| Age Bracket | Women with Births | Births / 1,000 Women |
| 15 to 19 years | 0 (0.0%) | 0.0 |
| 20 to 34 years | 0 (0.0%) | 0.0 |
| 35 to 50 years | 9 (100.0%) | 16.0 |
| Total | 9 (100.0%) | 9.0 |
Fertility by Age by Marriage Status in Tichigan
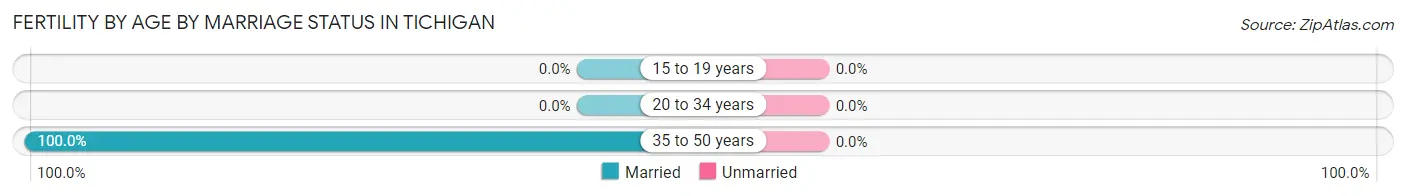
| Age Bracket | Married | Unmarried |
| 15 to 19 years | 0 (0.0%) | 0 (0.0%) |
| 20 to 34 years | 0 (0.0%) | 0 (0.0%) |
| 35 to 50 years | 9 (100.0%) | 0 (0.0%) |
| Total | 9 (100.0%) | 0 (0.0%) |
Fertility by Education in Tichigan
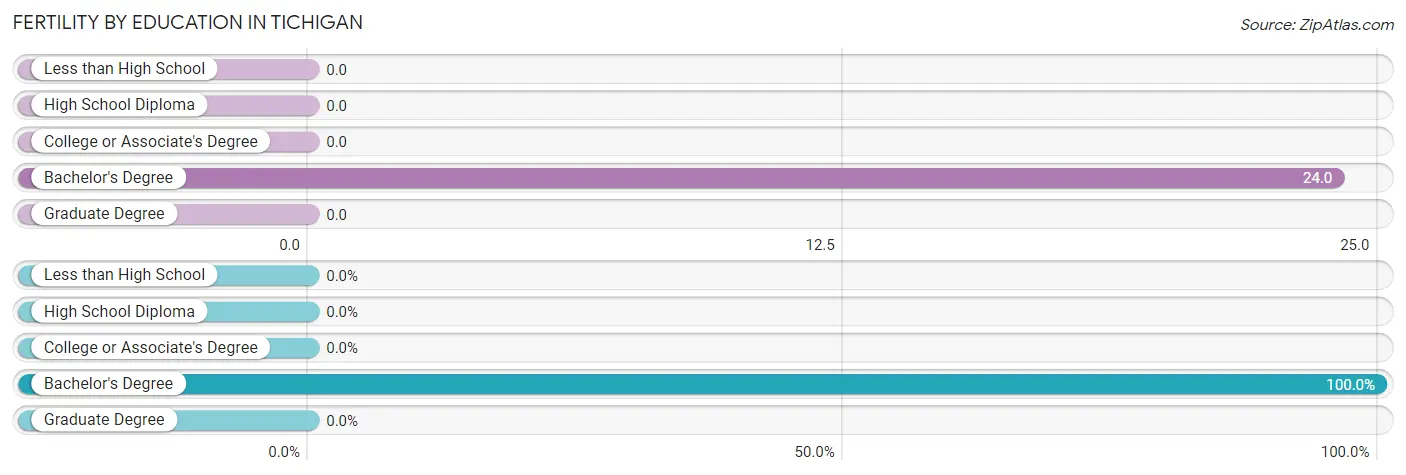
| Educational Attainment | Women with Births | Births / 1,000 Women |
| Less than High School | 0 (0.0%) | 0.0 |
| High School Diploma | 0 (0.0%) | 0.0 |
| College or Associate's Degree | 0 (0.0%) | 0.0 |
| Bachelor's Degree | 9 (100.0%) | 24.0 |
| Graduate Degree | 0 (0.0%) | 0.0 |
| Total | 9 (100.0%) | 9.0 |
Fertility by Education by Marriage Status in Tichigan
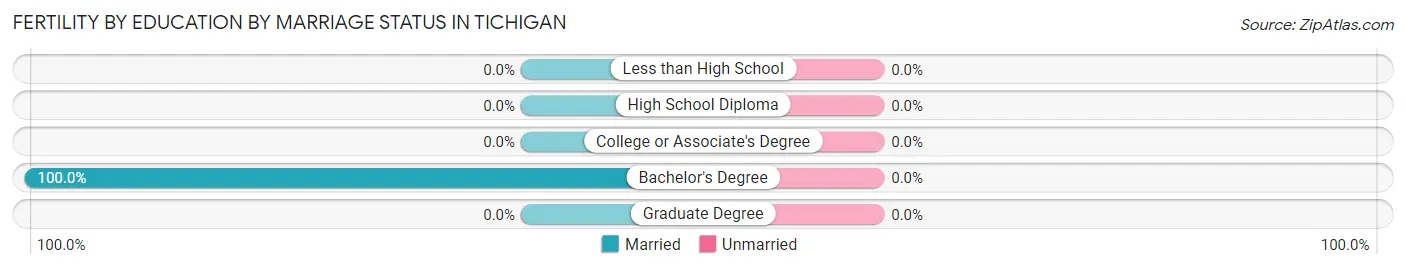
| Educational Attainment | Married | Unmarried |
| Less than High School | 0 (0.0%) | 0 (0.0%) |
| High School Diploma | 0 (0.0%) | 0 (0.0%) |
| College or Associate's Degree | 0 (0.0%) | 0 (0.0%) |
| Bachelor's Degree | 9 (100.0%) | 0 (0.0%) |
| Graduate Degree | 0 (0.0%) | 0 (0.0%) |
| Total | 9 (100.0%) | 0 (0.0%) |
Employment Characteristics in Tichigan
Employment by Class of Employer in Tichigan
Among the 2,707 employed individuals in Tichigan, private company employees (1,987 | 73.4%), not-for-profit organizations (249 | 9.2%), and local government employees (190 | 7.0%) make up the most common classes of employment.
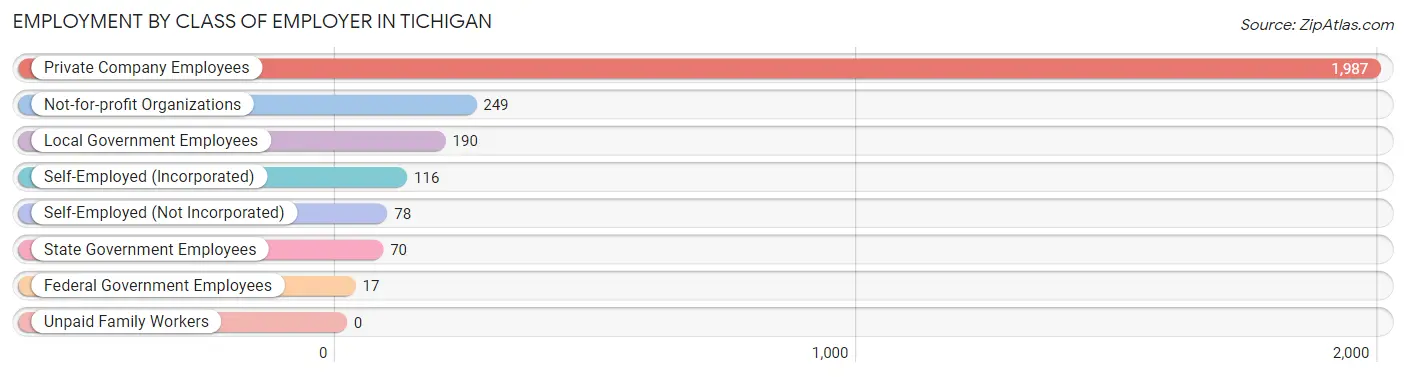
| Employer Class | # Employees | % Employees |
| Private Company Employees | 1,987 | 73.4% |
| Self-Employed (Incorporated) | 116 | 4.3% |
| Self-Employed (Not Incorporated) | 78 | 2.9% |
| Not-for-profit Organizations | 249 | 9.2% |
| Local Government Employees | 190 | 7.0% |
| State Government Employees | 70 | 2.6% |
| Federal Government Employees | 17 | 0.6% |
| Unpaid Family Workers | 0 | 0.0% |
| Total | 2,707 | 100.0% |
Employment Status by Age in Tichigan
According to the labor force statistics for Tichigan, out of the total population over 16 years of age (3,941), 74.4% or 2,932 individuals are in the labor force, with 2.8% or 82 of them unemployed. The age group with the highest labor force participation rate is 20 to 24 years, with 100.0% or 172 individuals in the labor force. Within the labor force, the 16 to 19 years age range has the highest percentage of unemployed individuals, with 29.1% or 60 of them being unemployed.
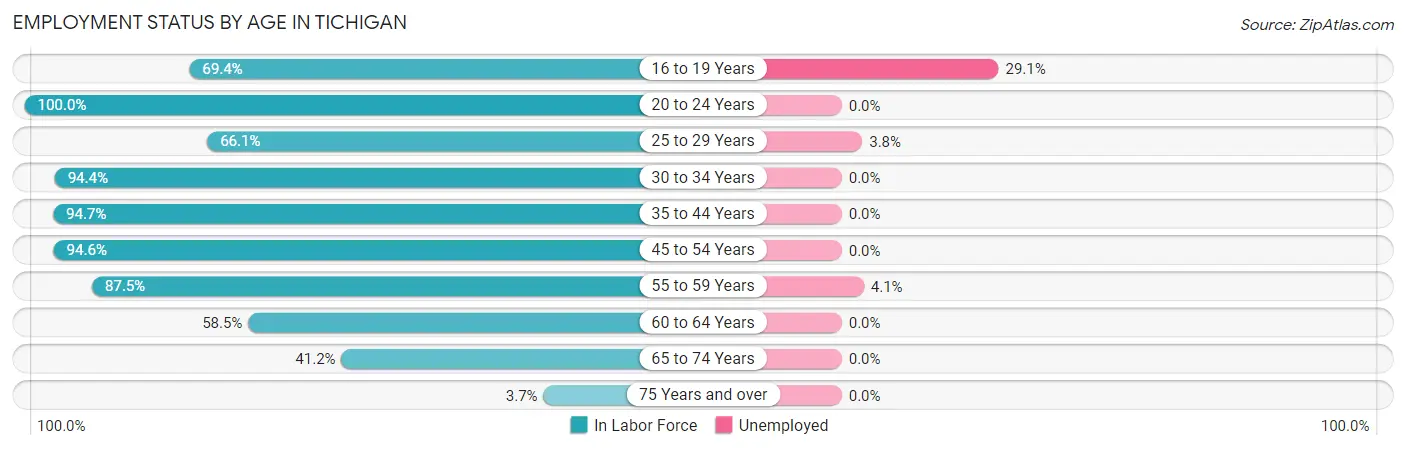
| Age Bracket | In Labor Force | Unemployed |
| 16 to 19 Years | 206 (69.4%) | 60 (29.1%) |
| 20 to 24 Years | 172 (100.0%) | 0 (0.0%) |
| 25 to 29 Years | 78 (66.1%) | 3 (3.8%) |
| 30 to 34 Years | 218 (94.4%) | 0 (0.0%) |
| 35 to 44 Years | 517 (94.7%) | 0 (0.0%) |
| 45 to 54 Years | 838 (94.6%) | 0 (0.0%) |
| 55 to 59 Years | 461 (87.5%) | 19 (4.1%) |
| 60 to 64 Years | 186 (58.5%) | 0 (0.0%) |
| 65 to 74 Years | 248 (41.2%) | 0 (0.0%) |
| 75 Years and over | 9 (3.7%) | 0 (0.0%) |
| Total | 2,932 (74.4%) | 82 (2.8%) |
Employment Status by Educational Attainment in Tichigan
According to labor force statistics for Tichigan, 87.5% of individuals (2,298) out of the total population between 25 and 64 years of age (2,626) are in the labor force, with 1.0% or 23 of them being unemployed. The group with the highest labor force participation rate are those with the educational attainment of bachelor's degree or higher, with 93.3% or 1,057 individuals in the labor force. Within the labor force, individuals with high school diploma education have the highest percentage of unemployment, with 3.5% or 19 of them being unemployed.
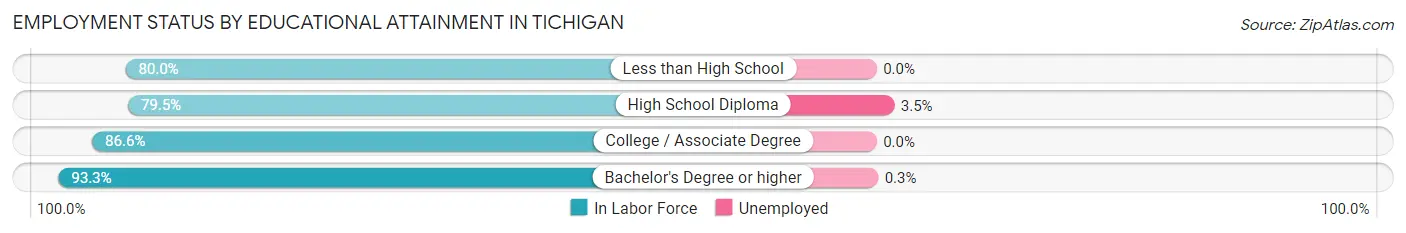
| Educational Attainment | In Labor Force | Unemployed |
| Less than High School | 40 (80.0%) | 0 (0.0%) |
| High School Diploma | 538 (79.5%) | 24 (3.5%) |
| College / Associate Degree | 663 (86.6%) | 0 (0.0%) |
| Bachelor's Degree or higher | 1,057 (93.3%) | 3 (0.3%) |
| Total | 2,298 (87.5%) | 26 (1.0%) |
Employment Occupations by Sex in Tichigan
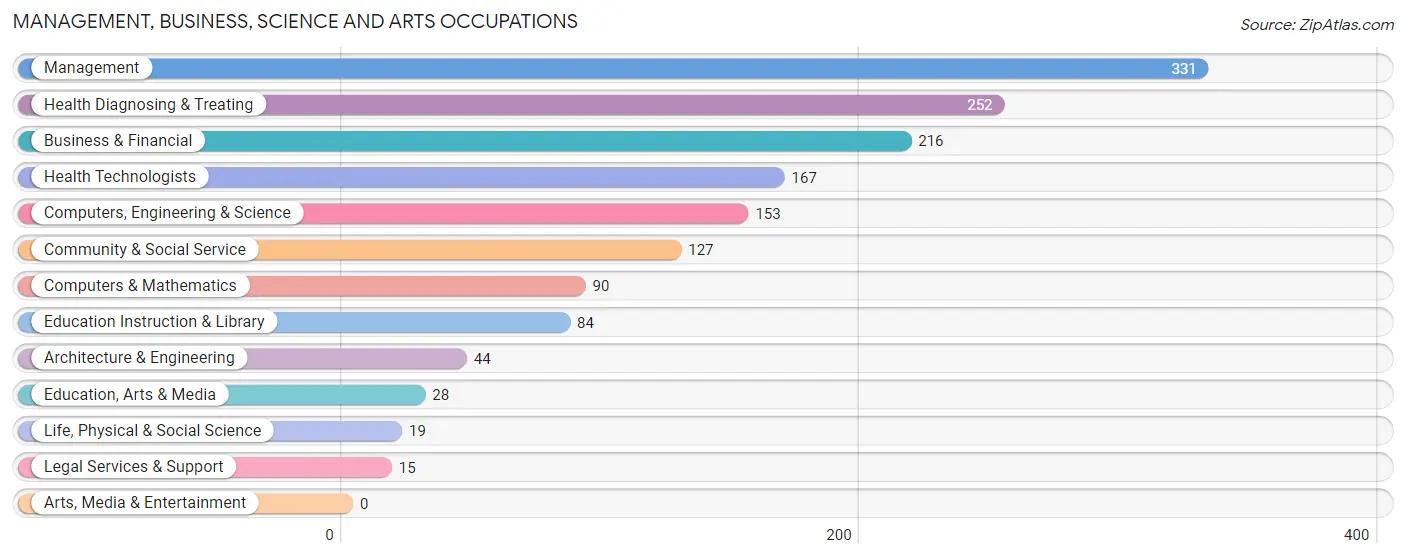
Management, Business, Science and Arts Occupations
The most common Management, Business, Science and Arts occupations in Tichigan are Management (331 | 11.6%), Health Diagnosing & Treating (252 | 8.8%), Business & Financial (216 | 7.6%), Health Technologists (167 | 5.9%), and Computers, Engineering & Science (153 | 5.4%).
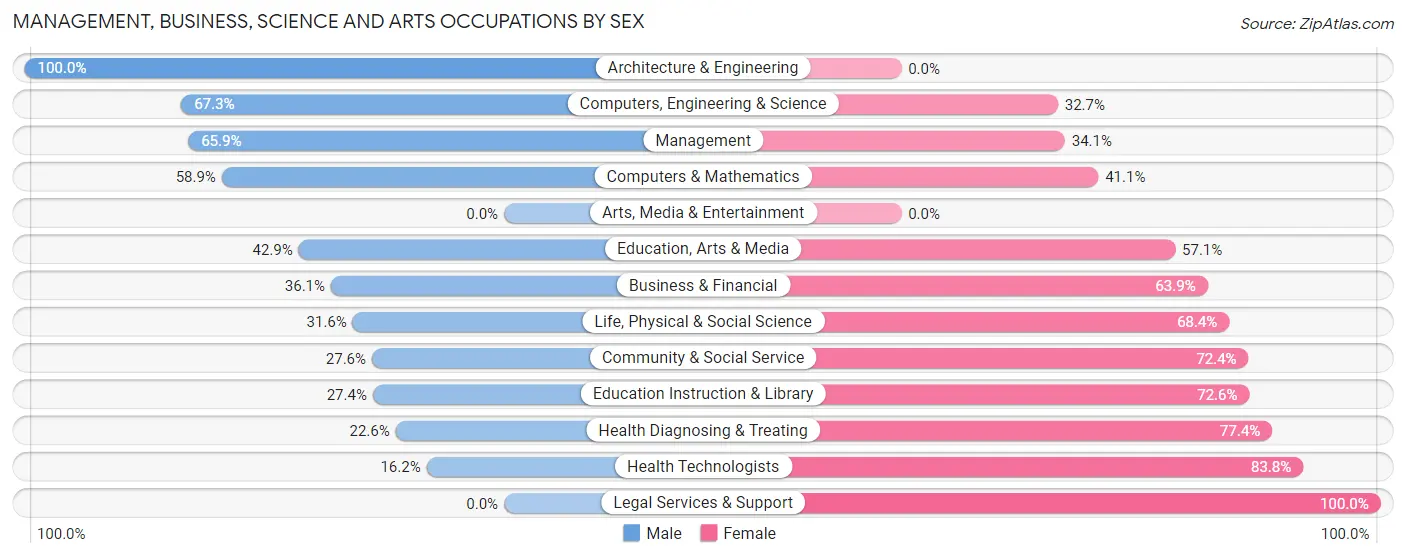
Management, Business, Science and Arts Occupations by Sex
Within the Management, Business, Science and Arts occupations in Tichigan, the most male-oriented occupations are Architecture & Engineering (100.0%), Computers, Engineering & Science (67.3%), and Management (65.9%), while the most female-oriented occupations are Legal Services & Support (100.0%), Health Technologists (83.8%), and Health Diagnosing & Treating (77.4%).
| Occupation | Male | Female |
| Management | 218 (65.9%) | 113 (34.1%) |
| Business & Financial | 78 (36.1%) | 138 (63.9%) |
| Computers, Engineering & Science | 103 (67.3%) | 50 (32.7%) |
| Computers & Mathematics | 53 (58.9%) | 37 (41.1%) |
| Architecture & Engineering | 44 (100.0%) | 0 (0.0%) |
| Life, Physical & Social Science | 6 (31.6%) | 13 (68.4%) |
| Community & Social Service | 35 (27.6%) | 92 (72.4%) |
| Education, Arts & Media | 12 (42.9%) | 16 (57.1%) |
| Legal Services & Support | 0 (0.0%) | 15 (100.0%) |
| Education Instruction & Library | 23 (27.4%) | 61 (72.6%) |
| Arts, Media & Entertainment | 0 (0.0%) | 0 (0.0%) |
| Health Diagnosing & Treating | 57 (22.6%) | 195 (77.4%) |
| Health Technologists | 27 (16.2%) | 140 (83.8%) |
| Total (Category) | 491 (45.5%) | 588 (54.5%) |
| Total (Overall) | 1,589 (55.7%) | 1,262 (44.3%) |
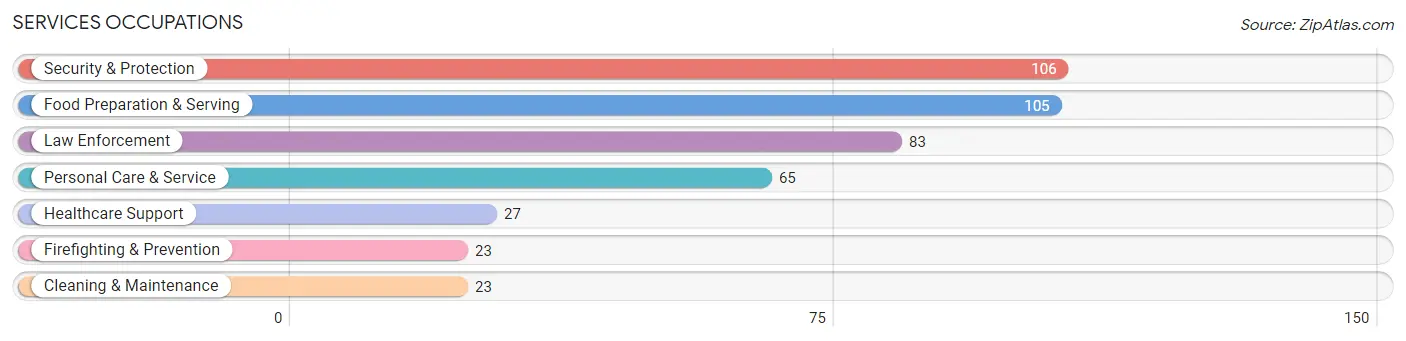
Services Occupations
The most common Services occupations in Tichigan are Security & Protection (106 | 3.7%), Food Preparation & Serving (105 | 3.7%), Law Enforcement (83 | 2.9%), Personal Care & Service (65 | 2.3%), and Healthcare Support (27 | 0.9%).
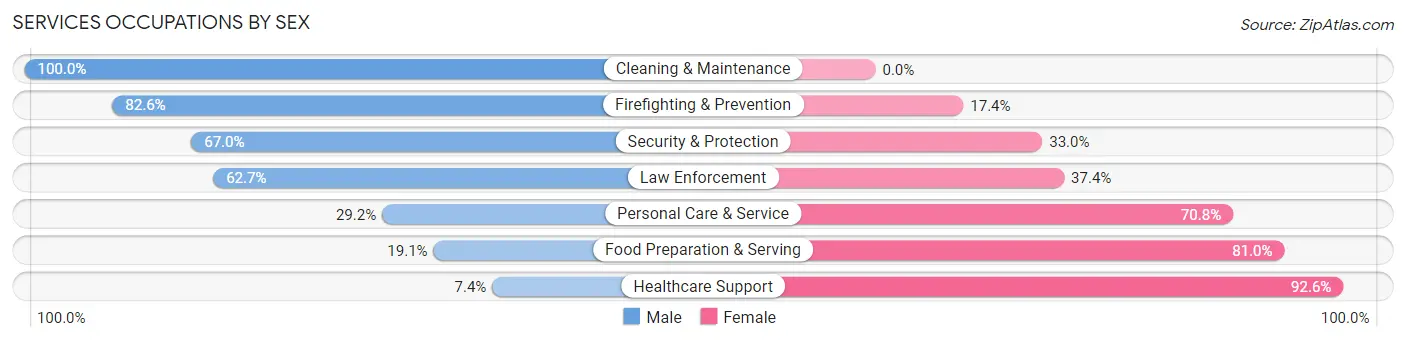
Services Occupations by Sex
Within the Services occupations in Tichigan, the most male-oriented occupations are Cleaning & Maintenance (100.0%), Firefighting & Prevention (82.6%), and Security & Protection (67.0%), while the most female-oriented occupations are Healthcare Support (92.6%), Food Preparation & Serving (80.9%), and Personal Care & Service (70.8%).
| Occupation | Male | Female |
| Healthcare Support | 2 (7.4%) | 25 (92.6%) |
| Security & Protection | 71 (67.0%) | 35 (33.0%) |
| Firefighting & Prevention | 19 (82.6%) | 4 (17.4%) |
| Law Enforcement | 52 (62.6%) | 31 (37.3%) |
| Food Preparation & Serving | 20 (19.1%) | 85 (80.9%) |
| Cleaning & Maintenance | 23 (100.0%) | 0 (0.0%) |
| Personal Care & Service | 19 (29.2%) | 46 (70.8%) |
| Total (Category) | 135 (41.4%) | 191 (58.6%) |
| Total (Overall) | 1,589 (55.7%) | 1,262 (44.3%) |
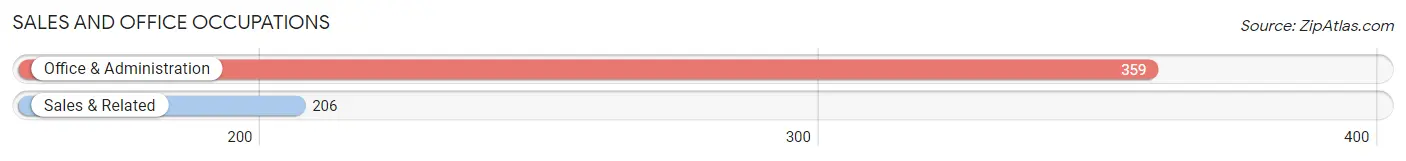
Sales and Office Occupations
The most common Sales and Office occupations in Tichigan are Office & Administration (359 | 12.6%), and Sales & Related (206 | 7.2%).
Sales and Office Occupations by Sex
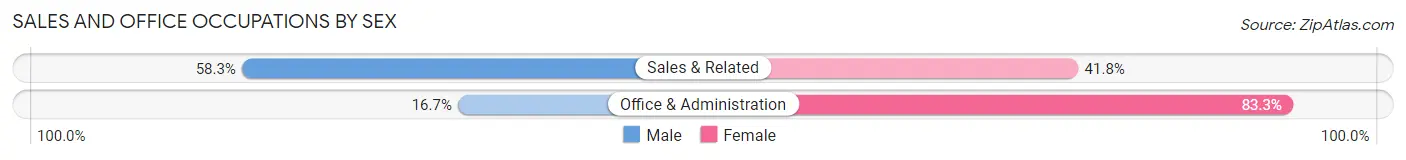
| Occupation | Male | Female |
| Sales & Related | 120 (58.3%) | 86 (41.7%) |
| Office & Administration | 60 (16.7%) | 299 (83.3%) |
| Total (Category) | 180 (31.9%) | 385 (68.1%) |
| Total (Overall) | 1,589 (55.7%) | 1,262 (44.3%) |
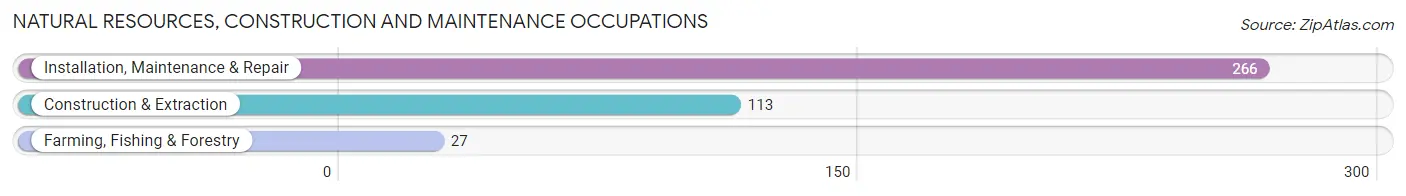
Natural Resources, Construction and Maintenance Occupations
The most common Natural Resources, Construction and Maintenance occupations in Tichigan are Installation, Maintenance & Repair (266 | 9.3%), Construction & Extraction (113 | 4.0%), and Farming, Fishing & Forestry (27 | 0.9%).
Natural Resources, Construction and Maintenance Occupations by Sex
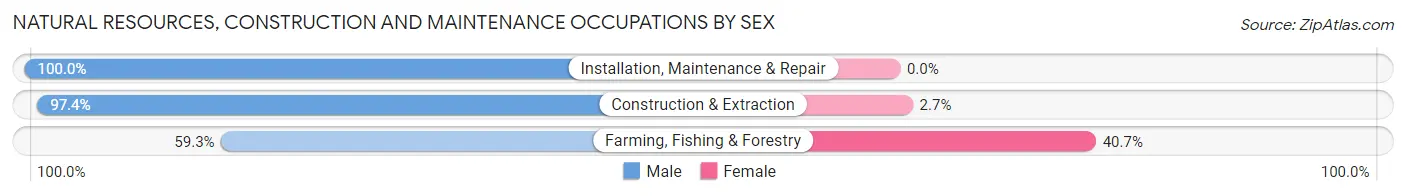
| Occupation | Male | Female |
| Farming, Fishing & Forestry | 16 (59.3%) | 11 (40.7%) |
| Construction & Extraction | 110 (97.4%) | 3 (2.6%) |
| Installation, Maintenance & Repair | 266 (100.0%) | 0 (0.0%) |
| Total (Category) | 392 (96.6%) | 14 (3.5%) |
| Total (Overall) | 1,589 (55.7%) | 1,262 (44.3%) |
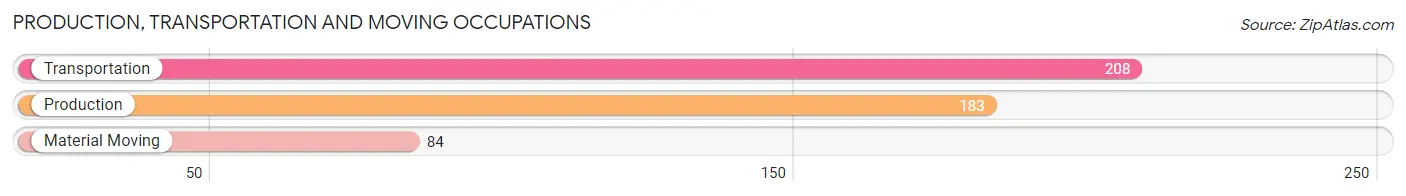
Production, Transportation and Moving Occupations
The most common Production, Transportation and Moving occupations in Tichigan are Transportation (208 | 7.3%), Production (183 | 6.4%), and Material Moving (84 | 2.9%).
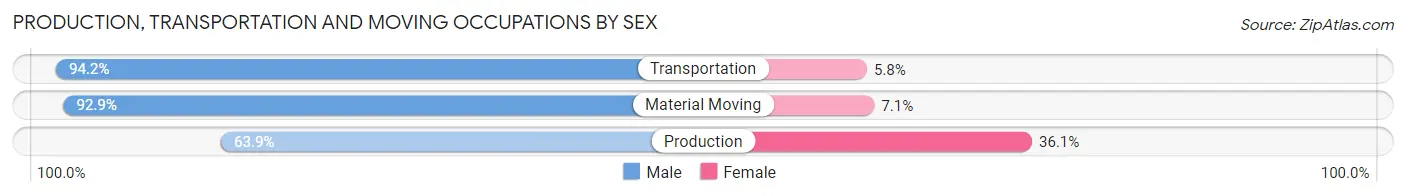
Production, Transportation and Moving Occupations by Sex
| Occupation | Male | Female |
| Production | 117 (63.9%) | 66 (36.1%) |
| Transportation | 196 (94.2%) | 12 (5.8%) |
| Material Moving | 78 (92.9%) | 6 (7.1%) |
| Total (Category) | 391 (82.3%) | 84 (17.7%) |
| Total (Overall) | 1,589 (55.7%) | 1,262 (44.3%) |
Employment Industries by Sex in Tichigan
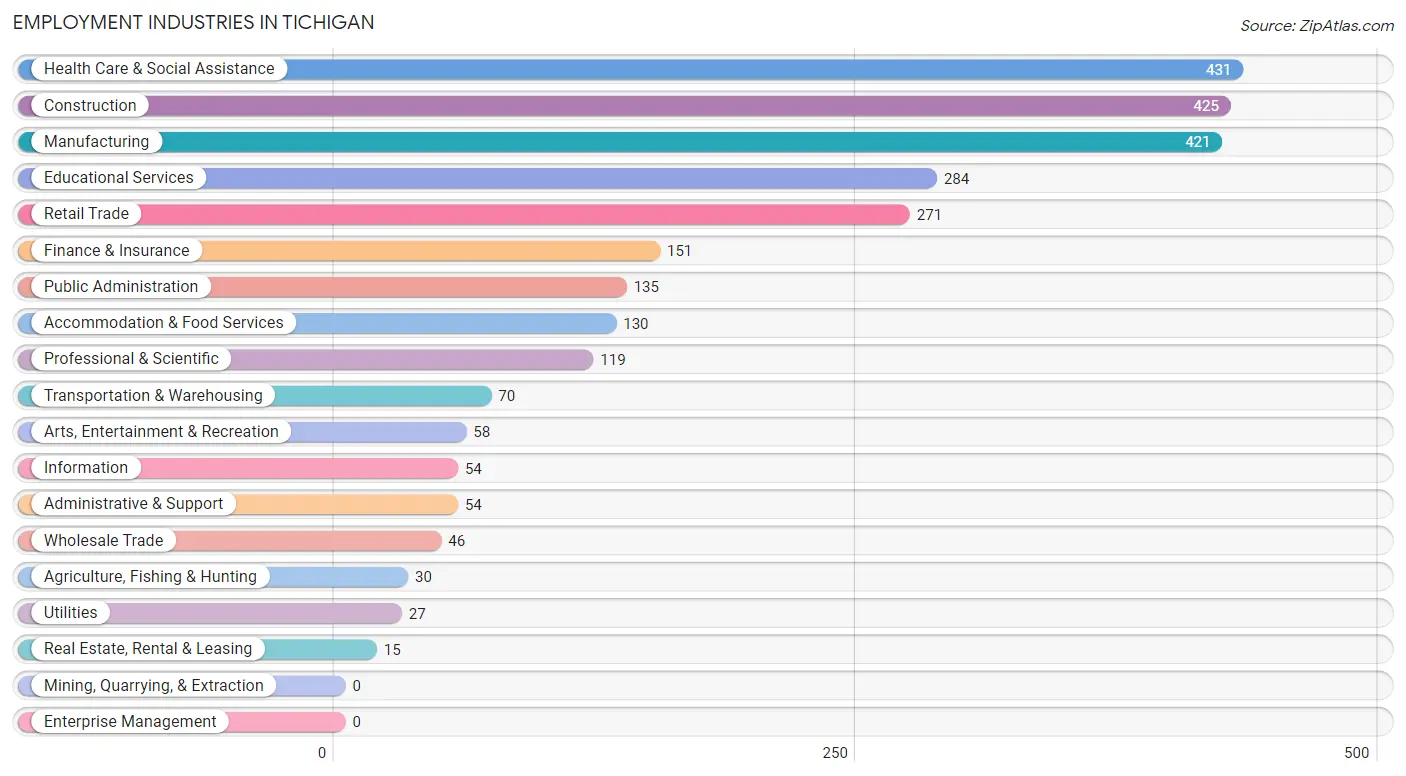
Employment Industries in Tichigan
The major employment industries in Tichigan include Health Care & Social Assistance (431 | 15.1%), Construction (425 | 14.9%), Manufacturing (421 | 14.8%), Educational Services (284 | 10.0%), and Retail Trade (271 | 9.5%).
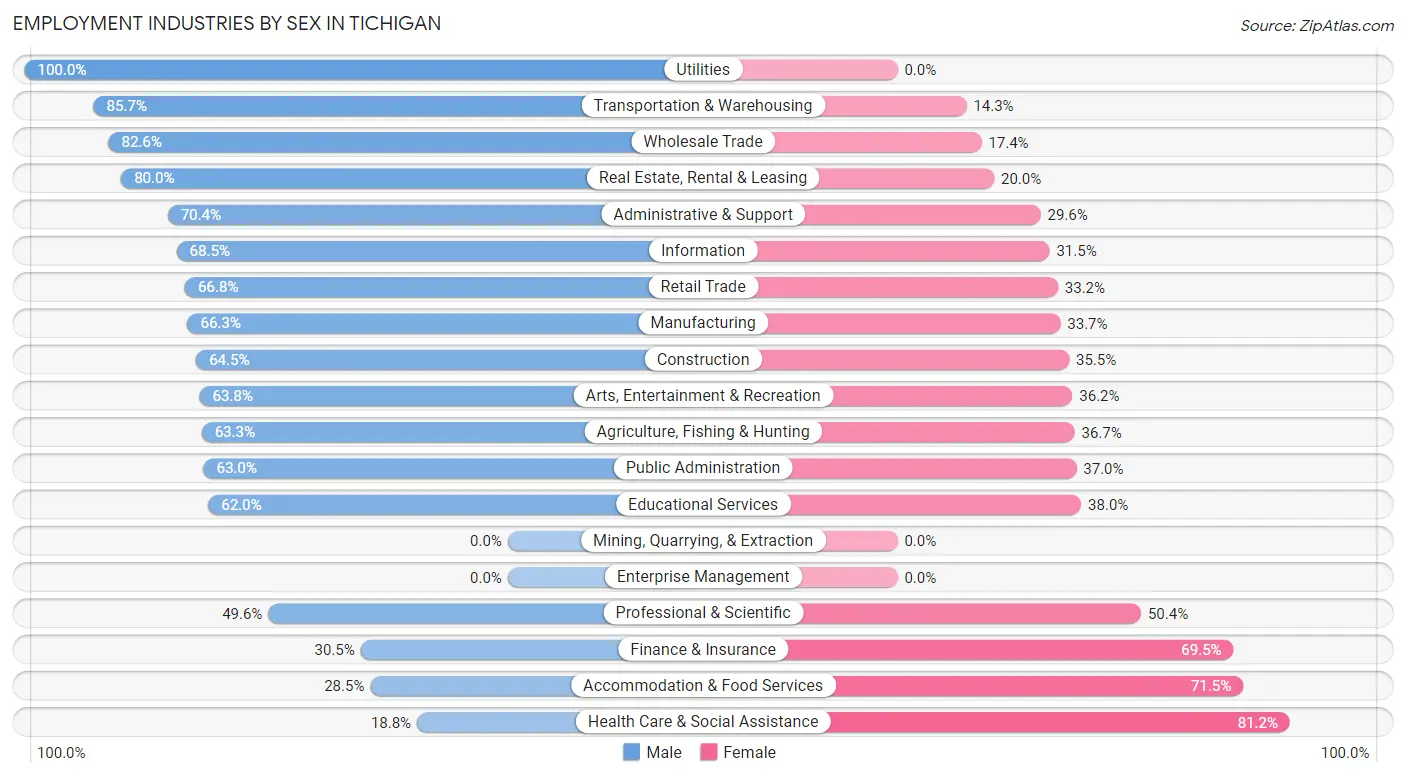
Employment Industries by Sex in Tichigan
The Tichigan industries that see more men than women are Utilities (100.0%), Transportation & Warehousing (85.7%), and Wholesale Trade (82.6%), whereas the industries that tend to have a higher number of women are Health Care & Social Assistance (81.2%), Accommodation & Food Services (71.5%), and Finance & Insurance (69.5%).
| Industry | Male | Female |
| Agriculture, Fishing & Hunting | 19 (63.3%) | 11 (36.7%) |
| Mining, Quarrying, & Extraction | 0 (0.0%) | 0 (0.0%) |
| Construction | 274 (64.5%) | 151 (35.5%) |
| Manufacturing | 279 (66.3%) | 142 (33.7%) |
| Wholesale Trade | 38 (82.6%) | 8 (17.4%) |
| Retail Trade | 181 (66.8%) | 90 (33.2%) |
| Transportation & Warehousing | 60 (85.7%) | 10 (14.3%) |
| Utilities | 27 (100.0%) | 0 (0.0%) |
| Information | 37 (68.5%) | 17 (31.5%) |
| Finance & Insurance | 46 (30.5%) | 105 (69.5%) |
| Real Estate, Rental & Leasing | 12 (80.0%) | 3 (20.0%) |
| Professional & Scientific | 59 (49.6%) | 60 (50.4%) |
| Enterprise Management | 0 (0.0%) | 0 (0.0%) |
| Administrative & Support | 38 (70.4%) | 16 (29.6%) |
| Educational Services | 176 (62.0%) | 108 (38.0%) |
| Health Care & Social Assistance | 81 (18.8%) | 350 (81.2%) |
| Arts, Entertainment & Recreation | 37 (63.8%) | 21 (36.2%) |
| Accommodation & Food Services | 37 (28.5%) | 93 (71.5%) |
| Public Administration | 85 (63.0%) | 50 (37.0%) |
| Total | 1,589 (55.7%) | 1,262 (44.3%) |
Education in Tichigan
School Enrollment in Tichigan
The most common levels of schooling among the 1,311 students in Tichigan are elementary school (448 | 34.2%), high school (347 | 26.5%), and middle school (210 | 16.0%).
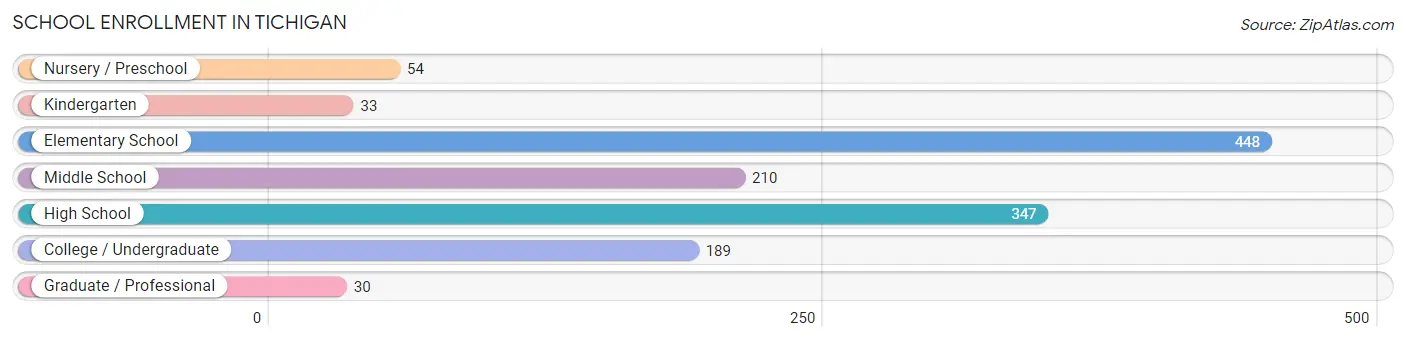
| School Level | # Students | % Students |
| Nursery / Preschool | 54 | 4.1% |
| Kindergarten | 33 | 2.5% |
| Elementary School | 448 | 34.2% |
| Middle School | 210 | 16.0% |
| High School | 347 | 26.5% |
| College / Undergraduate | 189 | 14.4% |
| Graduate / Professional | 30 | 2.3% |
| Total | 1,311 | 100.0% |
School Enrollment by Age by Funding Source in Tichigan
Out of a total of 1,311 students who are enrolled in schools in Tichigan, 125 (9.5%) attend a private institution, while the remaining 1,186 (90.5%) are enrolled in public schools. The age group of 3 to 4 year olds has the highest likelihood of being enrolled in private schools, with 31 (63.3% in the age bracket) enrolled. Conversely, the age group of 15 to 17 year olds has the lowest likelihood of being enrolled in a private school, with 229 (100.0% in the age bracket) attending a public institution.
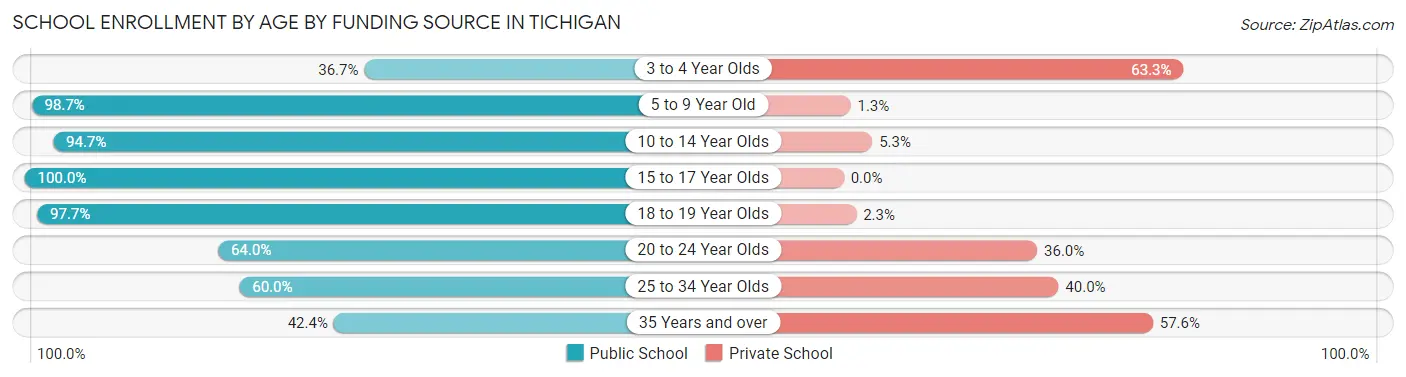
| Age Bracket | Public School | Private School |
| 3 to 4 Year Olds | 18 (36.7%) | 31 (63.3%) |
| 5 to 9 Year Old | 461 (98.7%) | 6 (1.3%) |
| 10 to 14 Year Olds | 249 (94.7%) | 14 (5.3%) |
| 15 to 17 Year Olds | 229 (100.0%) | 0 (0.0%) |
| 18 to 19 Year Olds | 126 (97.7%) | 3 (2.3%) |
| 20 to 24 Year Olds | 87 (64.0%) | 49 (36.0%) |
| 25 to 34 Year Olds | 3 (60.0%) | 2 (40.0%) |
| 35 Years and over | 14 (42.4%) | 19 (57.6%) |
| Total | 1,186 (90.5%) | 125 (9.5%) |
Educational Attainment by Field of Study in Tichigan
Business (397 | 27.8%), bio, nature & agricultural (203 | 14.2%), science & technology (183 | 12.8%), arts & humanities (132 | 9.2%), and education (114 | 8.0%) are the most common fields of study among 1,429 individuals in Tichigan who have obtained a bachelor's degree or higher.
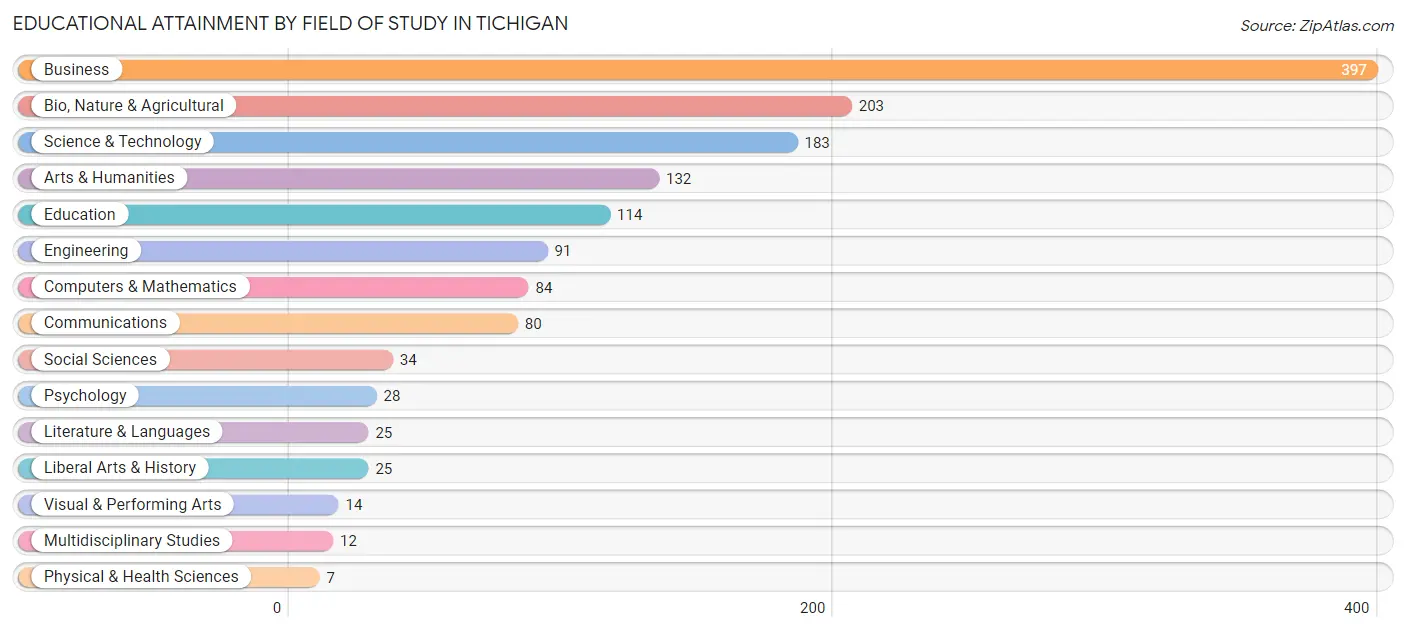
| Field of Study | # Graduates | % Graduates |
| Computers & Mathematics | 84 | 5.9% |
| Bio, Nature & Agricultural | 203 | 14.2% |
| Physical & Health Sciences | 7 | 0.5% |
| Psychology | 28 | 2.0% |
| Social Sciences | 34 | 2.4% |
| Engineering | 91 | 6.4% |
| Multidisciplinary Studies | 12 | 0.8% |
| Science & Technology | 183 | 12.8% |
| Business | 397 | 27.8% |
| Education | 114 | 8.0% |
| Literature & Languages | 25 | 1.8% |
| Liberal Arts & History | 25 | 1.8% |
| Visual & Performing Arts | 14 | 1.0% |
| Communications | 80 | 5.6% |
| Arts & Humanities | 132 | 9.2% |
| Total | 1,429 | 100.0% |
Transportation & Commute in Tichigan
Vehicle Availability by Sex in Tichigan
The most prevalent vehicle ownership categories in Tichigan are males with 3 vehicles (529, accounting for 36.5%) and females with 3 vehicles (419, making up 42.0%).
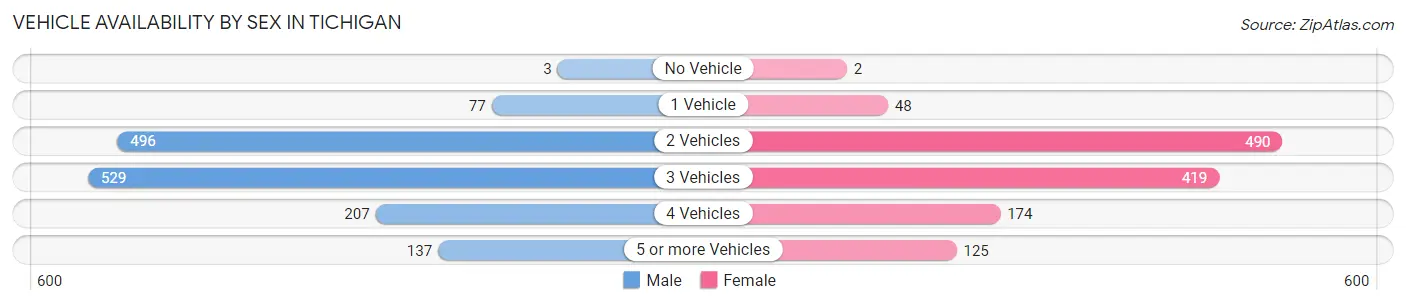
| Vehicles Available | Male | Female |
| No Vehicle | 3 (0.2%) | 2 (0.2%) |
| 1 Vehicle | 77 (5.3%) | 48 (3.8%) |
| 2 Vehicles | 496 (34.2%) | 490 (39.0%) |
| 3 Vehicles | 529 (36.5%) | 419 (33.3%) |
| 4 Vehicles | 207 (14.3%) | 174 (13.8%) |
| 5 or more Vehicles | 137 (9.5%) | 125 (9.9%) |
| Total | 1,449 (100.0%) | 1,258 (100.0%) |
Commute Time in Tichigan
The most frequently occuring commute durations in Tichigan are 30 to 34 minutes (427 commuters, 17.8%), 40 to 44 minutes (289 commuters, 12.1%), and 15 to 19 minutes (272 commuters, 11.4%).
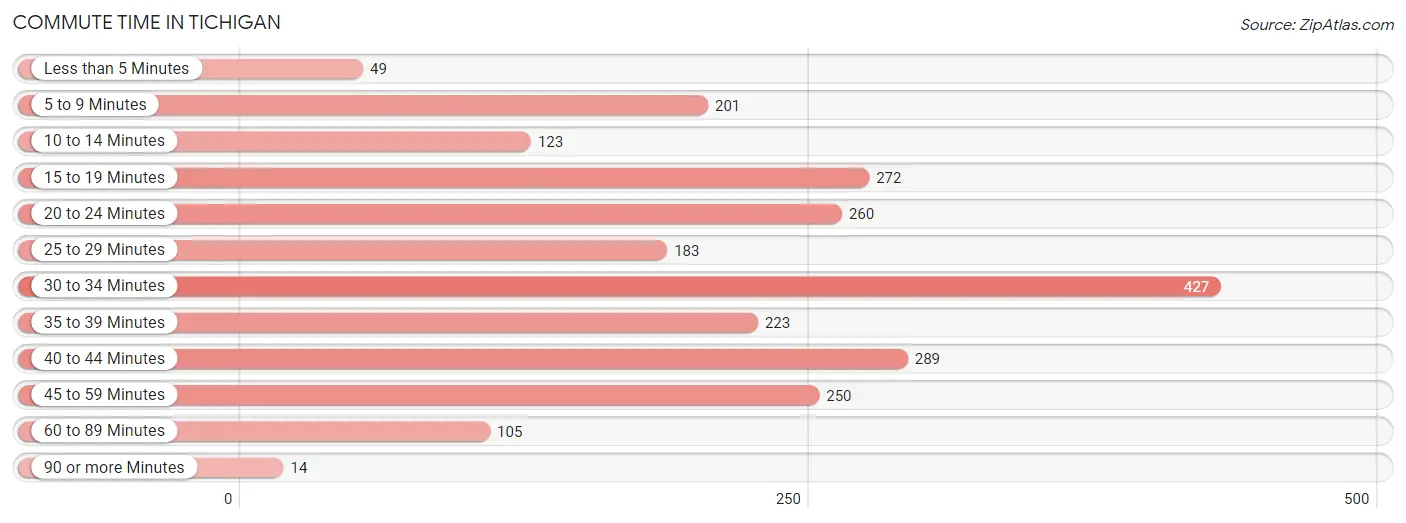
| Commute Time | # Commuters | % Commuters |
| Less than 5 Minutes | 49 | 2.1% |
| 5 to 9 Minutes | 201 | 8.4% |
| 10 to 14 Minutes | 123 | 5.1% |
| 15 to 19 Minutes | 272 | 11.4% |
| 20 to 24 Minutes | 260 | 10.8% |
| 25 to 29 Minutes | 183 | 7.6% |
| 30 to 34 Minutes | 427 | 17.8% |
| 35 to 39 Minutes | 223 | 9.3% |
| 40 to 44 Minutes | 289 | 12.1% |
| 45 to 59 Minutes | 250 | 10.4% |
| 60 to 89 Minutes | 105 | 4.4% |
| 90 or more Minutes | 14 | 0.6% |
Commute Time by Sex in Tichigan
The most common commute times in Tichigan are 30 to 34 minutes (264 commuters, 20.4%) for males and 35 to 39 minutes (170 commuters, 15.4%) for females.
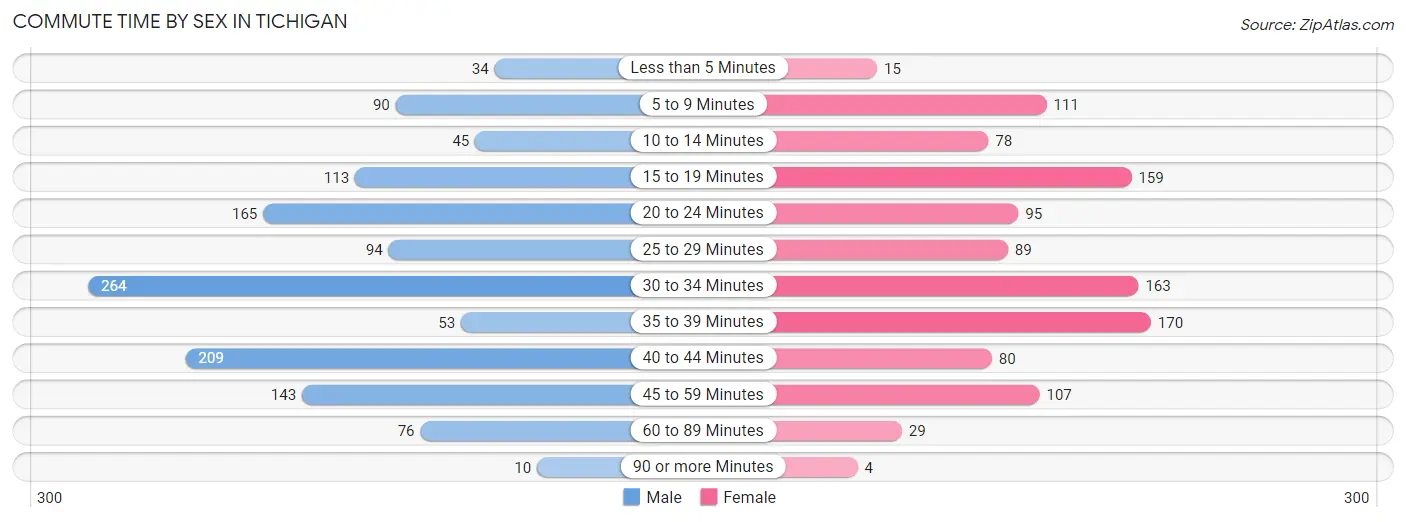
| Commute Time | Male | Female |
| Less than 5 Minutes | 34 (2.6%) | 15 (1.4%) |
| 5 to 9 Minutes | 90 (6.9%) | 111 (10.1%) |
| 10 to 14 Minutes | 45 (3.5%) | 78 (7.1%) |
| 15 to 19 Minutes | 113 (8.7%) | 159 (14.4%) |
| 20 to 24 Minutes | 165 (12.7%) | 95 (8.6%) |
| 25 to 29 Minutes | 94 (7.2%) | 89 (8.1%) |
| 30 to 34 Minutes | 264 (20.4%) | 163 (14.8%) |
| 35 to 39 Minutes | 53 (4.1%) | 170 (15.4%) |
| 40 to 44 Minutes | 209 (16.1%) | 80 (7.3%) |
| 45 to 59 Minutes | 143 (11.0%) | 107 (9.7%) |
| 60 to 89 Minutes | 76 (5.9%) | 29 (2.6%) |
| 90 or more Minutes | 10 (0.8%) | 4 (0.4%) |
Time of Departure to Work by Sex in Tichigan
The most frequent times of departure to work in Tichigan are 7:00 AM to 7:29 AM (267, 20.6%) for males and 4:00 PM to 11:59 PM (227, 20.6%) for females.
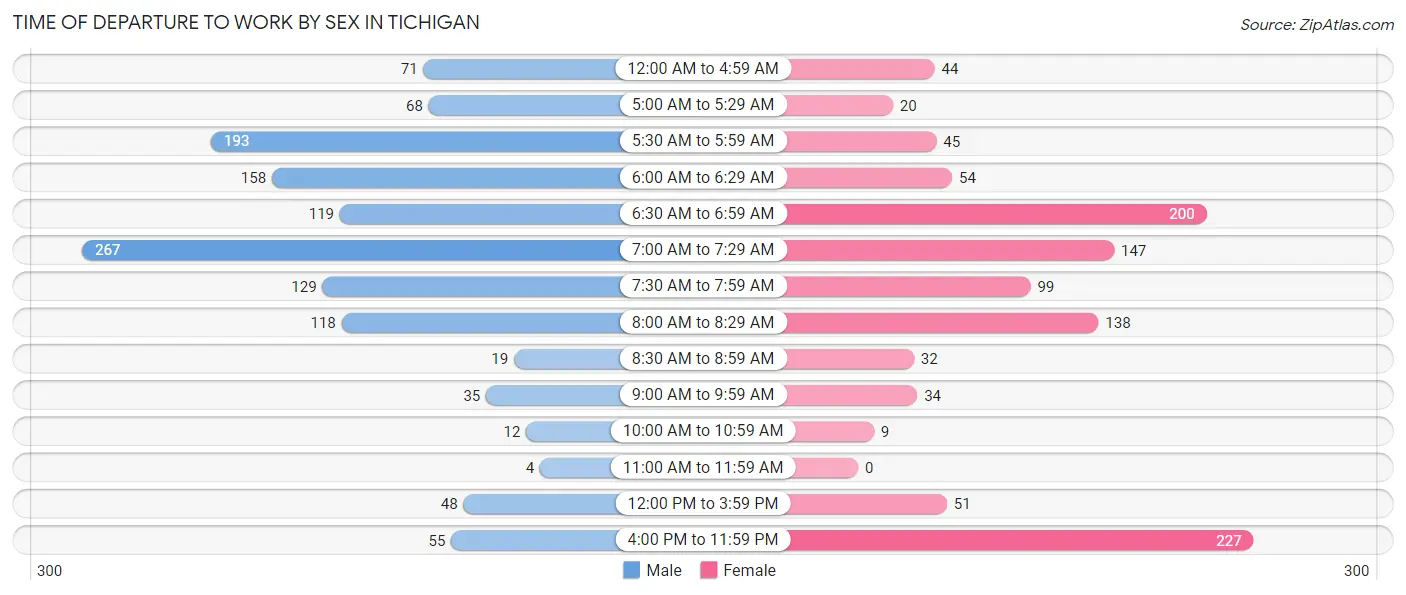
| Time of Departure | Male | Female |
| 12:00 AM to 4:59 AM | 71 (5.5%) | 44 (4.0%) |
| 5:00 AM to 5:29 AM | 68 (5.2%) | 20 (1.8%) |
| 5:30 AM to 5:59 AM | 193 (14.9%) | 45 (4.1%) |
| 6:00 AM to 6:29 AM | 158 (12.2%) | 54 (4.9%) |
| 6:30 AM to 6:59 AM | 119 (9.2%) | 200 (18.2%) |
| 7:00 AM to 7:29 AM | 267 (20.6%) | 147 (13.4%) |
| 7:30 AM to 7:59 AM | 129 (10.0%) | 99 (9.0%) |
| 8:00 AM to 8:29 AM | 118 (9.1%) | 138 (12.6%) |
| 8:30 AM to 8:59 AM | 19 (1.5%) | 32 (2.9%) |
| 9:00 AM to 9:59 AM | 35 (2.7%) | 34 (3.1%) |
| 10:00 AM to 10:59 AM | 12 (0.9%) | 9 (0.8%) |
| 11:00 AM to 11:59 AM | 4 (0.3%) | 0 (0.0%) |
| 12:00 PM to 3:59 PM | 48 (3.7%) | 51 (4.6%) |
| 4:00 PM to 11:59 PM | 55 (4.2%) | 227 (20.6%) |
| Total | 1,296 (100.0%) | 1,100 (100.0%) |
Housing Occupancy in Tichigan
Occupancy by Ownership in Tichigan
Of the total 1,745 dwellings in Tichigan, owner-occupied units account for 1,630 (93.4%), while renter-occupied units make up 115 (6.6%).
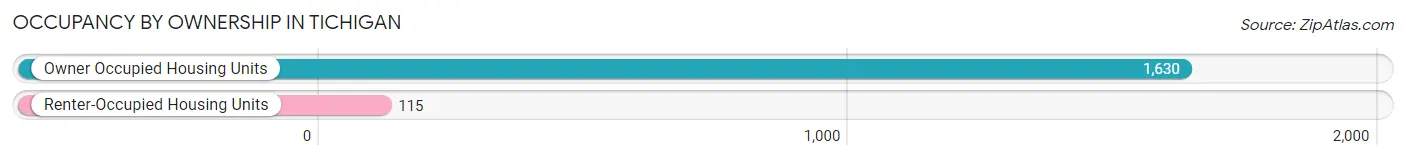
| Occupancy | # Housing Units | % Housing Units |
| Owner Occupied Housing Units | 1,630 | 93.4% |
| Renter-Occupied Housing Units | 115 | 6.6% |
| Total Occupied Housing Units | 1,745 | 100.0% |
Occupancy by Household Size in Tichigan
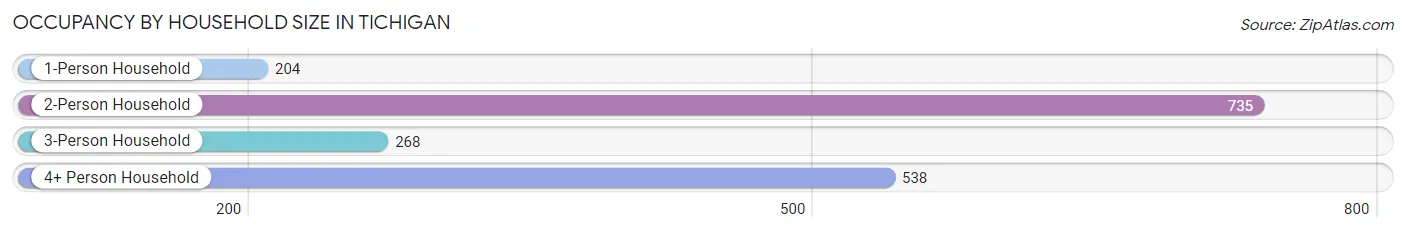
| Household Size | # Housing Units | % Housing Units |
| 1-Person Household | 204 | 11.7% |
| 2-Person Household | 735 | 42.1% |
| 3-Person Household | 268 | 15.4% |
| 4+ Person Household | 538 | 30.8% |
| Total Housing Units | 1,745 | 100.0% |
Occupancy by Ownership by Household Size in Tichigan
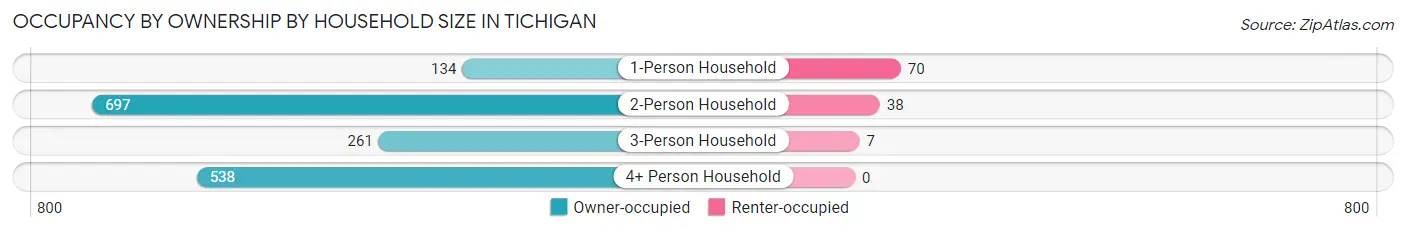
| Household Size | Owner-occupied | Renter-occupied |
| 1-Person Household | 134 (65.7%) | 70 (34.3%) |
| 2-Person Household | 697 (94.8%) | 38 (5.2%) |
| 3-Person Household | 261 (97.4%) | 7 (2.6%) |
| 4+ Person Household | 538 (100.0%) | 0 (0.0%) |
| Total Housing Units | 1,630 (93.4%) | 115 (6.6%) |
Occupancy by Educational Attainment in Tichigan
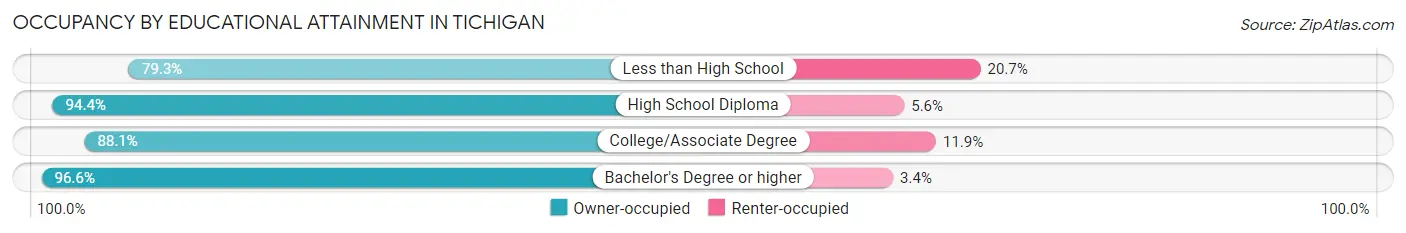
| Household Size | Owner-occupied | Renter-occupied |
| Less than High School | 23 (79.3%) | 6 (20.7%) |
| High School Diploma | 322 (94.4%) | 19 (5.6%) |
| College/Associate Degree | 453 (88.1%) | 61 (11.9%) |
| Bachelor's Degree or higher | 832 (96.6%) | 29 (3.4%) |
Occupancy by Age of Householder in Tichigan
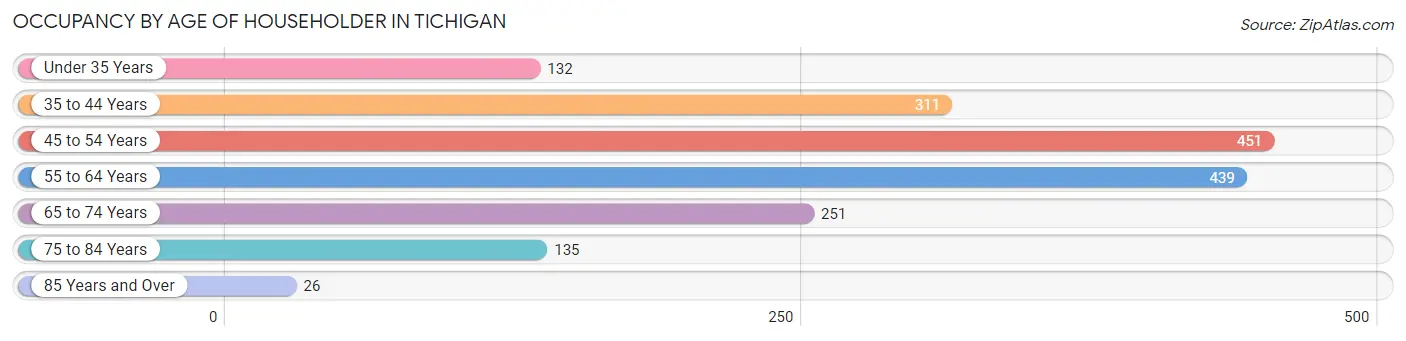
| Age Bracket | # Households | % Households |
| Under 35 Years | 132 | 7.6% |
| 35 to 44 Years | 311 | 17.8% |
| 45 to 54 Years | 451 | 25.9% |
| 55 to 64 Years | 439 | 25.2% |
| 65 to 74 Years | 251 | 14.4% |
| 75 to 84 Years | 135 | 7.7% |
| 85 Years and Over | 26 | 1.5% |
| Total | 1,745 | 100.0% |
Housing Finances in Tichigan
Median Income by Occupancy in Tichigan
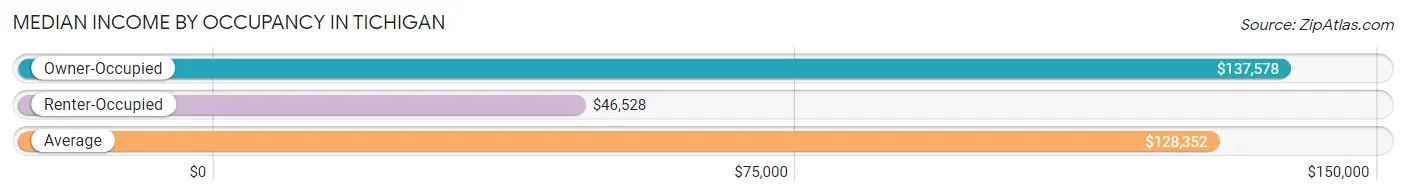
| Occupancy Type | # Households | Median Income |
| Owner-Occupied | 1,630 (93.4%) | $137,578 |
| Renter-Occupied | 115 (6.6%) | $46,528 |
| Average | 1,745 (100.0%) | $128,352 |
Occupancy by Householder Income Bracket in Tichigan
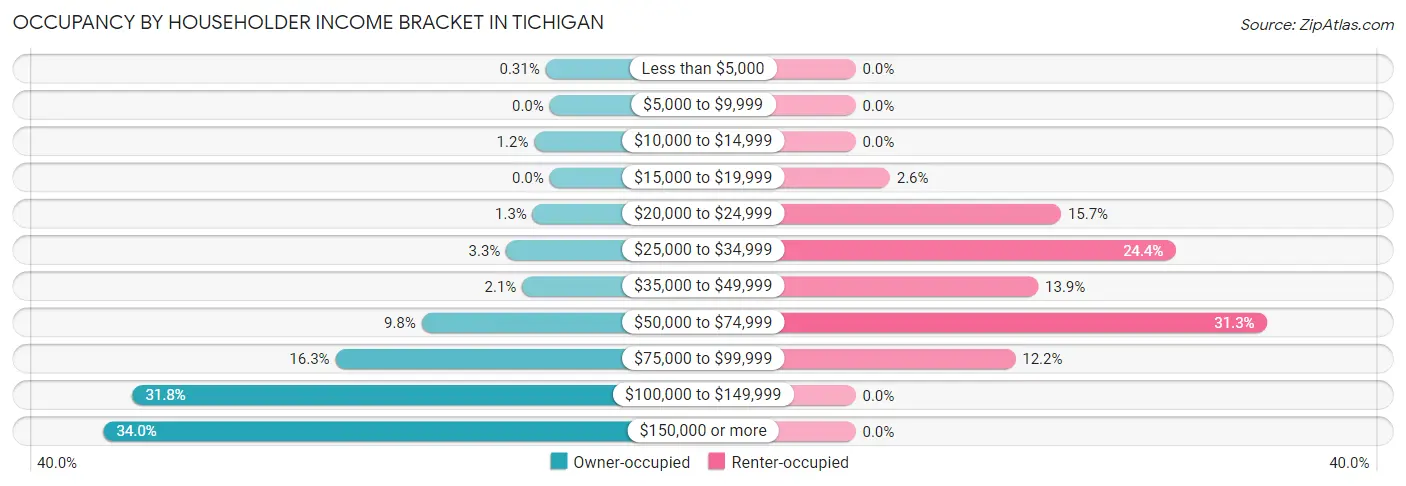
| Income Bracket | Owner-occupied | Renter-occupied |
| Less than $5,000 | 5 (0.3%) | 0 (0.0%) |
| $5,000 to $9,999 | 0 (0.0%) | 0 (0.0%) |
| $10,000 to $14,999 | 19 (1.2%) | 0 (0.0%) |
| $15,000 to $19,999 | 0 (0.0%) | 3 (2.6%) |
| $20,000 to $24,999 | 21 (1.3%) | 18 (15.7%) |
| $25,000 to $34,999 | 54 (3.3%) | 28 (24.3%) |
| $35,000 to $49,999 | 34 (2.1%) | 16 (13.9%) |
| $50,000 to $74,999 | 159 (9.8%) | 36 (31.3%) |
| $75,000 to $99,999 | 266 (16.3%) | 14 (12.2%) |
| $100,000 to $149,999 | 518 (31.8%) | 0 (0.0%) |
| $150,000 or more | 554 (34.0%) | 0 (0.0%) |
| Total | 1,630 (100.0%) | 115 (100.0%) |
Monthly Housing Cost Tiers in Tichigan
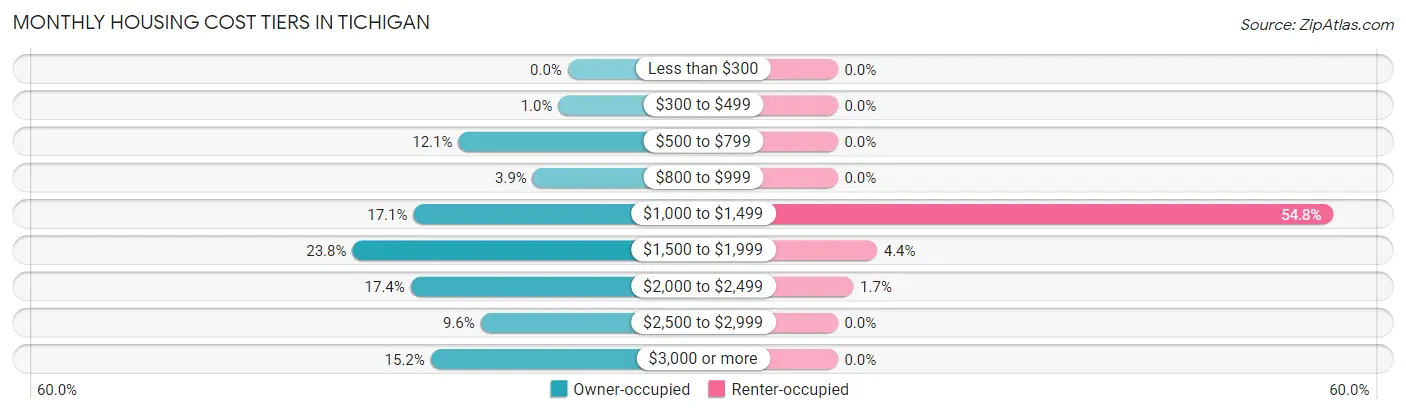
| Monthly Cost | Owner-occupied | Renter-occupied |
| Less than $300 | 0 (0.0%) | 0 (0.0%) |
| $300 to $499 | 17 (1.0%) | 0 (0.0%) |
| $500 to $799 | 197 (12.1%) | 0 (0.0%) |
| $800 to $999 | 63 (3.9%) | 0 (0.0%) |
| $1,000 to $1,499 | 278 (17.1%) | 63 (54.8%) |
| $1,500 to $1,999 | 388 (23.8%) | 5 (4.3%) |
| $2,000 to $2,499 | 283 (17.4%) | 2 (1.7%) |
| $2,500 to $2,999 | 157 (9.6%) | 0 (0.0%) |
| $3,000 or more | 247 (15.1%) | 0 (0.0%) |
| Total | 1,630 (100.0%) | 115 (100.0%) |
Physical Housing Characteristics in Tichigan
Housing Structures in Tichigan
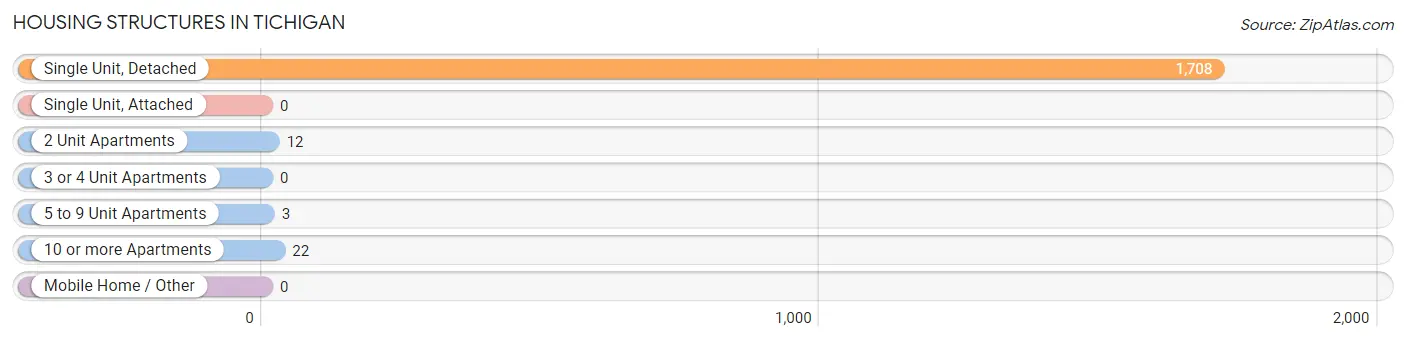
| Structure Type | # Housing Units | % Housing Units |
| Single Unit, Detached | 1,708 | 97.9% |
| Single Unit, Attached | 0 | 0.0% |
| 2 Unit Apartments | 12 | 0.7% |
| 3 or 4 Unit Apartments | 0 | 0.0% |
| 5 to 9 Unit Apartments | 3 | 0.2% |
| 10 or more Apartments | 22 | 1.3% |
| Mobile Home / Other | 0 | 0.0% |
| Total | 1,745 | 100.0% |
Housing Structures by Occupancy in Tichigan
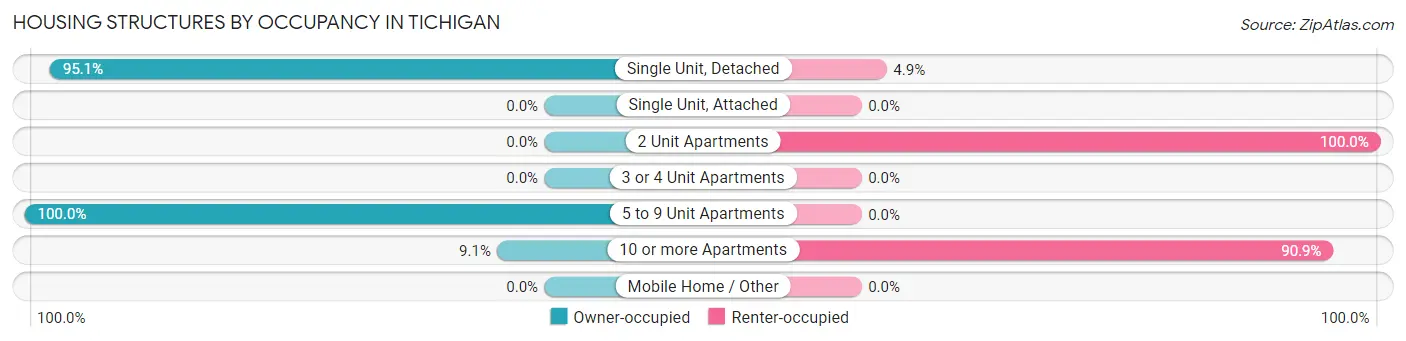
| Structure Type | Owner-occupied | Renter-occupied |
| Single Unit, Detached | 1,625 (95.1%) | 83 (4.9%) |
| Single Unit, Attached | 0 (0.0%) | 0 (0.0%) |
| 2 Unit Apartments | 0 (0.0%) | 12 (100.0%) |
| 3 or 4 Unit Apartments | 0 (0.0%) | 0 (0.0%) |
| 5 to 9 Unit Apartments | 3 (100.0%) | 0 (0.0%) |
| 10 or more Apartments | 2 (9.1%) | 20 (90.9%) |
| Mobile Home / Other | 0 (0.0%) | 0 (0.0%) |
| Total | 1,630 (93.4%) | 115 (6.6%) |
Housing Structures by Number of Rooms in Tichigan
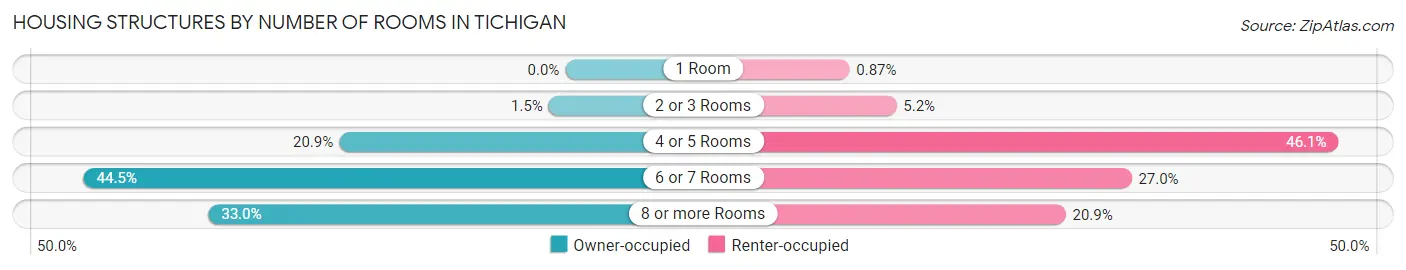
| Number of Rooms | Owner-occupied | Renter-occupied |
| 1 Room | 0 (0.0%) | 1 (0.9%) |
| 2 or 3 Rooms | 25 (1.5%) | 6 (5.2%) |
| 4 or 5 Rooms | 341 (20.9%) | 53 (46.1%) |
| 6 or 7 Rooms | 726 (44.5%) | 31 (27.0%) |
| 8 or more Rooms | 538 (33.0%) | 24 (20.9%) |
| Total | 1,630 (100.0%) | 115 (100.0%) |
Housing Structure by Heating Type in Tichigan
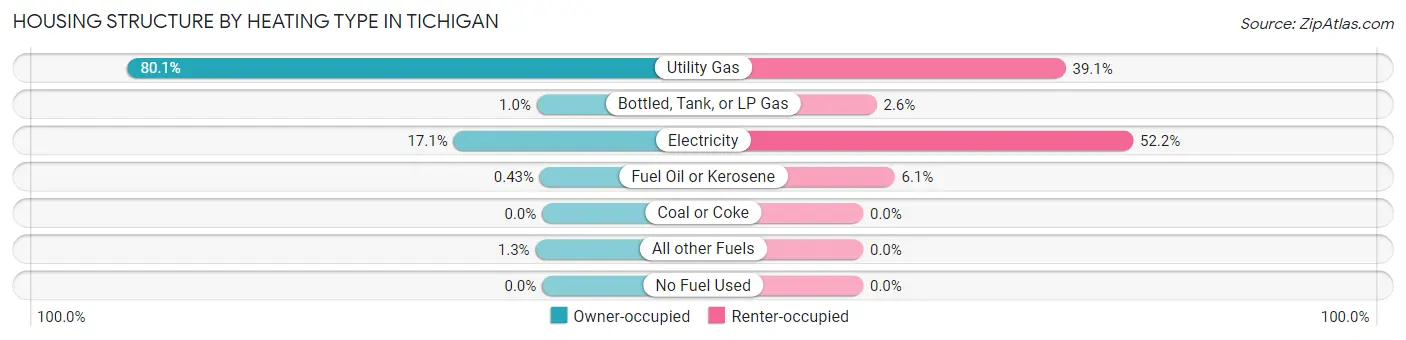
| Heating Type | Owner-occupied | Renter-occupied |
| Utility Gas | 1,306 (80.1%) | 45 (39.1%) |
| Bottled, Tank, or LP Gas | 17 (1.0%) | 3 (2.6%) |
| Electricity | 279 (17.1%) | 60 (52.2%) |
| Fuel Oil or Kerosene | 7 (0.4%) | 7 (6.1%) |
| Coal or Coke | 0 (0.0%) | 0 (0.0%) |
| All other Fuels | 21 (1.3%) | 0 (0.0%) |
| No Fuel Used | 0 (0.0%) | 0 (0.0%) |
| Total | 1,630 (100.0%) | 115 (100.0%) |
Household Vehicle Usage in Tichigan
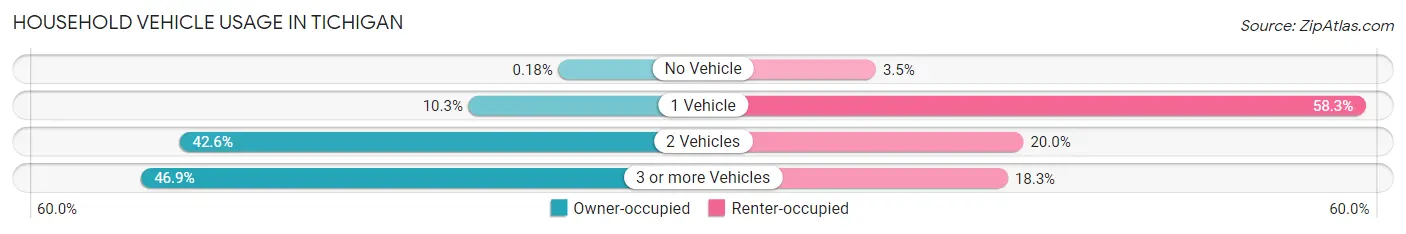
| Vehicles per Household | Owner-occupied | Renter-occupied |
| No Vehicle | 3 (0.2%) | 4 (3.5%) |
| 1 Vehicle | 167 (10.2%) | 67 (58.3%) |
| 2 Vehicles | 695 (42.6%) | 23 (20.0%) |
| 3 or more Vehicles | 765 (46.9%) | 21 (18.3%) |
| Total | 1,630 (100.0%) | 115 (100.0%) |
Real Estate & Mortgages in Tichigan
Real Estate and Mortgage Overview in Tichigan
| Characteristic | Without Mortgage | With Mortgage |
| Housing Units | 439 | 1,191 |
| Median Property Value | $409,800 | $357,800 |
| Median Household Income | $131,528 | $474 |
| Monthly Housing Costs | $848 | $247 |
| Real Estate Taxes | $4,715 | $1 |
Property Value by Mortgage Status in Tichigan
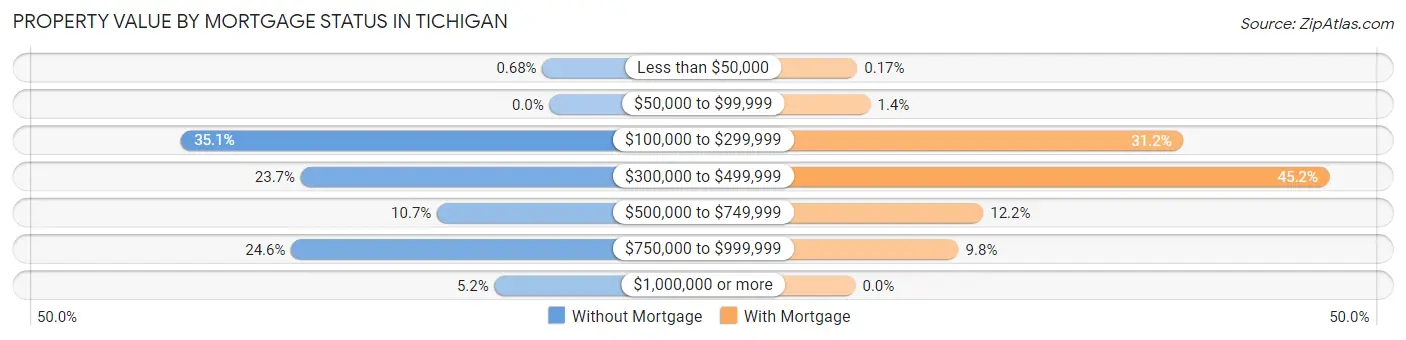
| Property Value | Without Mortgage | With Mortgage |
| Less than $50,000 | 3 (0.7%) | 2 (0.2%) |
| $50,000 to $99,999 | 0 (0.0%) | 17 (1.4%) |
| $100,000 to $299,999 | 154 (35.1%) | 372 (31.2%) |
| $300,000 to $499,999 | 104 (23.7%) | 538 (45.2%) |
| $500,000 to $749,999 | 47 (10.7%) | 145 (12.2%) |
| $750,000 to $999,999 | 108 (24.6%) | 117 (9.8%) |
| $1,000,000 or more | 23 (5.2%) | 0 (0.0%) |
| Total | 439 (100.0%) | 1,191 (100.0%) |
Household Income by Mortgage Status in Tichigan
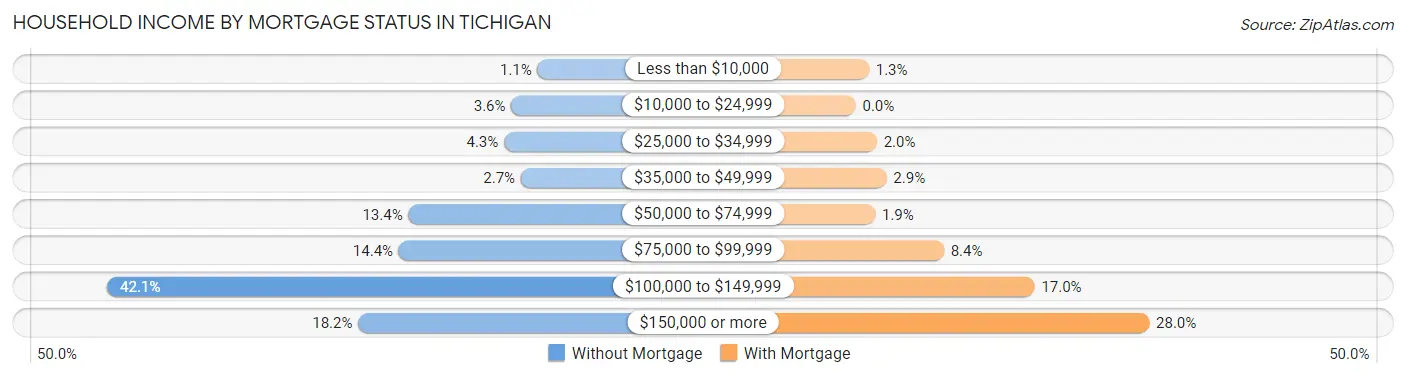
| Household Income | Without Mortgage | With Mortgage |
| Less than $10,000 | 5 (1.1%) | 15 (1.3%) |
| $10,000 to $24,999 | 16 (3.6%) | 0 (0.0%) |
| $25,000 to $34,999 | 19 (4.3%) | 24 (2.0%) |
| $35,000 to $49,999 | 12 (2.7%) | 35 (2.9%) |
| $50,000 to $74,999 | 59 (13.4%) | 22 (1.8%) |
| $75,000 to $99,999 | 63 (14.3%) | 100 (8.4%) |
| $100,000 to $149,999 | 185 (42.1%) | 203 (17.0%) |
| $150,000 or more | 80 (18.2%) | 333 (28.0%) |
| Total | 439 (100.0%) | 1,191 (100.0%) |
Property Value to Household Income Ratio in Tichigan
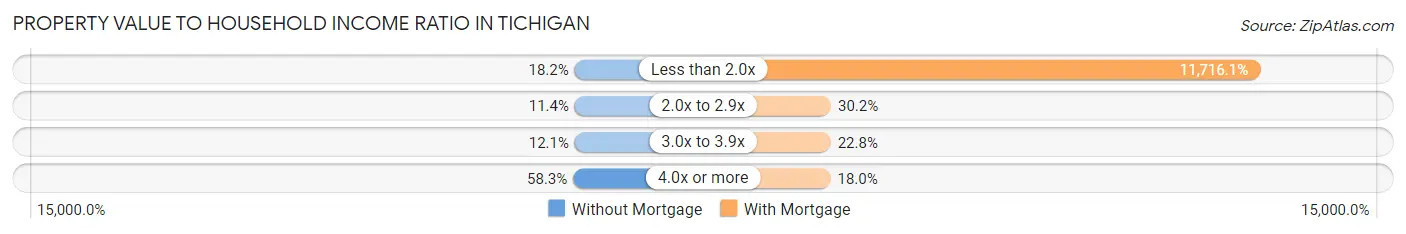
| Value-to-Income Ratio | Without Mortgage | With Mortgage |
| Less than 2.0x | 80 (18.2%) | 139,539 (11,716.1%) |
| 2.0x to 2.9x | 50 (11.4%) | 360 (30.2%) |
| 3.0x to 3.9x | 53 (12.1%) | 271 (22.8%) |
| 4.0x or more | 256 (58.3%) | 214 (18.0%) |
| Total | 439 (100.0%) | 1,191 (100.0%) |
Real Estate Taxes by Mortgage Status in Tichigan
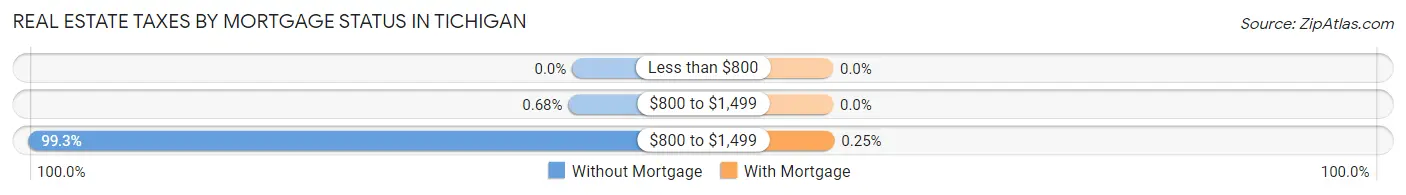
| Property Taxes | Without Mortgage | With Mortgage |
| Less than $800 | 0 (0.0%) | 0 (0.0%) |
| $800 to $1,499 | 3 (0.7%) | 0 (0.0%) |
| $800 to $1,499 | 436 (99.3%) | 3 (0.3%) |
| Total | 439 (100.0%) | 1,191 (100.0%) |
Health & Disability in Tichigan
Health Insurance Coverage by Age in Tichigan
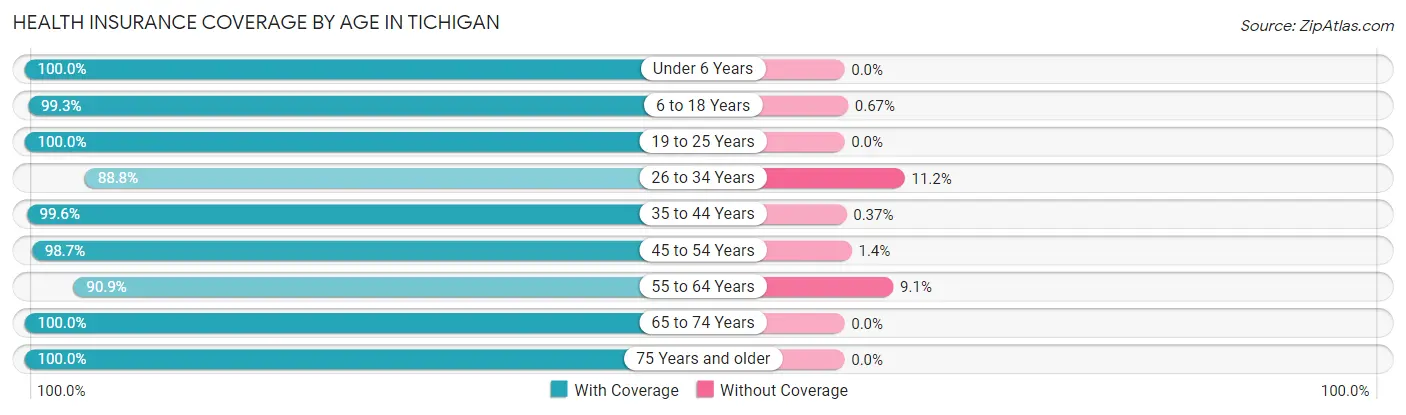
| Age Bracket | With Coverage | Without Coverage |
| Under 6 Years | 318 (100.0%) | 0 (0.0%) |
| 6 to 18 Years | 1,032 (99.3%) | 7 (0.7%) |
| 19 to 25 Years | 233 (100.0%) | 0 (0.0%) |
| 26 to 34 Years | 308 (88.8%) | 39 (11.2%) |
| 35 to 44 Years | 544 (99.6%) | 2 (0.4%) |
| 45 to 54 Years | 874 (98.7%) | 12 (1.3%) |
| 55 to 64 Years | 768 (90.9%) | 77 (9.1%) |
| 65 to 74 Years | 602 (100.0%) | 0 (0.0%) |
| 75 Years and older | 244 (100.0%) | 0 (0.0%) |
| Total | 4,923 (97.3%) | 137 (2.7%) |
Health Insurance Coverage by Citizenship Status in Tichigan
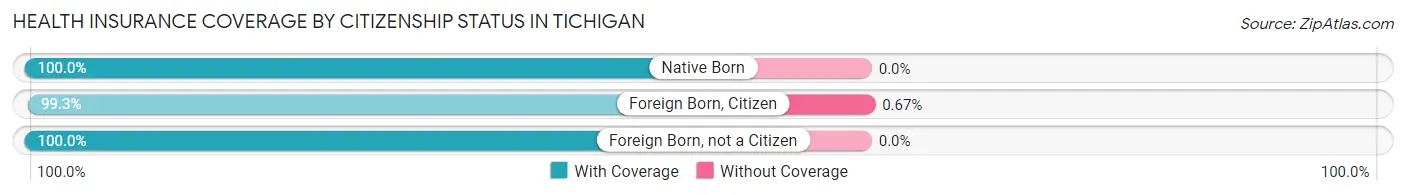
| Citizenship Status | With Coverage | Without Coverage |
| Native Born | 318 (100.0%) | 0 (0.0%) |
| Foreign Born, Citizen | 1,032 (99.3%) | 7 (0.7%) |
| Foreign Born, not a Citizen | 233 (100.0%) | 0 (0.0%) |
Health Insurance Coverage by Household Income in Tichigan
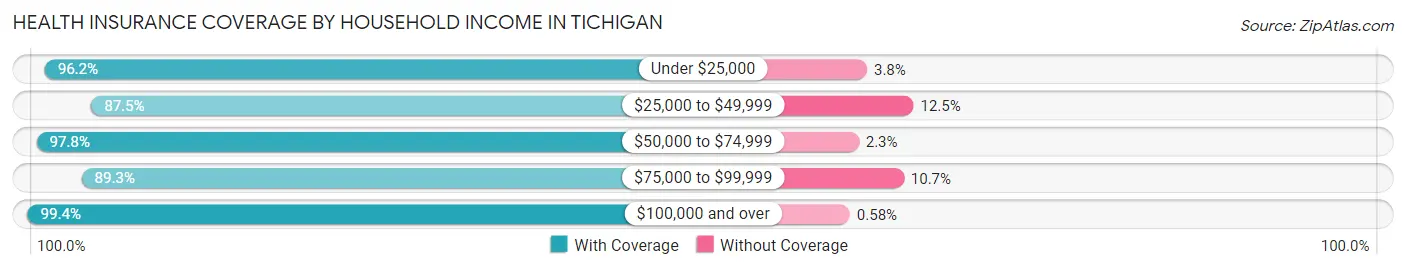
| Household Income | With Coverage | Without Coverage |
| Under $25,000 | 127 (96.2%) | 5 (3.8%) |
| $25,000 to $49,999 | 182 (87.5%) | 26 (12.5%) |
| $50,000 to $74,999 | 566 (97.8%) | 13 (2.2%) |
| $75,000 to $99,999 | 610 (89.3%) | 73 (10.7%) |
| $100,000 and over | 3,438 (99.4%) | 20 (0.6%) |
Public vs Private Health Insurance Coverage by Age in Tichigan
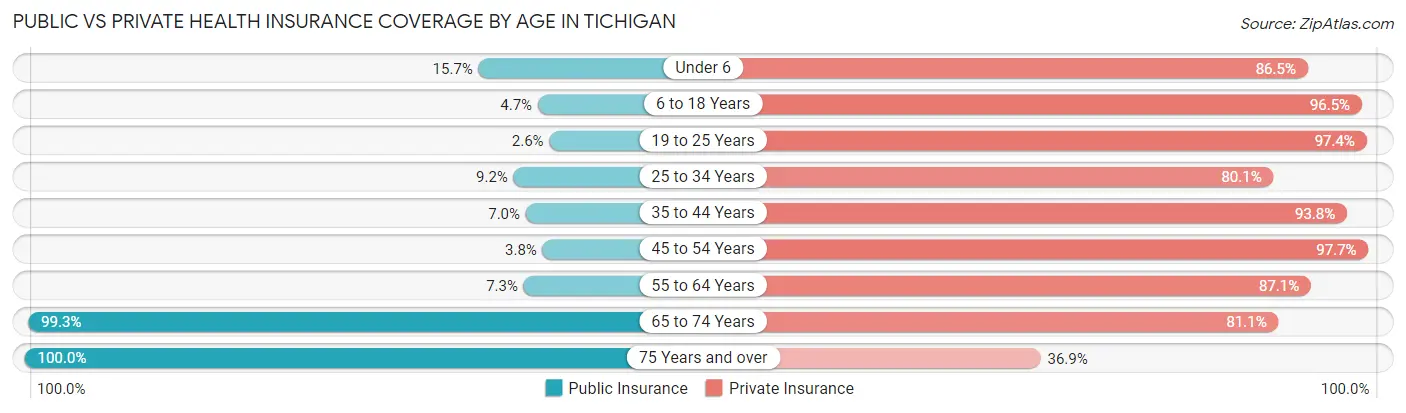
| Age Bracket | Public Insurance | Private Insurance |
| Under 6 | 50 (15.7%) | 275 (86.5%) |
| 6 to 18 Years | 49 (4.7%) | 1,003 (96.5%) |
| 19 to 25 Years | 6 (2.6%) | 227 (97.4%) |
| 25 to 34 Years | 32 (9.2%) | 278 (80.1%) |
| 35 to 44 Years | 38 (7.0%) | 512 (93.8%) |
| 45 to 54 Years | 34 (3.8%) | 866 (97.7%) |
| 55 to 64 Years | 62 (7.3%) | 736 (87.1%) |
| 65 to 74 Years | 598 (99.3%) | 488 (81.1%) |
| 75 Years and over | 244 (100.0%) | 90 (36.9%) |
| Total | 1,113 (22.0%) | 4,475 (88.4%) |
Disability Status by Sex by Age in Tichigan
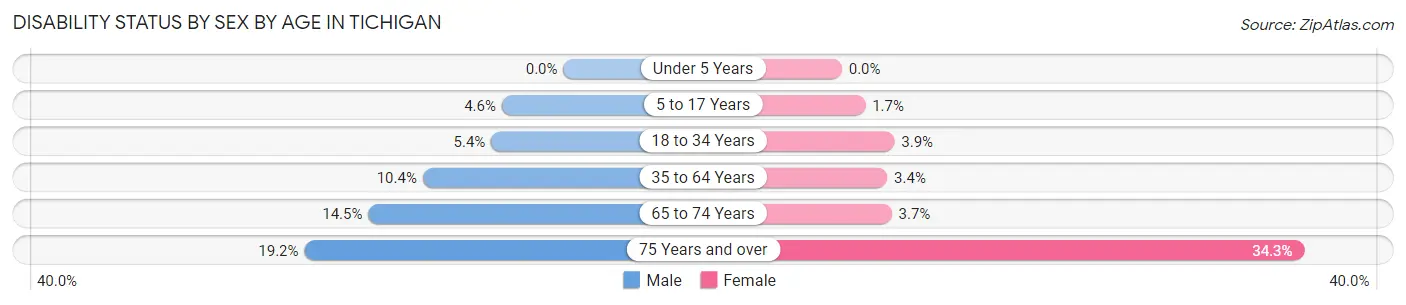
| Age Bracket | Male | Female |
| Under 5 Years | 0 (0.0%) | 0 (0.0%) |
| 5 to 17 Years | 24 (4.6%) | 8 (1.7%) |
| 18 to 34 Years | 18 (5.4%) | 13 (3.9%) |
| 35 to 64 Years | 120 (10.4%) | 38 (3.4%) |
| 65 to 74 Years | 52 (14.5%) | 9 (3.7%) |
| 75 Years and over | 15 (19.2%) | 57 (34.3%) |
Disability Class by Sex by Age in Tichigan
Disability Class: Hearing Difficulty
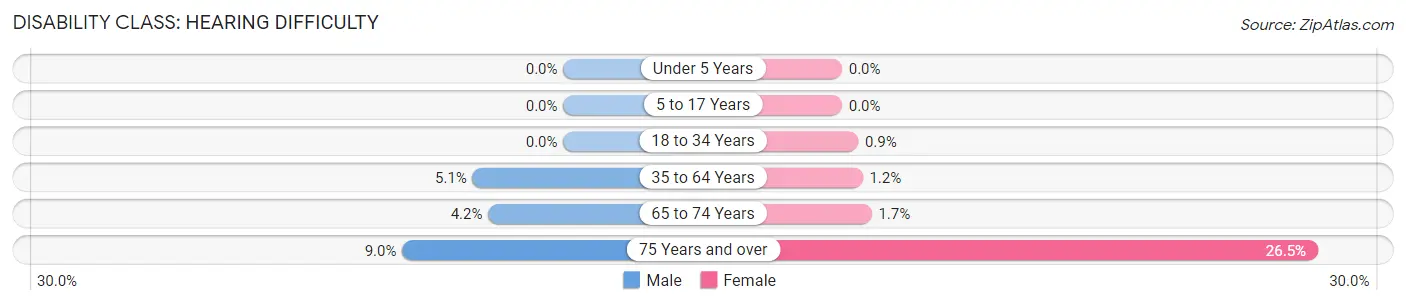
| Age Bracket | Male | Female |
| Under 5 Years | 0 (0.0%) | 0 (0.0%) |
| 5 to 17 Years | 0 (0.0%) | 0 (0.0%) |
| 18 to 34 Years | 0 (0.0%) | 3 (0.9%) |
| 35 to 64 Years | 58 (5.1%) | 13 (1.1%) |
| 65 to 74 Years | 15 (4.2%) | 4 (1.7%) |
| 75 Years and over | 7 (9.0%) | 44 (26.5%) |
Disability Class: Vision Difficulty
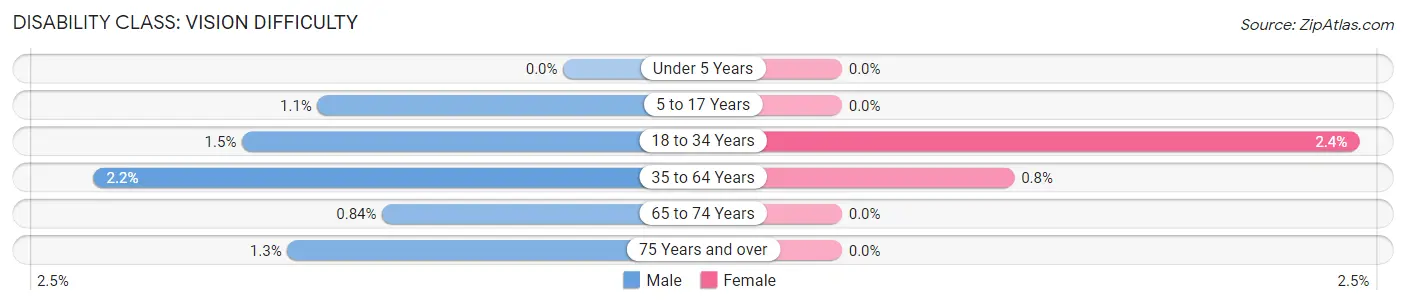
| Age Bracket | Male | Female |
| Under 5 Years | 0 (0.0%) | 0 (0.0%) |
| 5 to 17 Years | 6 (1.1%) | 0 (0.0%) |
| 18 to 34 Years | 5 (1.5%) | 8 (2.4%) |
| 35 to 64 Years | 25 (2.2%) | 9 (0.8%) |
| 65 to 74 Years | 3 (0.8%) | 0 (0.0%) |
| 75 Years and over | 1 (1.3%) | 0 (0.0%) |
Disability Class: Cognitive Difficulty
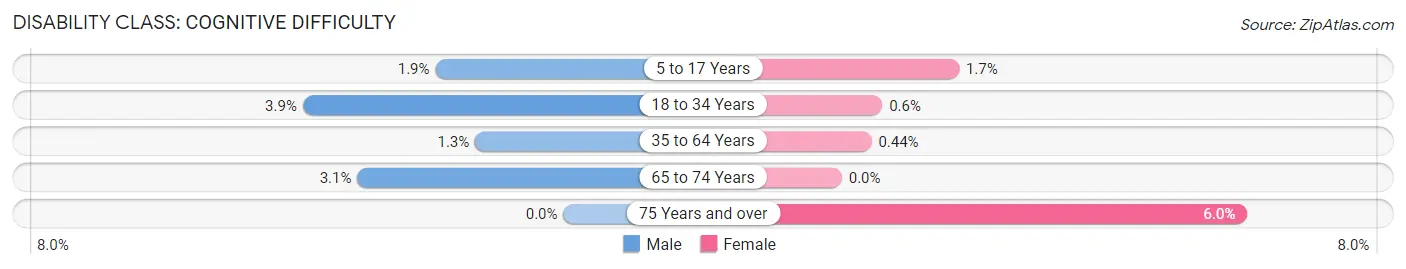
| Age Bracket | Male | Female |
| 5 to 17 Years | 10 (1.9%) | 8 (1.7%) |
| 18 to 34 Years | 13 (3.9%) | 2 (0.6%) |
| 35 to 64 Years | 15 (1.3%) | 5 (0.4%) |
| 65 to 74 Years | 11 (3.1%) | 0 (0.0%) |
| 75 Years and over | 0 (0.0%) | 10 (6.0%) |
Disability Class: Ambulatory Difficulty

| Age Bracket | Male | Female |
| 5 to 17 Years | 0 (0.0%) | 0 (0.0%) |
| 18 to 34 Years | 3 (0.9%) | 0 (0.0%) |
| 35 to 64 Years | 42 (3.7%) | 19 (1.7%) |
| 65 to 74 Years | 39 (10.9%) | 5 (2.1%) |
| 75 Years and over | 9 (11.5%) | 12 (7.2%) |
Disability Class: Self-Care Difficulty
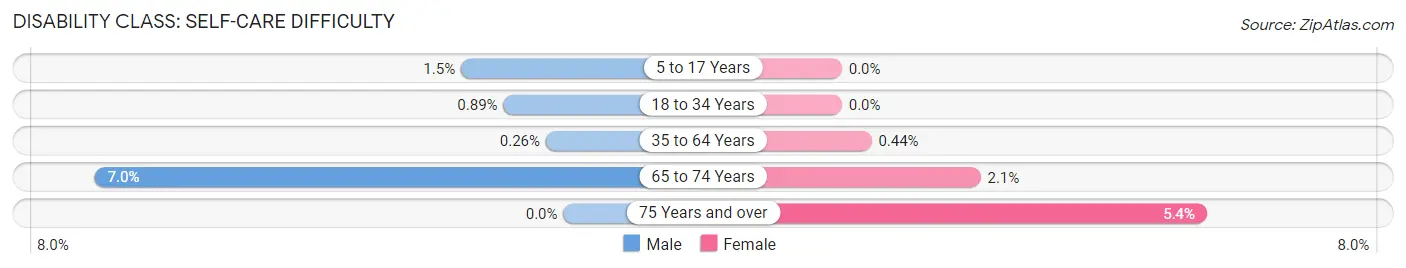
| Age Bracket | Male | Female |
| 5 to 17 Years | 8 (1.5%) | 0 (0.0%) |
| 18 to 34 Years | 3 (0.9%) | 0 (0.0%) |
| 35 to 64 Years | 3 (0.3%) | 5 (0.4%) |
| 65 to 74 Years | 25 (7.0%) | 5 (2.1%) |
| 75 Years and over | 0 (0.0%) | 9 (5.4%) |
Technology Access in Tichigan
Computing Device Access in Tichigan
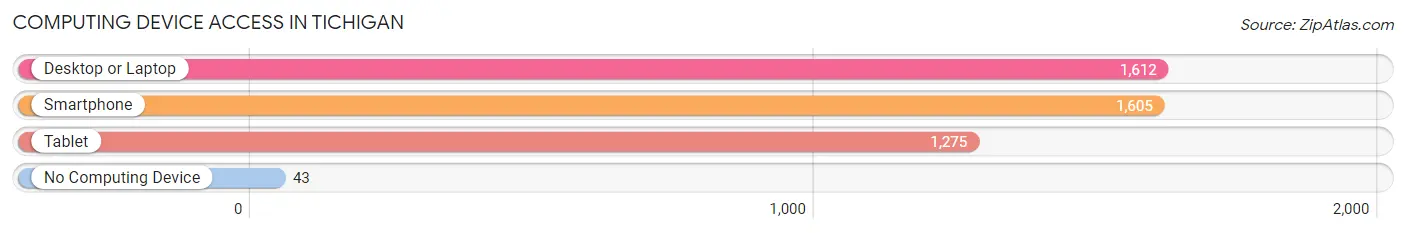
| Device Type | # Households | % Households |
| Desktop or Laptop | 1,612 | 92.4% |
| Smartphone | 1,605 | 92.0% |
| Tablet | 1,275 | 73.1% |
| No Computing Device | 43 | 2.5% |
| Total | 1,745 | 100.0% |
Internet Access in Tichigan
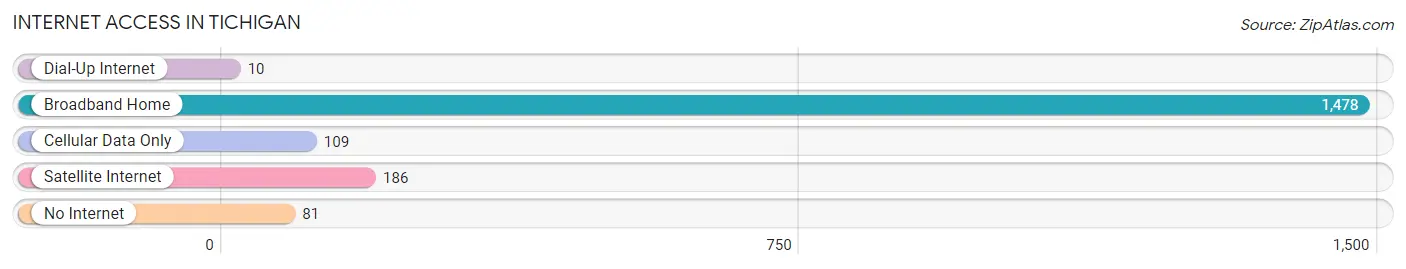
| Internet Type | # Households | % Households |
| Dial-Up Internet | 10 | 0.6% |
| Broadband Home | 1,478 | 84.7% |
| Cellular Data Only | 109 | 6.2% |
| Satellite Internet | 186 | 10.7% |
| No Internet | 81 | 4.6% |
| Total | 1,745 | 100.0% |
Tichigan Summary
Tichigan, Wisconsin is a small village located in Racine County, Wisconsin. It is situated on the western shore of Lake Michigan, about 25 miles south of Milwaukee. The village has a population of approximately 1,000 people and covers an area of 0.7 square miles.
History
Tichigan was first settled in 1836 by a group of German immigrants. The village was named after the Tichigan River, which flows through the area. The river was named after a Native American chief who lived in the area. The village was incorporated in 1891 and has remained a small, rural community ever since.
Geography
Tichigan is located in the southeastern corner of Racine County, Wisconsin. It is situated on the western shore of Lake Michigan, about 25 miles south of Milwaukee. The village is surrounded by the towns of Waterford, Burlington, and Wind Point. The village is located on the Tichigan River, which flows through the area. The river is a popular spot for fishing and boating.
The village has a total area of 0.7 square miles, all of which is land. The terrain is mostly flat, with some rolling hills. The climate is humid continental, with hot summers and cold winters.
Economy
The economy of Tichigan is largely based on agriculture and tourism. The village is home to several small farms, which produce a variety of crops, including corn, soybeans, and wheat. The village also has several small businesses, including a grocery store, a hardware store, and a restaurant.
Tourism is an important part of the local economy. The village is home to several popular attractions, including the Tichigan Wildlife Area, which is a popular spot for bird watching and fishing. The village also has several parks and beaches, which attract visitors from all over the region.
Demographics
As of the 2010 census, the population of Tichigan was 1,000 people. The racial makeup of the village was 97.2% White, 0.7% African American, 0.3% Native American, 0.3% Asian, and 1.5% from other races. The median household income was $50,000, and the median family income was $54,000.
The village is served by the Racine Unified School District. The village has one elementary school, one middle school, and one high school. The village also has several churches, including the Tichigan United Methodist Church and the Tichigan Lutheran Church.
Tichigan is a small, rural village with a rich history and a strong sense of community. The village is home to several small businesses and farms, and is a popular destination for tourists. The village has a diverse population and a strong economy, making it a great place to live and work.
Common Questions
What is Per Capita Income in Tichigan?
Per Capita income in Tichigan is $52,746.
What is the Median Family Income in Tichigan?
Median Family Income in Tichigan is $138,023.
What is the Median Household income in Tichigan?
Median Household Income in Tichigan is $128,352.
What is Income or Wage Gap in Tichigan?
Income or Wage Gap in Tichigan is 44.6%.
Women in Tichigan earn 55.4 cents for every dollar earned by a man.
What is Inequality or Gini Index in Tichigan?
Inequality or Gini Index in Tichigan is 0.36.
What is the Total Population of Tichigan?
Total Population of Tichigan is 5,060.
What is the Total Male Population of Tichigan?
Total Male Population of Tichigan is 2,590.
What is the Total Female Population of Tichigan?
Total Female Population of Tichigan is 2,470.
What is the Ratio of Males per 100 Females in Tichigan?
There are 104.86 Males per 100 Females in Tichigan.
What is the Ratio of Females per 100 Males in Tichigan?
There are 95.37 Females per 100 Males in Tichigan.
What is the Median Population Age in Tichigan?
Median Population Age in Tichigan is 47.1 Years.
What is the Average Family Size in Tichigan
Average Family Size in Tichigan is 3.2 People.
What is the Average Household Size in Tichigan
Average Household Size in Tichigan is 2.9 People.
How Large is the Labor Force in Tichigan?
There are 2,932 People in the Labor Forcein in Tichigan.
What is the Percentage of People in the Labor Force in Tichigan?
74.4% of People are in the Labor Force in Tichigan.
What is the Unemployment Rate in Tichigan?
Unemployment Rate in Tichigan is 2.8%.