Maine, WI Map & Demographics
Maine Map
Maine Overview
$52,695
PER CAPITA INCOME
$124,135
AVG FAMILY INCOME
$103,784
AVG HOUSEHOLD INCOME
37.1%
WAGE / INCOME GAP [ % ]
62.9¢/ $1
WAGE / INCOME GAP [ $ ]
0.41
INEQUALITY / GINI INDEX
2,608
TOTAL POPULATION
1,441
MALE POPULATION
1,167
FEMALE POPULATION
123.48
MALES / 100 FEMALES
80.99
FEMALES / 100 MALES
47.7
MEDIAN AGE
2.9
AVG FAMILY SIZE
2.4
AVG HOUSEHOLD SIZE
1,513
LABOR FORCE [ PEOPLE ]
70.6%
PERCENT IN LABOR FORCE
2.0%
UNEMPLOYMENT RATE
Income in Maine
Income Overview in Maine
Per Capita Income in Maine is $52,695, while median incomes of families and households are $124,135 and $103,784 respectively.
| Characteristic | Number | Measure |
| Per Capita Income | 2,608 | $52,695 |
| Median Family Income | 764 | $124,135 |
| Mean Family Income | 764 | $151,156 |
| Median Household Income | 1,066 | $103,784 |
| Mean Household Income | 1,066 | $128,765 |
| Income Deficit | 764 | $0 |
| Wage / Income Gap (%) | 2,608 | 37.08% |
| Wage / Income Gap ($) | 2,608 | 62.92¢ per $1 |
| Gini / Inequality Index | 2,608 | 0.41 |
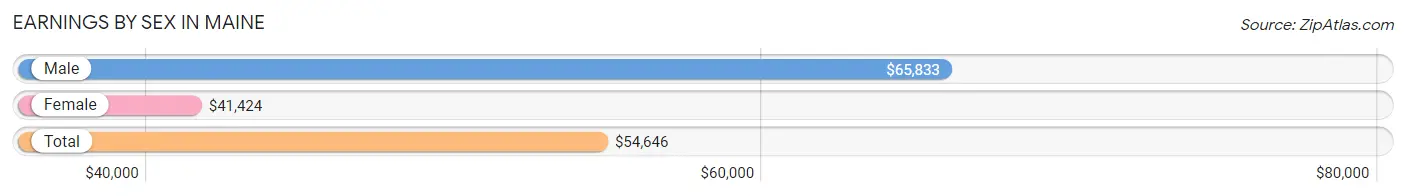
Earnings by Sex in Maine
Average Earnings in Maine are $54,646, $65,833 for men and $41,424 for women, a difference of 37.1%.
| Sex | Number | Average Earnings |
| Male | 884 (52.3%) | $65,833 |
| Female | 805 (47.7%) | $41,424 |
| Total | 1,689 (100.0%) | $54,646 |
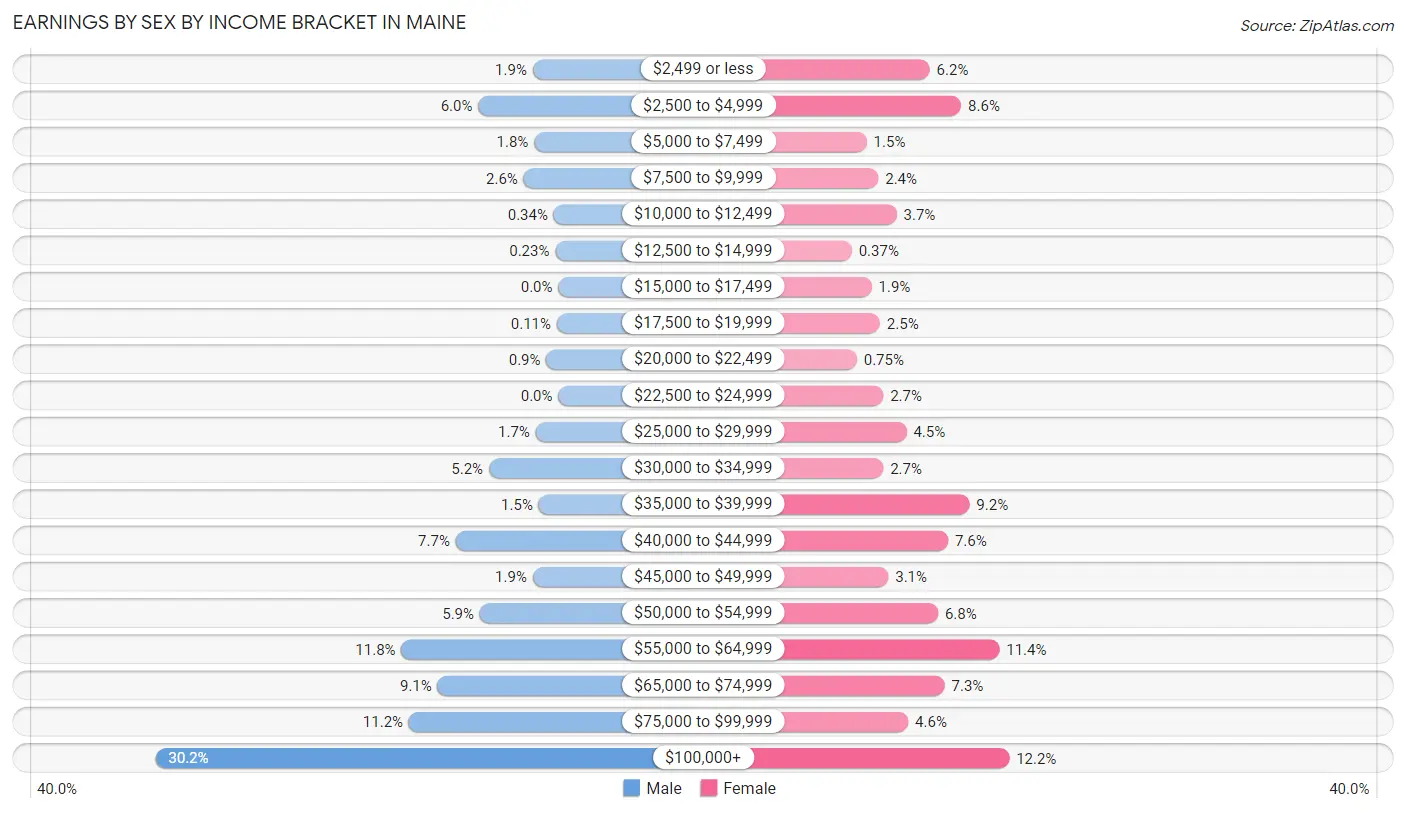
Earnings by Sex by Income Bracket in Maine
The most common earnings brackets in Maine are $100,000+ for men (267 | 30.2%) and $100,000+ for women (98 | 12.2%).
| Income | Male | Female |
| $2,499 or less | 17 (1.9%) | 50 (6.2%) |
| $2,500 to $4,999 | 53 (6.0%) | 69 (8.6%) |
| $5,000 to $7,499 | 16 (1.8%) | 12 (1.5%) |
| $7,500 to $9,999 | 23 (2.6%) | 19 (2.4%) |
| $10,000 to $12,499 | 3 (0.3%) | 30 (3.7%) |
| $12,500 to $14,999 | 2 (0.2%) | 3 (0.4%) |
| $15,000 to $17,499 | 0 (0.0%) | 15 (1.9%) |
| $17,500 to $19,999 | 1 (0.1%) | 20 (2.5%) |
| $20,000 to $22,499 | 8 (0.9%) | 6 (0.7%) |
| $22,500 to $24,999 | 0 (0.0%) | 22 (2.7%) |
| $25,000 to $29,999 | 15 (1.7%) | 36 (4.5%) |
| $30,000 to $34,999 | 46 (5.2%) | 22 (2.7%) |
| $35,000 to $39,999 | 13 (1.5%) | 74 (9.2%) |
| $40,000 to $44,999 | 68 (7.7%) | 61 (7.6%) |
| $45,000 to $49,999 | 17 (1.9%) | 25 (3.1%) |
| $50,000 to $54,999 | 52 (5.9%) | 55 (6.8%) |
| $55,000 to $64,999 | 104 (11.8%) | 92 (11.4%) |
| $65,000 to $74,999 | 80 (9.0%) | 59 (7.3%) |
| $75,000 to $99,999 | 99 (11.2%) | 37 (4.6%) |
| $100,000+ | 267 (30.2%) | 98 (12.2%) |
| Total | 884 (100.0%) | 805 (100.0%) |
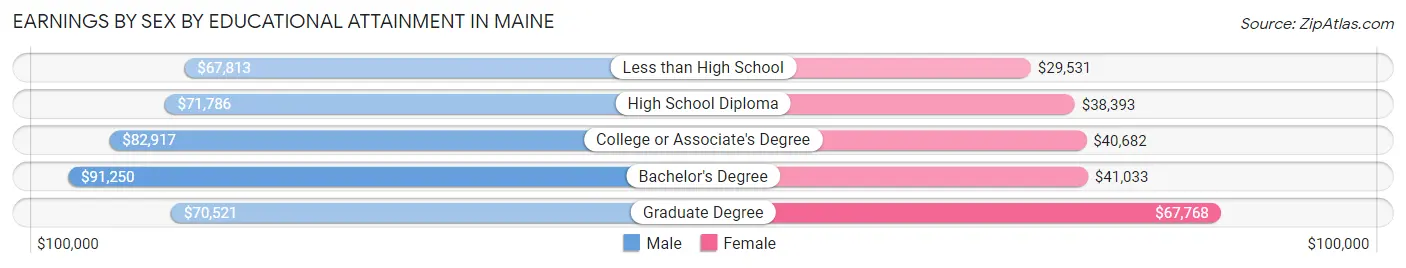
Earnings by Sex by Educational Attainment in Maine
Average earnings in Maine are $75,577 for men and $42,375 for women, a difference of 43.9%. Men with an educational attainment of bachelor's degree enjoy the highest average annual earnings of $91,250, while those with less than high school education earn the least with $67,813. Women with an educational attainment of graduate degree earn the most with the average annual earnings of $67,768, while those with less than high school education have the smallest earnings of $29,531.
| Educational Attainment | Male Income | Female Income |
| Less than High School | $67,813 | $29,531 |
| High School Diploma | $71,786 | $38,393 |
| College or Associate's Degree | $82,917 | $40,682 |
| Bachelor's Degree | $91,250 | $41,033 |
| Graduate Degree | $70,521 | $67,768 |
| Total | $75,577 | $42,375 |
Family Income in Maine
Family Income Brackets in Maine
According to the Maine family income data, there are 215 families falling into the $100,000 to $149,999 income range, which is the most common income bracket and makes up 28.1% of all families.
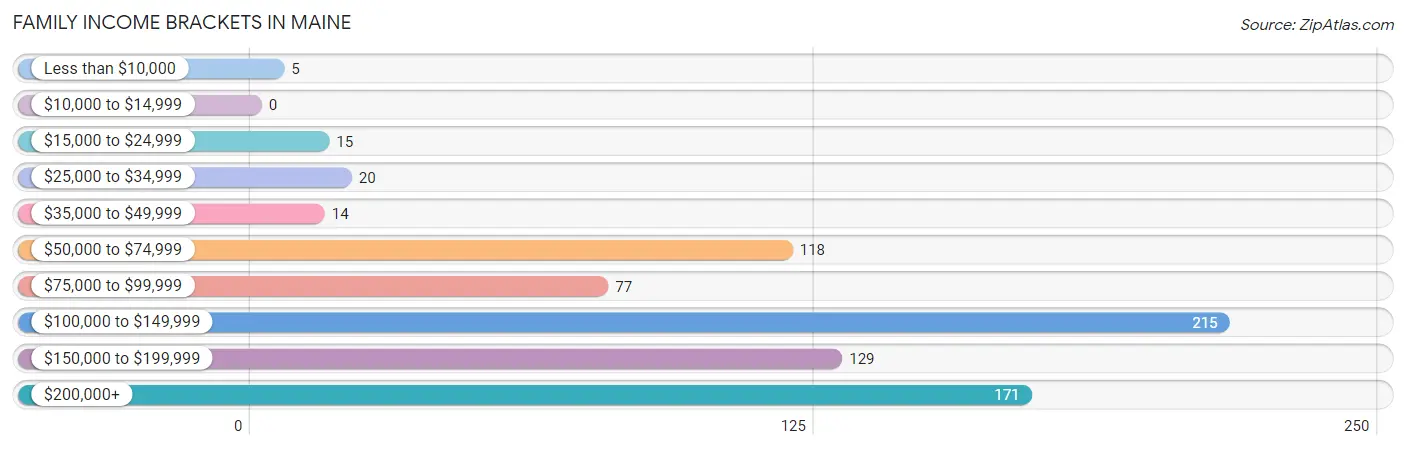
| Income Bracket | # Families | % Families |
| Less than $10,000 | 5 | 0.7% |
| $10,000 to $14,999 | 0 | 0.0% |
| $15,000 to $24,999 | 15 | 2.0% |
| $25,000 to $34,999 | 20 | 2.6% |
| $35,000 to $49,999 | 14 | 1.8% |
| $50,000 to $74,999 | 118 | 15.4% |
| $75,000 to $99,999 | 77 | 10.1% |
| $100,000 to $149,999 | 215 | 28.1% |
| $150,000 to $199,999 | 129 | 16.9% |
| $200,000+ | 171 | 22.4% |
Family Income by Famaliy Size in Maine
3-person families (181 | 23.7%) account for the highest median family income in Maine with $184,250 per family, while 3-person families (181 | 23.7%) have the highest median income of $61,417 per family member.
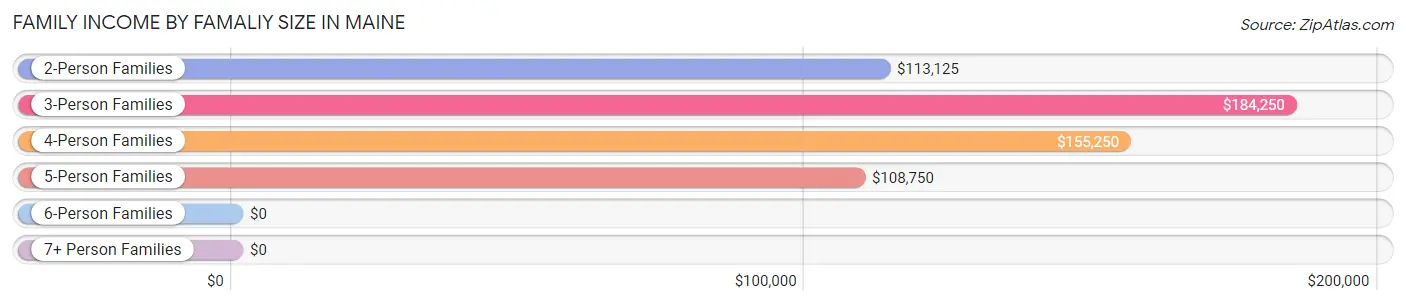
| Income Bracket | # Families | Median Income |
| 2-Person Families | 368 (48.2%) | $113,125 |
| 3-Person Families | 181 (23.7%) | $184,250 |
| 4-Person Families | 147 (19.2%) | $155,250 |
| 5-Person Families | 60 (7.9%) | $108,750 |
| 6-Person Families | 8 (1.1%) | $0 |
| 7+ Person Families | 0 (0.0%) | $0 |
| Total | 764 (100.0%) | $124,135 |
Family Income by Number of Earners in Maine
The median family income in Maine is $124,135, with families comprising 3+ earners (133) having the highest median family income of $197,792, while families with no earners (90) have the lowest median family income of $62,955, accounting for 17.4% and 11.8% of families, respectively.
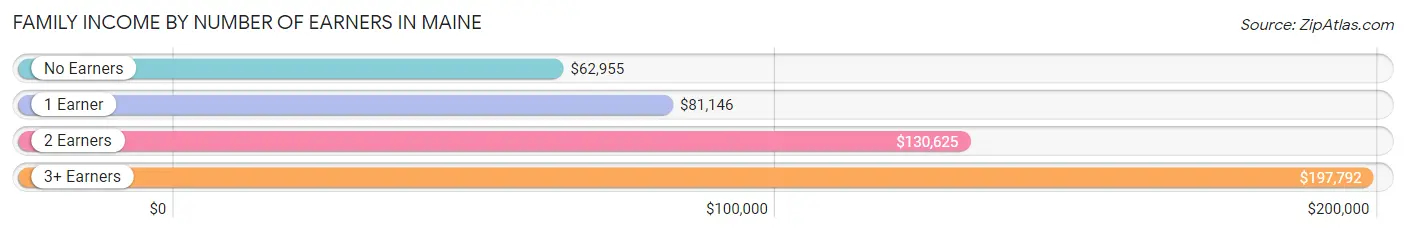
| Number of Earners | # Families | Median Income |
| No Earners | 90 (11.8%) | $62,955 |
| 1 Earner | 123 (16.1%) | $81,146 |
| 2 Earners | 418 (54.7%) | $130,625 |
| 3+ Earners | 133 (17.4%) | $197,792 |
| Total | 764 (100.0%) | $124,135 |
Household Income in Maine
Household Income Brackets in Maine
With 255 households falling in the category, the $100,000 to $149,999 income range is the most frequent in Maine, accounting for 23.9% of all households. In contrast, only 12 households (1.1%) fall into the $10,000 to $14,999 income bracket, making it the least populous group.
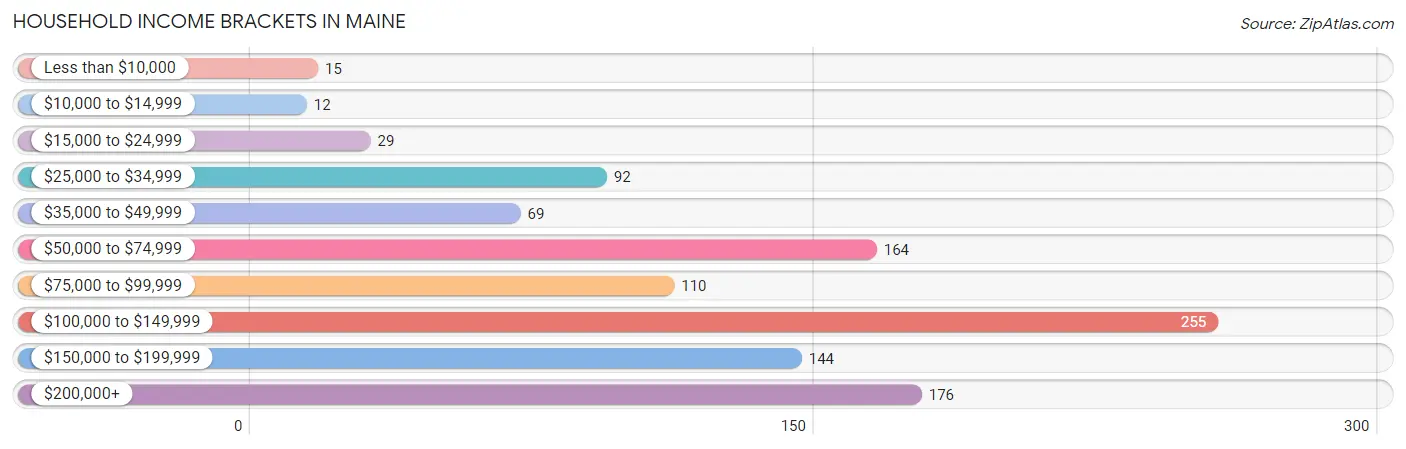
| Income Bracket | # Households | % Households |
| Less than $10,000 | 15 | 1.4% |
| $10,000 to $14,999 | 12 | 1.1% |
| $15,000 to $24,999 | 29 | 2.7% |
| $25,000 to $34,999 | 92 | 8.6% |
| $35,000 to $49,999 | 69 | 6.5% |
| $50,000 to $74,999 | 164 | 15.4% |
| $75,000 to $99,999 | 110 | 10.3% |
| $100,000 to $149,999 | 255 | 23.9% |
| $150,000 to $199,999 | 144 | 13.5% |
| $200,000+ | 176 | 16.5% |
Household Income by Householder Age in Maine
The median household income in Maine is $103,784, with the highest median household income of $140,833 found in the 45 to 64 years age bracket for the primary householder. A total of 524 households (49.2%) fall into this category. Meanwhile, the 65+ years age bracket for the primary householder has the lowest median household income of $63,977, with 267 households (25.1%) in this group.
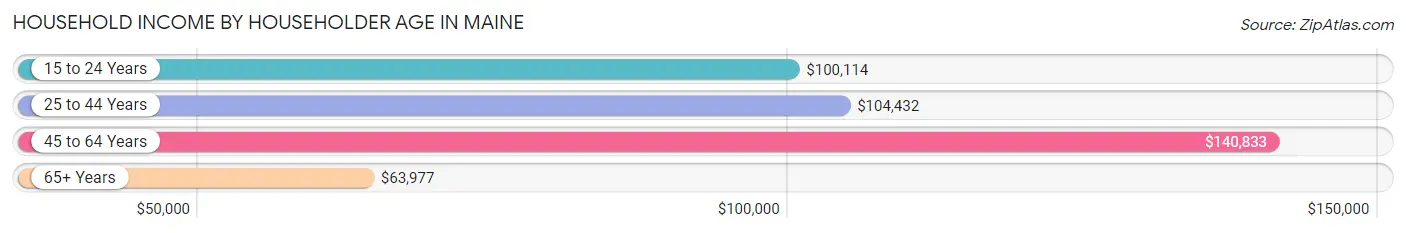
| Income Bracket | # Households | Median Income |
| 15 to 24 Years | 43 (4.0%) | $100,114 |
| 25 to 44 Years | 232 (21.8%) | $104,432 |
| 45 to 64 Years | 524 (49.2%) | $140,833 |
| 65+ Years | 267 (25.1%) | $63,977 |
| Total | 1,066 (100.0%) | $103,784 |
Poverty in Maine
Income Below Poverty by Sex and Age in Maine
With 1.7% poverty level for males and 3.5% for females among the residents of Maine, 65 to 74 year old males and 16 and 17 year old females are the most vulnerable to poverty, with 8 males (5.2%) and 9 females (26.5%) in their respective age groups living below the poverty level.
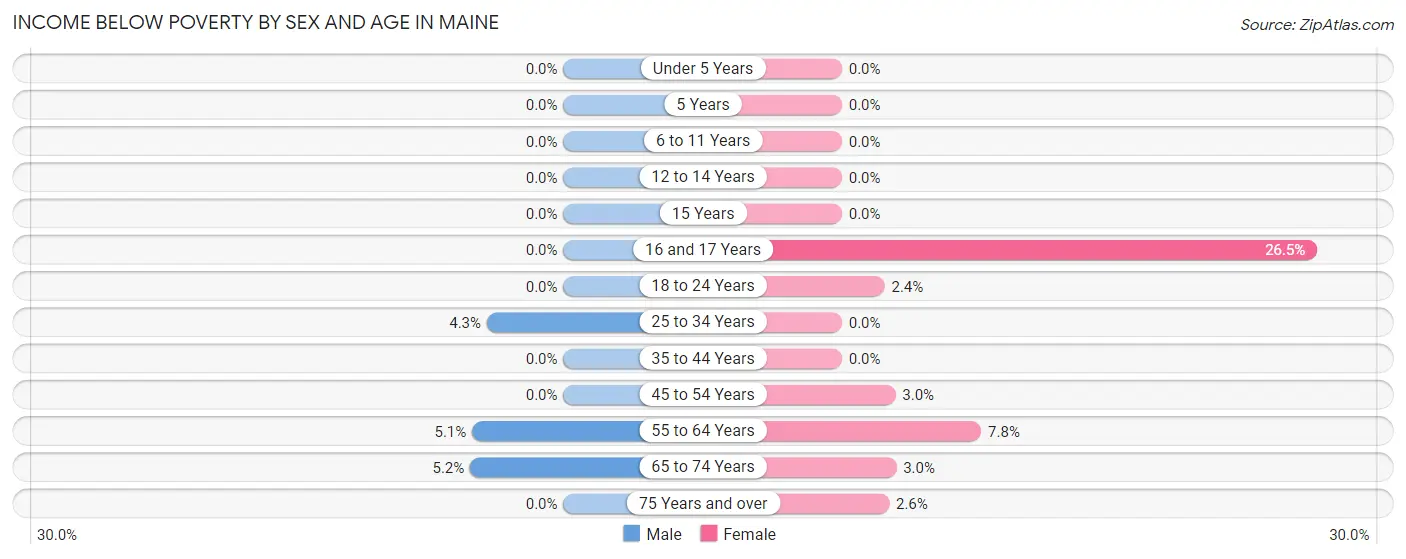
| Age Bracket | Male | Female |
| Under 5 Years | 0 (0.0%) | 0 (0.0%) |
| 5 Years | 0 (0.0%) | 0 (0.0%) |
| 6 to 11 Years | 0 (0.0%) | 0 (0.0%) |
| 12 to 14 Years | 0 (0.0%) | 0 (0.0%) |
| 15 Years | 0 (0.0%) | 0 (0.0%) |
| 16 and 17 Years | 0 (0.0%) | 9 (26.5%) |
| 18 to 24 Years | 0 (0.0%) | 1 (2.4%) |
| 25 to 34 Years | 4 (4.3%) | 0 (0.0%) |
| 35 to 44 Years | 0 (0.0%) | 0 (0.0%) |
| 45 to 54 Years | 0 (0.0%) | 7 (3.0%) |
| 55 to 64 Years | 12 (5.1%) | 18 (7.8%) |
| 65 to 74 Years | 8 (5.2%) | 4 (3.0%) |
| 75 Years and over | 0 (0.0%) | 2 (2.6%) |
| Total | 24 (1.7%) | 41 (3.5%) |
Income Above Poverty by Sex and Age in Maine
According to the poverty statistics in Maine, males aged under 5 years and females aged under 5 years are the age groups that are most secure financially, with 100.0% of males and 100.0% of females in these age groups living above the poverty line.
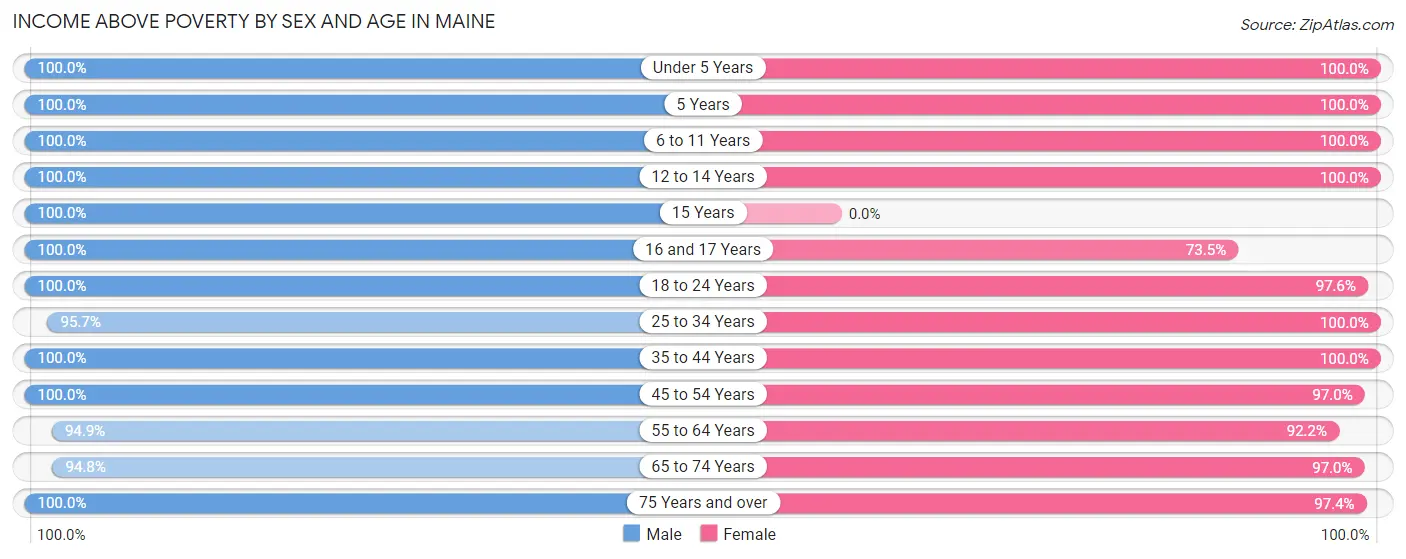
| Age Bracket | Male | Female |
| Under 5 Years | 112 (100.0%) | 39 (100.0%) |
| 5 Years | 30 (100.0%) | 7 (100.0%) |
| 6 to 11 Years | 47 (100.0%) | 70 (100.0%) |
| 12 to 14 Years | 50 (100.0%) | 31 (100.0%) |
| 15 Years | 57 (100.0%) | 0 (0.0%) |
| 16 and 17 Years | 63 (100.0%) | 25 (73.5%) |
| 18 to 24 Years | 110 (100.0%) | 41 (97.6%) |
| 25 to 34 Years | 90 (95.7%) | 122 (100.0%) |
| 35 to 44 Years | 137 (100.0%) | 137 (100.0%) |
| 45 to 54 Years | 263 (100.0%) | 228 (97.0%) |
| 55 to 64 Years | 224 (94.9%) | 214 (92.2%) |
| 65 to 74 Years | 146 (94.8%) | 128 (97.0%) |
| 75 Years and over | 75 (100.0%) | 74 (97.4%) |
| Total | 1,404 (98.3%) | 1,116 (96.5%) |
Income Below Poverty Among Married-Couple Families in Maine
The poverty statistics for married-couple families in Maine show that 0.5% or 4 of the total 726 families live below the poverty line. Families with no children have the highest poverty rate of 0.8%, comprising of 4 families. On the other hand, families with 1 or 2 children have the lowest poverty rate of 0.0%, which includes 0 families.
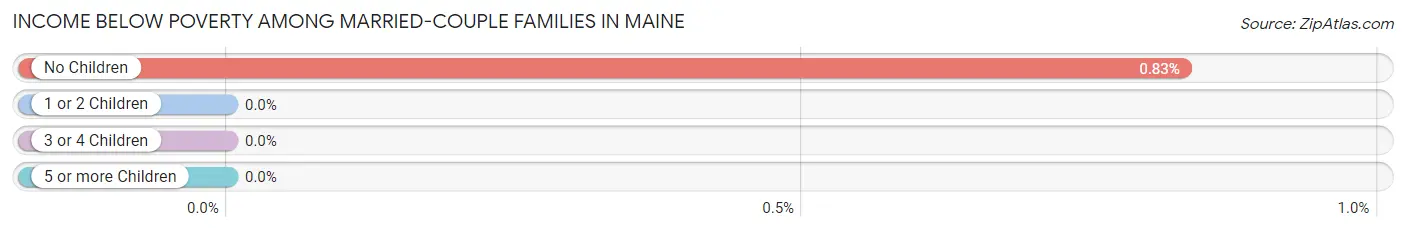
| Children | Above Poverty | Below Poverty |
| No Children | 476 (99.2%) | 4 (0.8%) |
| 1 or 2 Children | 191 (100.0%) | 0 (0.0%) |
| 3 or 4 Children | 55 (100.0%) | 0 (0.0%) |
| 5 or more Children | 0 (0.0%) | 0 (0.0%) |
| Total | 722 (99.5%) | 4 (0.5%) |
Income Below Poverty Among Single-Parent Households in Maine
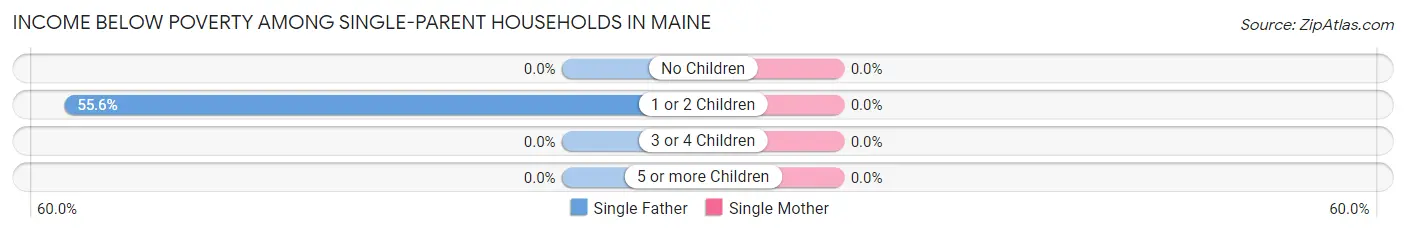
| Children | Single Father | Single Mother |
| No Children | 0 (0.0%) | 0 (0.0%) |
| 1 or 2 Children | 5 (55.6%) | 0 (0.0%) |
| 3 or 4 Children | 0 (0.0%) | 0 (0.0%) |
| 5 or more Children | 0 (0.0%) | 0 (0.0%) |
| Total | 5 (33.3%) | 0 (0.0%) |
Income Below Poverty Among Married-Couple vs Single-Parent Households in Maine
The poverty data for Maine shows that 4 of the married-couple family households (0.5%) and 5 of the single-parent households (13.2%) are living below the poverty level. Within the married-couple family households, those with no children have the highest poverty rate, with 4 households (0.8%) falling below the poverty line. Among the single-parent households, those with 1 or 2 children have the highest poverty rate, with 5 household (18.5%) living below poverty.
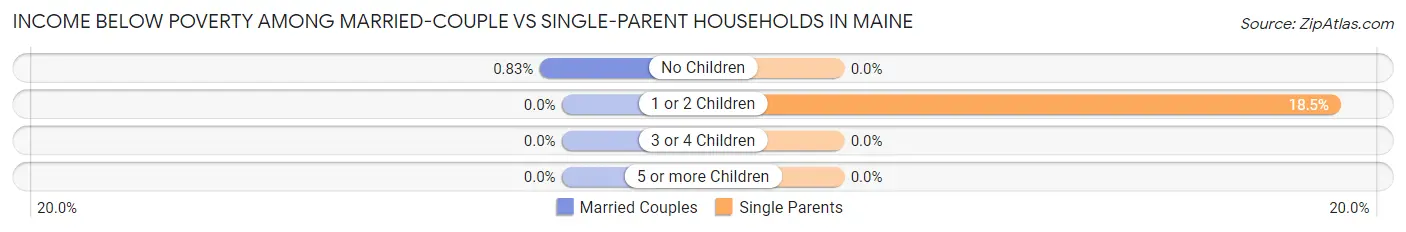
| Children | Married-Couple Families | Single-Parent Households |
| No Children | 4 (0.8%) | 0 (0.0%) |
| 1 or 2 Children | 0 (0.0%) | 5 (18.5%) |
| 3 or 4 Children | 0 (0.0%) | 0 (0.0%) |
| 5 or more Children | 0 (0.0%) | 0 (0.0%) |
| Total | 4 (0.5%) | 5 (13.2%) |
Race in Maine
The most populous races in Maine are White / Caucasian (2,484 | 95.3%), Asian (79 | 3.0%), and Two or more Races (33 | 1.3%).
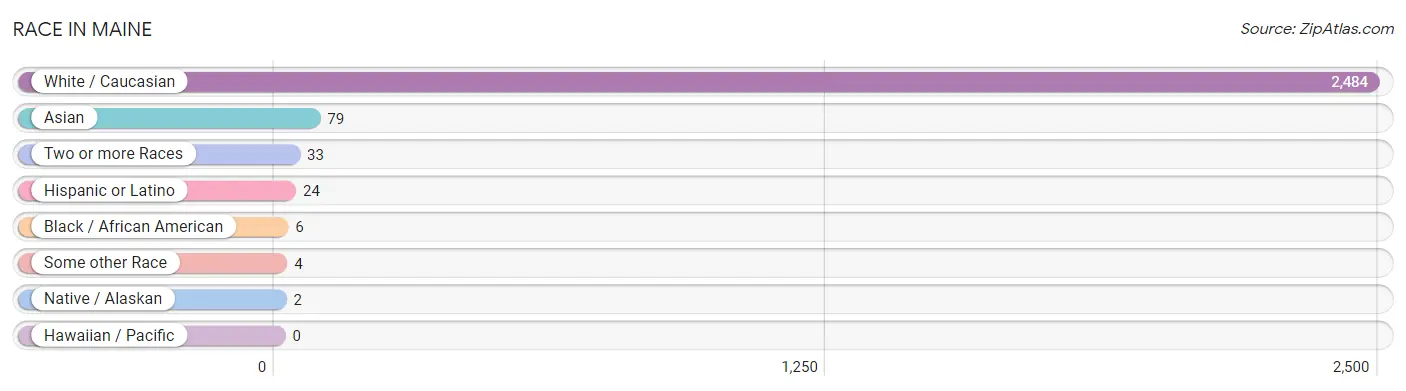
| Race | # Population | % Population |
| Asian | 79 | 3.0% |
| Black / African American | 6 | 0.2% |
| Hawaiian / Pacific | 0 | 0.0% |
| Hispanic or Latino | 24 | 0.9% |
| Native / Alaskan | 2 | 0.1% |
| White / Caucasian | 2,484 | 95.3% |
| Two or more Races | 33 | 1.3% |
| Some other Race | 4 | 0.2% |
| Total | 2,608 | 100.0% |
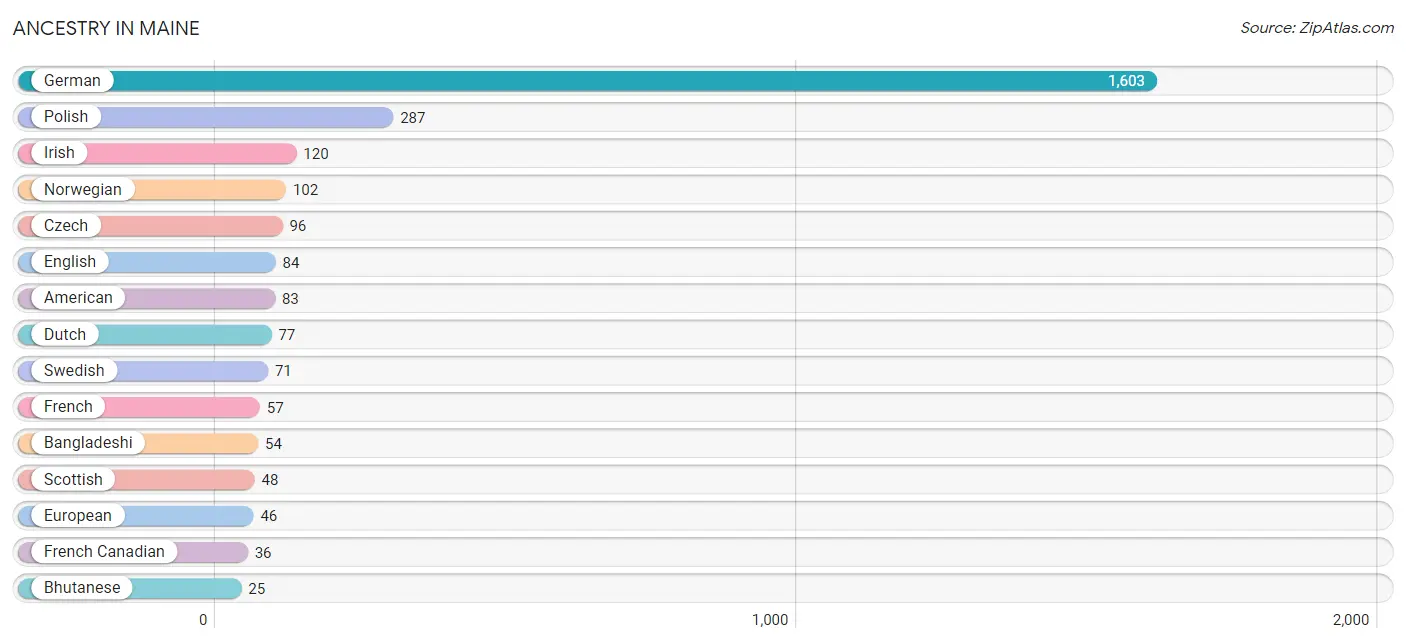
Ancestry in Maine
The most populous ancestries reported in Maine are German (1,603 | 61.5%), Polish (287 | 11.0%), Irish (120 | 4.6%), Norwegian (102 | 3.9%), and Czech (96 | 3.7%), together accounting for 84.7% of all Maine residents.
| Ancestry | # Population | % Population |
| American | 83 | 3.2% |
| Austrian | 3 | 0.1% |
| Bangladeshi | 54 | 2.1% |
| Belgian | 11 | 0.4% |
| Bhutanese | 25 | 1.0% |
| British | 21 | 0.8% |
| Canadian | 5 | 0.2% |
| Chippewa | 2 | 0.1% |
| Czech | 96 | 3.7% |
| Czechoslovakian | 5 | 0.2% |
| Danish | 5 | 0.2% |
| Dutch | 77 | 2.9% |
| Eastern European | 7 | 0.3% |
| English | 84 | 3.2% |
| European | 46 | 1.8% |
| Finnish | 5 | 0.2% |
| French | 57 | 2.2% |
| French Canadian | 36 | 1.4% |
| German | 1,603 | 61.5% |
| Greek | 14 | 0.5% |
| Iranian | 3 | 0.1% |
| Irish | 120 | 4.6% |
| Italian | 20 | 0.8% |
| Luxembourger | 2 | 0.1% |
| Mexican | 9 | 0.4% |
| Northern European | 5 | 0.2% |
| Norwegian | 102 | 3.9% |
| Polish | 287 | 11.0% |
| Scandinavian | 15 | 0.6% |
| Scotch-Irish | 7 | 0.3% |
| Scottish | 48 | 1.8% |
| Slovak | 1 | 0.0% |
| South American | 3 | 0.1% |
| Spanish | 12 | 0.5% |
| Swedish | 71 | 2.7% |
| Swiss | 8 | 0.3% |
| Venezuelan | 3 | 0.1% | View All 37 Rows |
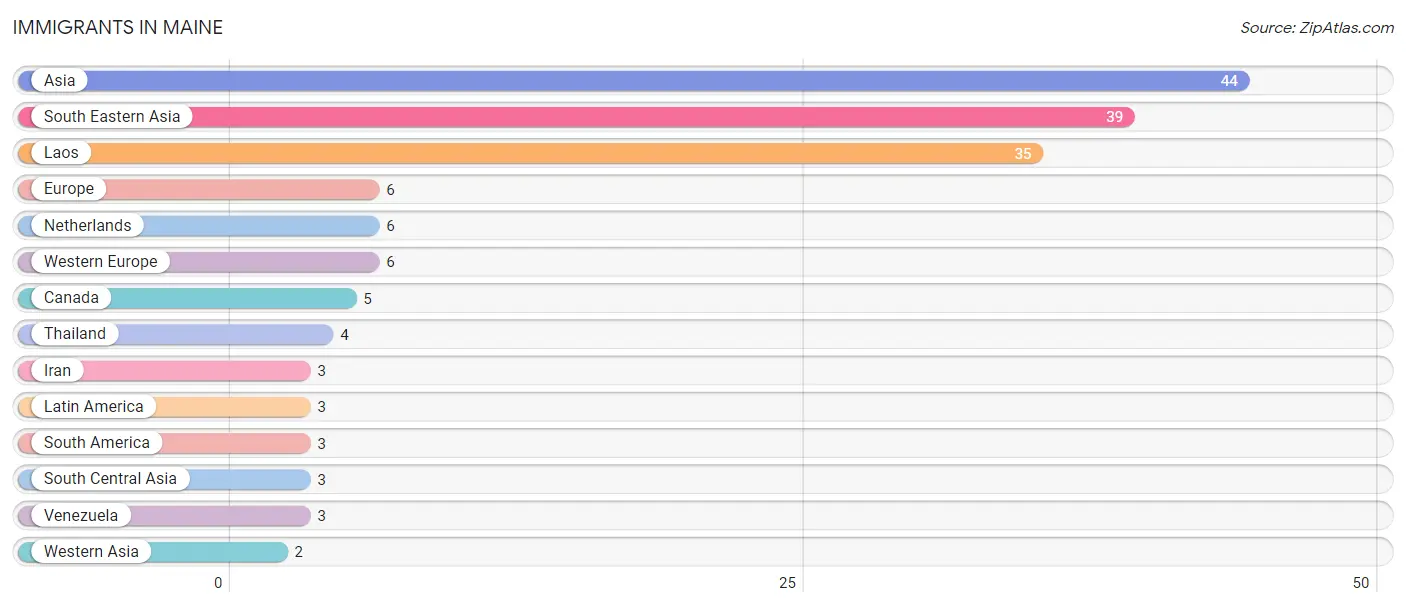
Immigrants in Maine
The most numerous immigrant groups reported in Maine came from Asia (44 | 1.7%), South Eastern Asia (39 | 1.5%), Laos (35 | 1.3%), Europe (6 | 0.2%), and Netherlands (6 | 0.2%), together accounting for 5.0% of all Maine residents.
| Immigration Origin | # Population | % Population |
| Asia | 44 | 1.7% |
| Canada | 5 | 0.2% |
| Europe | 6 | 0.2% |
| Iran | 3 | 0.1% |
| Laos | 35 | 1.3% |
| Latin America | 3 | 0.1% |
| Netherlands | 6 | 0.2% |
| South America | 3 | 0.1% |
| South Central Asia | 3 | 0.1% |
| South Eastern Asia | 39 | 1.5% |
| Thailand | 4 | 0.2% |
| Venezuela | 3 | 0.1% |
| Western Asia | 2 | 0.1% |
| Western Europe | 6 | 0.2% | View All 14 Rows |
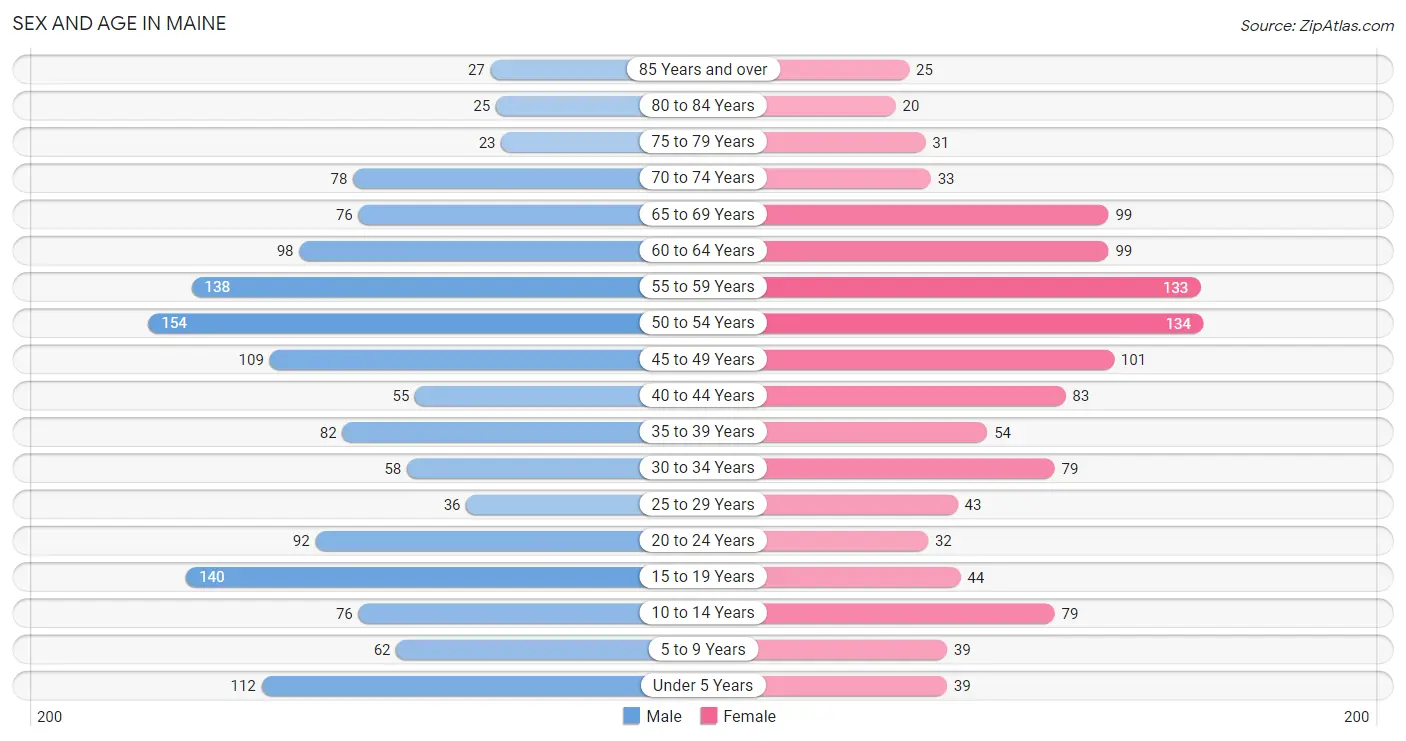
Sex and Age in Maine
Sex and Age in Maine
The most populous age groups in Maine are 50 to 54 Years (154 | 10.7%) for men and 50 to 54 Years (134 | 11.5%) for women.
| Age Bracket | Male | Female |
| Under 5 Years | 112 (7.8%) | 39 (3.3%) |
| 5 to 9 Years | 62 (4.3%) | 39 (3.3%) |
| 10 to 14 Years | 76 (5.3%) | 79 (6.8%) |
| 15 to 19 Years | 140 (9.7%) | 44 (3.8%) |
| 20 to 24 Years | 92 (6.4%) | 32 (2.7%) |
| 25 to 29 Years | 36 (2.5%) | 43 (3.7%) |
| 30 to 34 Years | 58 (4.0%) | 79 (6.8%) |
| 35 to 39 Years | 82 (5.7%) | 54 (4.6%) |
| 40 to 44 Years | 55 (3.8%) | 83 (7.1%) |
| 45 to 49 Years | 109 (7.6%) | 101 (8.6%) |
| 50 to 54 Years | 154 (10.7%) | 134 (11.5%) |
| 55 to 59 Years | 138 (9.6%) | 133 (11.4%) |
| 60 to 64 Years | 98 (6.8%) | 99 (8.5%) |
| 65 to 69 Years | 76 (5.3%) | 99 (8.5%) |
| 70 to 74 Years | 78 (5.4%) | 33 (2.8%) |
| 75 to 79 Years | 23 (1.6%) | 31 (2.7%) |
| 80 to 84 Years | 25 (1.7%) | 20 (1.7%) |
| 85 Years and over | 27 (1.9%) | 25 (2.1%) |
| Total | 1,441 (100.0%) | 1,167 (100.0%) |
Families and Households in Maine
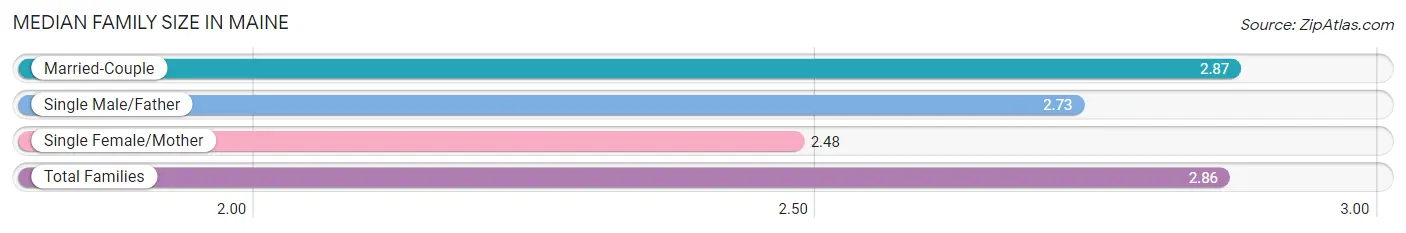
Median Family Size in Maine
The median family size in Maine is 2.86 persons per family, with married-couple families (726 | 95.0%) accounting for the largest median family size of 2.87 persons per family. On the other hand, single female/mother families (23 | 3.0%) represent the smallest median family size with 2.48 persons per family.
| Family Type | # Families | Family Size |
| Married-Couple | 726 (95.0%) | 2.87 |
| Single Male/Father | 15 (2.0%) | 2.73 |
| Single Female/Mother | 23 (3.0%) | 2.48 |
| Total Families | 764 (100.0%) | 2.86 |
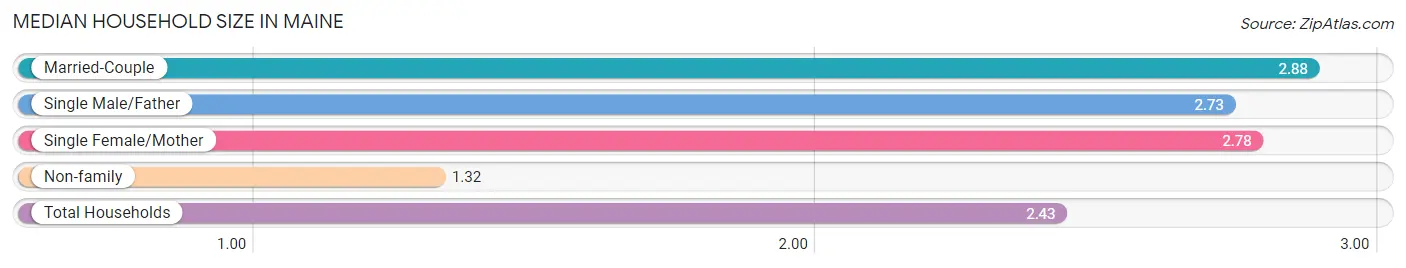
Median Household Size in Maine
The median household size in Maine is 2.43 persons per household, with married-couple households (726 | 68.1%) accounting for the largest median household size of 2.88 persons per household. non-family households (302 | 28.3%) represent the smallest median household size with 1.32 persons per household.
| Household Type | # Households | Household Size |
| Married-Couple | 726 (68.1%) | 2.88 |
| Single Male/Father | 15 (1.4%) | 2.73 |
| Single Female/Mother | 23 (2.2%) | 2.78 |
| Non-family | 302 (28.3%) | 1.32 |
| Total Households | 1,066 (100.0%) | 2.43 |
Household Size by Marriage Status in Maine
Out of a total of 1,066 households in Maine, 764 (71.7%) are family households, while 302 (28.3%) are nonfamily households. The most numerous type of family households are 2-person households, comprising 357, and the most common type of nonfamily households are 1-person households, comprising 222.
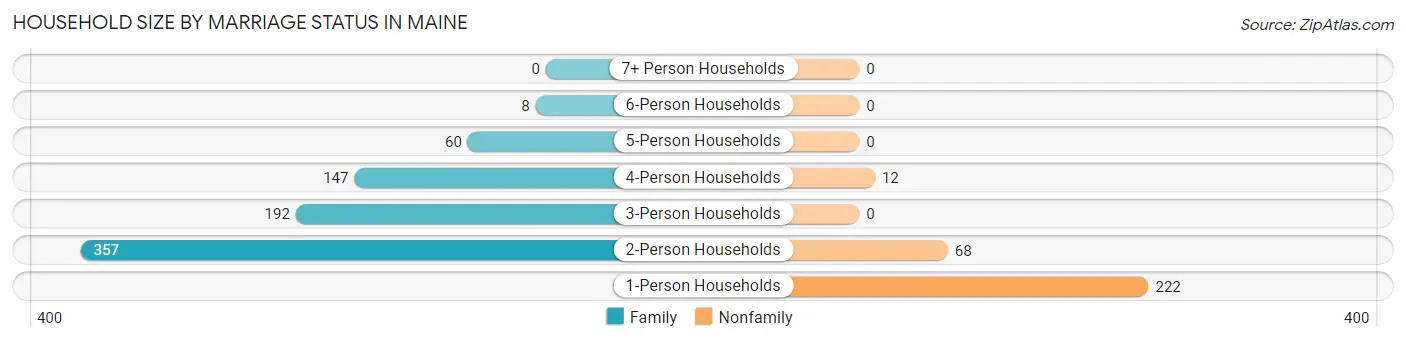
| Household Size | Family Households | Nonfamily Households |
| 1-Person Households | - | 222 (20.8%) |
| 2-Person Households | 357 (33.5%) | 68 (6.4%) |
| 3-Person Households | 192 (18.0%) | 0 (0.0%) |
| 4-Person Households | 147 (13.8%) | 12 (1.1%) |
| 5-Person Households | 60 (5.6%) | 0 (0.0%) |
| 6-Person Households | 8 (0.7%) | 0 (0.0%) |
| 7+ Person Households | 0 (0.0%) | 0 (0.0%) |
| Total | 764 (71.7%) | 302 (28.3%) |
Female Fertility in Maine
Fertility by Age in Maine
Average fertility rate in Maine is 34.0 births per 1,000 women. Women in the age bracket of 20 to 34 years have the highest fertility rate with 97.0 births per 1,000 women. Women in the age bracket of 20 to 34 years acount for 100.0% of all women with births.
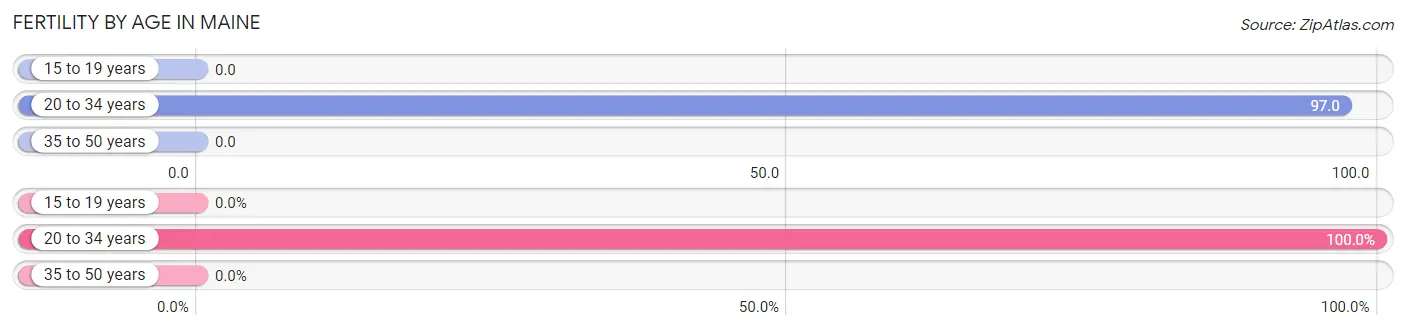
| Age Bracket | Women with Births | Births / 1,000 Women |
| 15 to 19 years | 0 (0.0%) | 0.0 |
| 20 to 34 years | 15 (100.0%) | 97.0 |
| 35 to 50 years | 0 (0.0%) | 0.0 |
| Total | 15 (100.0%) | 34.0 |
Fertility by Age by Marriage Status in Maine
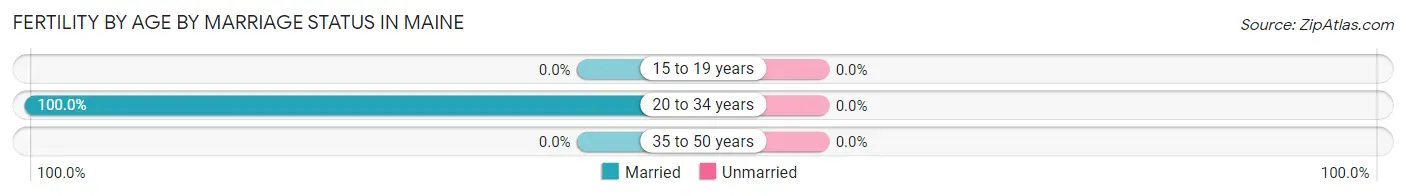
| Age Bracket | Married | Unmarried |
| 15 to 19 years | 0 (0.0%) | 0 (0.0%) |
| 20 to 34 years | 15 (100.0%) | 0 (0.0%) |
| 35 to 50 years | 0 (0.0%) | 0 (0.0%) |
| Total | 15 (100.0%) | 0 (0.0%) |
Fertility by Education in Maine
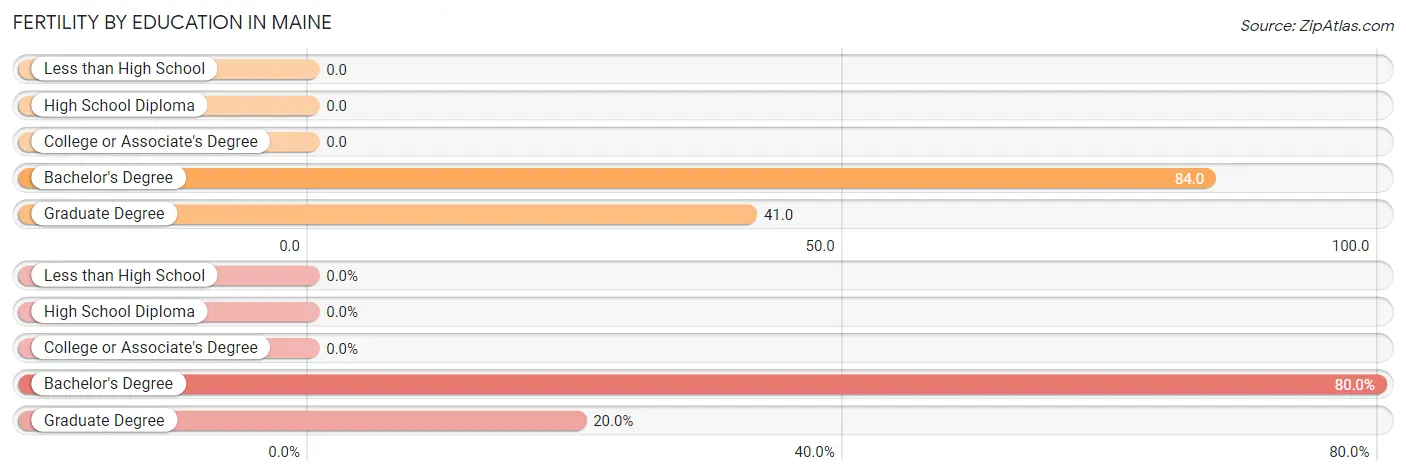
| Educational Attainment | Women with Births | Births / 1,000 Women |
| Less than High School | 0 (0.0%) | 0.0 |
| High School Diploma | 0 (0.0%) | 0.0 |
| College or Associate's Degree | 0 (0.0%) | 0.0 |
| Bachelor's Degree | 12 (80.0%) | 84.0 |
| Graduate Degree | 3 (20.0%) | 41.0 |
| Total | 15 (100.0%) | 34.0 |
Fertility by Education by Marriage Status in Maine
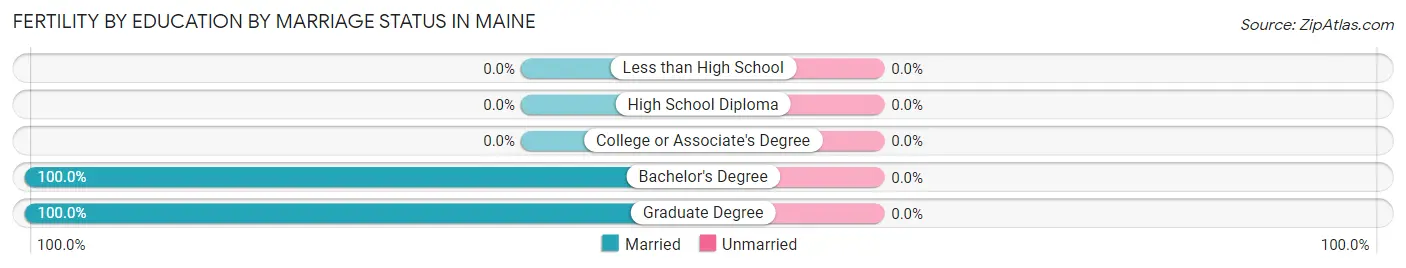
| Educational Attainment | Married | Unmarried |
| Less than High School | 0 (0.0%) | 0 (0.0%) |
| High School Diploma | 0 (0.0%) | 0 (0.0%) |
| College or Associate's Degree | 0 (0.0%) | 0 (0.0%) |
| Bachelor's Degree | 12 (100.0%) | 0 (0.0%) |
| Graduate Degree | 3 (100.0%) | 0 (0.0%) |
| Total | 15 (100.0%) | 0 (0.0%) |
Employment Characteristics in Maine
Employment by Class of Employer in Maine
Among the 1,477 employed individuals in Maine, private company employees (1,083 | 73.3%), not-for-profit organizations (161 | 10.9%), and local government employees (101 | 6.8%) make up the most common classes of employment.
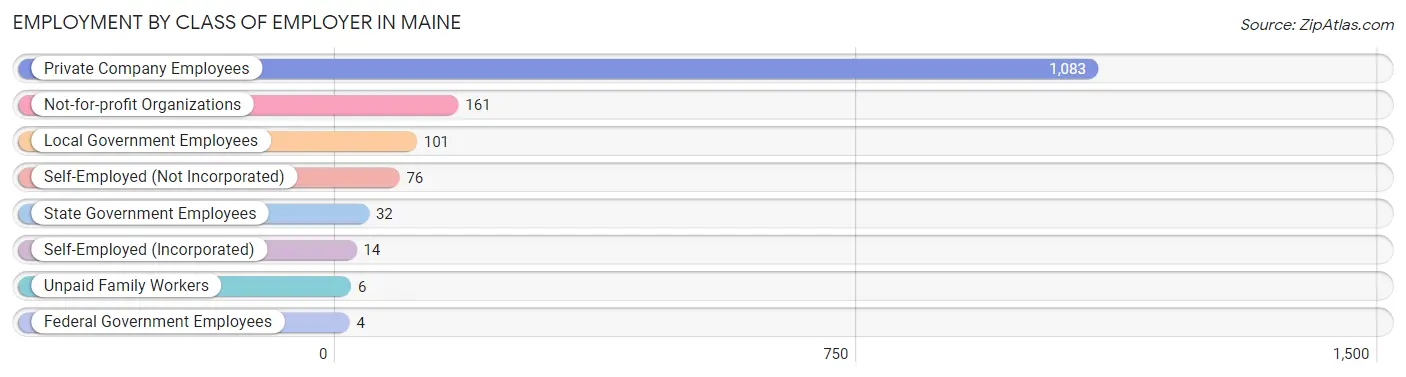
| Employer Class | # Employees | % Employees |
| Private Company Employees | 1,083 | 73.3% |
| Self-Employed (Incorporated) | 14 | 0.9% |
| Self-Employed (Not Incorporated) | 76 | 5.1% |
| Not-for-profit Organizations | 161 | 10.9% |
| Local Government Employees | 101 | 6.8% |
| State Government Employees | 32 | 2.2% |
| Federal Government Employees | 4 | 0.3% |
| Unpaid Family Workers | 6 | 0.4% |
| Total | 1,477 | 100.0% |
Employment Status by Age in Maine
According to the labor force statistics for Maine, out of the total population over 16 years of age (2,143), 70.6% or 1,513 individuals are in the labor force, with 2.0% or 30 of them unemployed. The age group with the highest labor force participation rate is 20 to 24 years, with 100.0% or 124 individuals in the labor force. Within the labor force, the 25 to 29 years age range has the highest percentage of unemployed individuals, with 21.3% or 16 of them being unemployed.
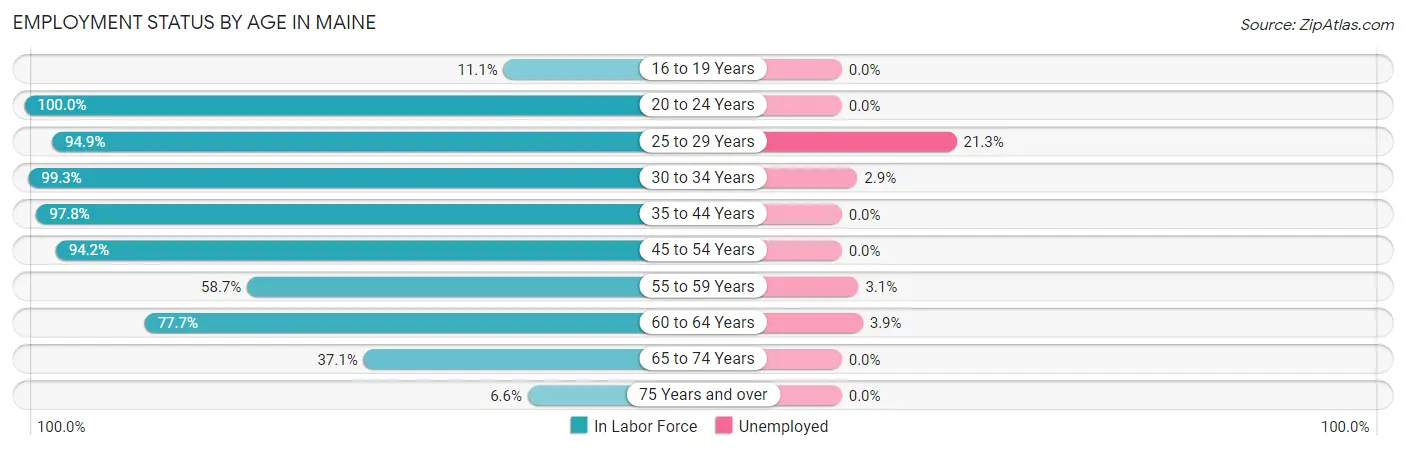
| Age Bracket | In Labor Force | Unemployed |
| 16 to 19 Years | 14 (11.1%) | 0 (0.0%) |
| 20 to 24 Years | 124 (100.0%) | 0 (0.0%) |
| 25 to 29 Years | 75 (94.9%) | 16 (21.3%) |
| 30 to 34 Years | 136 (99.3%) | 4 (2.9%) |
| 35 to 44 Years | 268 (97.8%) | 0 (0.0%) |
| 45 to 54 Years | 469 (94.2%) | 0 (0.0%) |
| 55 to 59 Years | 159 (58.7%) | 5 (3.1%) |
| 60 to 64 Years | 153 (77.7%) | 6 (3.9%) |
| 65 to 74 Years | 106 (37.1%) | 0 (0.0%) |
| 75 Years and over | 10 (6.6%) | 0 (0.0%) |
| Total | 1,513 (70.6%) | 30 (2.0%) |
Employment Status by Educational Attainment in Maine
According to labor force statistics for Maine, 86.5% of individuals (1,259) out of the total population between 25 and 64 years of age (1,456) are in the labor force, with 2.5% or 31 of them being unemployed. The group with the highest labor force participation rate are those with the educational attainment of bachelor's degree or higher, with 90.0% or 403 individuals in the labor force. Within the labor force, individuals with high school diploma education have the highest percentage of unemployment, with 6.2% or 16 of them being unemployed.
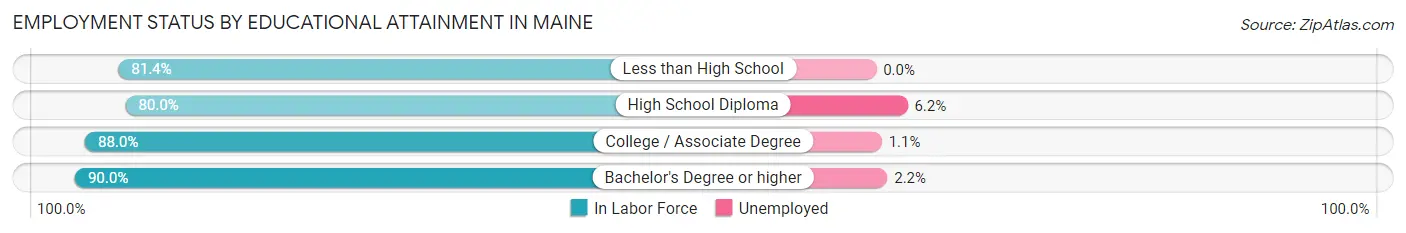
| Educational Attainment | In Labor Force | Unemployed |
| Less than High School | 48 (81.4%) | 0 (0.0%) |
| High School Diploma | 260 (80.0%) | 20 (6.2%) |
| College / Associate Degree | 549 (88.0%) | 7 (1.1%) |
| Bachelor's Degree or higher | 403 (90.0%) | 10 (2.2%) |
| Total | 1,259 (86.5%) | 36 (2.5%) |
Employment Occupations by Sex in Maine
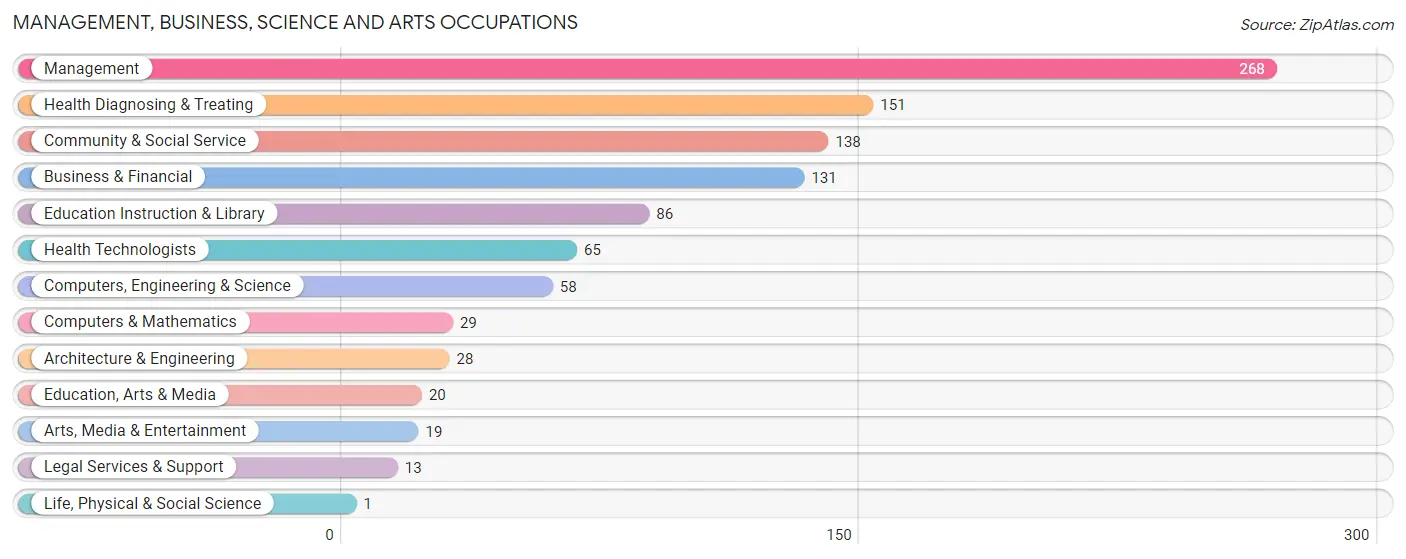
Management, Business, Science and Arts Occupations
The most common Management, Business, Science and Arts occupations in Maine are Management (268 | 18.1%), Health Diagnosing & Treating (151 | 10.2%), Community & Social Service (138 | 9.3%), Business & Financial (131 | 8.8%), and Education Instruction & Library (86 | 5.8%).
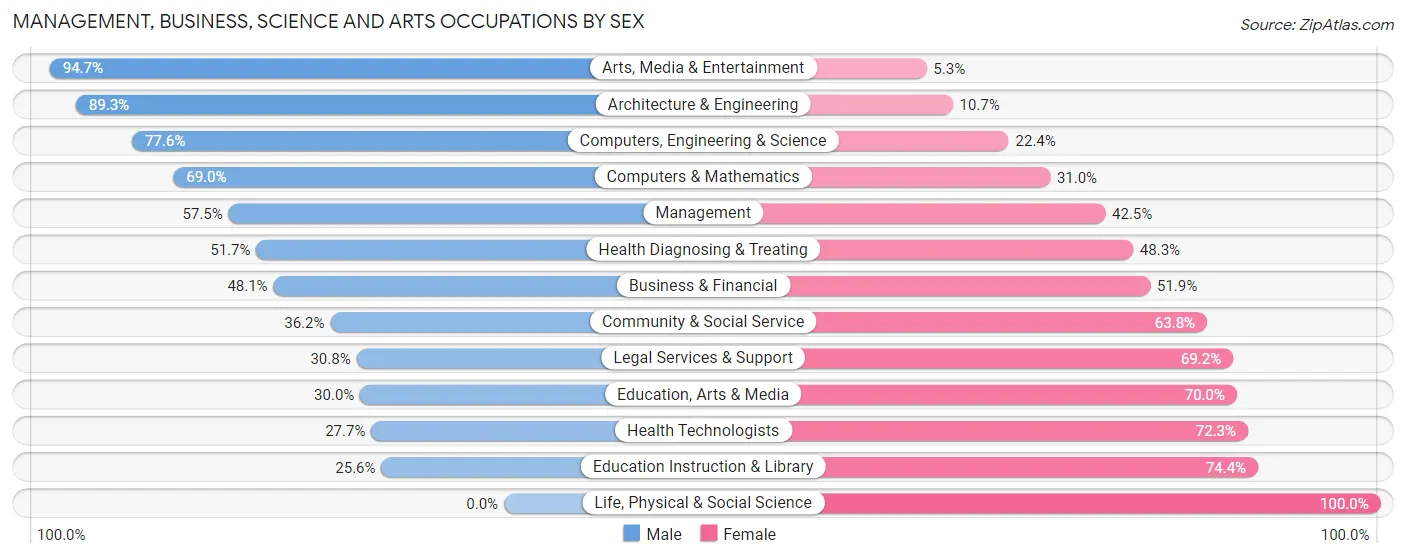
Management, Business, Science and Arts Occupations by Sex
Within the Management, Business, Science and Arts occupations in Maine, the most male-oriented occupations are Arts, Media & Entertainment (94.7%), Architecture & Engineering (89.3%), and Computers, Engineering & Science (77.6%), while the most female-oriented occupations are Life, Physical & Social Science (100.0%), Education Instruction & Library (74.4%), and Health Technologists (72.3%).
| Occupation | Male | Female |
| Management | 154 (57.5%) | 114 (42.5%) |
| Business & Financial | 63 (48.1%) | 68 (51.9%) |
| Computers, Engineering & Science | 45 (77.6%) | 13 (22.4%) |
| Computers & Mathematics | 20 (69.0%) | 9 (31.0%) |
| Architecture & Engineering | 25 (89.3%) | 3 (10.7%) |
| Life, Physical & Social Science | 0 (0.0%) | 1 (100.0%) |
| Community & Social Service | 50 (36.2%) | 88 (63.8%) |
| Education, Arts & Media | 6 (30.0%) | 14 (70.0%) |
| Legal Services & Support | 4 (30.8%) | 9 (69.2%) |
| Education Instruction & Library | 22 (25.6%) | 64 (74.4%) |
| Arts, Media & Entertainment | 18 (94.7%) | 1 (5.3%) |
| Health Diagnosing & Treating | 78 (51.7%) | 73 (48.3%) |
| Health Technologists | 18 (27.7%) | 47 (72.3%) |
| Total (Category) | 390 (52.3%) | 356 (47.7%) |
| Total (Overall) | 777 (52.4%) | 706 (47.6%) |
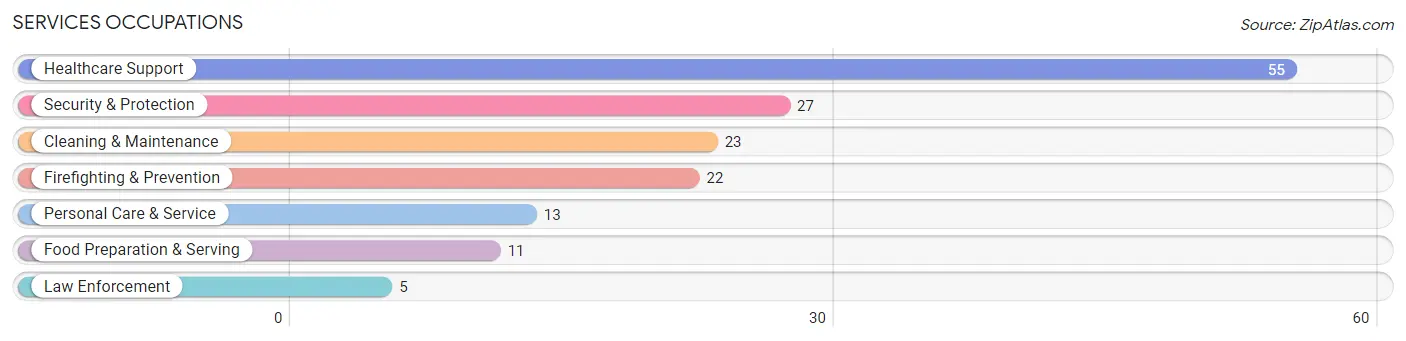
Services Occupations
The most common Services occupations in Maine are Healthcare Support (55 | 3.7%), Security & Protection (27 | 1.8%), Cleaning & Maintenance (23 | 1.5%), Firefighting & Prevention (22 | 1.5%), and Personal Care & Service (13 | 0.9%).
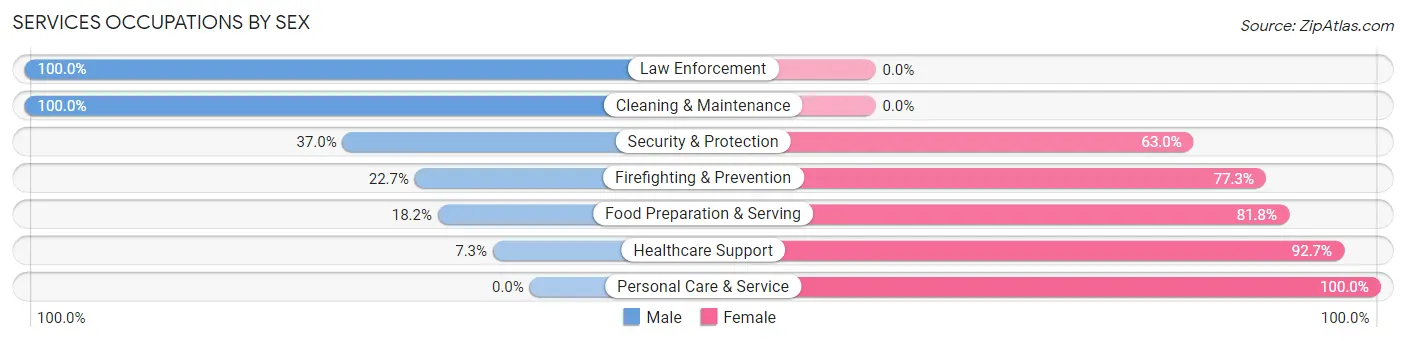
Services Occupations by Sex
Within the Services occupations in Maine, the most male-oriented occupations are Law Enforcement (100.0%), Cleaning & Maintenance (100.0%), and Security & Protection (37.0%), while the most female-oriented occupations are Personal Care & Service (100.0%), Healthcare Support (92.7%), and Food Preparation & Serving (81.8%).
| Occupation | Male | Female |
| Healthcare Support | 4 (7.3%) | 51 (92.7%) |
| Security & Protection | 10 (37.0%) | 17 (63.0%) |
| Firefighting & Prevention | 5 (22.7%) | 17 (77.3%) |
| Law Enforcement | 5 (100.0%) | 0 (0.0%) |
| Food Preparation & Serving | 2 (18.2%) | 9 (81.8%) |
| Cleaning & Maintenance | 23 (100.0%) | 0 (0.0%) |
| Personal Care & Service | 0 (0.0%) | 13 (100.0%) |
| Total (Category) | 39 (30.2%) | 90 (69.8%) |
| Total (Overall) | 777 (52.4%) | 706 (47.6%) |
Sales and Office Occupations
The most common Sales and Office occupations in Maine are Office & Administration (164 | 11.1%), and Sales & Related (157 | 10.6%).

Sales and Office Occupations by Sex

| Occupation | Male | Female |
| Sales & Related | 76 (48.4%) | 81 (51.6%) |
| Office & Administration | 21 (12.8%) | 143 (87.2%) |
| Total (Category) | 97 (30.2%) | 224 (69.8%) |
| Total (Overall) | 777 (52.4%) | 706 (47.6%) |
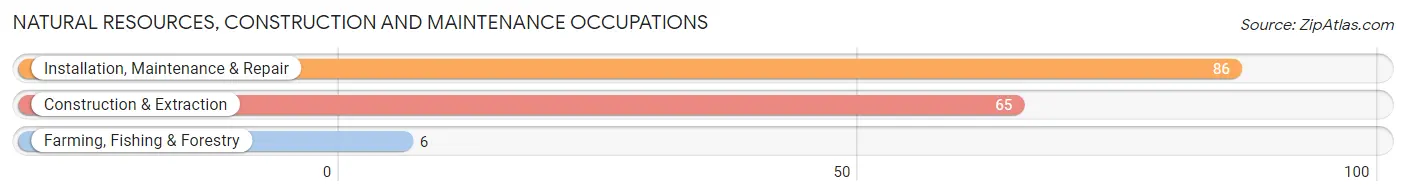
Natural Resources, Construction and Maintenance Occupations
The most common Natural Resources, Construction and Maintenance occupations in Maine are Installation, Maintenance & Repair (86 | 5.8%), Construction & Extraction (65 | 4.4%), and Farming, Fishing & Forestry (6 | 0.4%).
Natural Resources, Construction and Maintenance Occupations by Sex
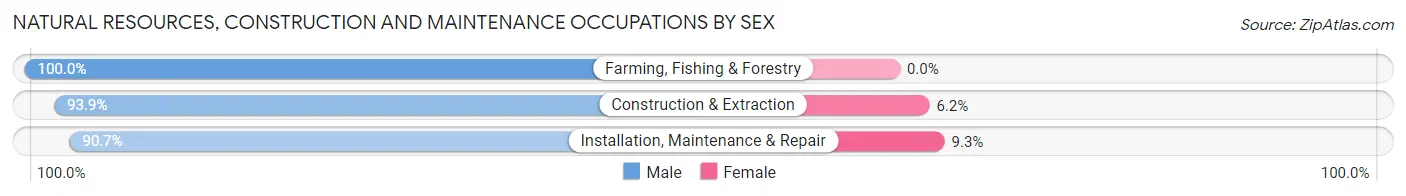
| Occupation | Male | Female |
| Farming, Fishing & Forestry | 6 (100.0%) | 0 (0.0%) |
| Construction & Extraction | 61 (93.9%) | 4 (6.1%) |
| Installation, Maintenance & Repair | 78 (90.7%) | 8 (9.3%) |
| Total (Category) | 145 (92.4%) | 12 (7.6%) |
| Total (Overall) | 777 (52.4%) | 706 (47.6%) |
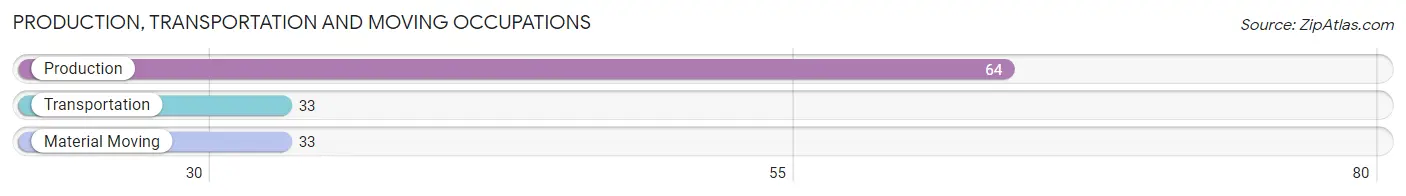
Production, Transportation and Moving Occupations
The most common Production, Transportation and Moving occupations in Maine are Production (64 | 4.3%), Transportation (33 | 2.2%), and Material Moving (33 | 2.2%).
Production, Transportation and Moving Occupations by Sex
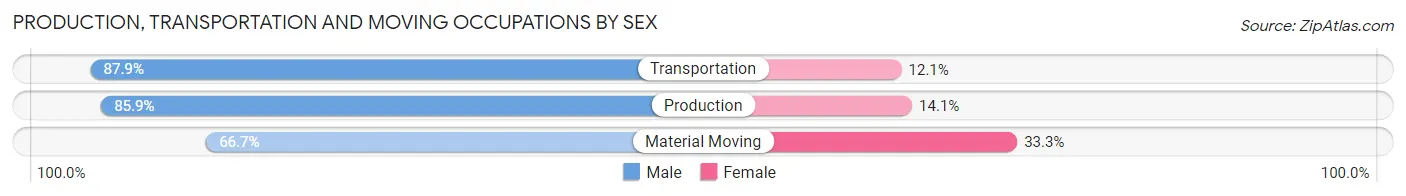
| Occupation | Male | Female |
| Production | 55 (85.9%) | 9 (14.1%) |
| Transportation | 29 (87.9%) | 4 (12.1%) |
| Material Moving | 22 (66.7%) | 11 (33.3%) |
| Total (Category) | 106 (81.5%) | 24 (18.5%) |
| Total (Overall) | 777 (52.4%) | 706 (47.6%) |
Employment Industries by Sex in Maine
Employment Industries in Maine
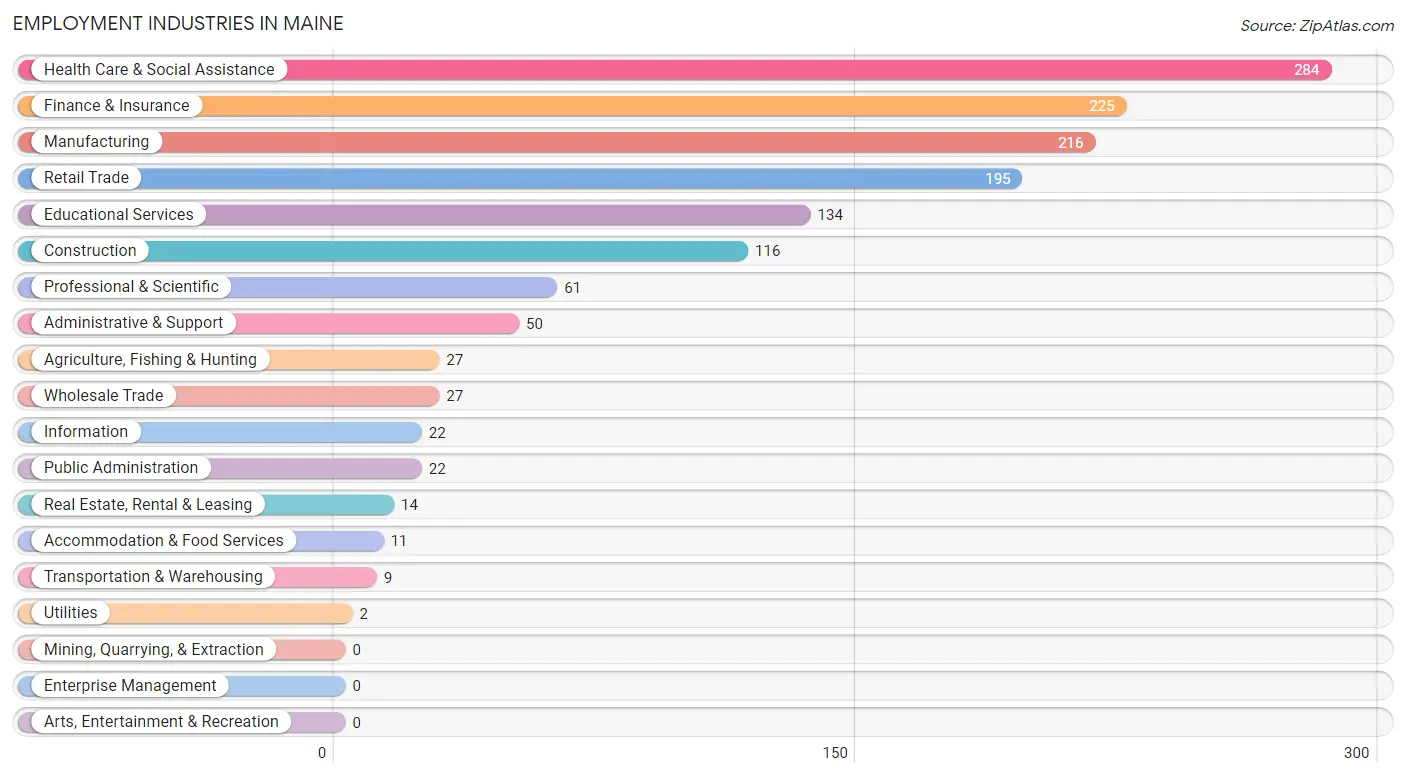
The major employment industries in Maine include Health Care & Social Assistance (284 | 19.2%), Finance & Insurance (225 | 15.2%), Manufacturing (216 | 14.6%), Retail Trade (195 | 13.2%), and Educational Services (134 | 9.0%).
Employment Industries by Sex in Maine
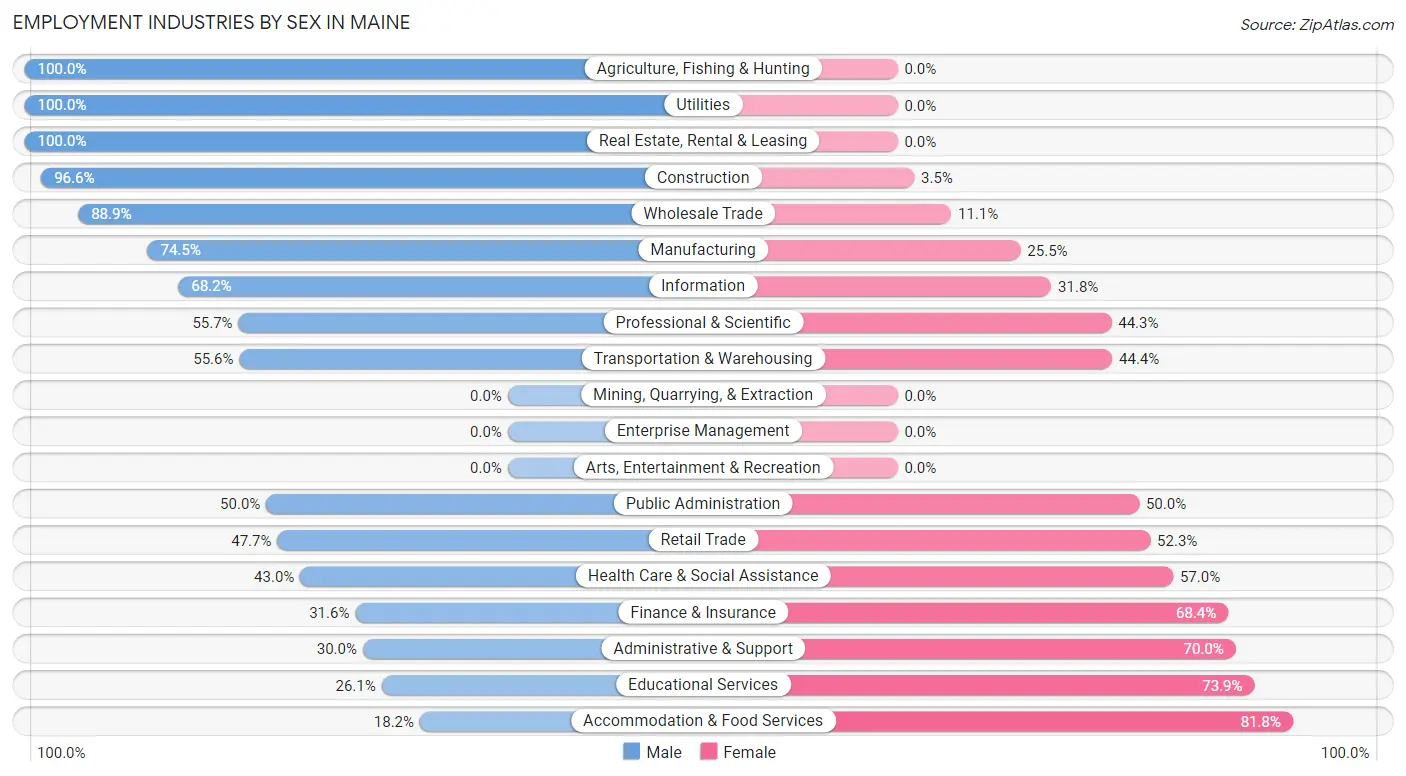
The Maine industries that see more men than women are Agriculture, Fishing & Hunting (100.0%), Utilities (100.0%), and Real Estate, Rental & Leasing (100.0%), whereas the industries that tend to have a higher number of women are Accommodation & Food Services (81.8%), Educational Services (73.9%), and Administrative & Support (70.0%).
| Industry | Male | Female |
| Agriculture, Fishing & Hunting | 27 (100.0%) | 0 (0.0%) |
| Mining, Quarrying, & Extraction | 0 (0.0%) | 0 (0.0%) |
| Construction | 112 (96.6%) | 4 (3.5%) |
| Manufacturing | 161 (74.5%) | 55 (25.5%) |
| Wholesale Trade | 24 (88.9%) | 3 (11.1%) |
| Retail Trade | 93 (47.7%) | 102 (52.3%) |
| Transportation & Warehousing | 5 (55.6%) | 4 (44.4%) |
| Utilities | 2 (100.0%) | 0 (0.0%) |
| Information | 15 (68.2%) | 7 (31.8%) |
| Finance & Insurance | 71 (31.6%) | 154 (68.4%) |
| Real Estate, Rental & Leasing | 14 (100.0%) | 0 (0.0%) |
| Professional & Scientific | 34 (55.7%) | 27 (44.3%) |
| Enterprise Management | 0 (0.0%) | 0 (0.0%) |
| Administrative & Support | 15 (30.0%) | 35 (70.0%) |
| Educational Services | 35 (26.1%) | 99 (73.9%) |
| Health Care & Social Assistance | 122 (43.0%) | 162 (57.0%) |
| Arts, Entertainment & Recreation | 0 (0.0%) | 0 (0.0%) |
| Accommodation & Food Services | 2 (18.2%) | 9 (81.8%) |
| Public Administration | 11 (50.0%) | 11 (50.0%) |
| Total | 777 (52.4%) | 706 (47.6%) |
Education in Maine
School Enrollment in Maine
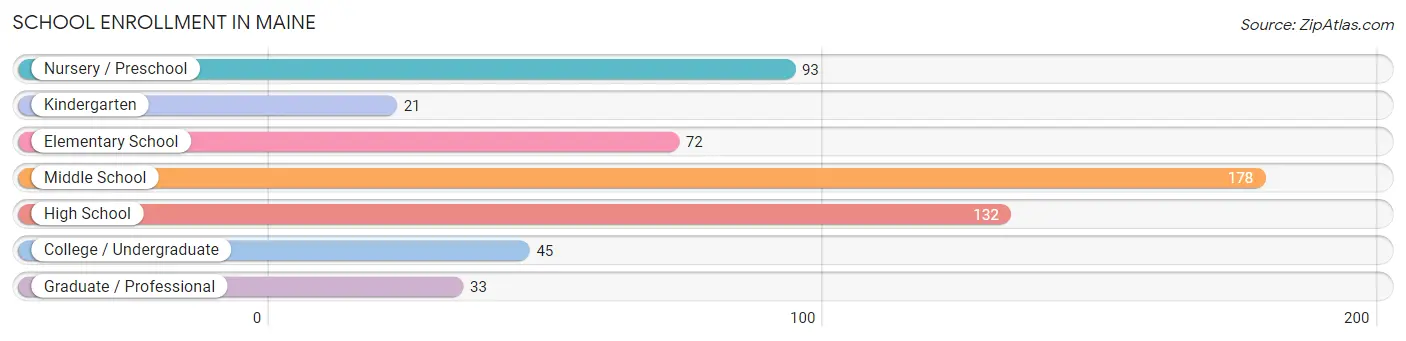
The most common levels of schooling among the 574 students in Maine are middle school (178 | 31.0%), high school (132 | 23.0%), and nursery / preschool (93 | 16.2%).
| School Level | # Students | % Students |
| Nursery / Preschool | 93 | 16.2% |
| Kindergarten | 21 | 3.7% |
| Elementary School | 72 | 12.5% |
| Middle School | 178 | 31.0% |
| High School | 132 | 23.0% |
| College / Undergraduate | 45 | 7.8% |
| Graduate / Professional | 33 | 5.8% |
| Total | 574 | 100.0% |
School Enrollment by Age by Funding Source in Maine
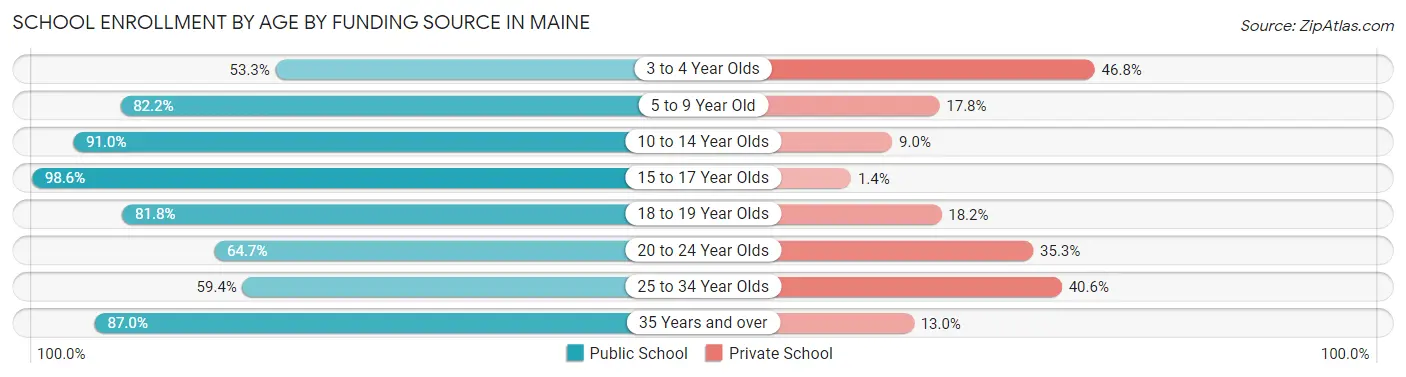
Out of a total of 574 students who are enrolled in schools in Maine, 96 (16.7%) attend a private institution, while the remaining 478 (83.3%) are enrolled in public schools. The age group of 3 to 4 year olds has the highest likelihood of being enrolled in private schools, with 36 (46.8% in the age bracket) enrolled. Conversely, the age group of 15 to 17 year olds has the lowest likelihood of being enrolled in a private school, with 145 (98.6% in the age bracket) attending a public institution.
| Age Bracket | Public School | Private School |
| 3 to 4 Year Olds | 41 (53.2%) | 36 (46.8%) |
| 5 to 9 Year Old | 83 (82.2%) | 18 (17.8%) |
| 10 to 14 Year Olds | 141 (91.0%) | 14 (9.0%) |
| 15 to 17 Year Olds | 145 (98.6%) | 2 (1.4%) |
| 18 to 19 Year Olds | 18 (81.8%) | 4 (18.2%) |
| 20 to 24 Year Olds | 11 (64.7%) | 6 (35.3%) |
| 25 to 34 Year Olds | 19 (59.4%) | 13 (40.6%) |
| 35 Years and over | 20 (87.0%) | 3 (13.0%) |
| Total | 478 (83.3%) | 96 (16.7%) |
Educational Attainment by Field of Study in Maine
Education (159 | 25.4%), business (138 | 22.0%), science & technology (76 | 12.1%), liberal arts & history (52 | 8.3%), and social sciences (37 | 5.9%) are the most common fields of study among 627 individuals in Maine who have obtained a bachelor's degree or higher.
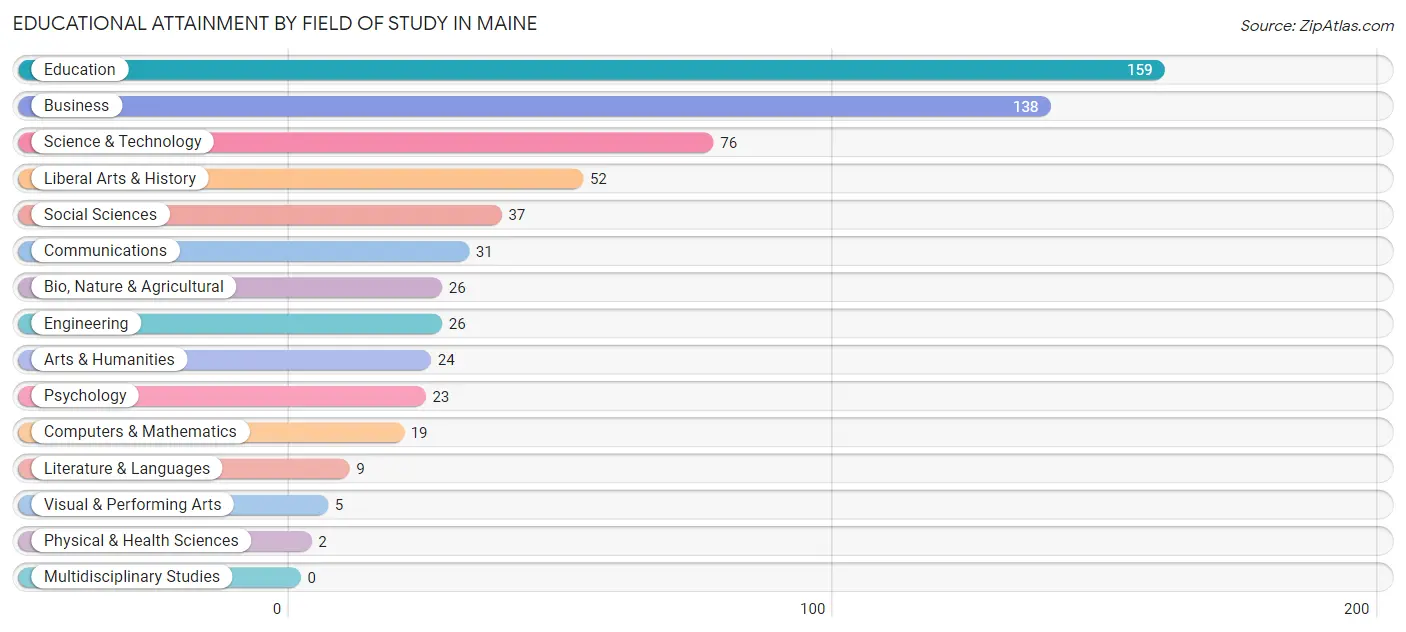
| Field of Study | # Graduates | % Graduates |
| Computers & Mathematics | 19 | 3.0% |
| Bio, Nature & Agricultural | 26 | 4.2% |
| Physical & Health Sciences | 2 | 0.3% |
| Psychology | 23 | 3.7% |
| Social Sciences | 37 | 5.9% |
| Engineering | 26 | 4.2% |
| Multidisciplinary Studies | 0 | 0.0% |
| Science & Technology | 76 | 12.1% |
| Business | 138 | 22.0% |
| Education | 159 | 25.4% |
| Literature & Languages | 9 | 1.4% |
| Liberal Arts & History | 52 | 8.3% |
| Visual & Performing Arts | 5 | 0.8% |
| Communications | 31 | 4.9% |
| Arts & Humanities | 24 | 3.8% |
| Total | 627 | 100.0% |
Transportation & Commute in Maine
Vehicle Availability by Sex in Maine
The most prevalent vehicle ownership categories in Maine are males with 2 vehicles (332, accounting for 43.2%) and females with 2 vehicles (260, making up 47.1%).
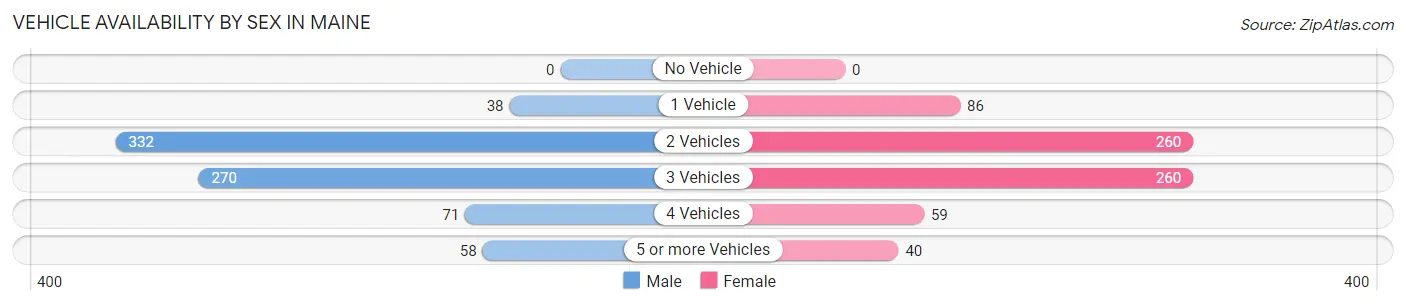
| Vehicles Available | Male | Female |
| No Vehicle | 0 (0.0%) | 0 (0.0%) |
| 1 Vehicle | 38 (4.9%) | 86 (12.2%) |
| 2 Vehicles | 332 (43.2%) | 260 (36.9%) |
| 3 Vehicles | 270 (35.1%) | 260 (36.9%) |
| 4 Vehicles | 71 (9.2%) | 59 (8.4%) |
| 5 or more Vehicles | 58 (7.5%) | 40 (5.7%) |
| Total | 769 (100.0%) | 705 (100.0%) |
Commute Time in Maine
The most frequently occuring commute durations in Maine are 15 to 19 minutes (304 commuters, 23.3%), 10 to 14 minutes (293 commuters, 22.5%), and 20 to 24 minutes (213 commuters, 16.3%).
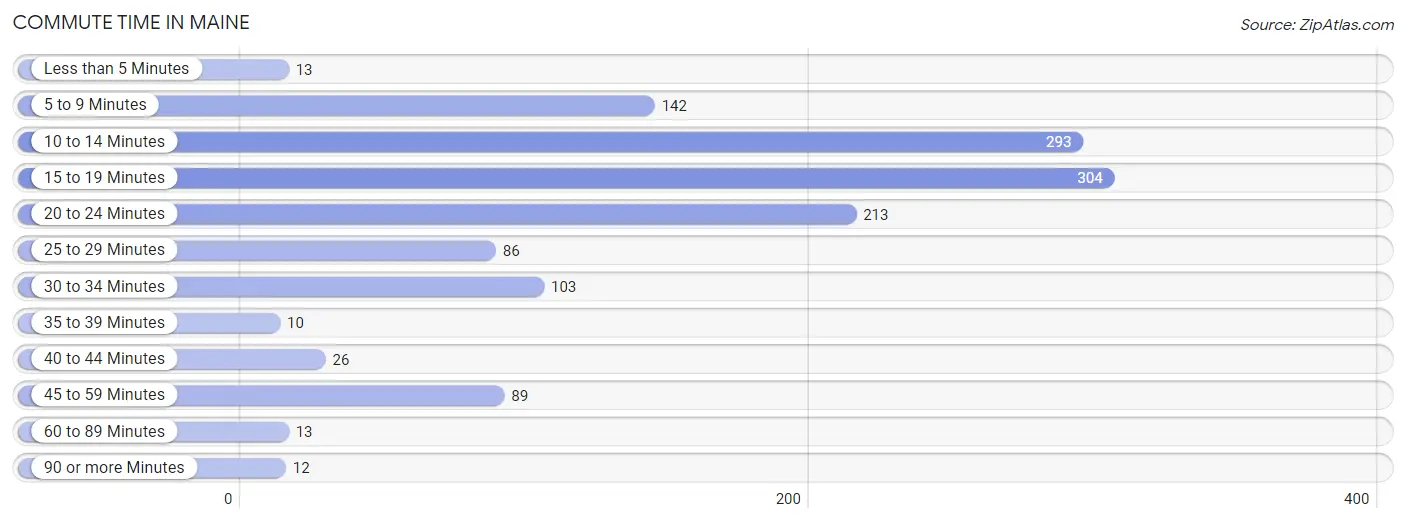
| Commute Time | # Commuters | % Commuters |
| Less than 5 Minutes | 13 | 1.0% |
| 5 to 9 Minutes | 142 | 10.9% |
| 10 to 14 Minutes | 293 | 22.5% |
| 15 to 19 Minutes | 304 | 23.3% |
| 20 to 24 Minutes | 213 | 16.3% |
| 25 to 29 Minutes | 86 | 6.6% |
| 30 to 34 Minutes | 103 | 7.9% |
| 35 to 39 Minutes | 10 | 0.8% |
| 40 to 44 Minutes | 26 | 2.0% |
| 45 to 59 Minutes | 89 | 6.8% |
| 60 to 89 Minutes | 13 | 1.0% |
| 90 or more Minutes | 12 | 0.9% |
Commute Time by Sex in Maine
The most common commute times in Maine are 15 to 19 minutes (163 commuters, 22.2%) for males and 10 to 14 minutes (154 commuters, 27.0%) for females.
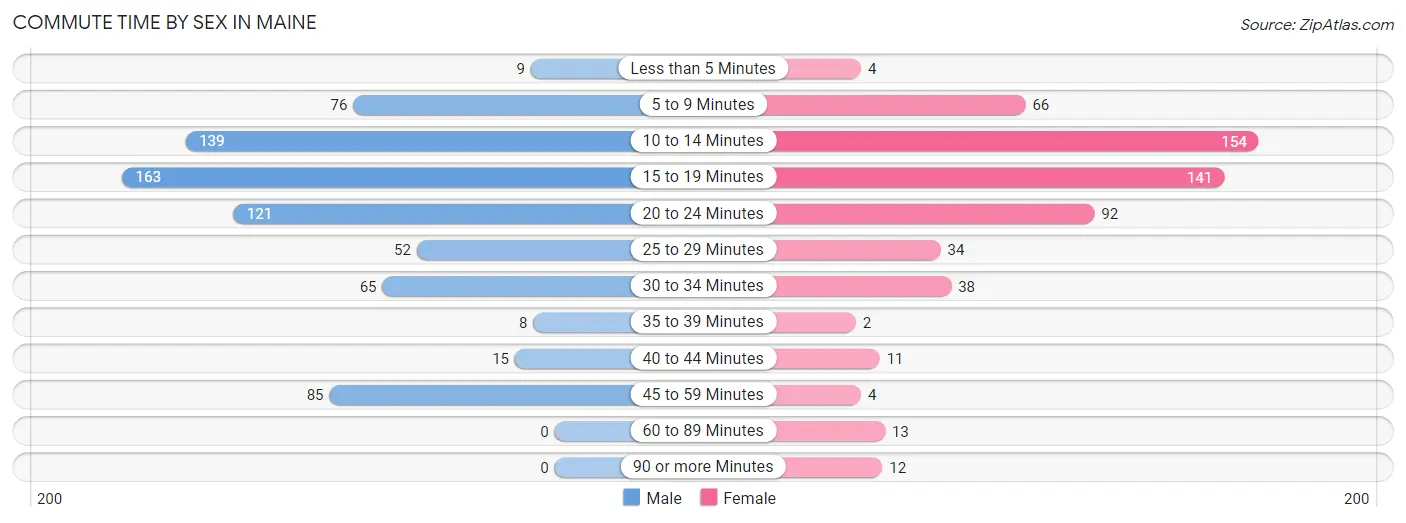
| Commute Time | Male | Female |
| Less than 5 Minutes | 9 (1.2%) | 4 (0.7%) |
| 5 to 9 Minutes | 76 (10.4%) | 66 (11.6%) |
| 10 to 14 Minutes | 139 (19.0%) | 154 (27.0%) |
| 15 to 19 Minutes | 163 (22.2%) | 141 (24.7%) |
| 20 to 24 Minutes | 121 (16.5%) | 92 (16.1%) |
| 25 to 29 Minutes | 52 (7.1%) | 34 (5.9%) |
| 30 to 34 Minutes | 65 (8.9%) | 38 (6.7%) |
| 35 to 39 Minutes | 8 (1.1%) | 2 (0.4%) |
| 40 to 44 Minutes | 15 (2.1%) | 11 (1.9%) |
| 45 to 59 Minutes | 85 (11.6%) | 4 (0.7%) |
| 60 to 89 Minutes | 0 (0.0%) | 13 (2.3%) |
| 90 or more Minutes | 0 (0.0%) | 12 (2.1%) |
Time of Departure to Work by Sex in Maine
The most frequent times of departure to work in Maine are 6:30 AM to 6:59 AM (198, 27.0%) for males and 7:30 AM to 7:59 AM (156, 27.3%) for females.
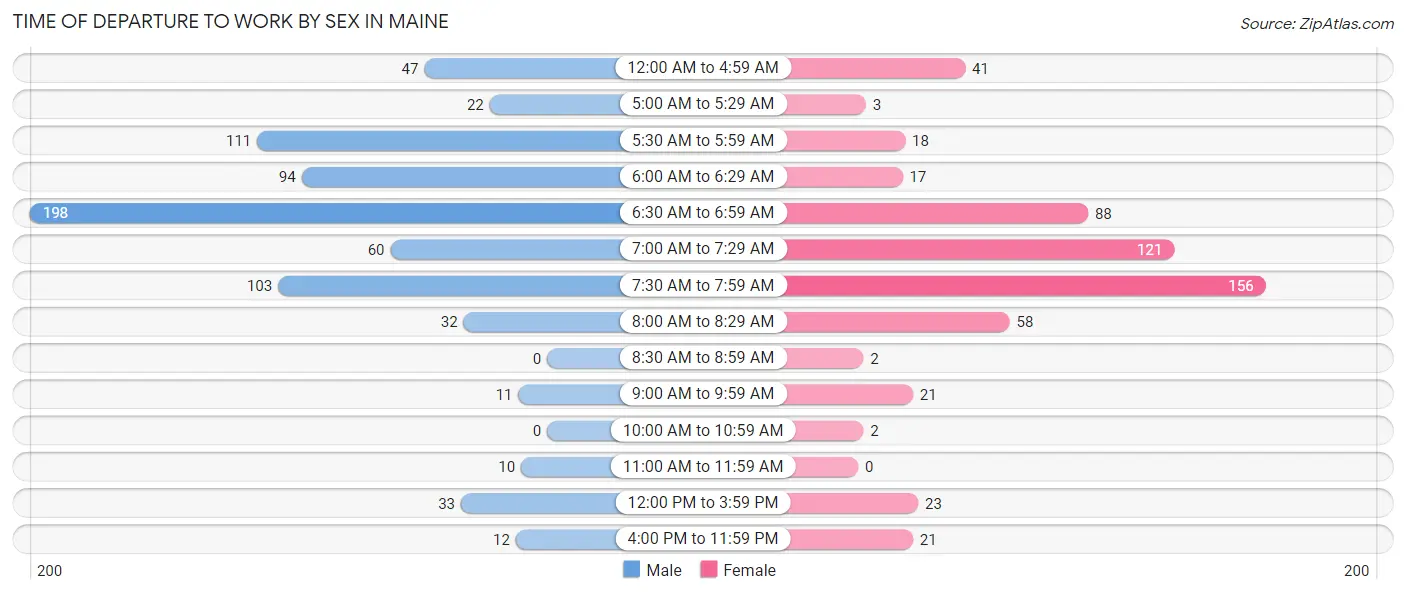
| Time of Departure | Male | Female |
| 12:00 AM to 4:59 AM | 47 (6.4%) | 41 (7.2%) |
| 5:00 AM to 5:29 AM | 22 (3.0%) | 3 (0.5%) |
| 5:30 AM to 5:59 AM | 111 (15.1%) | 18 (3.2%) |
| 6:00 AM to 6:29 AM | 94 (12.8%) | 17 (3.0%) |
| 6:30 AM to 6:59 AM | 198 (27.0%) | 88 (15.4%) |
| 7:00 AM to 7:29 AM | 60 (8.2%) | 121 (21.2%) |
| 7:30 AM to 7:59 AM | 103 (14.1%) | 156 (27.3%) |
| 8:00 AM to 8:29 AM | 32 (4.4%) | 58 (10.2%) |
| 8:30 AM to 8:59 AM | 0 (0.0%) | 2 (0.4%) |
| 9:00 AM to 9:59 AM | 11 (1.5%) | 21 (3.7%) |
| 10:00 AM to 10:59 AM | 0 (0.0%) | 2 (0.4%) |
| 11:00 AM to 11:59 AM | 10 (1.4%) | 0 (0.0%) |
| 12:00 PM to 3:59 PM | 33 (4.5%) | 23 (4.0%) |
| 4:00 PM to 11:59 PM | 12 (1.6%) | 21 (3.7%) |
| Total | 733 (100.0%) | 571 (100.0%) |
Housing Occupancy in Maine
Occupancy by Ownership in Maine
Of the total 1,066 dwellings in Maine, owner-occupied units account for 963 (90.3%), while renter-occupied units make up 103 (9.7%).
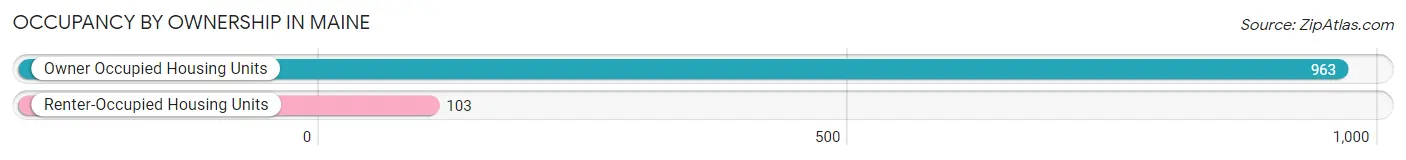
| Occupancy | # Housing Units | % Housing Units |
| Owner Occupied Housing Units | 963 | 90.3% |
| Renter-Occupied Housing Units | 103 | 9.7% |
| Total Occupied Housing Units | 1,066 | 100.0% |
Occupancy by Household Size in Maine
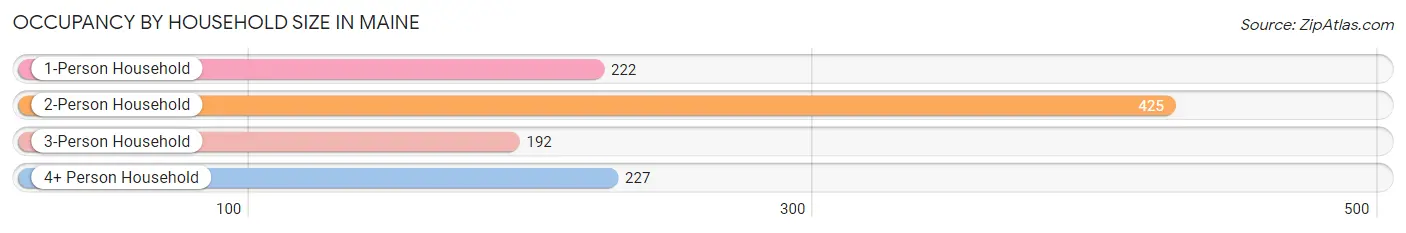
| Household Size | # Housing Units | % Housing Units |
| 1-Person Household | 222 | 20.8% |
| 2-Person Household | 425 | 39.9% |
| 3-Person Household | 192 | 18.0% |
| 4+ Person Household | 227 | 21.3% |
| Total Housing Units | 1,066 | 100.0% |
Occupancy by Ownership by Household Size in Maine
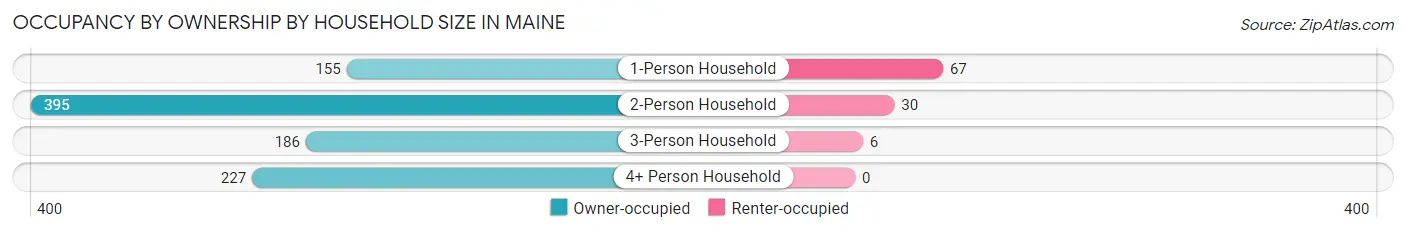
| Household Size | Owner-occupied | Renter-occupied |
| 1-Person Household | 155 (69.8%) | 67 (30.2%) |
| 2-Person Household | 395 (92.9%) | 30 (7.1%) |
| 3-Person Household | 186 (96.9%) | 6 (3.1%) |
| 4+ Person Household | 227 (100.0%) | 0 (0.0%) |
| Total Housing Units | 963 (90.3%) | 103 (9.7%) |
Occupancy by Educational Attainment in Maine
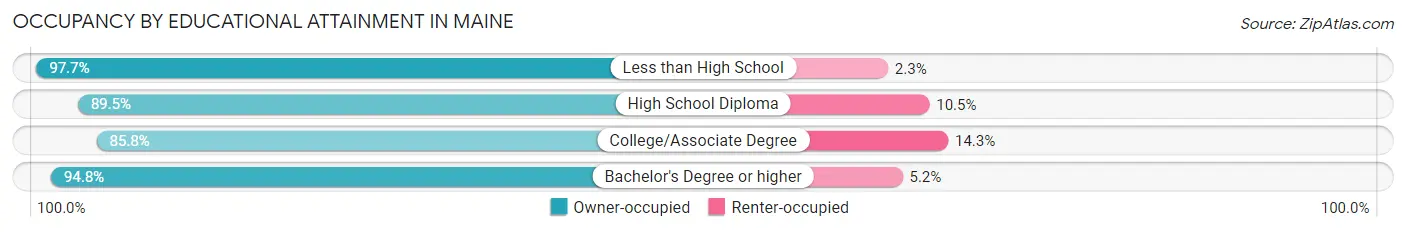
| Household Size | Owner-occupied | Renter-occupied |
| Less than High School | 42 (97.7%) | 1 (2.3%) |
| High School Diploma | 221 (89.5%) | 26 (10.5%) |
| College/Associate Degree | 337 (85.8%) | 56 (14.2%) |
| Bachelor's Degree or higher | 363 (94.8%) | 20 (5.2%) |
Occupancy by Age of Householder in Maine
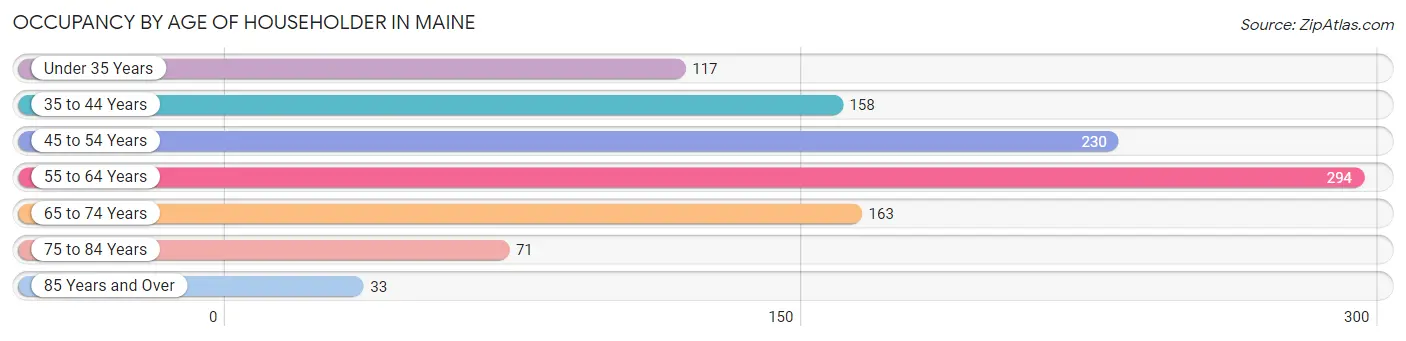
| Age Bracket | # Households | % Households |
| Under 35 Years | 117 | 11.0% |
| 35 to 44 Years | 158 | 14.8% |
| 45 to 54 Years | 230 | 21.6% |
| 55 to 64 Years | 294 | 27.6% |
| 65 to 74 Years | 163 | 15.3% |
| 75 to 84 Years | 71 | 6.7% |
| 85 Years and Over | 33 | 3.1% |
| Total | 1,066 | 100.0% |
Housing Finances in Maine
Median Income by Occupancy in Maine
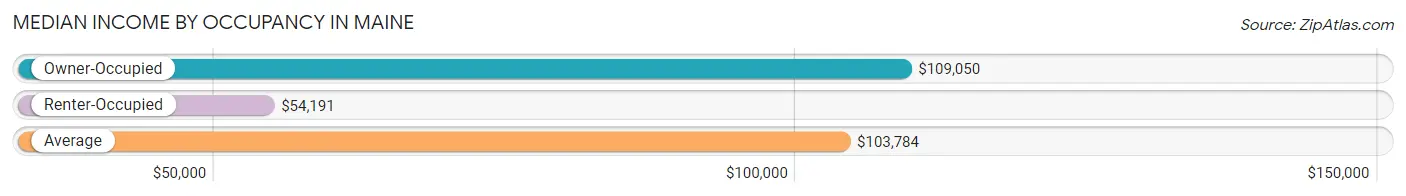
| Occupancy Type | # Households | Median Income |
| Owner-Occupied | 963 (90.3%) | $109,050 |
| Renter-Occupied | 103 (9.7%) | $54,191 |
| Average | 1,066 (100.0%) | $103,784 |
Occupancy by Householder Income Bracket in Maine
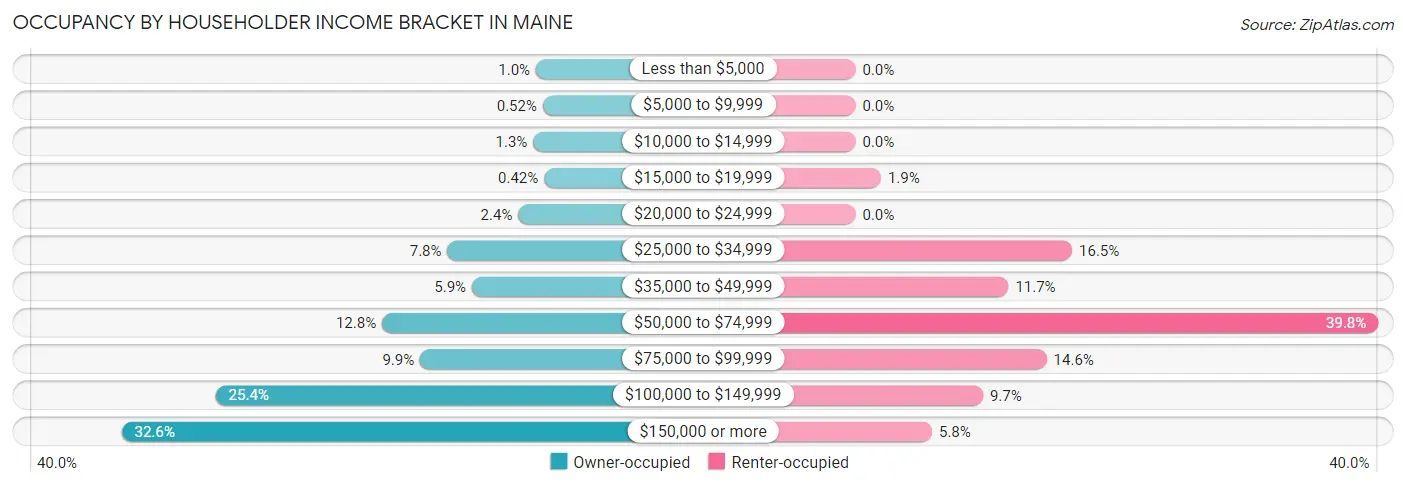
| Income Bracket | Owner-occupied | Renter-occupied |
| Less than $5,000 | 10 (1.0%) | 0 (0.0%) |
| $5,000 to $9,999 | 5 (0.5%) | 0 (0.0%) |
| $10,000 to $14,999 | 12 (1.3%) | 0 (0.0%) |
| $15,000 to $19,999 | 4 (0.4%) | 2 (1.9%) |
| $20,000 to $24,999 | 23 (2.4%) | 0 (0.0%) |
| $25,000 to $34,999 | 75 (7.8%) | 17 (16.5%) |
| $35,000 to $49,999 | 57 (5.9%) | 12 (11.7%) |
| $50,000 to $74,999 | 123 (12.8%) | 41 (39.8%) |
| $75,000 to $99,999 | 95 (9.9%) | 15 (14.6%) |
| $100,000 to $149,999 | 245 (25.4%) | 10 (9.7%) |
| $150,000 or more | 314 (32.6%) | 6 (5.8%) |
| Total | 963 (100.0%) | 103 (100.0%) |
Monthly Housing Cost Tiers in Maine
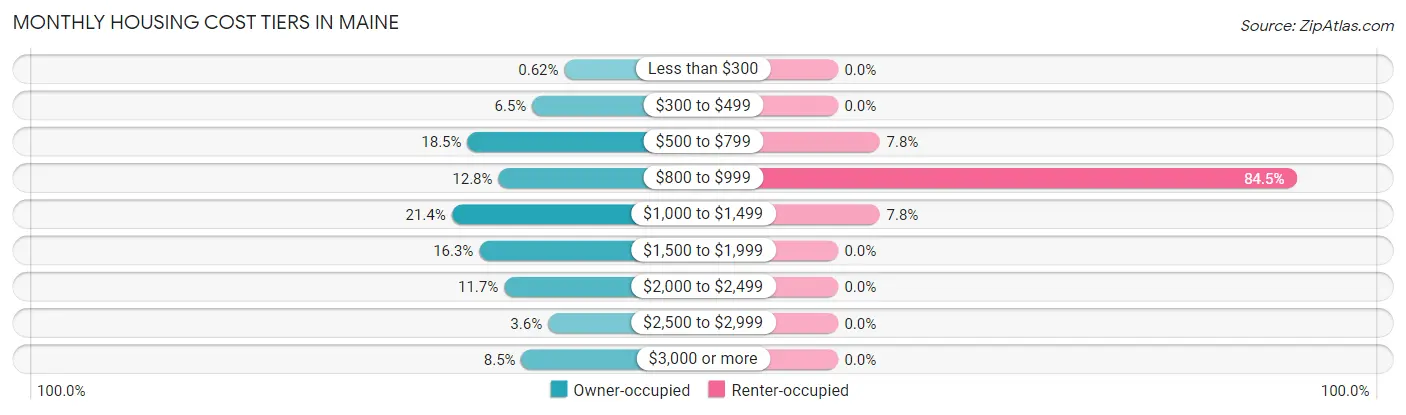
| Monthly Cost | Owner-occupied | Renter-occupied |
| Less than $300 | 6 (0.6%) | 0 (0.0%) |
| $300 to $499 | 63 (6.5%) | 0 (0.0%) |
| $500 to $799 | 178 (18.5%) | 8 (7.8%) |
| $800 to $999 | 123 (12.8%) | 87 (84.5%) |
| $1,000 to $1,499 | 206 (21.4%) | 8 (7.8%) |
| $1,500 to $1,999 | 157 (16.3%) | 0 (0.0%) |
| $2,000 to $2,499 | 113 (11.7%) | 0 (0.0%) |
| $2,500 to $2,999 | 35 (3.6%) | 0 (0.0%) |
| $3,000 or more | 82 (8.5%) | 0 (0.0%) |
| Total | 963 (100.0%) | 103 (100.0%) |
Physical Housing Characteristics in Maine
Housing Structures in Maine
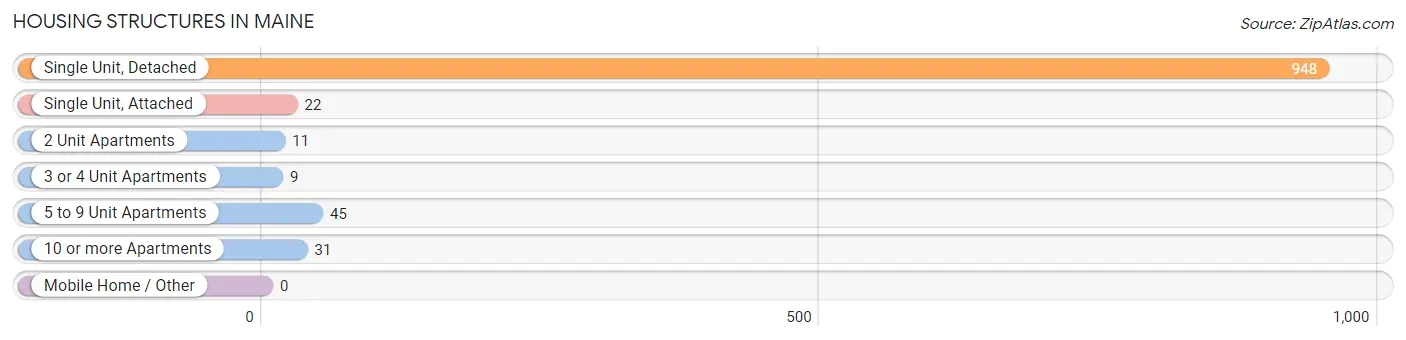
| Structure Type | # Housing Units | % Housing Units |
| Single Unit, Detached | 948 | 88.9% |
| Single Unit, Attached | 22 | 2.1% |
| 2 Unit Apartments | 11 | 1.0% |
| 3 or 4 Unit Apartments | 9 | 0.8% |
| 5 to 9 Unit Apartments | 45 | 4.2% |
| 10 or more Apartments | 31 | 2.9% |
| Mobile Home / Other | 0 | 0.0% |
| Total | 1,066 | 100.0% |
Housing Structures by Occupancy in Maine
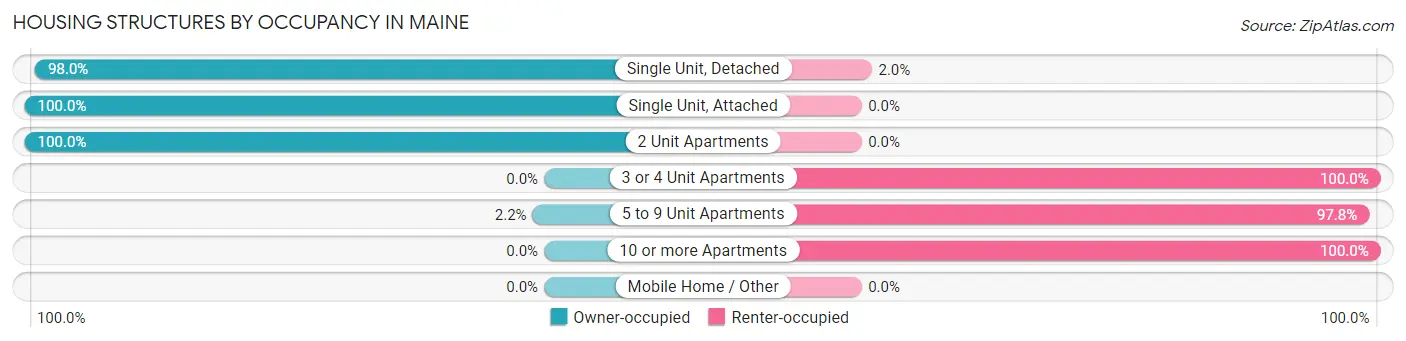
| Structure Type | Owner-occupied | Renter-occupied |
| Single Unit, Detached | 929 (98.0%) | 19 (2.0%) |
| Single Unit, Attached | 22 (100.0%) | 0 (0.0%) |
| 2 Unit Apartments | 11 (100.0%) | 0 (0.0%) |
| 3 or 4 Unit Apartments | 0 (0.0%) | 9 (100.0%) |
| 5 to 9 Unit Apartments | 1 (2.2%) | 44 (97.8%) |
| 10 or more Apartments | 0 (0.0%) | 31 (100.0%) |
| Mobile Home / Other | 0 (0.0%) | 0 (0.0%) |
| Total | 963 (90.3%) | 103 (9.7%) |
Housing Structures by Number of Rooms in Maine
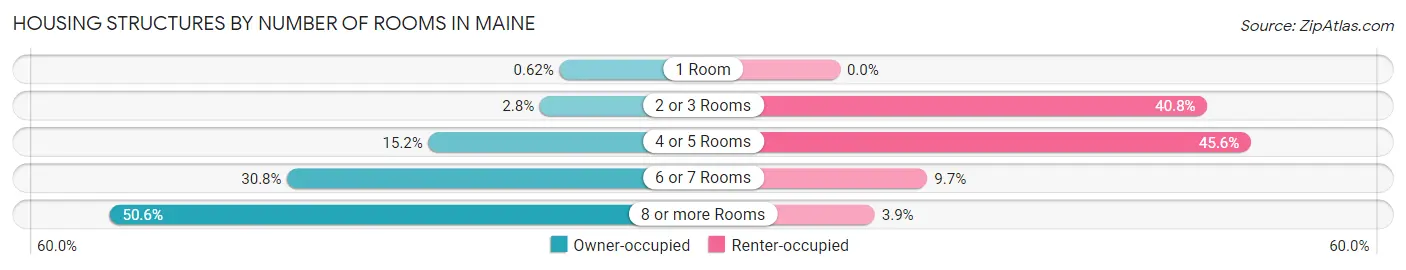
| Number of Rooms | Owner-occupied | Renter-occupied |
| 1 Room | 6 (0.6%) | 0 (0.0%) |
| 2 or 3 Rooms | 27 (2.8%) | 42 (40.8%) |
| 4 or 5 Rooms | 146 (15.2%) | 47 (45.6%) |
| 6 or 7 Rooms | 297 (30.8%) | 10 (9.7%) |
| 8 or more Rooms | 487 (50.6%) | 4 (3.9%) |
| Total | 963 (100.0%) | 103 (100.0%) |
Housing Structure by Heating Type in Maine
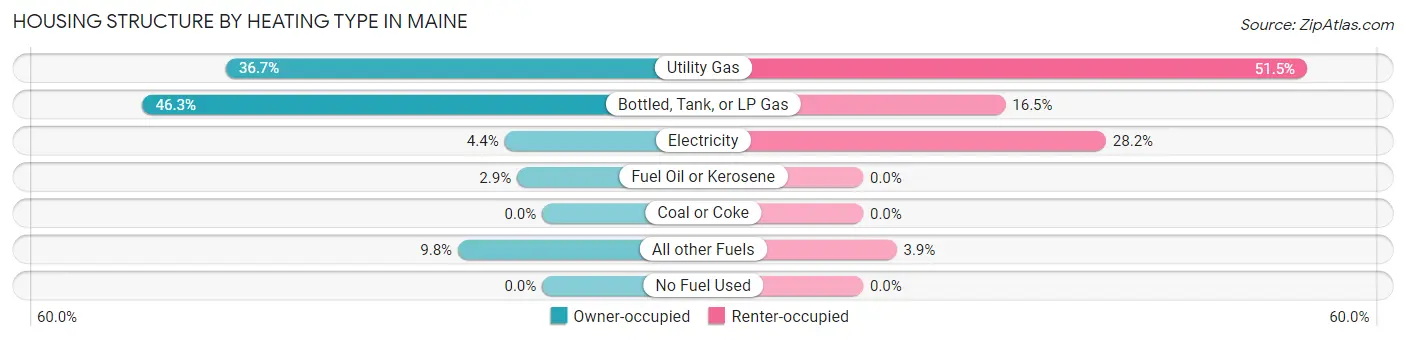
| Heating Type | Owner-occupied | Renter-occupied |
| Utility Gas | 353 (36.7%) | 53 (51.5%) |
| Bottled, Tank, or LP Gas | 446 (46.3%) | 17 (16.5%) |
| Electricity | 42 (4.4%) | 29 (28.2%) |
| Fuel Oil or Kerosene | 28 (2.9%) | 0 (0.0%) |
| Coal or Coke | 0 (0.0%) | 0 (0.0%) |
| All other Fuels | 94 (9.8%) | 4 (3.9%) |
| No Fuel Used | 0 (0.0%) | 0 (0.0%) |
| Total | 963 (100.0%) | 103 (100.0%) |
Household Vehicle Usage in Maine
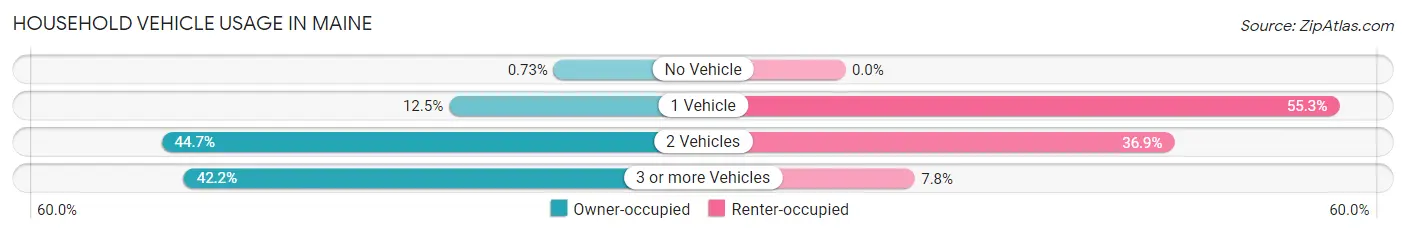
| Vehicles per Household | Owner-occupied | Renter-occupied |
| No Vehicle | 7 (0.7%) | 0 (0.0%) |
| 1 Vehicle | 120 (12.5%) | 57 (55.3%) |
| 2 Vehicles | 430 (44.7%) | 38 (36.9%) |
| 3 or more Vehicles | 406 (42.2%) | 8 (7.8%) |
| Total | 963 (100.0%) | 103 (100.0%) |
Real Estate & Mortgages in Maine
Real Estate and Mortgage Overview in Maine
| Characteristic | Without Mortgage | With Mortgage |
| Housing Units | 346 | 617 |
| Median Property Value | $246,200 | $259,100 |
| Median Household Income | $81,607 | $239 |
| Monthly Housing Costs | $696 | $82 |
| Real Estate Taxes | $4,069 | $3 |
Property Value by Mortgage Status in Maine
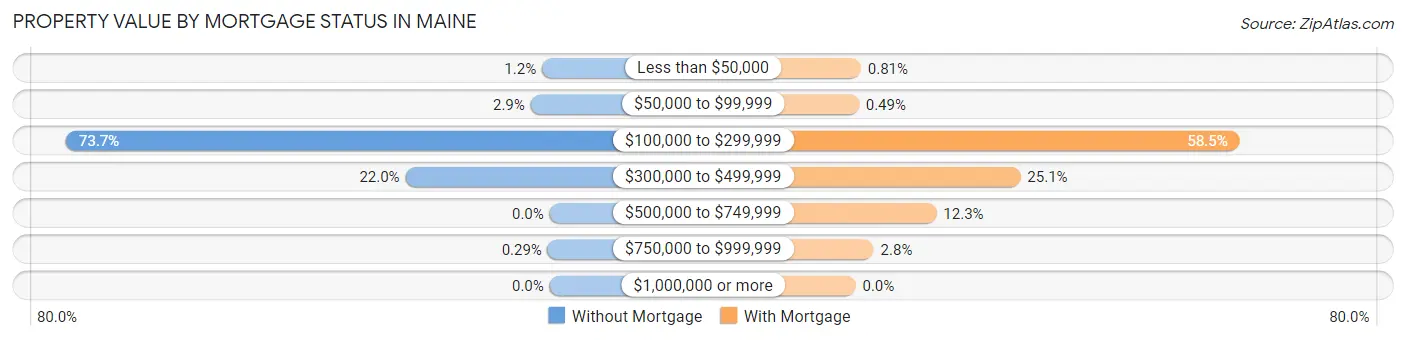
| Property Value | Without Mortgage | With Mortgage |
| Less than $50,000 | 4 (1.2%) | 5 (0.8%) |
| $50,000 to $99,999 | 10 (2.9%) | 3 (0.5%) |
| $100,000 to $299,999 | 255 (73.7%) | 361 (58.5%) |
| $300,000 to $499,999 | 76 (22.0%) | 155 (25.1%) |
| $500,000 to $749,999 | 0 (0.0%) | 76 (12.3%) |
| $750,000 to $999,999 | 1 (0.3%) | 17 (2.8%) |
| $1,000,000 or more | 0 (0.0%) | 0 (0.0%) |
| Total | 346 (100.0%) | 617 (100.0%) |
Household Income by Mortgage Status in Maine

| Household Income | Without Mortgage | With Mortgage |
| Less than $10,000 | 11 (3.2%) | 14 (2.3%) |
| $10,000 to $24,999 | 24 (6.9%) | 4 (0.6%) |
| $25,000 to $34,999 | 30 (8.7%) | 15 (2.4%) |
| $35,000 to $49,999 | 45 (13.0%) | 45 (7.3%) |
| $50,000 to $74,999 | 47 (13.6%) | 12 (1.9%) |
| $75,000 to $99,999 | 35 (10.1%) | 76 (12.3%) |
| $100,000 to $149,999 | 79 (22.8%) | 60 (9.7%) |
| $150,000 or more | 75 (21.7%) | 166 (26.9%) |
| Total | 346 (100.0%) | 617 (100.0%) |
Property Value to Household Income Ratio in Maine
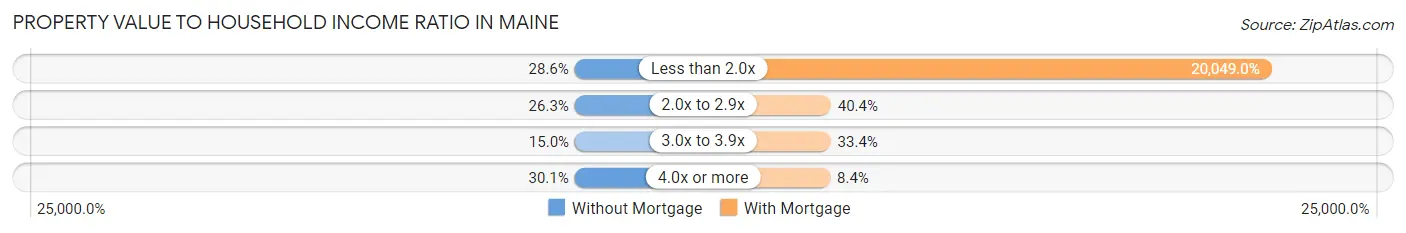
| Value-to-Income Ratio | Without Mortgage | With Mortgage |
| Less than 2.0x | 99 (28.6%) | 123,702 (20,048.9%) |
| 2.0x to 2.9x | 91 (26.3%) | 249 (40.4%) |
| 3.0x to 3.9x | 52 (15.0%) | 206 (33.4%) |
| 4.0x or more | 104 (30.1%) | 52 (8.4%) |
| Total | 346 (100.0%) | 617 (100.0%) |
Real Estate Taxes by Mortgage Status in Maine

| Property Taxes | Without Mortgage | With Mortgage |
| Less than $800 | 4 (1.2%) | 0 (0.0%) |
| $800 to $1,499 | 0 (0.0%) | 0 (0.0%) |
| $800 to $1,499 | 336 (97.1%) | 8 (1.3%) |
| Total | 346 (100.0%) | 617 (100.0%) |
Health & Disability in Maine
Health Insurance Coverage by Age in Maine
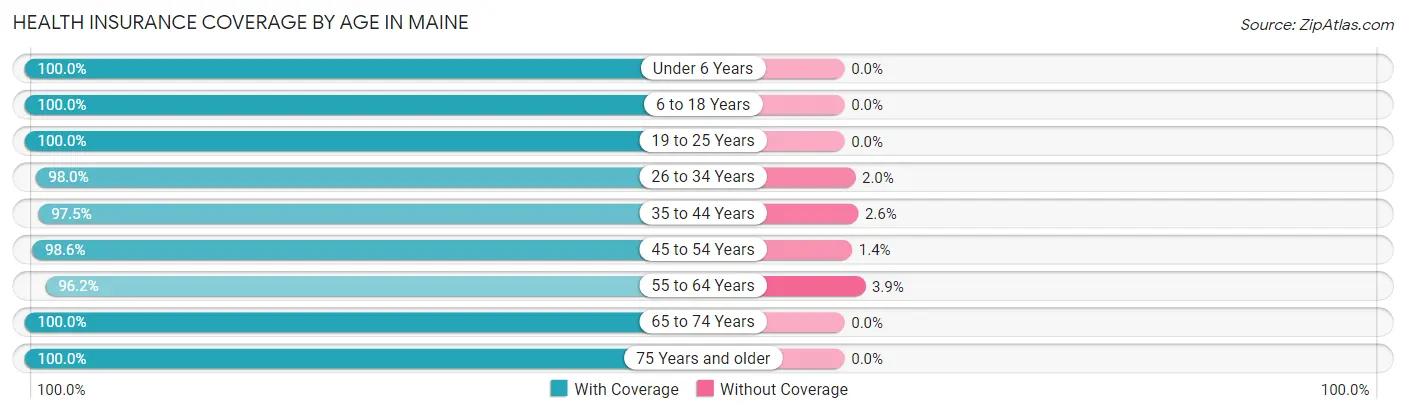
| Age Bracket | With Coverage | Without Coverage |
| Under 6 Years | 188 (100.0%) | 0 (0.0%) |
| 6 to 18 Years | 395 (100.0%) | 0 (0.0%) |
| 19 to 25 Years | 146 (100.0%) | 0 (0.0%) |
| 26 to 34 Years | 196 (98.0%) | 4 (2.0%) |
| 35 to 44 Years | 267 (97.5%) | 7 (2.5%) |
| 45 to 54 Years | 491 (98.6%) | 7 (1.4%) |
| 55 to 64 Years | 450 (96.2%) | 18 (3.8%) |
| 65 to 74 Years | 286 (100.0%) | 0 (0.0%) |
| 75 Years and older | 151 (100.0%) | 0 (0.0%) |
| Total | 2,570 (98.6%) | 36 (1.4%) |
Health Insurance Coverage by Citizenship Status in Maine

| Citizenship Status | With Coverage | Without Coverage |
| Native Born | 188 (100.0%) | 0 (0.0%) |
| Foreign Born, Citizen | 395 (100.0%) | 0 (0.0%) |
| Foreign Born, not a Citizen | 146 (100.0%) | 0 (0.0%) |
Health Insurance Coverage by Household Income in Maine
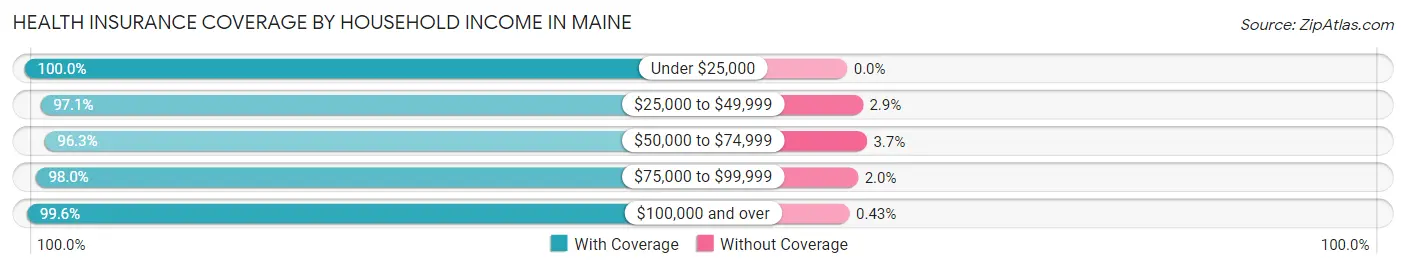
| Household Income | With Coverage | Without Coverage |
| Under $25,000 | 90 (100.0%) | 0 (0.0%) |
| $25,000 to $49,999 | 199 (97.1%) | 6 (2.9%) |
| $50,000 to $74,999 | 392 (96.3%) | 15 (3.7%) |
| $75,000 to $99,999 | 240 (98.0%) | 5 (2.0%) |
| $100,000 and over | 1,640 (99.6%) | 7 (0.4%) |
Public vs Private Health Insurance Coverage by Age in Maine
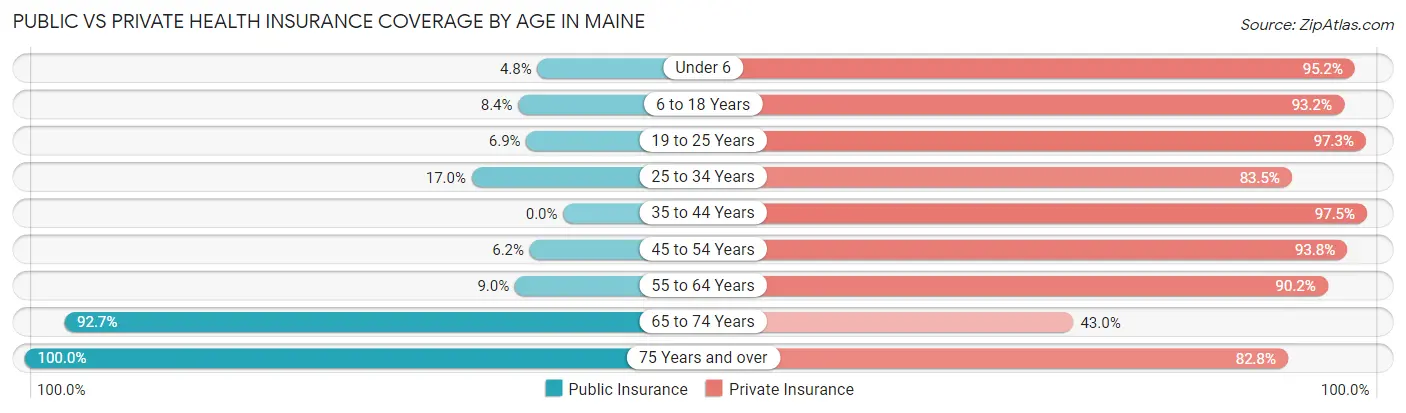
| Age Bracket | Public Insurance | Private Insurance |
| Under 6 | 9 (4.8%) | 179 (95.2%) |
| 6 to 18 Years | 33 (8.4%) | 368 (93.2%) |
| 19 to 25 Years | 10 (6.9%) | 142 (97.3%) |
| 25 to 34 Years | 34 (17.0%) | 167 (83.5%) |
| 35 to 44 Years | 0 (0.0%) | 267 (97.5%) |
| 45 to 54 Years | 31 (6.2%) | 467 (93.8%) |
| 55 to 64 Years | 42 (9.0%) | 422 (90.2%) |
| 65 to 74 Years | 265 (92.7%) | 123 (43.0%) |
| 75 Years and over | 151 (100.0%) | 125 (82.8%) |
| Total | 575 (22.1%) | 2,260 (86.7%) |
Disability Status by Sex by Age in Maine
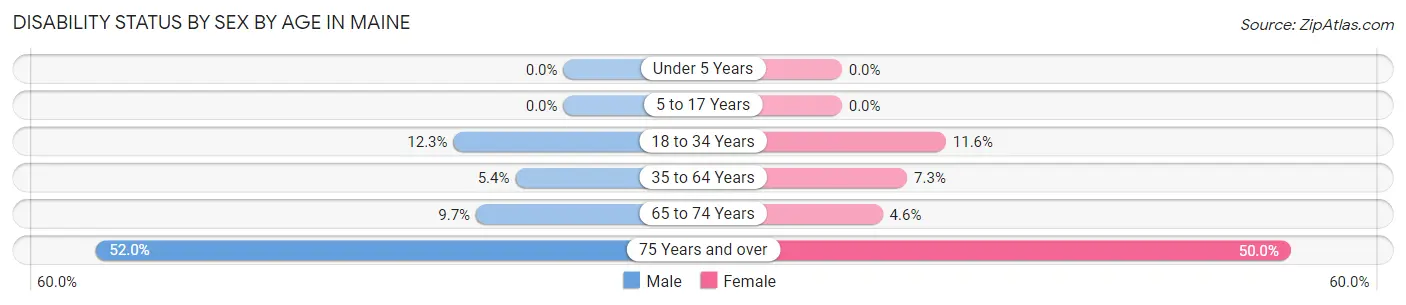
| Age Bracket | Male | Female |
| Under 5 Years | 0 (0.0%) | 0 (0.0%) |
| 5 to 17 Years | 0 (0.0%) | 0 (0.0%) |
| 18 to 34 Years | 25 (12.2%) | 19 (11.6%) |
| 35 to 64 Years | 34 (5.3%) | 44 (7.3%) |
| 65 to 74 Years | 15 (9.7%) | 6 (4.5%) |
| 75 Years and over | 39 (52.0%) | 38 (50.0%) |
Disability Class by Sex by Age in Maine
Disability Class: Hearing Difficulty
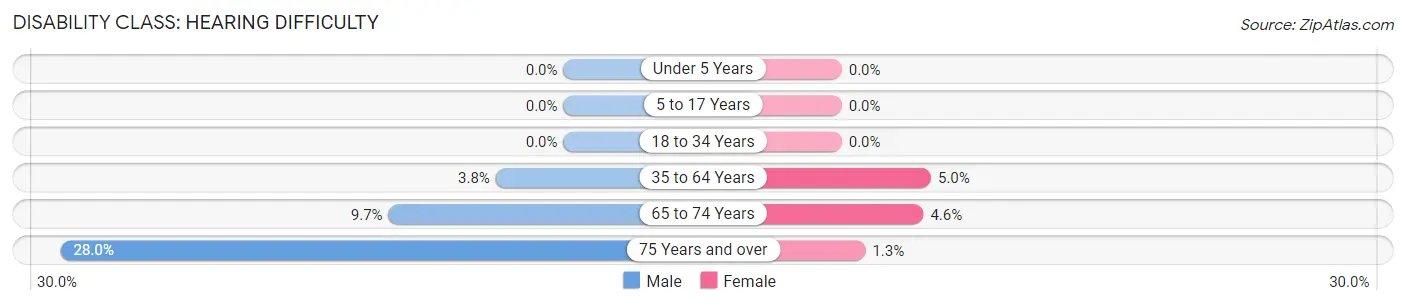
| Age Bracket | Male | Female |
| Under 5 Years | 0 (0.0%) | 0 (0.0%) |
| 5 to 17 Years | 0 (0.0%) | 0 (0.0%) |
| 18 to 34 Years | 0 (0.0%) | 0 (0.0%) |
| 35 to 64 Years | 24 (3.8%) | 30 (5.0%) |
| 65 to 74 Years | 15 (9.7%) | 6 (4.5%) |
| 75 Years and over | 21 (28.0%) | 1 (1.3%) |
Disability Class: Vision Difficulty
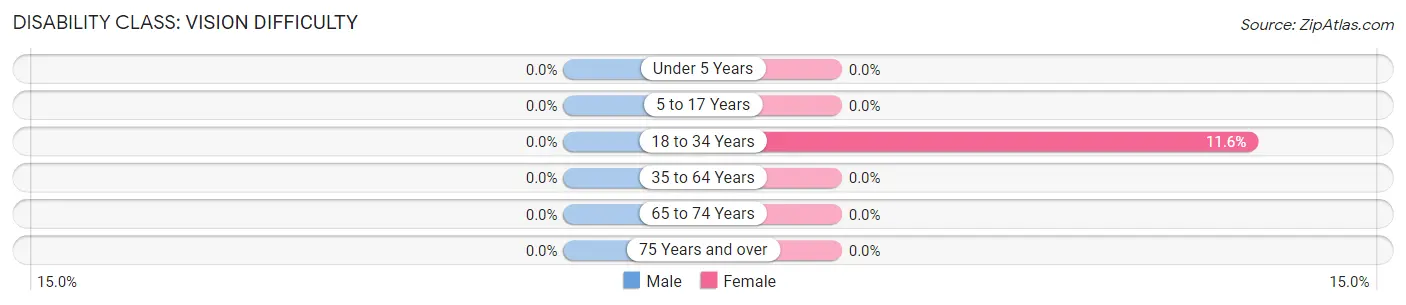
| Age Bracket | Male | Female |
| Under 5 Years | 0 (0.0%) | 0 (0.0%) |
| 5 to 17 Years | 0 (0.0%) | 0 (0.0%) |
| 18 to 34 Years | 0 (0.0%) | 19 (11.6%) |
| 35 to 64 Years | 0 (0.0%) | 0 (0.0%) |
| 65 to 74 Years | 0 (0.0%) | 0 (0.0%) |
| 75 Years and over | 0 (0.0%) | 0 (0.0%) |
Disability Class: Cognitive Difficulty
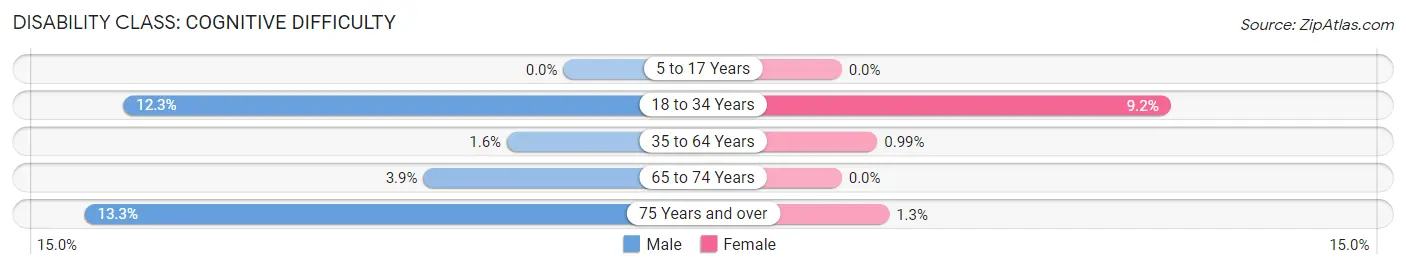
| Age Bracket | Male | Female |
| 5 to 17 Years | 0 (0.0%) | 0 (0.0%) |
| 18 to 34 Years | 25 (12.2%) | 15 (9.1%) |
| 35 to 64 Years | 10 (1.6%) | 6 (1.0%) |
| 65 to 74 Years | 6 (3.9%) | 0 (0.0%) |
| 75 Years and over | 10 (13.3%) | 1 (1.3%) |
Disability Class: Ambulatory Difficulty
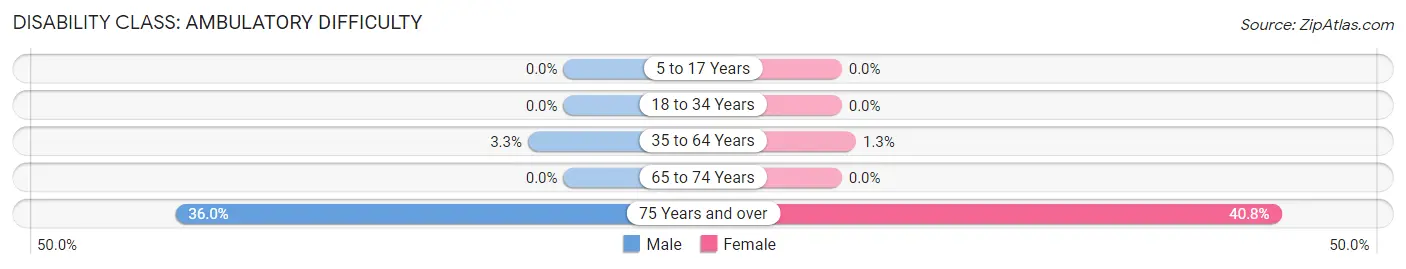
| Age Bracket | Male | Female |
| 5 to 17 Years | 0 (0.0%) | 0 (0.0%) |
| 18 to 34 Years | 0 (0.0%) | 0 (0.0%) |
| 35 to 64 Years | 21 (3.3%) | 8 (1.3%) |
| 65 to 74 Years | 0 (0.0%) | 0 (0.0%) |
| 75 Years and over | 27 (36.0%) | 31 (40.8%) |
Disability Class: Self-Care Difficulty
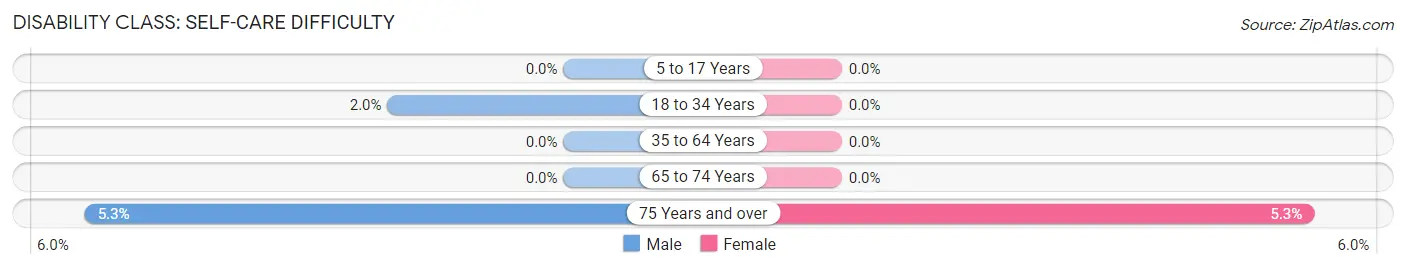
| Age Bracket | Male | Female |
| 5 to 17 Years | 0 (0.0%) | 0 (0.0%) |
| 18 to 34 Years | 4 (2.0%) | 0 (0.0%) |
| 35 to 64 Years | 0 (0.0%) | 0 (0.0%) |
| 65 to 74 Years | 0 (0.0%) | 0 (0.0%) |
| 75 Years and over | 4 (5.3%) | 4 (5.3%) |
Technology Access in Maine
Computing Device Access in Maine
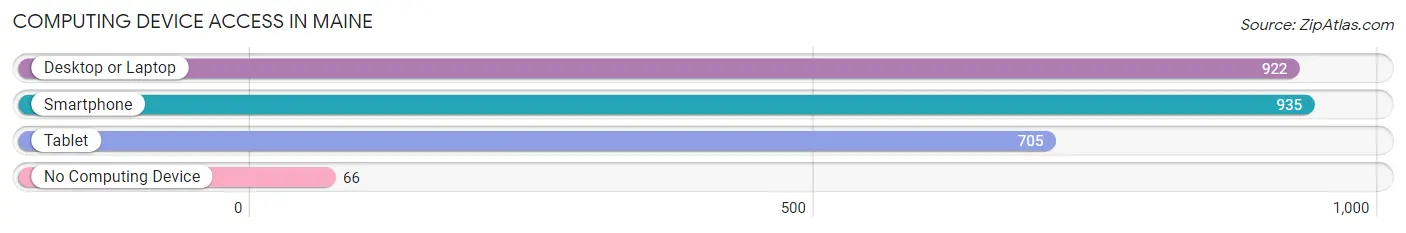
| Device Type | # Households | % Households |
| Desktop or Laptop | 922 | 86.5% |
| Smartphone | 935 | 87.7% |
| Tablet | 705 | 66.1% |
| No Computing Device | 66 | 6.2% |
| Total | 1,066 | 100.0% |
Internet Access in Maine
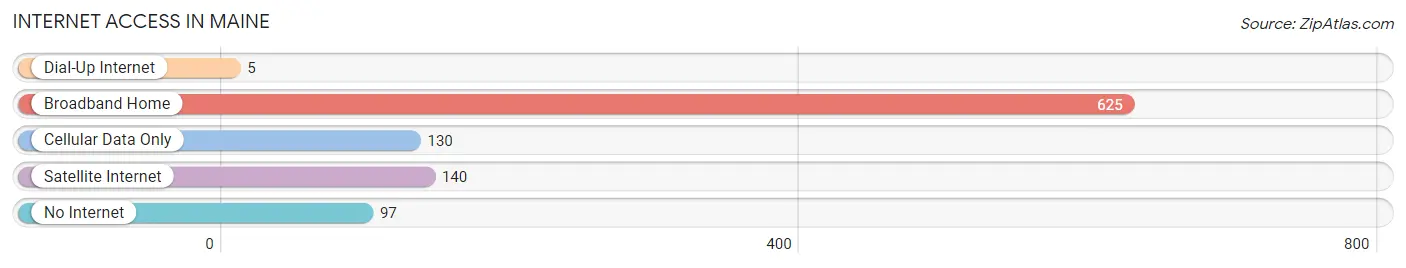
| Internet Type | # Households | % Households |
| Dial-Up Internet | 5 | 0.5% |
| Broadband Home | 625 | 58.6% |
| Cellular Data Only | 130 | 12.2% |
| Satellite Internet | 140 | 13.1% |
| No Internet | 97 | 9.1% |
| Total | 1,066 | 100.0% |
Maine Summary
Maine is a state located in the northeastern United States. It is bordered by New Hampshire to the west, the Atlantic Ocean to the east, and the Canadian provinces of Quebec to the north and New Brunswick to the northeast. Maine is the 12th smallest state by area, the 9th least populous, and the 13th least densely populated of the 50 U.S. states. It is known for its rocky coastline, picturesque lighthouses, and maritime history.
History
The first inhabitants of Maine were Native American tribes, including the Abenaki, Passamaquoddy, Penobscot, and Maliseet. The first European settlers arrived in the early 1600s, and the area was part of the Massachusetts Bay Colony until 1820, when it became the 23rd state.
Maine was a major shipbuilding center during the 19th century, and its economy was heavily dependent on the lumber and fishing industries. The state was also a major producer of textiles and paper products. In the 20th century, Maine’s economy shifted to tourism and service industries.
Geography
Maine is the northernmost state in the contiguous United States. It is bordered by New Hampshire to the west, the Atlantic Ocean to the east, and the Canadian provinces of Quebec to the north and New Brunswick to the northeast.
Maine is divided into two distinct regions: the coastal plain and the interior highlands. The coastal plain is a low-lying area that is mostly flat and marshy. The interior highlands are a rugged, mountainous region that is home to the highest point in the state, Mount Katahdin.
Economy
Maine’s economy is largely based on tourism, fishing, and forestry. The state is also a major producer of paper products, and it has a growing technology sector.
Tourism is a major industry in Maine, with visitors drawn to its rocky coastline, picturesque lighthouses, and maritime history. The state is also home to several national parks, including Acadia National Park and Baxter State Park.
Fishing is another important industry in Maine. The state’s fisheries produce lobster, clams, scallops, and other seafood.
Maine is also a major producer of paper products, including newsprint, paperboard, and tissue paper. The state is home to several large paper mills, including the International Paper Company in Jay.
Demographics
As of 2019, Maine had an estimated population of 1.344 million. The state is predominantly white, with a population that is 94.3% non-Hispanic white. The largest minority groups are African Americans (2.2%), Hispanics (1.7%), and Asians (1.2%).
Maine is the oldest state in the nation, with a median age of 44.7 years. The state’s population is also relatively rural, with more than half of the population living in rural areas.
Maine is also one of the least densely populated states in the nation, with a population density of 41.2 people per square mile. The state’s largest cities are Portland, Lewiston, Bangor, and South Portland.
Common Questions
What is Per Capita Income in Maine?
Per Capita income in Maine is $52,695.
What is the Median Family Income in Maine?
Median Family Income in Maine is $124,135.
What is the Median Household income in Maine?
Median Household Income in Maine is $103,784.
What is Income or Wage Gap in Maine?
Income or Wage Gap in Maine is 37.1%.
Women in Maine earn 62.9 cents for every dollar earned by a man.
What is Inequality or Gini Index in Maine?
Inequality or Gini Index in Maine is 0.41.
What is the Total Population of Maine?
Total Population of Maine is 2,608.
What is the Total Male Population of Maine?
Total Male Population of Maine is 1,441.
What is the Total Female Population of Maine?
Total Female Population of Maine is 1,167.
What is the Ratio of Males per 100 Females in Maine?
There are 123.48 Males per 100 Females in Maine.
What is the Ratio of Females per 100 Males in Maine?
There are 80.99 Females per 100 Males in Maine.
What is the Median Population Age in Maine?
Median Population Age in Maine is 47.7 Years.
What is the Average Family Size in Maine
Average Family Size in Maine is 2.9 People.
What is the Average Household Size in Maine
Average Household Size in Maine is 2.4 People.
How Large is the Labor Force in Maine?
There are 1,513 People in the Labor Forcein in Maine.
What is the Percentage of People in the Labor Force in Maine?
70.6% of People are in the Labor Force in Maine.
What is the Unemployment Rate in Maine?
Unemployment Rate in Maine is 2.0%.