Diamond Bluff, WI Map & Demographics
Diamond Bluff Map
Diamond Bluff Overview
$40,891
PER CAPITA INCOME
$112,917
AVG FAMILY INCOME
$72,250
AVG HOUSEHOLD INCOME
64.8%
WAGE / INCOME GAP [ % ]
35.2¢/ $1
WAGE / INCOME GAP [ $ ]
0.34
INEQUALITY / GINI INDEX
209
TOTAL POPULATION
133
MALE POPULATION
76
FEMALE POPULATION
175.00
MALES / 100 FEMALES
57.14
FEMALES / 100 MALES
44.4
MEDIAN AGE
3.0
AVG FAMILY SIZE
2.6
AVG HOUSEHOLD SIZE
103
LABOR FORCE [ PEOPLE ]
66.9%
PERCENT IN LABOR FORCE
19.4%
UNEMPLOYMENT RATE
Income in Diamond Bluff
Income Overview in Diamond Bluff
Per Capita Income in Diamond Bluff is $40,891, while median incomes of families and households are $112,917 and $72,250 respectively.
| Characteristic | Number | Measure |
| Per Capita Income | 209 | $40,891 |
| Median Family Income | 59 | $112,917 |
| Mean Family Income | 59 | $117,237 |
| Median Household Income | 81 | $72,250 |
| Mean Household Income | 81 | $101,986 |
| Income Deficit | 59 | $0 |
| Wage / Income Gap (%) | 209 | 64.79% |
| Wage / Income Gap ($) | 209 | 35.21¢ per $1 |
| Gini / Inequality Index | 209 | 0.34 |
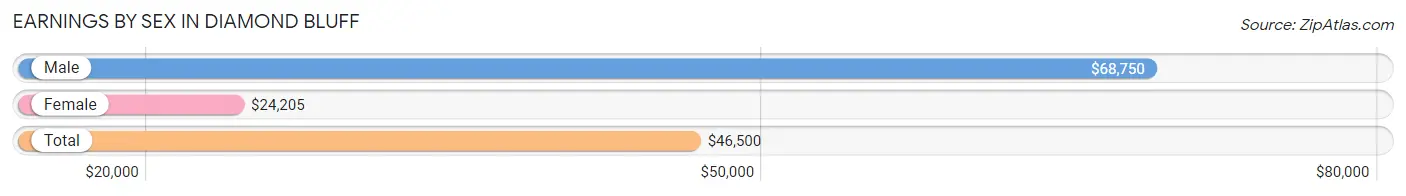
Earnings by Sex in Diamond Bluff
Average Earnings in Diamond Bluff are $46,500, $68,750 for men and $24,205 for women, a difference of 64.8%.
| Sex | Number | Average Earnings |
| Male | 58 (53.7%) | $68,750 |
| Female | 50 (46.3%) | $24,205 |
| Total | 108 (100.0%) | $46,500 |
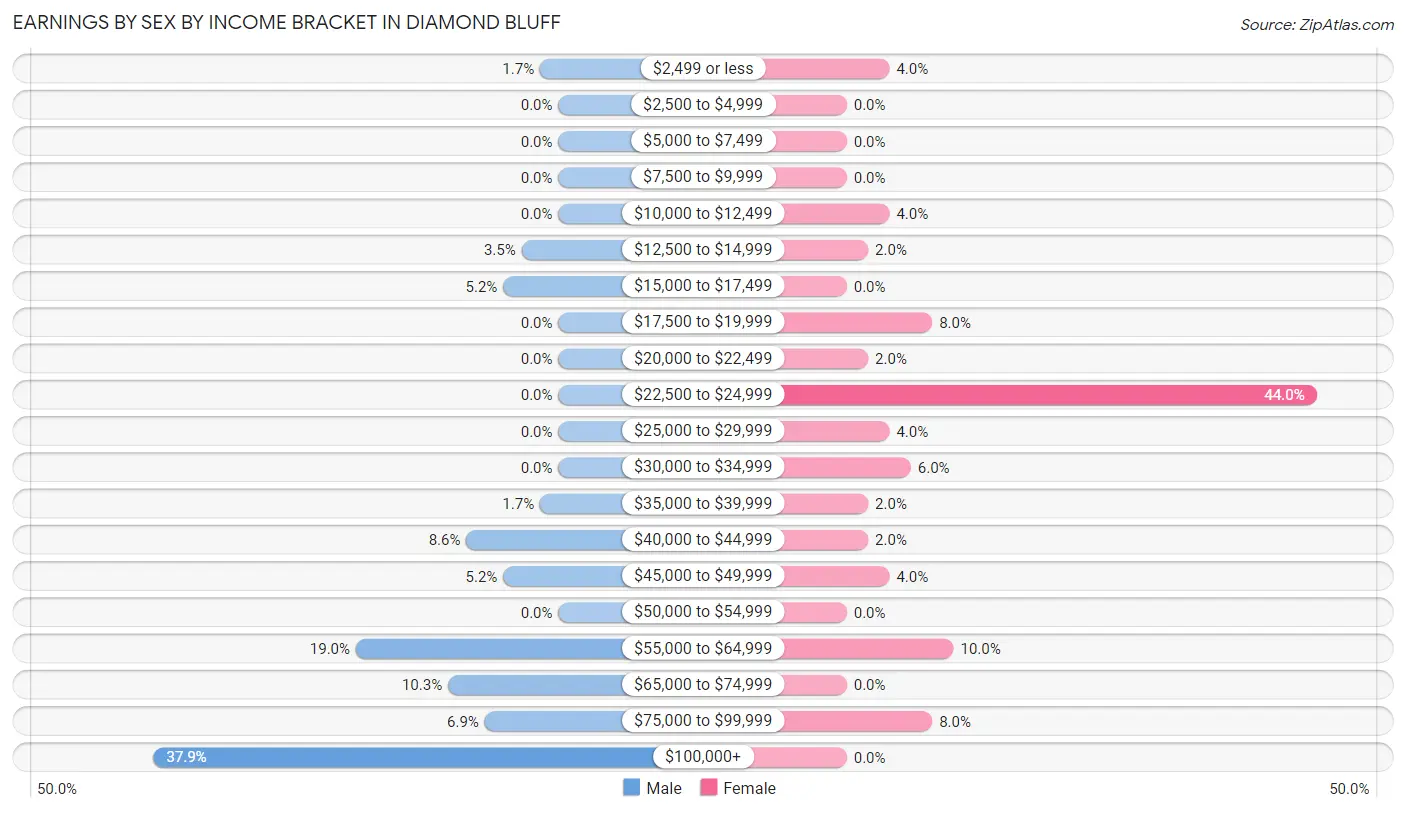
Earnings by Sex by Income Bracket in Diamond Bluff
The most common earnings brackets in Diamond Bluff are $100,000+ for men (22 | 37.9%) and $22,500 to $24,999 for women (22 | 44.0%).
| Income | Male | Female |
| $2,499 or less | 1 (1.7%) | 2 (4.0%) |
| $2,500 to $4,999 | 0 (0.0%) | 0 (0.0%) |
| $5,000 to $7,499 | 0 (0.0%) | 0 (0.0%) |
| $7,500 to $9,999 | 0 (0.0%) | 0 (0.0%) |
| $10,000 to $12,499 | 0 (0.0%) | 2 (4.0%) |
| $12,500 to $14,999 | 2 (3.5%) | 1 (2.0%) |
| $15,000 to $17,499 | 3 (5.2%) | 0 (0.0%) |
| $17,500 to $19,999 | 0 (0.0%) | 4 (8.0%) |
| $20,000 to $22,499 | 0 (0.0%) | 1 (2.0%) |
| $22,500 to $24,999 | 0 (0.0%) | 22 (44.0%) |
| $25,000 to $29,999 | 0 (0.0%) | 2 (4.0%) |
| $30,000 to $34,999 | 0 (0.0%) | 3 (6.0%) |
| $35,000 to $39,999 | 1 (1.7%) | 1 (2.0%) |
| $40,000 to $44,999 | 5 (8.6%) | 1 (2.0%) |
| $45,000 to $49,999 | 3 (5.2%) | 2 (4.0%) |
| $50,000 to $54,999 | 0 (0.0%) | 0 (0.0%) |
| $55,000 to $64,999 | 11 (19.0%) | 5 (10.0%) |
| $65,000 to $74,999 | 6 (10.3%) | 0 (0.0%) |
| $75,000 to $99,999 | 4 (6.9%) | 4 (8.0%) |
| $100,000+ | 22 (37.9%) | 0 (0.0%) |
| Total | 58 (100.0%) | 50 (100.0%) |
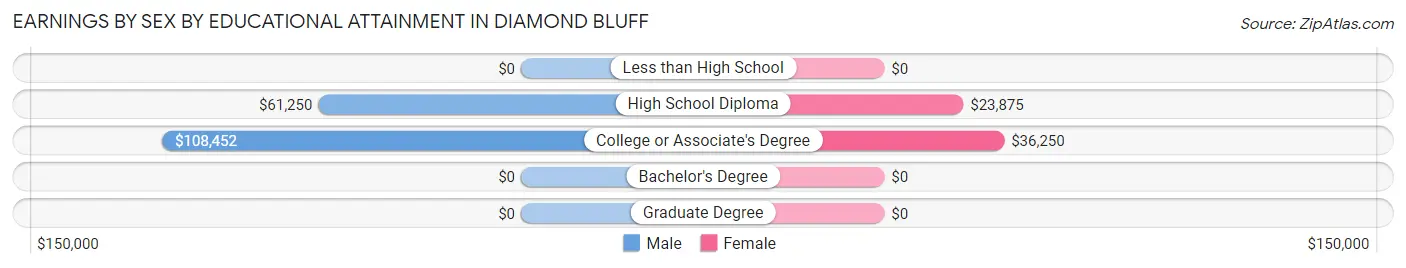
Earnings by Sex by Educational Attainment in Diamond Bluff
| Educational Attainment | Male Income | Female Income |
| Less than High School | - | - |
| High School Diploma | $61,250 | $23,875 |
| College or Associate's Degree | $108,452 | $36,250 |
| Bachelor's Degree | - | - |
| Graduate Degree | - | - |
| Total | - | - |
Family Income in Diamond Bluff
Family Income Brackets in Diamond Bluff
According to the Diamond Bluff family income data, there are 21 families falling into the $150,000 to $199,999 income range, which is the most common income bracket and makes up 35.6% of all families.
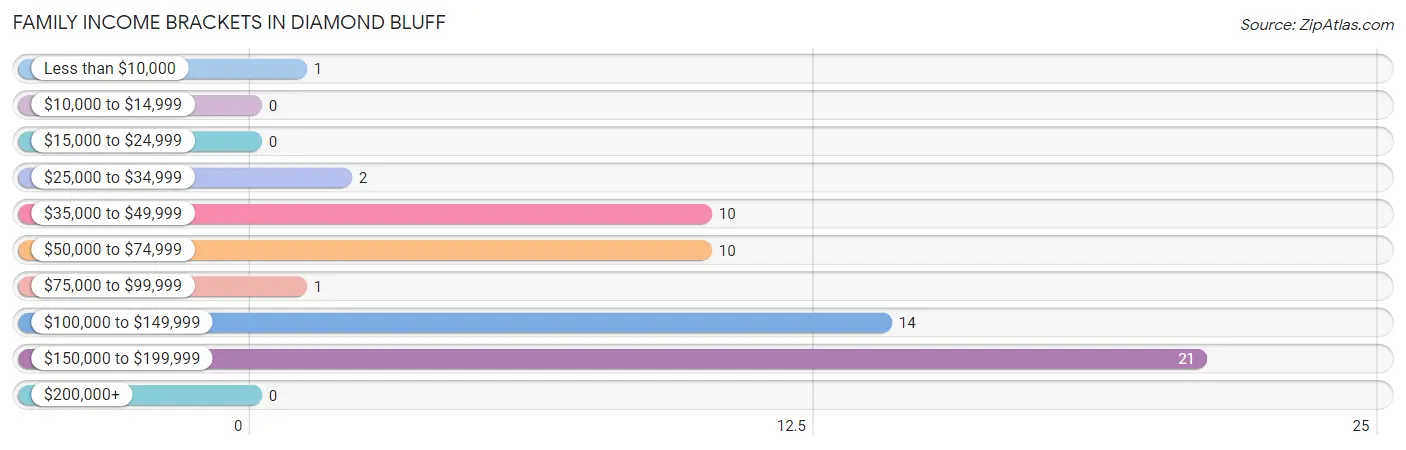
| Income Bracket | # Families | % Families |
| Less than $10,000 | 1 | 1.7% |
| $10,000 to $14,999 | 0 | 0.0% |
| $15,000 to $24,999 | 0 | 0.0% |
| $25,000 to $34,999 | 2 | 3.4% |
| $35,000 to $49,999 | 10 | 16.9% |
| $50,000 to $74,999 | 10 | 16.9% |
| $75,000 to $99,999 | 1 | 1.7% |
| $100,000 to $149,999 | 14 | 23.7% |
| $150,000 to $199,999 | 21 | 35.6% |
| $200,000+ | 0 | 0.0% |
Family Income by Famaliy Size in Diamond Bluff
4-person families (28 | 47.5%) account for the highest median family income in Diamond Bluff with $190,833 per family, while 4-person families (28 | 47.5%) have the highest median income of $47,708 per family member.
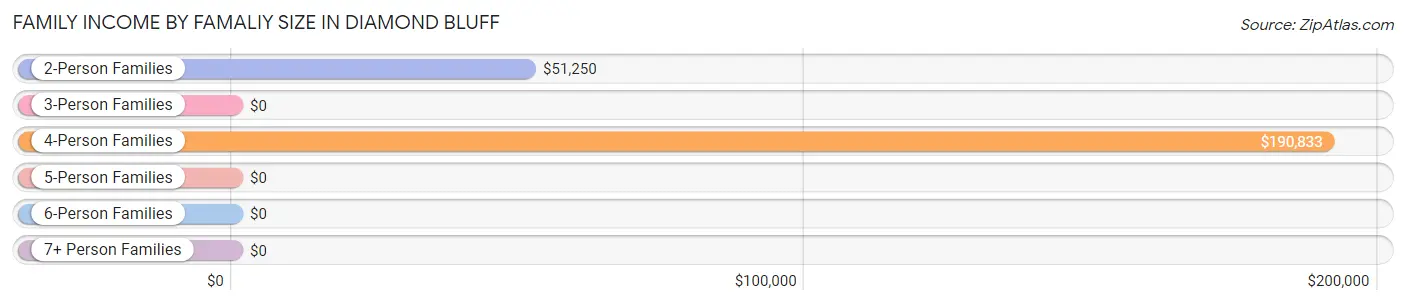
| Income Bracket | # Families | Median Income |
| 2-Person Families | 28 (47.5%) | $51,250 |
| 3-Person Families | 2 (3.4%) | $0 |
| 4-Person Families | 28 (47.5%) | $190,833 |
| 5-Person Families | 1 (1.7%) | $0 |
| 6-Person Families | 0 (0.0%) | $0 |
| 7+ Person Families | 0 (0.0%) | $0 |
| Total | 59 (100.0%) | $112,917 |
Family Income by Number of Earners in Diamond Bluff
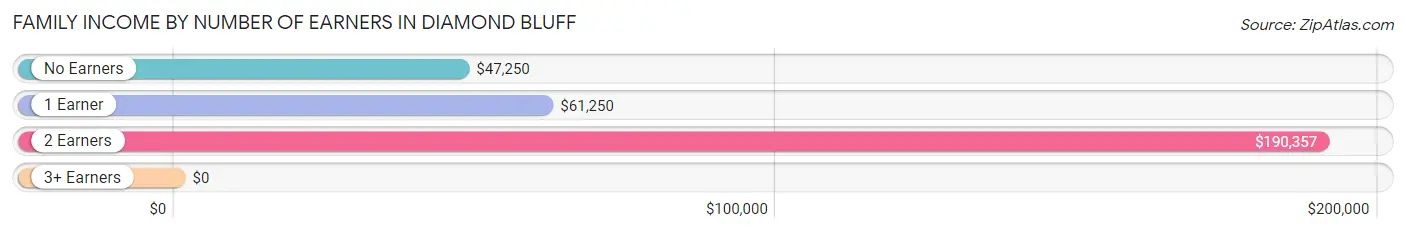
| Number of Earners | # Families | Median Income |
| No Earners | 13 (22.0%) | $47,250 |
| 1 Earner | 10 (17.0%) | $61,250 |
| 2 Earners | 36 (61.0%) | $190,357 |
| 3+ Earners | 0 (0.0%) | $0 |
| Total | 59 (100.0%) | $112,917 |
Household Income in Diamond Bluff
Household Income Brackets in Diamond Bluff
With 21 households falling in the category, the $150,000 to $199,999 income range is the most frequent in Diamond Bluff, accounting for 25.9% of all households.
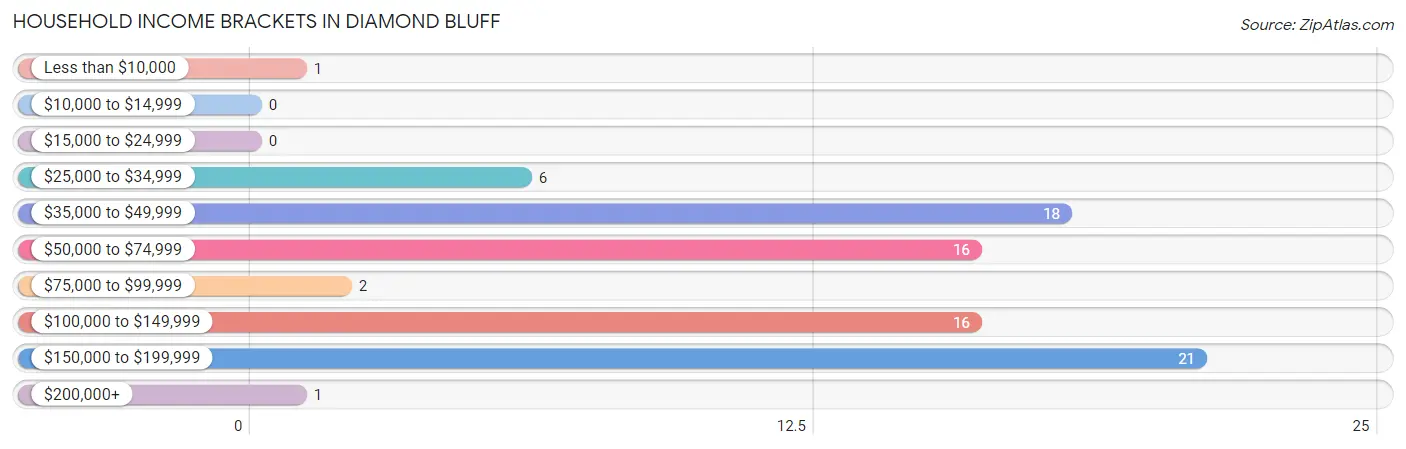
| Income Bracket | # Households | % Households |
| Less than $10,000 | 1 | 1.2% |
| $10,000 to $14,999 | 0 | 0.0% |
| $15,000 to $24,999 | 0 | 0.0% |
| $25,000 to $34,999 | 6 | 7.4% |
| $35,000 to $49,999 | 18 | 22.2% |
| $50,000 to $74,999 | 16 | 19.8% |
| $75,000 to $99,999 | 2 | 2.5% |
| $100,000 to $149,999 | 16 | 19.8% |
| $150,000 to $199,999 | 21 | 25.9% |
| $200,000+ | 1 | 1.2% |
Household Income by Householder Age in Diamond Bluff
The median household income in Diamond Bluff is $72,250, with the highest median household income of $190,595 found in the 25 to 44 years age bracket for the primary householder. A total of 32 households (39.5%) fall into this category.
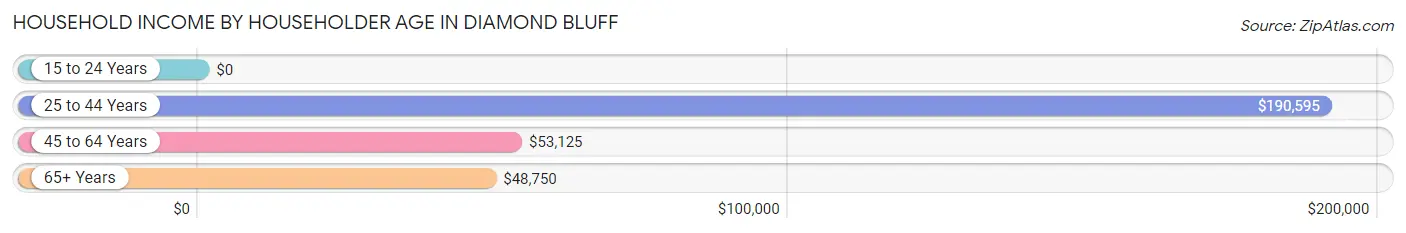
| Income Bracket | # Households | Median Income |
| 15 to 24 Years | 0 (0.0%) | $0 |
| 25 to 44 Years | 32 (39.5%) | $190,595 |
| 45 to 64 Years | 29 (35.8%) | $53,125 |
| 65+ Years | 20 (24.7%) | $48,750 |
| Total | 81 (100.0%) | $72,250 |
Poverty in Diamond Bluff
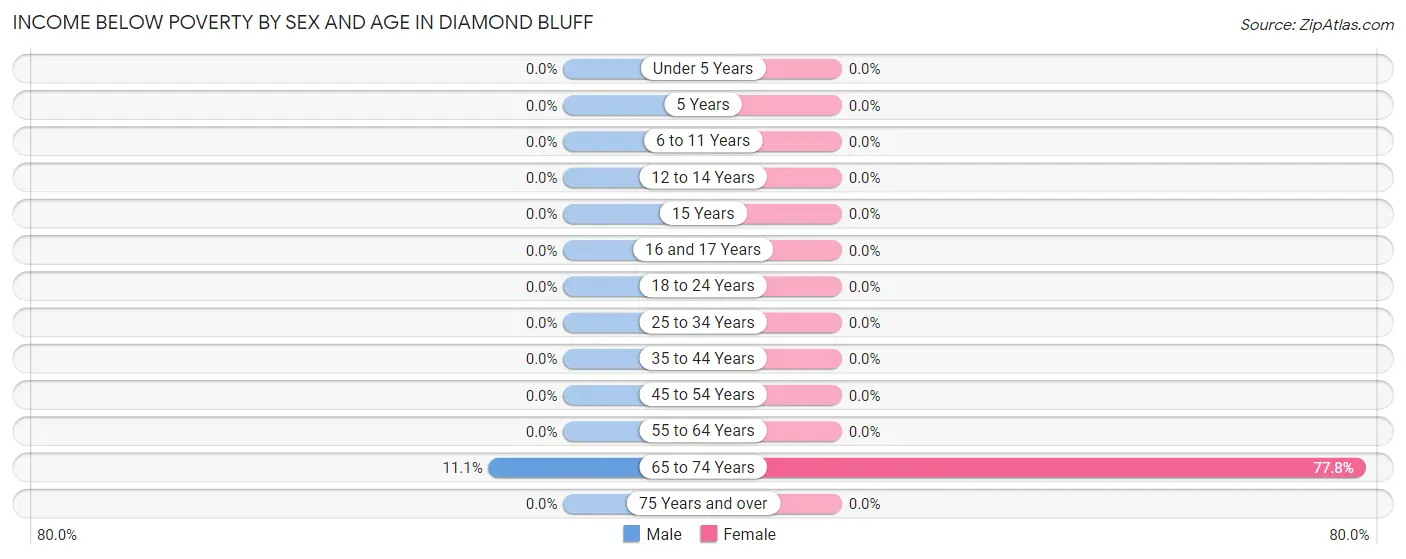
Income Below Poverty by Sex and Age in Diamond Bluff
With 0.7% poverty level for males and 9.2% for females among the residents of Diamond Bluff, 65 to 74 year old males and 65 to 74 year old females are the most vulnerable to poverty, with 1 males (11.1%) and 7 females (77.8%) in their respective age groups living below the poverty level.
| Age Bracket | Male | Female |
| Under 5 Years | 0 (0.0%) | 0 (0.0%) |
| 5 Years | 0 (0.0%) | 0 (0.0%) |
| 6 to 11 Years | 0 (0.0%) | 0 (0.0%) |
| 12 to 14 Years | 0 (0.0%) | 0 (0.0%) |
| 15 Years | 0 (0.0%) | 0 (0.0%) |
| 16 and 17 Years | 0 (0.0%) | 0 (0.0%) |
| 18 to 24 Years | 0 (0.0%) | 0 (0.0%) |
| 25 to 34 Years | 0 (0.0%) | 0 (0.0%) |
| 35 to 44 Years | 0 (0.0%) | 0 (0.0%) |
| 45 to 54 Years | 0 (0.0%) | 0 (0.0%) |
| 55 to 64 Years | 0 (0.0%) | 0 (0.0%) |
| 65 to 74 Years | 1 (11.1%) | 7 (77.8%) |
| 75 Years and over | 0 (0.0%) | 0 (0.0%) |
| Total | 1 (0.7%) | 7 (9.2%) |
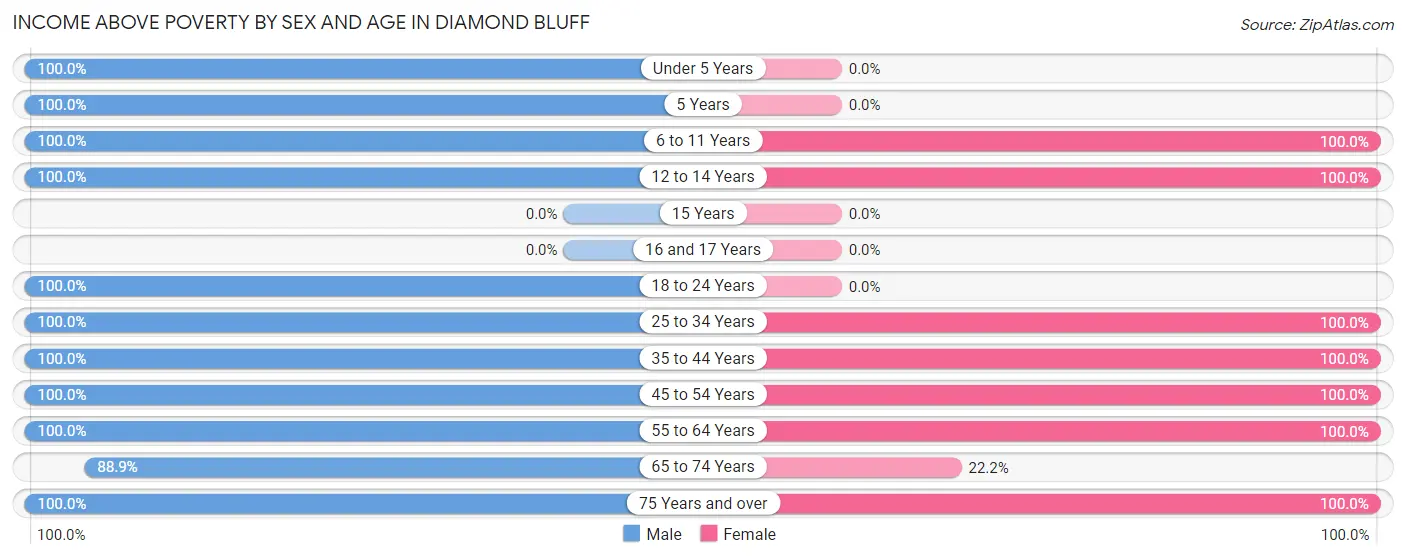
Income Above Poverty by Sex and Age in Diamond Bluff
According to the poverty statistics in Diamond Bluff, males aged under 5 years and females aged 6 to 11 years are the age groups that are most secure financially, with 100.0% of males and 100.0% of females in these age groups living above the poverty line.
| Age Bracket | Male | Female |
| Under 5 Years | 1 (100.0%) | 0 (0.0%) |
| 5 Years | 3 (100.0%) | 0 (0.0%) |
| 6 to 11 Years | 30 (100.0%) | 1 (100.0%) |
| 12 to 14 Years | 19 (100.0%) | 1 (100.0%) |
| 15 Years | 0 (0.0%) | 0 (0.0%) |
| 16 and 17 Years | 0 (0.0%) | 0 (0.0%) |
| 18 to 24 Years | 3 (100.0%) | 0 (0.0%) |
| 25 to 34 Years | 6 (100.0%) | 7 (100.0%) |
| 35 to 44 Years | 21 (100.0%) | 28 (100.0%) |
| 45 to 54 Years | 15 (100.0%) | 7 (100.0%) |
| 55 to 64 Years | 14 (100.0%) | 18 (100.0%) |
| 65 to 74 Years | 8 (88.9%) | 2 (22.2%) |
| 75 Years and over | 12 (100.0%) | 5 (100.0%) |
| Total | 132 (99.3%) | 69 (90.8%) |
Income Below Poverty Among Married-Couple Families in Diamond Bluff
The poverty statistics for married-couple families in Diamond Bluff show that 2.0% or 1 of the total 51 families live below the poverty line. Families with no children have the highest poverty rate of 5.0%, comprising of 1 families. On the other hand, families with 1 or 2 children have the lowest poverty rate of 0.0%, which includes 0 families.
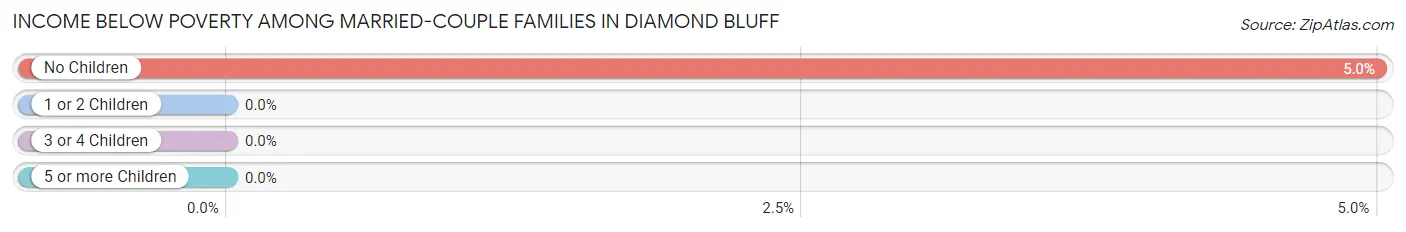
| Children | Above Poverty | Below Poverty |
| No Children | 19 (95.0%) | 1 (5.0%) |
| 1 or 2 Children | 30 (100.0%) | 0 (0.0%) |
| 3 or 4 Children | 1 (100.0%) | 0 (0.0%) |
| 5 or more Children | 0 (0.0%) | 0 (0.0%) |
| Total | 50 (98.0%) | 1 (2.0%) |
Income Below Poverty Among Single-Parent Households in Diamond Bluff
| Children | Single Father | Single Mother |
| No Children | 0 (0.0%) | 0 (0.0%) |
| 1 or 2 Children | 0 (0.0%) | 0 (0.0%) |
| 3 or 4 Children | 0 (0.0%) | 0 (0.0%) |
| 5 or more Children | 0 (0.0%) | 0 (0.0%) |
| Total | 0 (0.0%) | 0 (0.0%) |
Income Below Poverty Among Married-Couple vs Single-Parent Households in Diamond Bluff
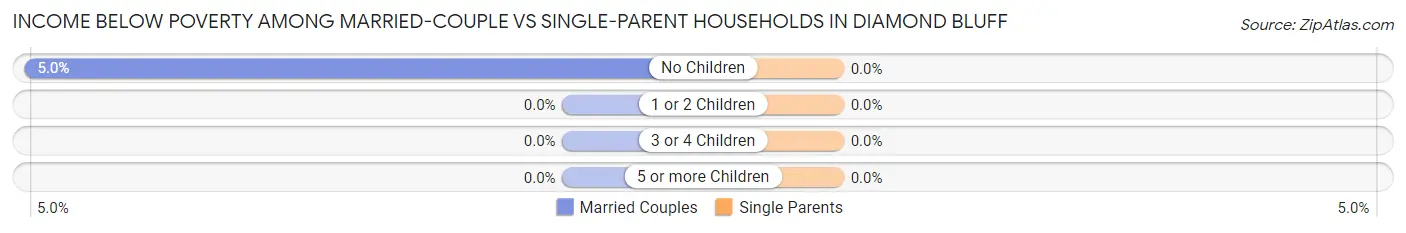
| Children | Married-Couple Families | Single-Parent Households |
| No Children | 1 (5.0%) | 0 (0.0%) |
| 1 or 2 Children | 0 (0.0%) | 0 (0.0%) |
| 3 or 4 Children | 0 (0.0%) | 0 (0.0%) |
| 5 or more Children | 0 (0.0%) | 0 (0.0%) |
| Total | 1 (2.0%) | 0 (0.0%) |
Race in Diamond Bluff
The most populous races in Diamond Bluff are White / Caucasian (207 | 99.0%), Hispanic or Latino (7 | 3.4%), and Two or more Races (2 | 1.0%).
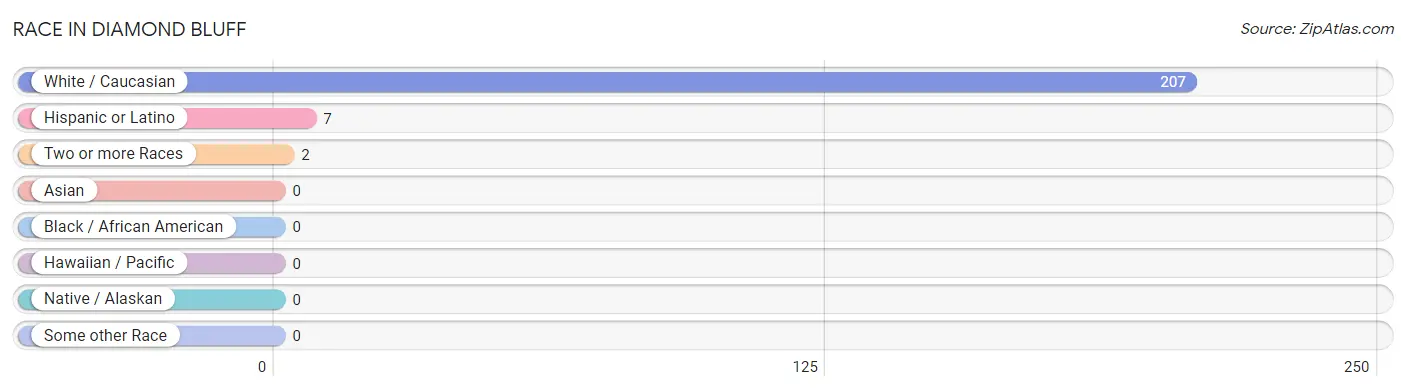
| Race | # Population | % Population |
| Asian | 0 | 0.0% |
| Black / African American | 0 | 0.0% |
| Hawaiian / Pacific | 0 | 0.0% |
| Hispanic or Latino | 7 | 3.4% |
| Native / Alaskan | 0 | 0.0% |
| White / Caucasian | 207 | 99.0% |
| Two or more Races | 2 | 1.0% |
| Some other Race | 0 | 0.0% |
| Total | 209 | 100.0% |
Ancestry in Diamond Bluff
The most populous ancestries reported in Diamond Bluff are American (77 | 36.8%), German (56 | 26.8%), Norwegian (28 | 13.4%), Irish (18 | 8.6%), and Swedish (8 | 3.8%), together accounting for 89.5% of all Diamond Bluff residents.
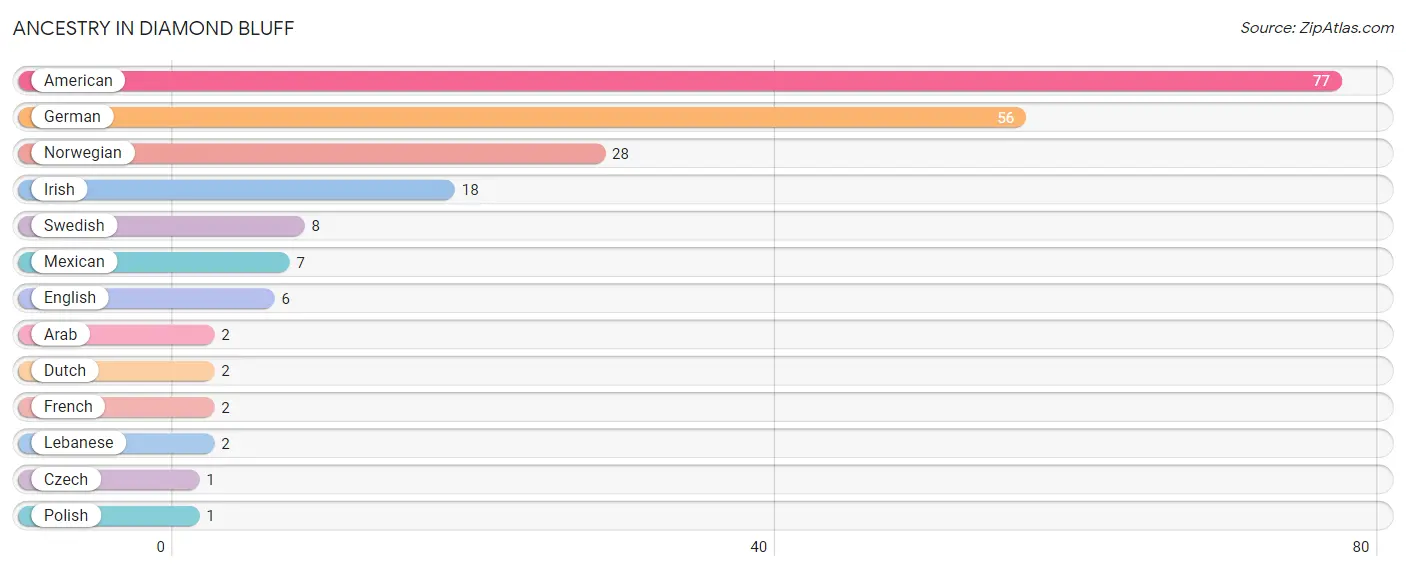
| Ancestry | # Population | % Population |
| American | 77 | 36.8% |
| Arab | 2 | 1.0% |
| Czech | 1 | 0.5% |
| Dutch | 2 | 1.0% |
| English | 6 | 2.9% |
| French | 2 | 1.0% |
| German | 56 | 26.8% |
| Irish | 18 | 8.6% |
| Lebanese | 2 | 1.0% |
| Mexican | 7 | 3.4% |
| Norwegian | 28 | 13.4% |
| Polish | 1 | 0.5% |
| Swedish | 8 | 3.8% | View All 13 Rows |
Immigrants in Diamond Bluff

| Immigration Origin | # Population | % Population | View All 0 Rows |
Sex and Age in Diamond Bluff
Sex and Age in Diamond Bluff
The most populous age groups in Diamond Bluff are 10 to 14 Years (40 | 30.1%) for men and 40 to 44 Years (26 | 34.2%) for women.
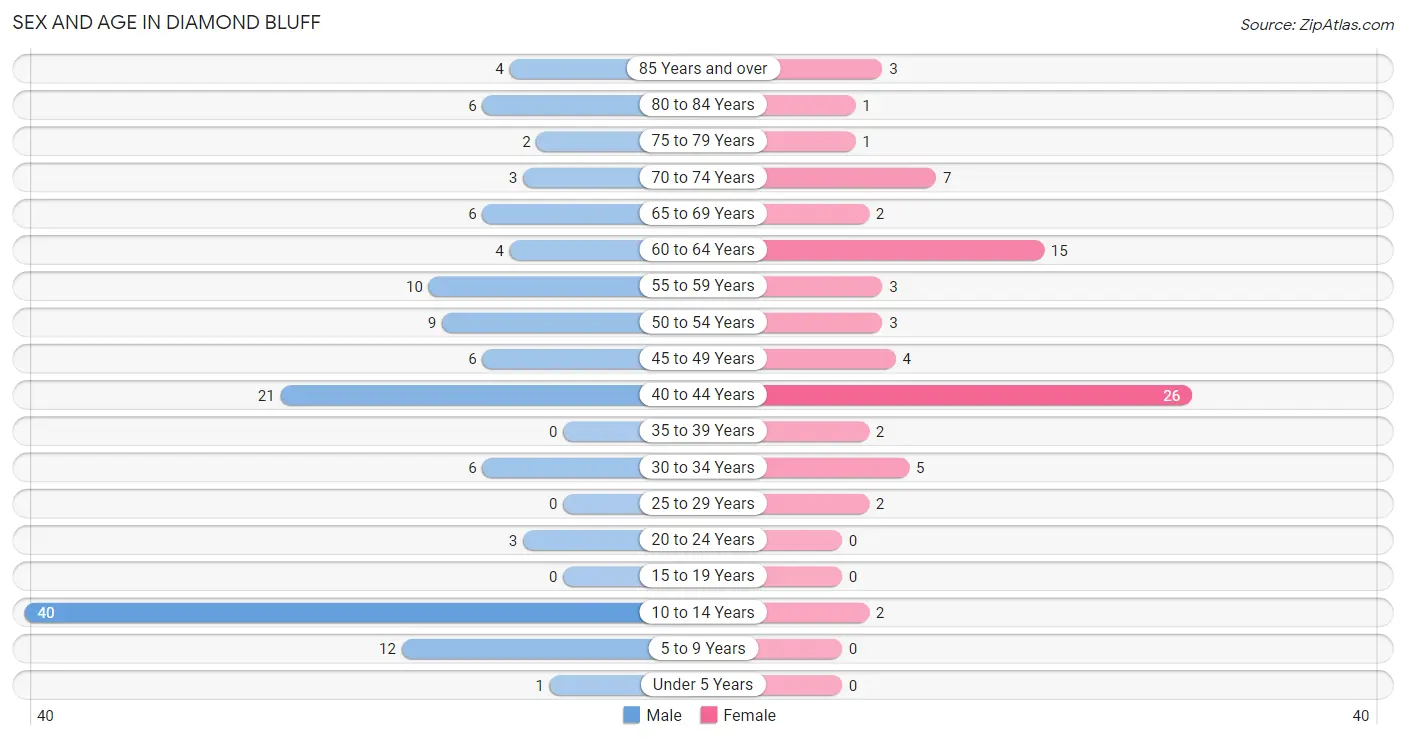
| Age Bracket | Male | Female |
| Under 5 Years | 1 (0.7%) | 0 (0.0%) |
| 5 to 9 Years | 12 (9.0%) | 0 (0.0%) |
| 10 to 14 Years | 40 (30.1%) | 2 (2.6%) |
| 15 to 19 Years | 0 (0.0%) | 0 (0.0%) |
| 20 to 24 Years | 3 (2.3%) | 0 (0.0%) |
| 25 to 29 Years | 0 (0.0%) | 2 (2.6%) |
| 30 to 34 Years | 6 (4.5%) | 5 (6.6%) |
| 35 to 39 Years | 0 (0.0%) | 2 (2.6%) |
| 40 to 44 Years | 21 (15.8%) | 26 (34.2%) |
| 45 to 49 Years | 6 (4.5%) | 4 (5.3%) |
| 50 to 54 Years | 9 (6.8%) | 3 (4.0%) |
| 55 to 59 Years | 10 (7.5%) | 3 (4.0%) |
| 60 to 64 Years | 4 (3.0%) | 15 (19.7%) |
| 65 to 69 Years | 6 (4.5%) | 2 (2.6%) |
| 70 to 74 Years | 3 (2.3%) | 7 (9.2%) |
| 75 to 79 Years | 2 (1.5%) | 1 (1.3%) |
| 80 to 84 Years | 6 (4.5%) | 1 (1.3%) |
| 85 Years and over | 4 (3.0%) | 3 (4.0%) |
| Total | 133 (100.0%) | 76 (100.0%) |
Families and Households in Diamond Bluff
Median Family Size in Diamond Bluff
The median family size in Diamond Bluff is 3.02 persons per family, with married-couple families (51 | 86.4%) accounting for the largest median family size of 3.12 persons per family. On the other hand, single female/mother families (4 | 6.8%) represent the smallest median family size with 2.25 persons per family.
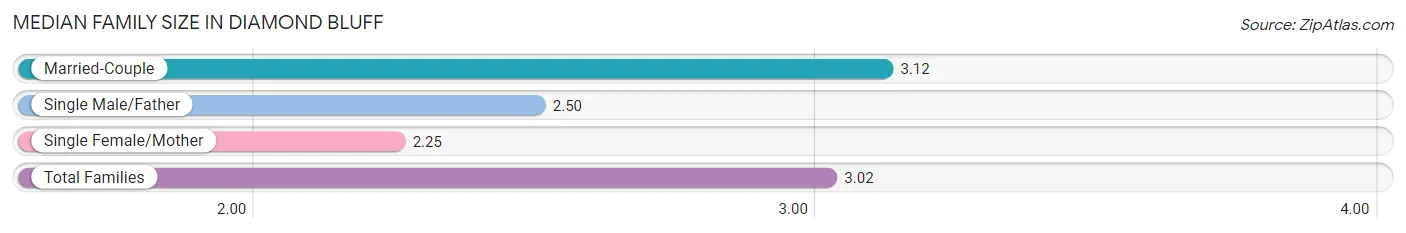
| Family Type | # Families | Family Size |
| Married-Couple | 51 (86.4%) | 3.12 |
| Single Male/Father | 4 (6.8%) | 2.50 |
| Single Female/Mother | 4 (6.8%) | 2.25 |
| Total Families | 59 (100.0%) | 3.02 |
Median Household Size in Diamond Bluff
The median household size in Diamond Bluff is 2.58 persons per household, with married-couple households (51 | 63.0%) accounting for the largest median household size of 3.12 persons per household. non-family households (22 | 27.2%) represent the smallest median household size with 1.41 persons per household.
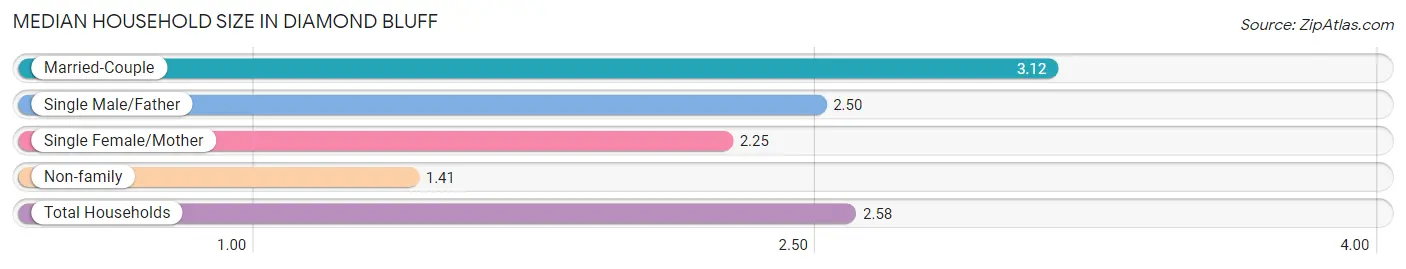
| Household Type | # Households | Household Size |
| Married-Couple | 51 (63.0%) | 3.12 |
| Single Male/Father | 4 (4.9%) | 2.50 |
| Single Female/Mother | 4 (4.9%) | 2.25 |
| Non-family | 22 (27.2%) | 1.41 |
| Total Households | 81 (100.0%) | 2.58 |
Household Size by Marriage Status in Diamond Bluff
Out of a total of 81 households in Diamond Bluff, 59 (72.8%) are family households, while 22 (27.2%) are nonfamily households. The most numerous type of family households are 2-person households, comprising 28, and the most common type of nonfamily households are 1-person households, comprising 15.
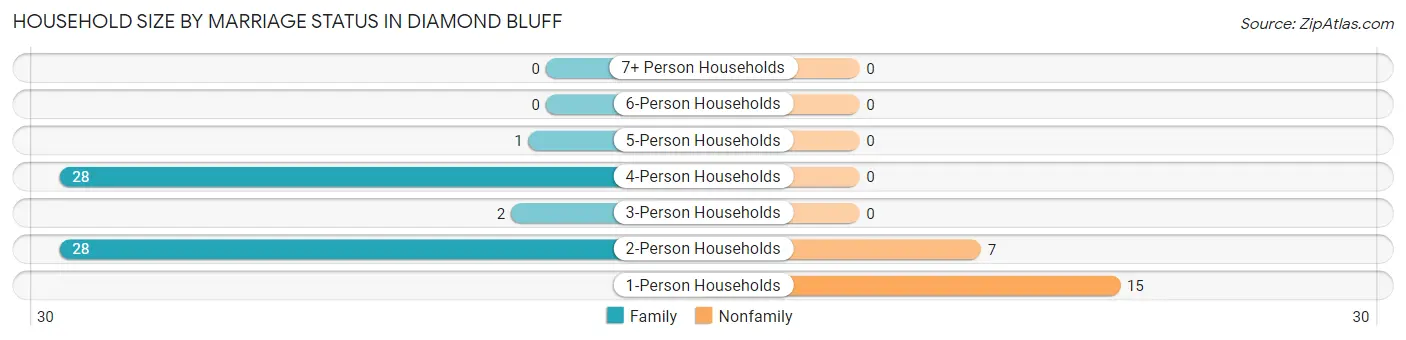
| Household Size | Family Households | Nonfamily Households |
| 1-Person Households | - | 15 (18.5%) |
| 2-Person Households | 28 (34.6%) | 7 (8.6%) |
| 3-Person Households | 2 (2.5%) | 0 (0.0%) |
| 4-Person Households | 28 (34.6%) | 0 (0.0%) |
| 5-Person Households | 1 (1.2%) | 0 (0.0%) |
| 6-Person Households | 0 (0.0%) | 0 (0.0%) |
| 7+ Person Households | 0 (0.0%) | 0 (0.0%) |
| Total | 59 (72.8%) | 22 (27.2%) |
Female Fertility in Diamond Bluff
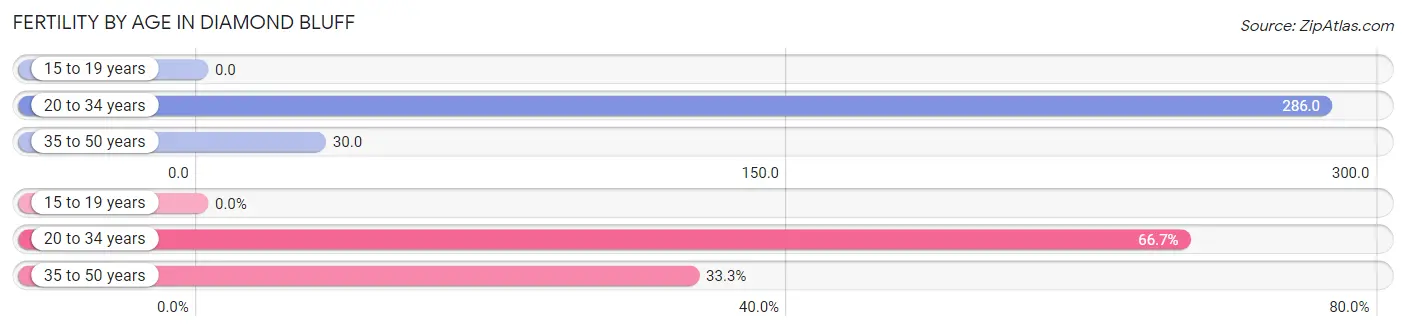
Fertility by Age in Diamond Bluff
Average fertility rate in Diamond Bluff is 75.0 births per 1,000 women. Women in the age bracket of 20 to 34 years have the highest fertility rate with 286.0 births per 1,000 women. Women in the age bracket of 20 to 34 years acount for 66.7% of all women with births.
| Age Bracket | Women with Births | Births / 1,000 Women |
| 15 to 19 years | 0 (0.0%) | 0.0 |
| 20 to 34 years | 2 (66.7%) | 286.0 |
| 35 to 50 years | 1 (33.3%) | 30.0 |
| Total | 3 (100.0%) | 75.0 |
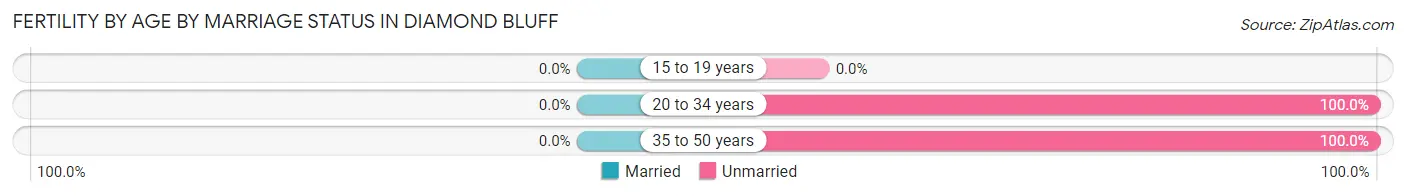
Fertility by Age by Marriage Status in Diamond Bluff
| Age Bracket | Married | Unmarried |
| 15 to 19 years | 0 (0.0%) | 0 (0.0%) |
| 20 to 34 years | 0 (0.0%) | 2 (100.0%) |
| 35 to 50 years | 0 (0.0%) | 1 (100.0%) |
| Total | 0 (0.0%) | 3 (100.0%) |
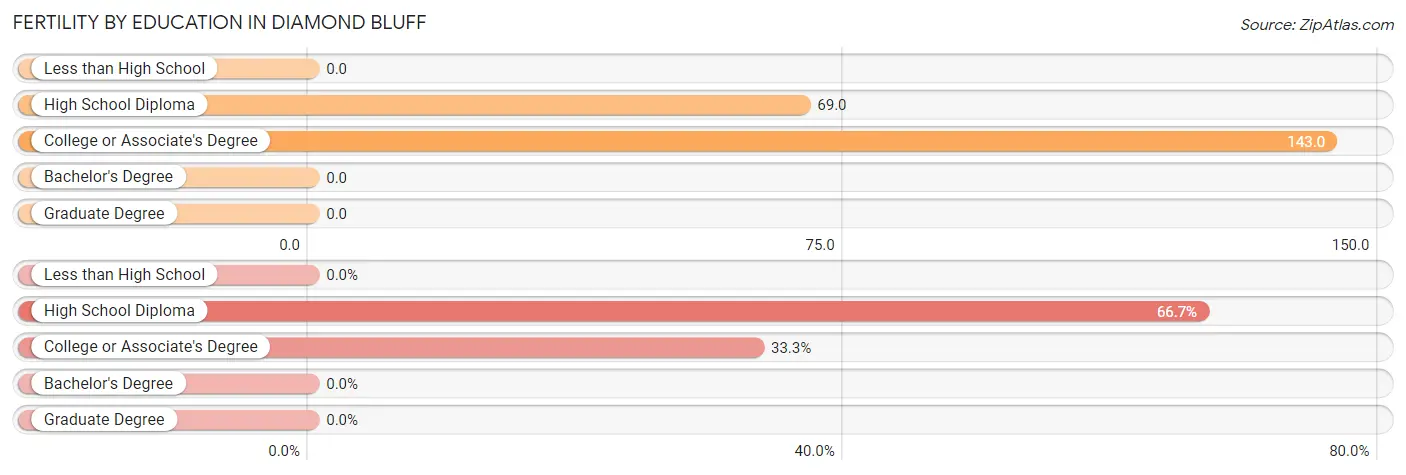
Fertility by Education in Diamond Bluff
| Educational Attainment | Women with Births | Births / 1,000 Women |
| Less than High School | 0 (0.0%) | 0.0 |
| High School Diploma | 2 (66.7%) | 69.0 |
| College or Associate's Degree | 1 (33.3%) | 143.0 |
| Bachelor's Degree | 0 (0.0%) | 0.0 |
| Graduate Degree | 0 (0.0%) | 0.0 |
| Total | 3 (100.0%) | 75.0 |
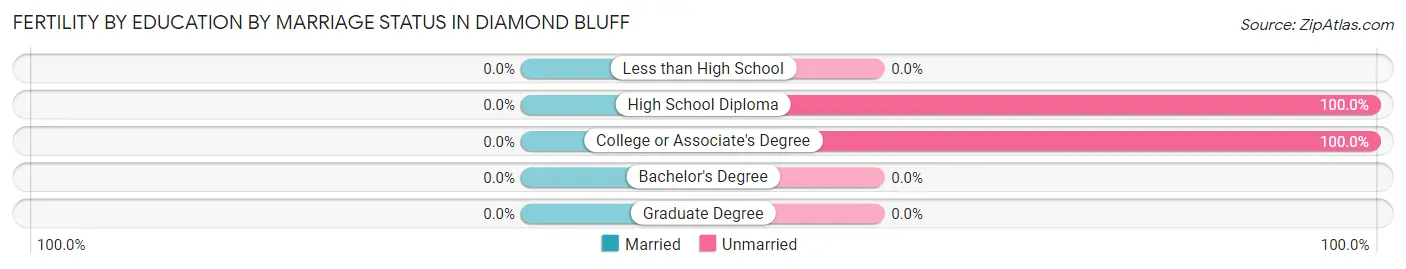
Fertility by Education by Marriage Status in Diamond Bluff
| Educational Attainment | Married | Unmarried |
| Less than High School | 0 (0.0%) | 0 (0.0%) |
| High School Diploma | 0 (0.0%) | 2 (100.0%) |
| College or Associate's Degree | 0 (0.0%) | 1 (100.0%) |
| Bachelor's Degree | 0 (0.0%) | 0 (0.0%) |
| Graduate Degree | 0 (0.0%) | 0 (0.0%) |
| Total | 0 (0.0%) | 3 (100.0%) |
Employment Characteristics in Diamond Bluff
Employment by Class of Employer in Diamond Bluff
Among the 81 employed individuals in Diamond Bluff, private company employees (67 | 82.7%), self-employed (not incorporated) (10 | 12.3%), and self-employed (incorporated) (2 | 2.5%) make up the most common classes of employment.
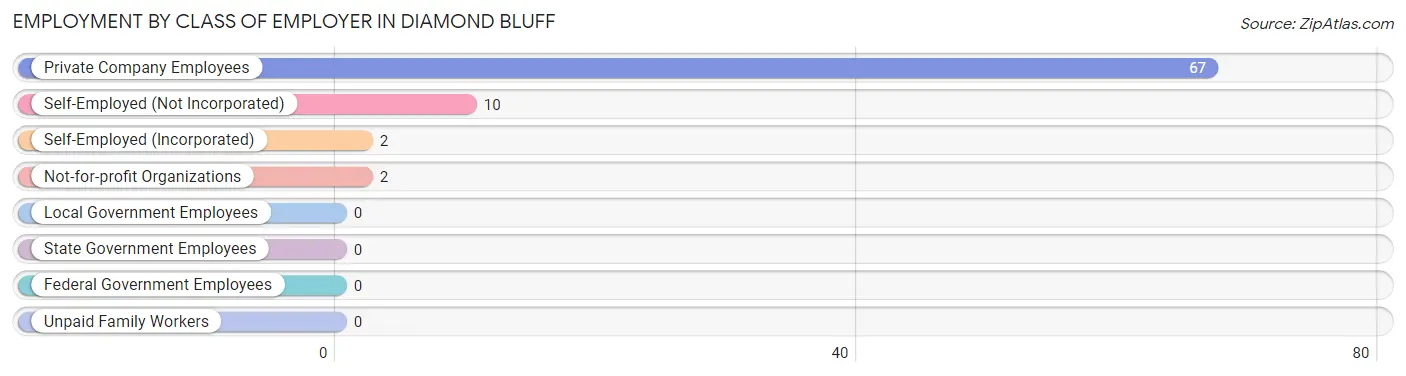
| Employer Class | # Employees | % Employees |
| Private Company Employees | 67 | 82.7% |
| Self-Employed (Incorporated) | 2 | 2.5% |
| Self-Employed (Not Incorporated) | 10 | 12.3% |
| Not-for-profit Organizations | 2 | 2.5% |
| Local Government Employees | 0 | 0.0% |
| State Government Employees | 0 | 0.0% |
| Federal Government Employees | 0 | 0.0% |
| Unpaid Family Workers | 0 | 0.0% |
| Total | 81 | 100.0% |
Employment Status by Age in Diamond Bluff
According to the labor force statistics for Diamond Bluff, out of the total population over 16 years of age (154), 66.9% or 103 individuals are in the labor force, with 19.4% or 20 of them unemployed. The age group with the highest labor force participation rate is 20 to 24 years, with 100.0% or 3 individuals in the labor force. Within the labor force, the 35 to 44 years age range has the highest percentage of unemployed individuals, with 41.7% or 20 of them being unemployed.
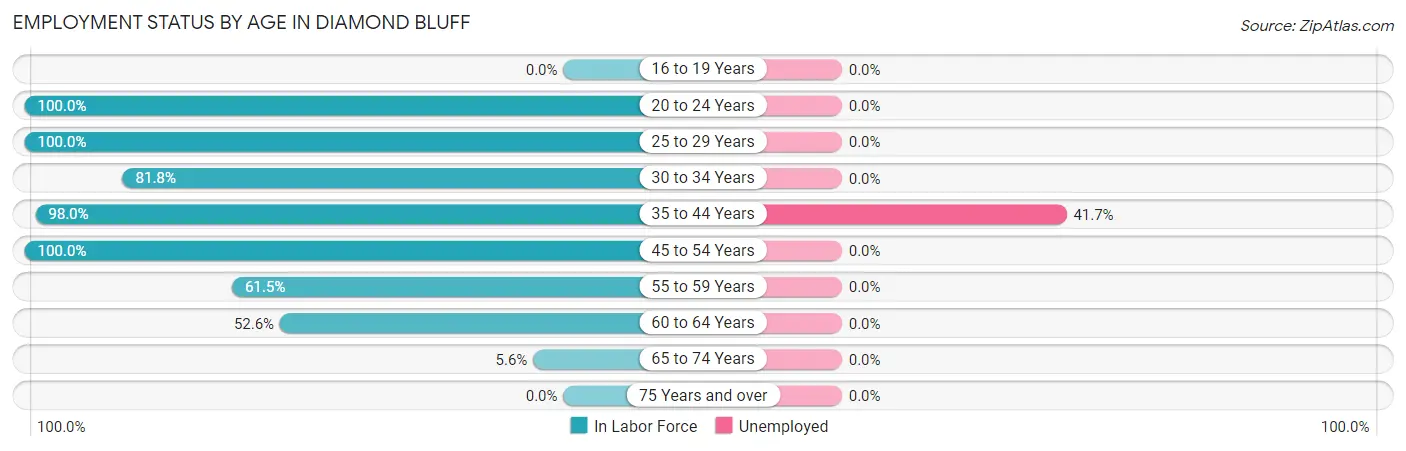
| Age Bracket | In Labor Force | Unemployed |
| 16 to 19 Years | 0 (0.0%) | 0 (0.0%) |
| 20 to 24 Years | 3 (100.0%) | 0 (0.0%) |
| 25 to 29 Years | 2 (100.0%) | 0 (0.0%) |
| 30 to 34 Years | 9 (81.8%) | 0 (0.0%) |
| 35 to 44 Years | 48 (98.0%) | 20 (41.7%) |
| 45 to 54 Years | 22 (100.0%) | 0 (0.0%) |
| 55 to 59 Years | 8 (61.5%) | 0 (0.0%) |
| 60 to 64 Years | 10 (52.6%) | 0 (0.0%) |
| 65 to 74 Years | 1 (5.6%) | 0 (0.0%) |
| 75 Years and over | 0 (0.0%) | 0 (0.0%) |
| Total | 103 (66.9%) | 20 (19.4%) |
Employment Status by Educational Attainment in Diamond Bluff
According to labor force statistics for Diamond Bluff, 85.3% of individuals (99) out of the total population between 25 and 64 years of age (116) are in the labor force, with 20.2% or 20 of them being unemployed. The group with the highest labor force participation rate are those with the educational attainment of high school diploma, with 100.0% or 50 individuals in the labor force. Within the labor force, individuals with high school diploma education have the highest percentage of unemployment, with 40.0% or 20 of them being unemployed.
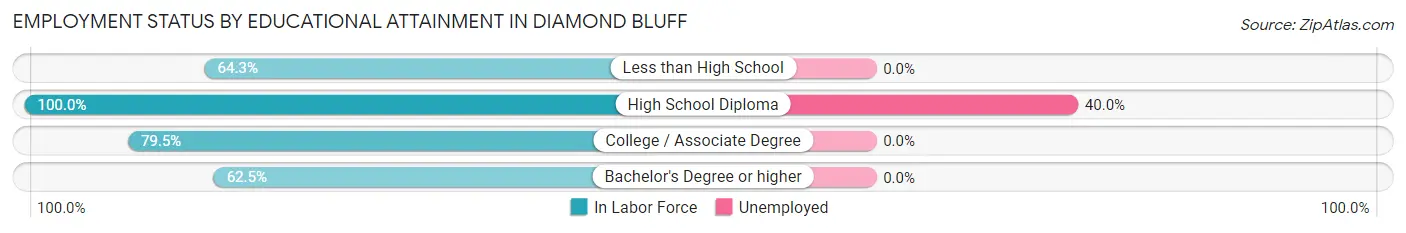
| Educational Attainment | In Labor Force | Unemployed |
| Less than High School | 9 (64.3%) | 0 (0.0%) |
| High School Diploma | 50 (100.0%) | 20 (40.0%) |
| College / Associate Degree | 35 (79.5%) | 0 (0.0%) |
| Bachelor's Degree or higher | 5 (62.5%) | 0 (0.0%) |
| Total | 99 (85.3%) | 23 (20.2%) |
Employment Occupations by Sex in Diamond Bluff
Management, Business, Science and Arts Occupations
The most common Management, Business, Science and Arts occupations in Diamond Bluff are Management (23 | 27.7%), Health Diagnosing & Treating (4 | 4.8%), Business & Financial (3 | 3.6%), Health Technologists (3 | 3.6%), and Community & Social Service (2 | 2.4%).
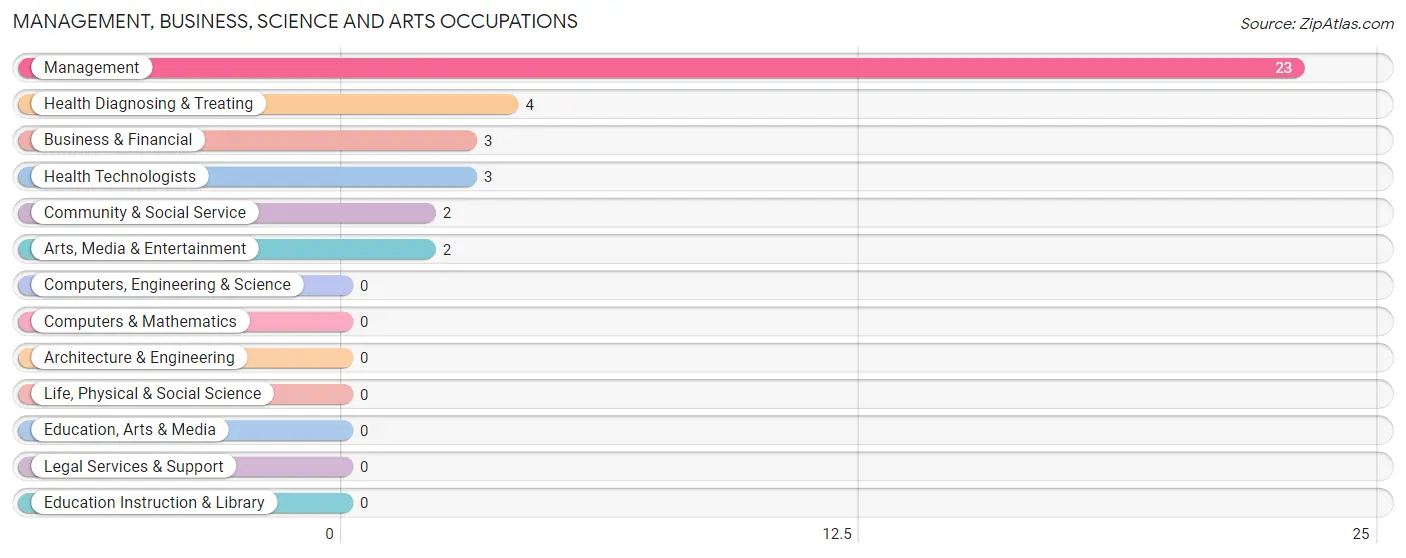
Management, Business, Science and Arts Occupations by Sex
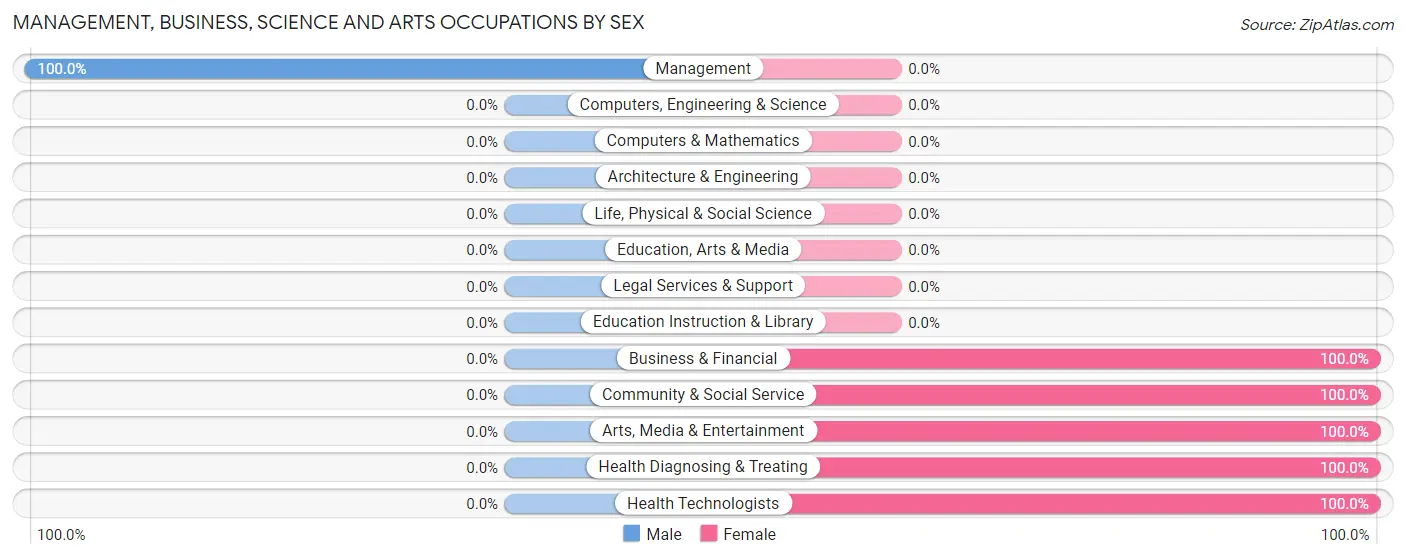
| Occupation | Male | Female |
| Management | 23 (100.0%) | 0 (0.0%) |
| Business & Financial | 0 (0.0%) | 3 (100.0%) |
| Computers, Engineering & Science | 0 (0.0%) | 0 (0.0%) |
| Computers & Mathematics | 0 (0.0%) | 0 (0.0%) |
| Architecture & Engineering | 0 (0.0%) | 0 (0.0%) |
| Life, Physical & Social Science | 0 (0.0%) | 0 (0.0%) |
| Community & Social Service | 0 (0.0%) | 2 (100.0%) |
| Education, Arts & Media | 0 (0.0%) | 0 (0.0%) |
| Legal Services & Support | 0 (0.0%) | 0 (0.0%) |
| Education Instruction & Library | 0 (0.0%) | 0 (0.0%) |
| Arts, Media & Entertainment | 0 (0.0%) | 2 (100.0%) |
| Health Diagnosing & Treating | 0 (0.0%) | 4 (100.0%) |
| Health Technologists | 0 (0.0%) | 3 (100.0%) |
| Total (Category) | 23 (71.9%) | 9 (28.1%) |
| Total (Overall) | 55 (66.3%) | 28 (33.7%) |
Services Occupations
The most common Services occupations in Diamond Bluff are Cleaning & Maintenance (7 | 8.4%), Food Preparation & Serving (4 | 4.8%), Security & Protection (2 | 2.4%), and Firefighting & Prevention (2 | 2.4%).

Services Occupations by Sex
Within the Services occupations in Diamond Bluff, the most male-oriented occupations are Security & Protection (100.0%), Firefighting & Prevention (100.0%), and Cleaning & Maintenance (42.9%), while the most female-oriented occupations are Food Preparation & Serving (100.0%), and Cleaning & Maintenance (57.1%).
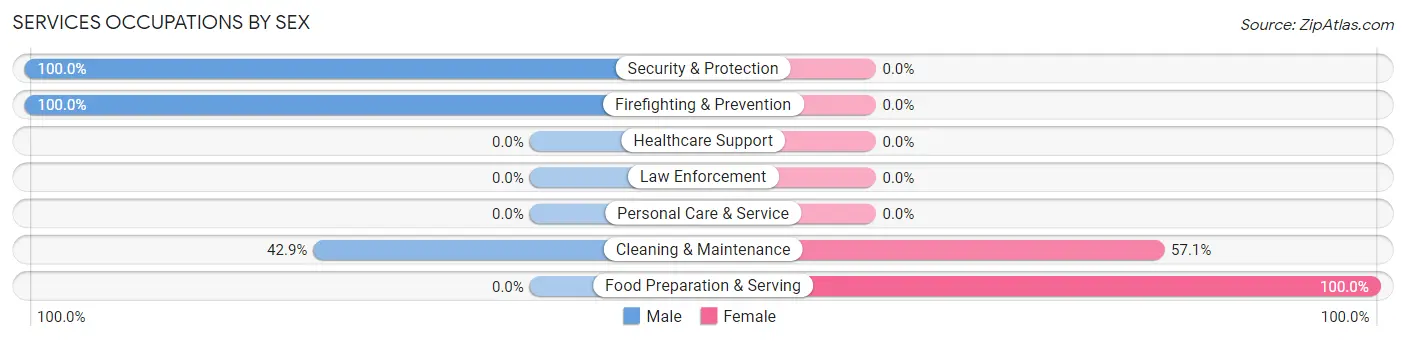
| Occupation | Male | Female |
| Healthcare Support | 0 (0.0%) | 0 (0.0%) |
| Security & Protection | 2 (100.0%) | 0 (0.0%) |
| Firefighting & Prevention | 2 (100.0%) | 0 (0.0%) |
| Law Enforcement | 0 (0.0%) | 0 (0.0%) |
| Food Preparation & Serving | 0 (0.0%) | 4 (100.0%) |
| Cleaning & Maintenance | 3 (42.9%) | 4 (57.1%) |
| Personal Care & Service | 0 (0.0%) | 0 (0.0%) |
| Total (Category) | 5 (38.5%) | 8 (61.5%) |
| Total (Overall) | 55 (66.3%) | 28 (33.7%) |
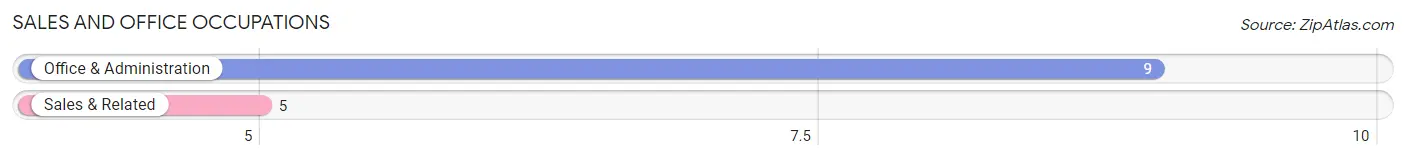
Sales and Office Occupations
The most common Sales and Office occupations in Diamond Bluff are Office & Administration (9 | 10.8%), and Sales & Related (5 | 6.0%).
Sales and Office Occupations by Sex
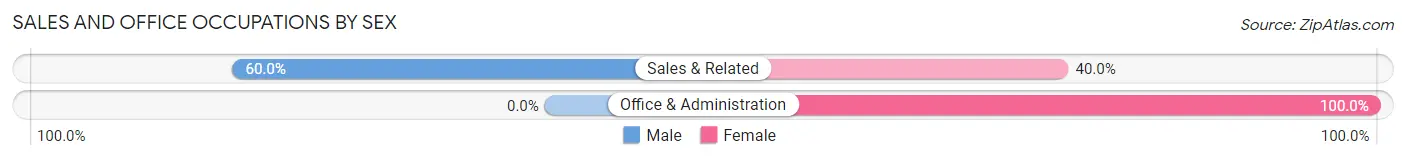
| Occupation | Male | Female |
| Sales & Related | 3 (60.0%) | 2 (40.0%) |
| Office & Administration | 0 (0.0%) | 9 (100.0%) |
| Total (Category) | 3 (21.4%) | 11 (78.6%) |
| Total (Overall) | 55 (66.3%) | 28 (33.7%) |
Natural Resources, Construction and Maintenance Occupations
The most common Natural Resources, Construction and Maintenance occupations in Diamond Bluff are Construction & Extraction (7 | 8.4%), and Installation, Maintenance & Repair (6 | 7.2%).
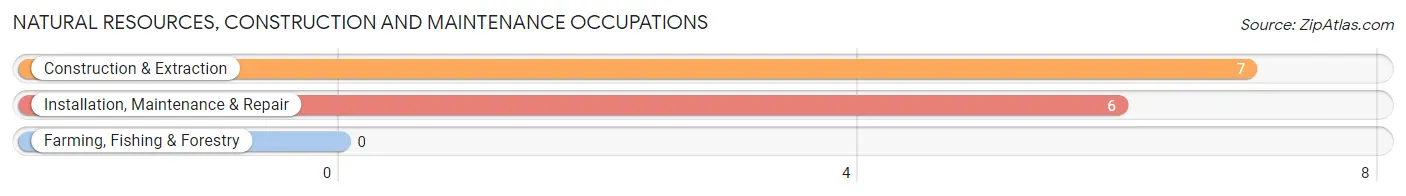
Natural Resources, Construction and Maintenance Occupations by Sex
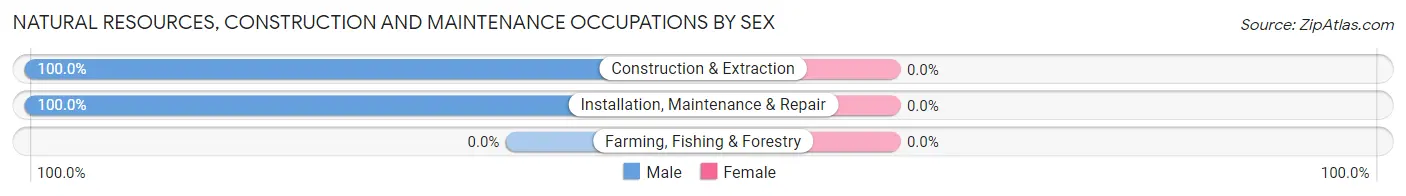
| Occupation | Male | Female |
| Farming, Fishing & Forestry | 0 (0.0%) | 0 (0.0%) |
| Construction & Extraction | 7 (100.0%) | 0 (0.0%) |
| Installation, Maintenance & Repair | 6 (100.0%) | 0 (0.0%) |
| Total (Category) | 13 (100.0%) | 0 (0.0%) |
| Total (Overall) | 55 (66.3%) | 28 (33.7%) |
Production, Transportation and Moving Occupations
The most common Production, Transportation and Moving occupations in Diamond Bluff are Production (5 | 6.0%), Transportation (4 | 4.8%), and Material Moving (2 | 2.4%).
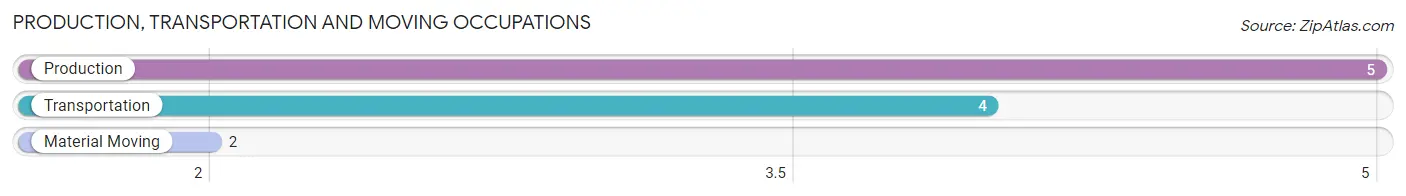
Production, Transportation and Moving Occupations by Sex
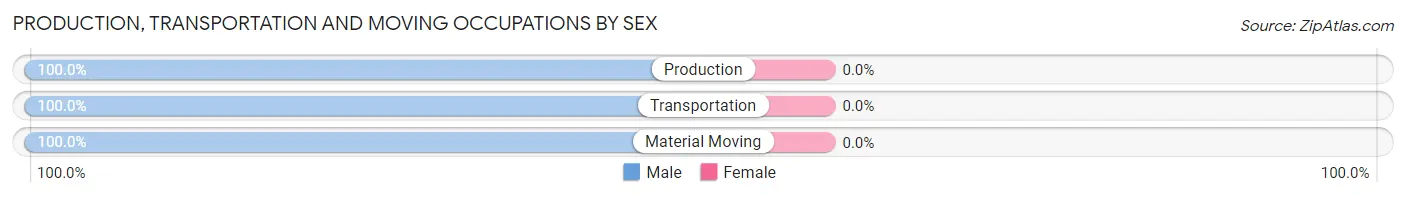
| Occupation | Male | Female |
| Production | 5 (100.0%) | 0 (0.0%) |
| Transportation | 4 (100.0%) | 0 (0.0%) |
| Material Moving | 2 (100.0%) | 0 (0.0%) |
| Total (Category) | 11 (100.0%) | 0 (0.0%) |
| Total (Overall) | 55 (66.3%) | 28 (33.7%) |
Employment Industries by Sex in Diamond Bluff
Employment Industries in Diamond Bluff
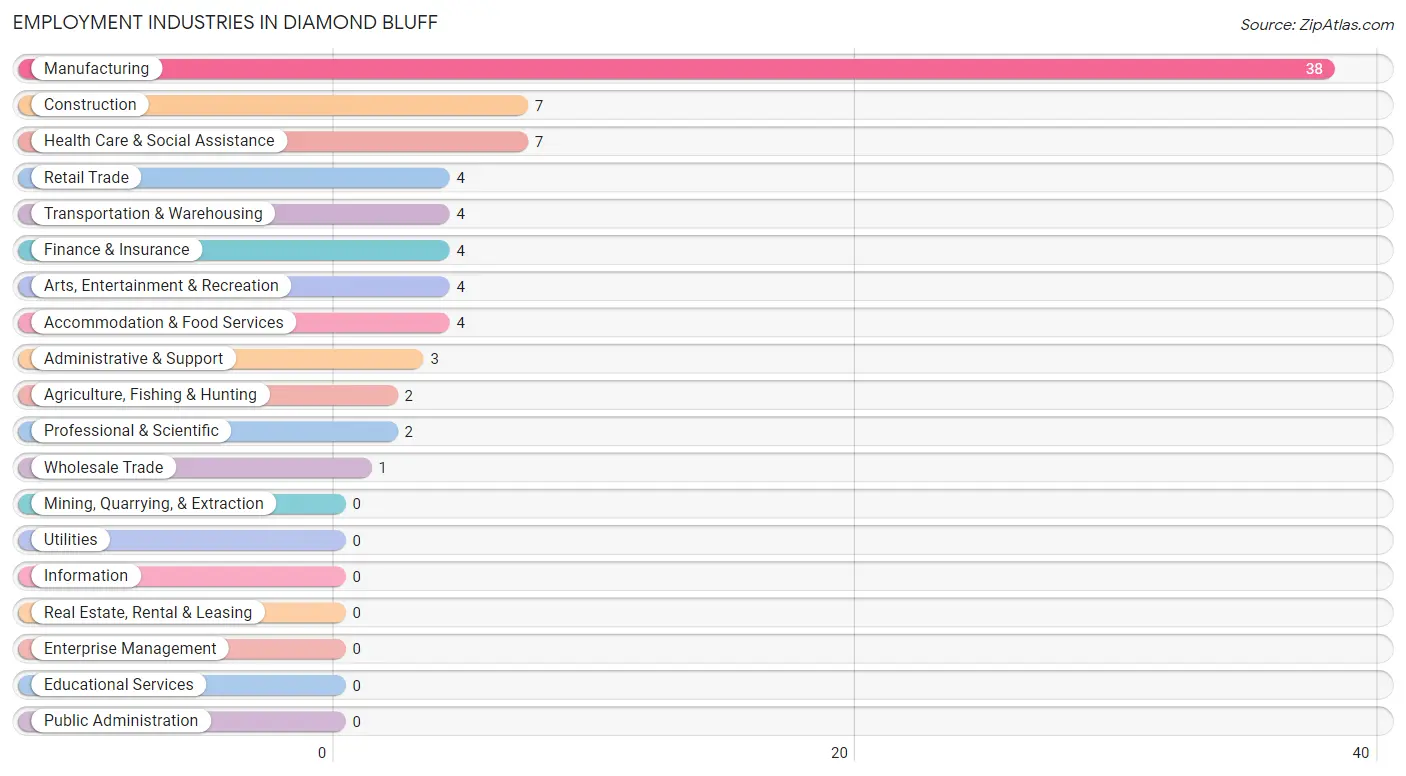
The major employment industries in Diamond Bluff include Manufacturing (38 | 45.8%), Construction (7 | 8.4%), Health Care & Social Assistance (7 | 8.4%), Retail Trade (4 | 4.8%), and Transportation & Warehousing (4 | 4.8%).
Employment Industries by Sex in Diamond Bluff
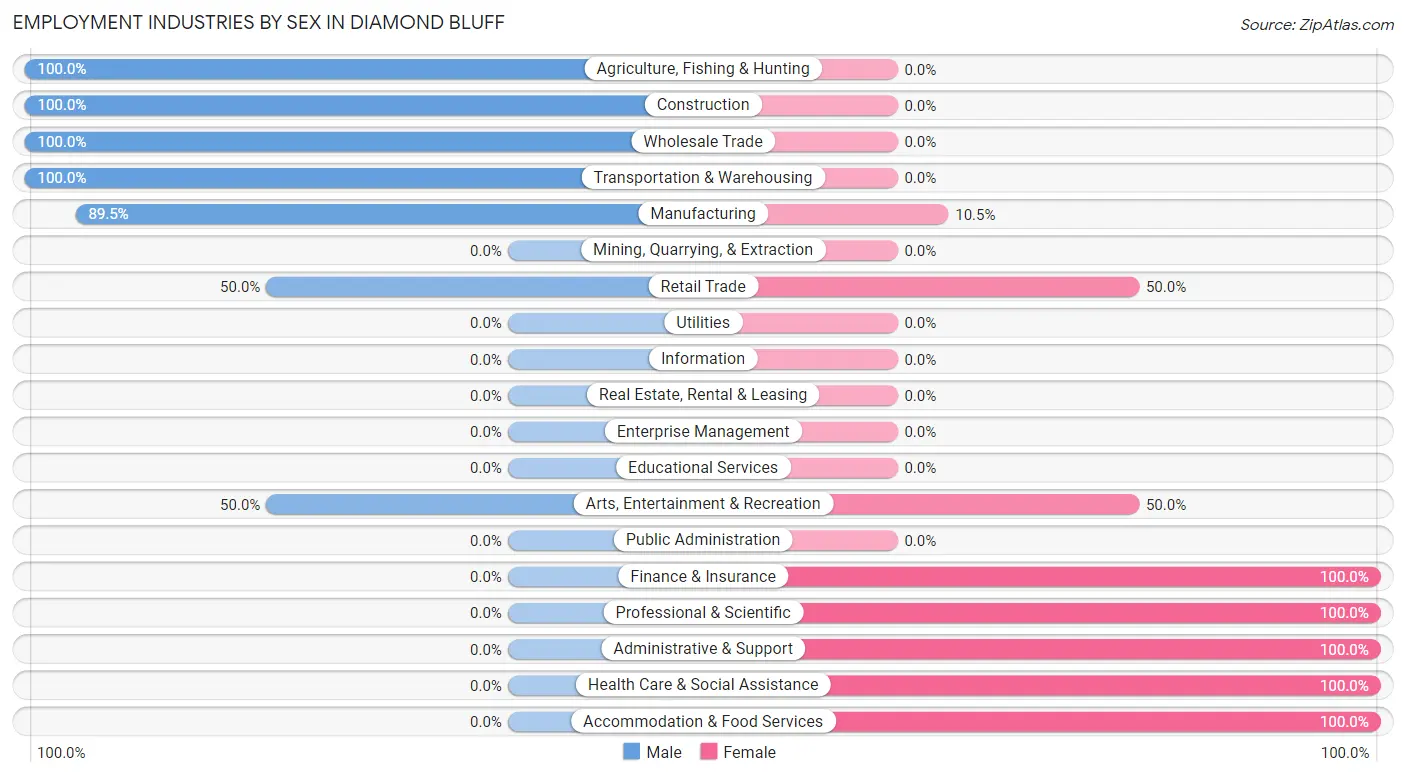
The Diamond Bluff industries that see more men than women are Agriculture, Fishing & Hunting (100.0%), Construction (100.0%), and Wholesale Trade (100.0%), whereas the industries that tend to have a higher number of women are Finance & Insurance (100.0%), Professional & Scientific (100.0%), and Administrative & Support (100.0%).
| Industry | Male | Female |
| Agriculture, Fishing & Hunting | 2 (100.0%) | 0 (0.0%) |
| Mining, Quarrying, & Extraction | 0 (0.0%) | 0 (0.0%) |
| Construction | 7 (100.0%) | 0 (0.0%) |
| Manufacturing | 34 (89.5%) | 4 (10.5%) |
| Wholesale Trade | 1 (100.0%) | 0 (0.0%) |
| Retail Trade | 2 (50.0%) | 2 (50.0%) |
| Transportation & Warehousing | 4 (100.0%) | 0 (0.0%) |
| Utilities | 0 (0.0%) | 0 (0.0%) |
| Information | 0 (0.0%) | 0 (0.0%) |
| Finance & Insurance | 0 (0.0%) | 4 (100.0%) |
| Real Estate, Rental & Leasing | 0 (0.0%) | 0 (0.0%) |
| Professional & Scientific | 0 (0.0%) | 2 (100.0%) |
| Enterprise Management | 0 (0.0%) | 0 (0.0%) |
| Administrative & Support | 0 (0.0%) | 3 (100.0%) |
| Educational Services | 0 (0.0%) | 0 (0.0%) |
| Health Care & Social Assistance | 0 (0.0%) | 7 (100.0%) |
| Arts, Entertainment & Recreation | 2 (50.0%) | 2 (50.0%) |
| Accommodation & Food Services | 0 (0.0%) | 4 (100.0%) |
| Public Administration | 0 (0.0%) | 0 (0.0%) |
| Total | 55 (66.3%) | 28 (33.7%) |
Education in Diamond Bluff
School Enrollment in Diamond Bluff
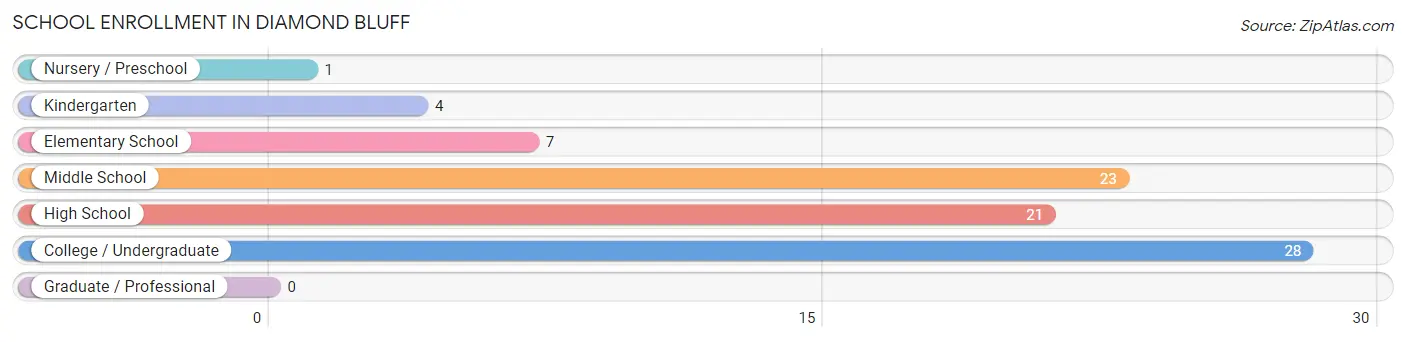
The most common levels of schooling among the 84 students in Diamond Bluff are college / undergraduate (28 | 33.3%), middle school (23 | 27.4%), and high school (21 | 25.0%).
| School Level | # Students | % Students |
| Nursery / Preschool | 1 | 1.2% |
| Kindergarten | 4 | 4.8% |
| Elementary School | 7 | 8.3% |
| Middle School | 23 | 27.4% |
| High School | 21 | 25.0% |
| College / Undergraduate | 28 | 33.3% |
| Graduate / Professional | 0 | 0.0% |
| Total | 84 | 100.0% |
School Enrollment by Age by Funding Source in Diamond Bluff
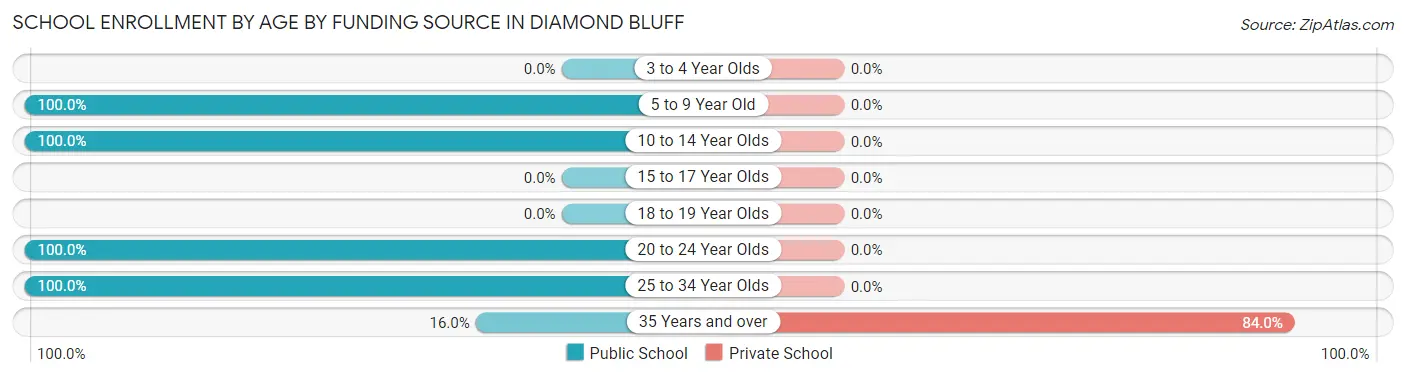
Out of a total of 84 students who are enrolled in schools in Diamond Bluff, 21 (25.0%) attend a private institution, while the remaining 63 (75.0%) are enrolled in public schools. The age group of 35 years and over has the highest likelihood of being enrolled in private schools, with 21 (84.0% in the age bracket) enrolled. Conversely, the age group of 5 to 9 year old has the lowest likelihood of being enrolled in a private school, with 12 (100.0% in the age bracket) attending a public institution.
| Age Bracket | Public School | Private School |
| 3 to 4 Year Olds | 0 (0.0%) | 0 (0.0%) |
| 5 to 9 Year Old | 12 (100.0%) | 0 (0.0%) |
| 10 to 14 Year Olds | 42 (100.0%) | 0 (0.0%) |
| 15 to 17 Year Olds | 0 (0.0%) | 0 (0.0%) |
| 18 to 19 Year Olds | 0 (0.0%) | 0 (0.0%) |
| 20 to 24 Year Olds | 3 (100.0%) | 0 (0.0%) |
| 25 to 34 Year Olds | 2 (100.0%) | 0 (0.0%) |
| 35 Years and over | 4 (16.0%) | 21 (84.0%) |
| Total | 63 (75.0%) | 21 (25.0%) |
Educational Attainment by Field of Study in Diamond Bluff
Science & technology (3 | 21.4%), business (3 | 21.4%), literature & languages (3 | 21.4%), bio, nature & agricultural (2 | 14.3%), and arts & humanities (2 | 14.3%) are the most common fields of study among 14 individuals in Diamond Bluff who have obtained a bachelor's degree or higher.
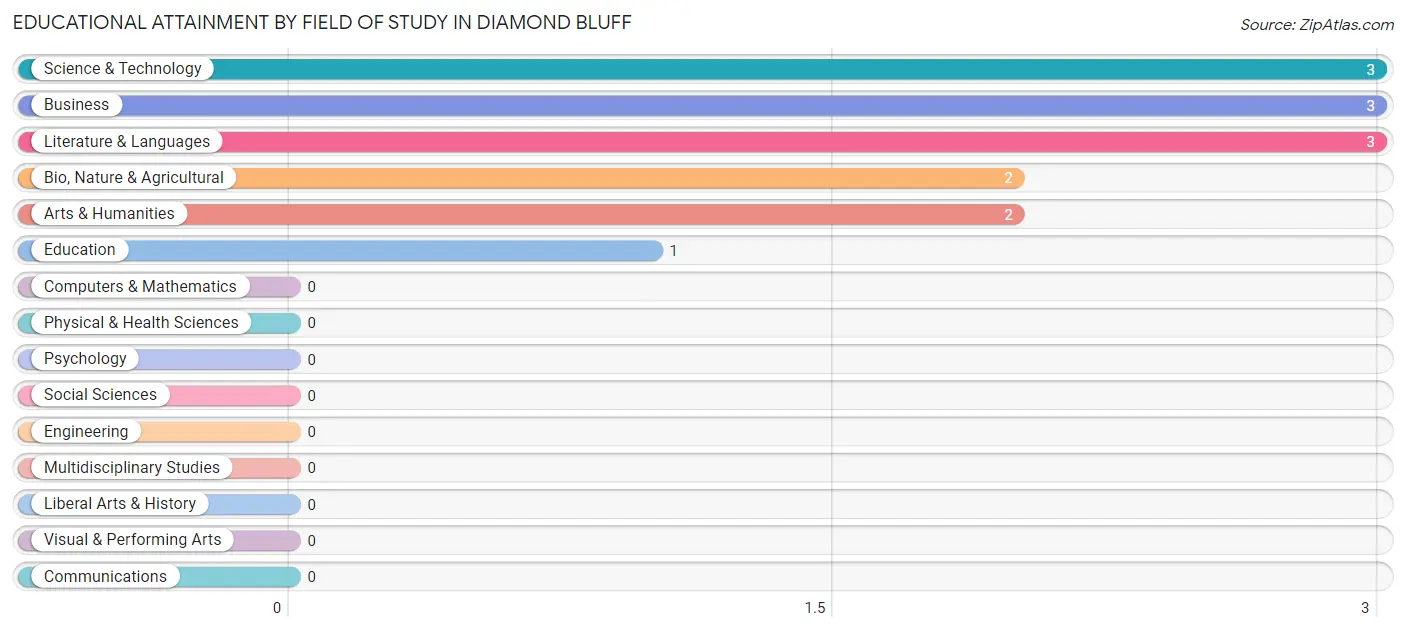
| Field of Study | # Graduates | % Graduates |
| Computers & Mathematics | 0 | 0.0% |
| Bio, Nature & Agricultural | 2 | 14.3% |
| Physical & Health Sciences | 0 | 0.0% |
| Psychology | 0 | 0.0% |
| Social Sciences | 0 | 0.0% |
| Engineering | 0 | 0.0% |
| Multidisciplinary Studies | 0 | 0.0% |
| Science & Technology | 3 | 21.4% |
| Business | 3 | 21.4% |
| Education | 1 | 7.1% |
| Literature & Languages | 3 | 21.4% |
| Liberal Arts & History | 0 | 0.0% |
| Visual & Performing Arts | 0 | 0.0% |
| Communications | 0 | 0.0% |
| Arts & Humanities | 2 | 14.3% |
| Total | 14 | 100.0% |
Transportation & Commute in Diamond Bluff
Vehicle Availability by Sex in Diamond Bluff
The most prevalent vehicle ownership categories in Diamond Bluff are males with 3 vehicles (29, accounting for 52.7%) and females with 3 vehicles (6, making up 111.5%).
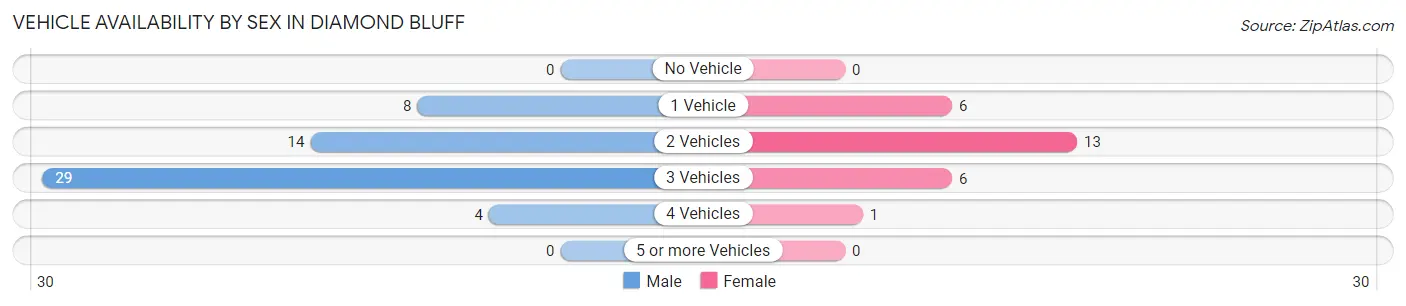
| Vehicles Available | Male | Female |
| No Vehicle | 0 (0.0%) | 0 (0.0%) |
| 1 Vehicle | 8 (14.5%) | 6 (23.1%) |
| 2 Vehicles | 14 (25.5%) | 13 (50.0%) |
| 3 Vehicles | 29 (52.7%) | 6 (23.1%) |
| 4 Vehicles | 4 (7.3%) | 1 (3.8%) |
| 5 or more Vehicles | 0 (0.0%) | 0 (0.0%) |
| Total | 55 (100.0%) | 26 (100.0%) |
Commute Time in Diamond Bluff
The most frequently occuring commute durations in Diamond Bluff are 30 to 34 minutes (37 commuters, 52.9%), 45 to 59 minutes (10 commuters, 14.3%), and 20 to 24 minutes (6 commuters, 8.6%).
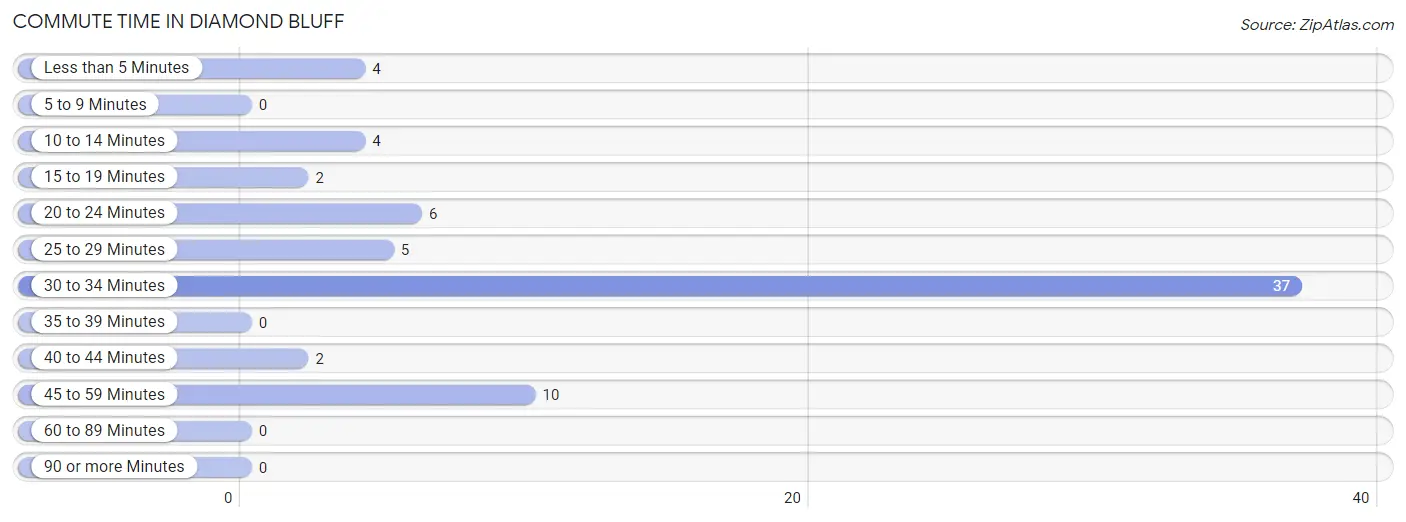
| Commute Time | # Commuters | % Commuters |
| Less than 5 Minutes | 4 | 5.7% |
| 5 to 9 Minutes | 0 | 0.0% |
| 10 to 14 Minutes | 4 | 5.7% |
| 15 to 19 Minutes | 2 | 2.9% |
| 20 to 24 Minutes | 6 | 8.6% |
| 25 to 29 Minutes | 5 | 7.1% |
| 30 to 34 Minutes | 37 | 52.9% |
| 35 to 39 Minutes | 0 | 0.0% |
| 40 to 44 Minutes | 2 | 2.9% |
| 45 to 59 Minutes | 10 | 14.3% |
| 60 to 89 Minutes | 0 | 0.0% |
| 90 or more Minutes | 0 | 0.0% |
Commute Time by Sex in Diamond Bluff
The most common commute times in Diamond Bluff are 30 to 34 minutes (36 commuters, 69.2%) for males and 20 to 24 minutes (6 commuters, 33.3%) for females.
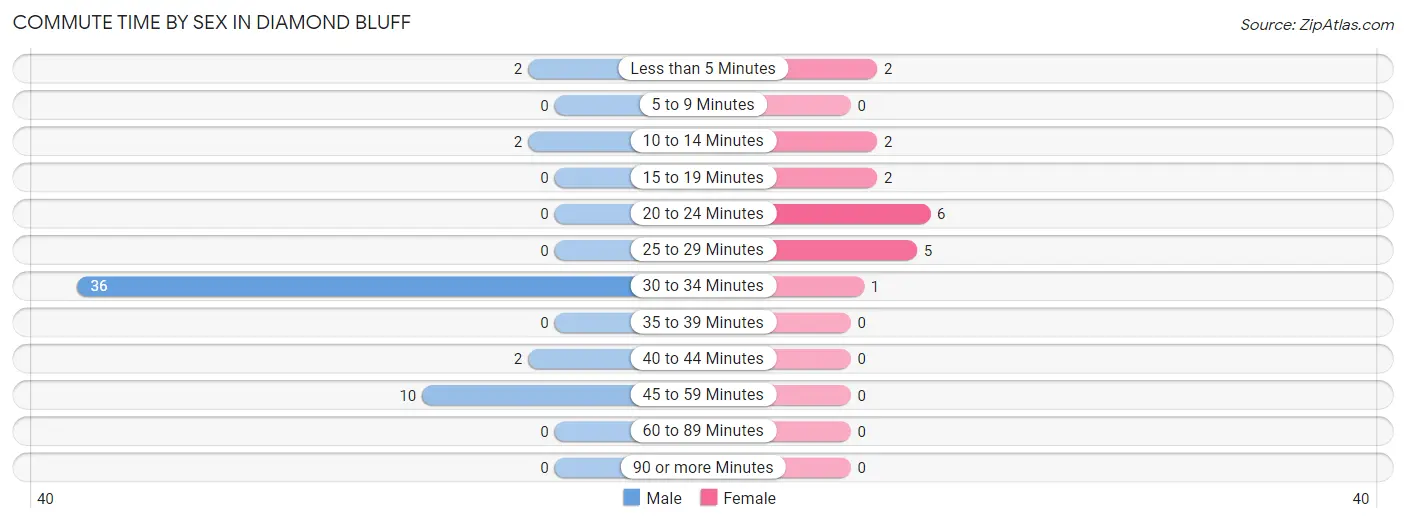
| Commute Time | Male | Female |
| Less than 5 Minutes | 2 (3.8%) | 2 (11.1%) |
| 5 to 9 Minutes | 0 (0.0%) | 0 (0.0%) |
| 10 to 14 Minutes | 2 (3.8%) | 2 (11.1%) |
| 15 to 19 Minutes | 0 (0.0%) | 2 (11.1%) |
| 20 to 24 Minutes | 0 (0.0%) | 6 (33.3%) |
| 25 to 29 Minutes | 0 (0.0%) | 5 (27.8%) |
| 30 to 34 Minutes | 36 (69.2%) | 1 (5.6%) |
| 35 to 39 Minutes | 0 (0.0%) | 0 (0.0%) |
| 40 to 44 Minutes | 2 (3.8%) | 0 (0.0%) |
| 45 to 59 Minutes | 10 (19.2%) | 0 (0.0%) |
| 60 to 89 Minutes | 0 (0.0%) | 0 (0.0%) |
| 90 or more Minutes | 0 (0.0%) | 0 (0.0%) |
Time of Departure to Work by Sex in Diamond Bluff
The most frequent times of departure to work in Diamond Bluff are 6:30 AM to 6:59 AM (23, 44.2%) for males and 4:00 PM to 11:59 PM (5, 27.8%) for females.
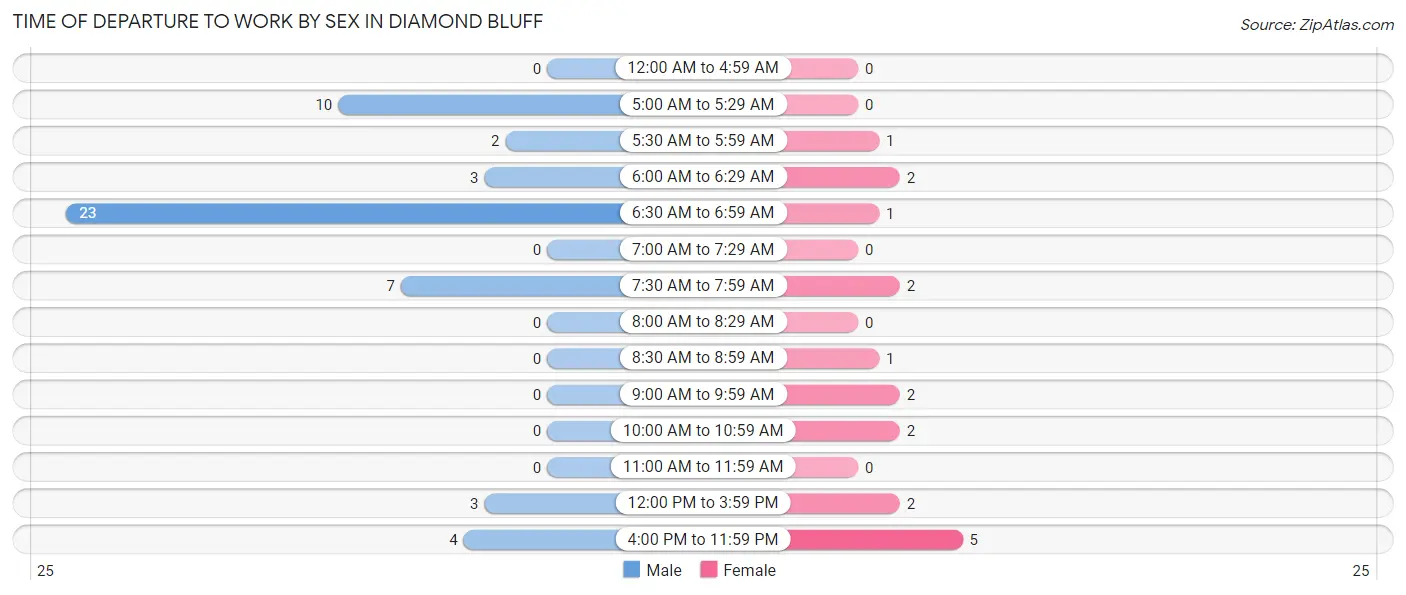
| Time of Departure | Male | Female |
| 12:00 AM to 4:59 AM | 0 (0.0%) | 0 (0.0%) |
| 5:00 AM to 5:29 AM | 10 (19.2%) | 0 (0.0%) |
| 5:30 AM to 5:59 AM | 2 (3.8%) | 1 (5.6%) |
| 6:00 AM to 6:29 AM | 3 (5.8%) | 2 (11.1%) |
| 6:30 AM to 6:59 AM | 23 (44.2%) | 1 (5.6%) |
| 7:00 AM to 7:29 AM | 0 (0.0%) | 0 (0.0%) |
| 7:30 AM to 7:59 AM | 7 (13.5%) | 2 (11.1%) |
| 8:00 AM to 8:29 AM | 0 (0.0%) | 0 (0.0%) |
| 8:30 AM to 8:59 AM | 0 (0.0%) | 1 (5.6%) |
| 9:00 AM to 9:59 AM | 0 (0.0%) | 2 (11.1%) |
| 10:00 AM to 10:59 AM | 0 (0.0%) | 2 (11.1%) |
| 11:00 AM to 11:59 AM | 0 (0.0%) | 0 (0.0%) |
| 12:00 PM to 3:59 PM | 3 (5.8%) | 2 (11.1%) |
| 4:00 PM to 11:59 PM | 4 (7.7%) | 5 (27.8%) |
| Total | 52 (100.0%) | 18 (100.0%) |
Housing Occupancy in Diamond Bluff
Occupancy by Ownership in Diamond Bluff
Of the total 81 dwellings in Diamond Bluff, owner-occupied units account for 79 (97.5%), while renter-occupied units make up 2 (2.5%).
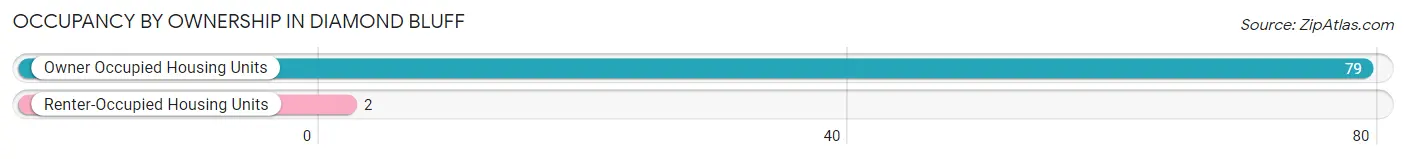
| Occupancy | # Housing Units | % Housing Units |
| Owner Occupied Housing Units | 79 | 97.5% |
| Renter-Occupied Housing Units | 2 | 2.5% |
| Total Occupied Housing Units | 81 | 100.0% |
Occupancy by Household Size in Diamond Bluff
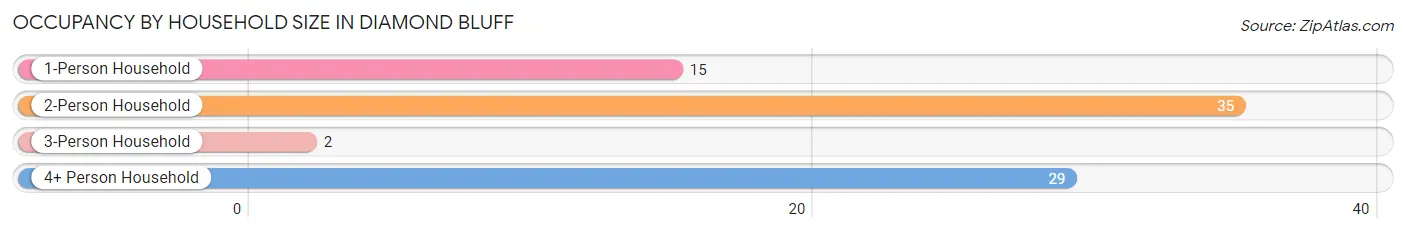
| Household Size | # Housing Units | % Housing Units |
| 1-Person Household | 15 | 18.5% |
| 2-Person Household | 35 | 43.2% |
| 3-Person Household | 2 | 2.5% |
| 4+ Person Household | 29 | 35.8% |
| Total Housing Units | 81 | 100.0% |
Occupancy by Ownership by Household Size in Diamond Bluff
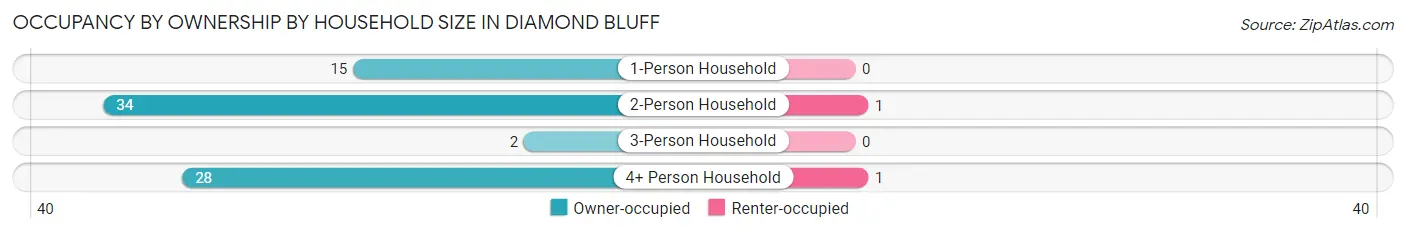
| Household Size | Owner-occupied | Renter-occupied |
| 1-Person Household | 15 (100.0%) | 0 (0.0%) |
| 2-Person Household | 34 (97.1%) | 1 (2.9%) |
| 3-Person Household | 2 (100.0%) | 0 (0.0%) |
| 4+ Person Household | 28 (96.6%) | 1 (3.5%) |
| Total Housing Units | 79 (97.5%) | 2 (2.5%) |
Occupancy by Educational Attainment in Diamond Bluff
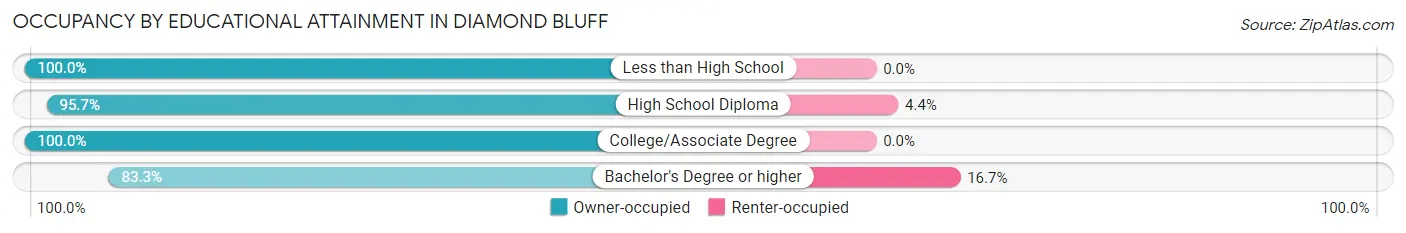
| Household Size | Owner-occupied | Renter-occupied |
| Less than High School | 7 (100.0%) | 0 (0.0%) |
| High School Diploma | 22 (95.7%) | 1 (4.3%) |
| College/Associate Degree | 45 (100.0%) | 0 (0.0%) |
| Bachelor's Degree or higher | 5 (83.3%) | 1 (16.7%) |
Occupancy by Age of Householder in Diamond Bluff
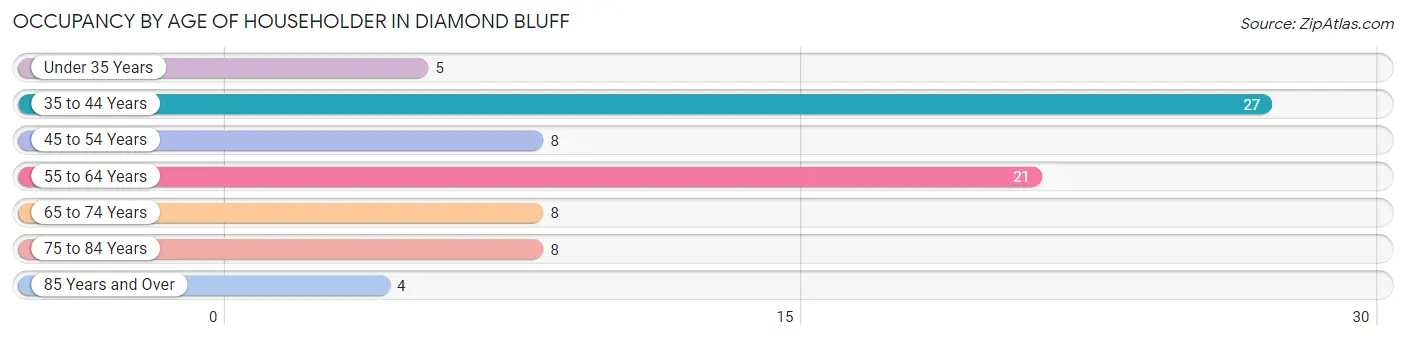
| Age Bracket | # Households | % Households |
| Under 35 Years | 5 | 6.2% |
| 35 to 44 Years | 27 | 33.3% |
| 45 to 54 Years | 8 | 9.9% |
| 55 to 64 Years | 21 | 25.9% |
| 65 to 74 Years | 8 | 9.9% |
| 75 to 84 Years | 8 | 9.9% |
| 85 Years and Over | 4 | 4.9% |
| Total | 81 | 100.0% |
Housing Finances in Diamond Bluff
Median Income by Occupancy in Diamond Bluff
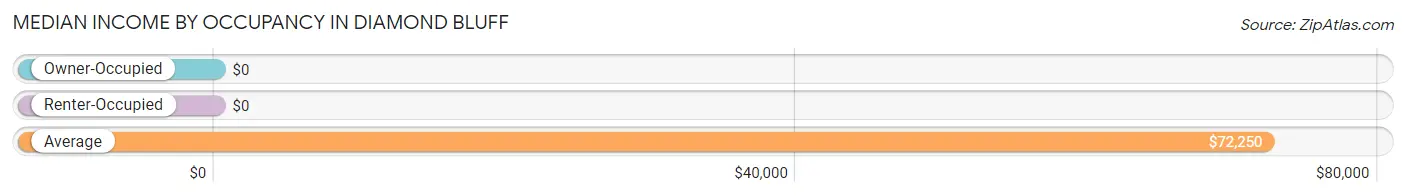
| Occupancy Type | # Households | Median Income |
| Owner-Occupied | 79 (97.5%) | $0 |
| Renter-Occupied | 2 (2.5%) | $0 |
| Average | 81 (100.0%) | $72,250 |
Occupancy by Householder Income Bracket in Diamond Bluff
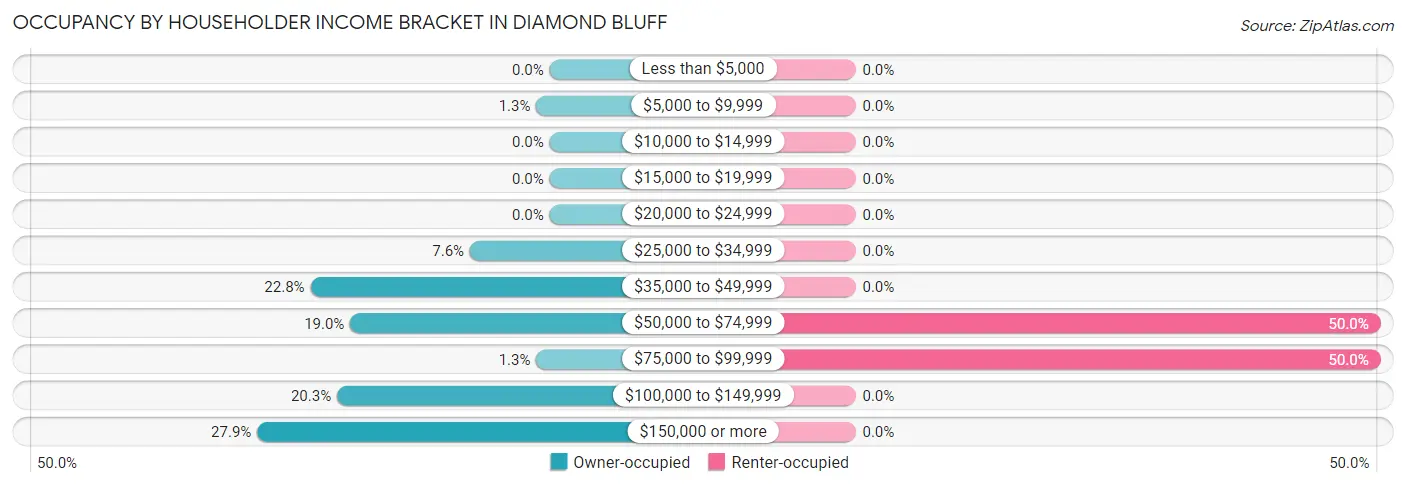
| Income Bracket | Owner-occupied | Renter-occupied |
| Less than $5,000 | 0 (0.0%) | 0 (0.0%) |
| $5,000 to $9,999 | 1 (1.3%) | 0 (0.0%) |
| $10,000 to $14,999 | 0 (0.0%) | 0 (0.0%) |
| $15,000 to $19,999 | 0 (0.0%) | 0 (0.0%) |
| $20,000 to $24,999 | 0 (0.0%) | 0 (0.0%) |
| $25,000 to $34,999 | 6 (7.6%) | 0 (0.0%) |
| $35,000 to $49,999 | 18 (22.8%) | 0 (0.0%) |
| $50,000 to $74,999 | 15 (19.0%) | 1 (50.0%) |
| $75,000 to $99,999 | 1 (1.3%) | 1 (50.0%) |
| $100,000 to $149,999 | 16 (20.3%) | 0 (0.0%) |
| $150,000 or more | 22 (27.9%) | 0 (0.0%) |
| Total | 79 (100.0%) | 2 (100.0%) |
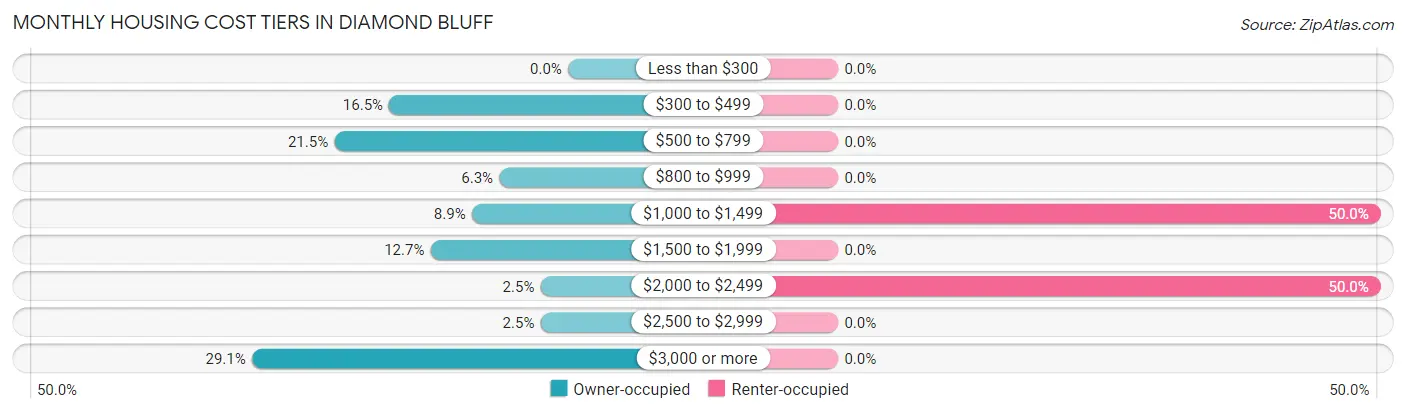
Monthly Housing Cost Tiers in Diamond Bluff
| Monthly Cost | Owner-occupied | Renter-occupied |
| Less than $300 | 0 (0.0%) | 0 (0.0%) |
| $300 to $499 | 13 (16.5%) | 0 (0.0%) |
| $500 to $799 | 17 (21.5%) | 0 (0.0%) |
| $800 to $999 | 5 (6.3%) | 0 (0.0%) |
| $1,000 to $1,499 | 7 (8.9%) | 1 (50.0%) |
| $1,500 to $1,999 | 10 (12.7%) | 0 (0.0%) |
| $2,000 to $2,499 | 2 (2.5%) | 1 (50.0%) |
| $2,500 to $2,999 | 2 (2.5%) | 0 (0.0%) |
| $3,000 or more | 23 (29.1%) | 0 (0.0%) |
| Total | 79 (100.0%) | 2 (100.0%) |
Physical Housing Characteristics in Diamond Bluff
Housing Structures in Diamond Bluff
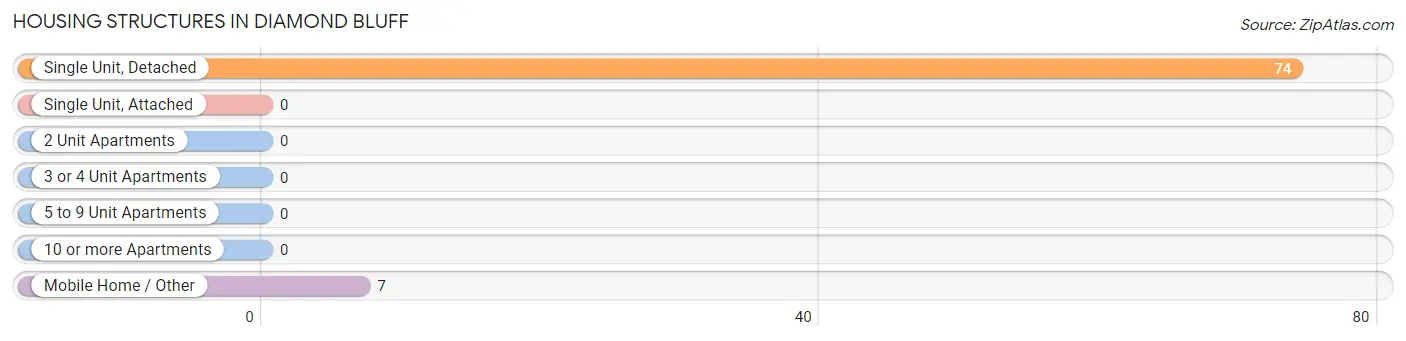
| Structure Type | # Housing Units | % Housing Units |
| Single Unit, Detached | 74 | 91.4% |
| Single Unit, Attached | 0 | 0.0% |
| 2 Unit Apartments | 0 | 0.0% |
| 3 or 4 Unit Apartments | 0 | 0.0% |
| 5 to 9 Unit Apartments | 0 | 0.0% |
| 10 or more Apartments | 0 | 0.0% |
| Mobile Home / Other | 7 | 8.6% |
| Total | 81 | 100.0% |
Housing Structures by Occupancy in Diamond Bluff
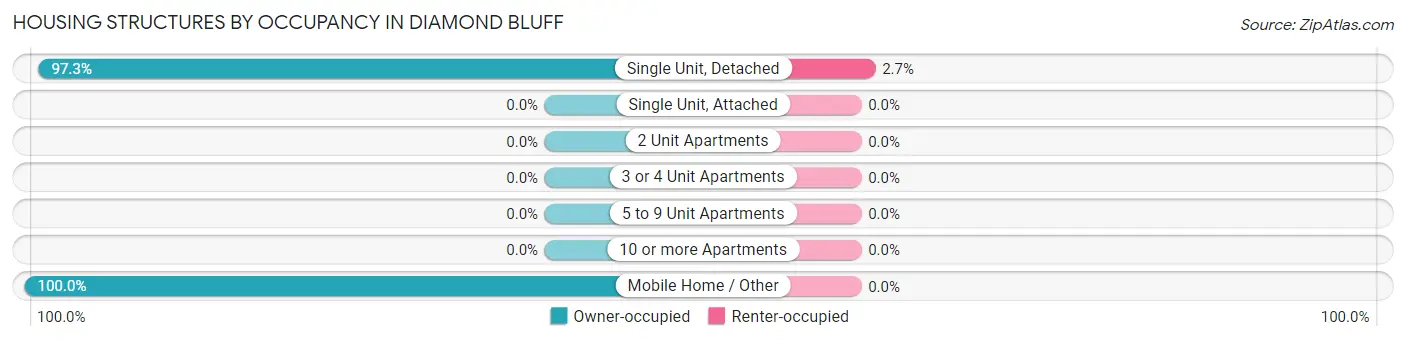
| Structure Type | Owner-occupied | Renter-occupied |
| Single Unit, Detached | 72 (97.3%) | 2 (2.7%) |
| Single Unit, Attached | 0 (0.0%) | 0 (0.0%) |
| 2 Unit Apartments | 0 (0.0%) | 0 (0.0%) |
| 3 or 4 Unit Apartments | 0 (0.0%) | 0 (0.0%) |
| 5 to 9 Unit Apartments | 0 (0.0%) | 0 (0.0%) |
| 10 or more Apartments | 0 (0.0%) | 0 (0.0%) |
| Mobile Home / Other | 7 (100.0%) | 0 (0.0%) |
| Total | 79 (97.5%) | 2 (2.5%) |
Housing Structures by Number of Rooms in Diamond Bluff
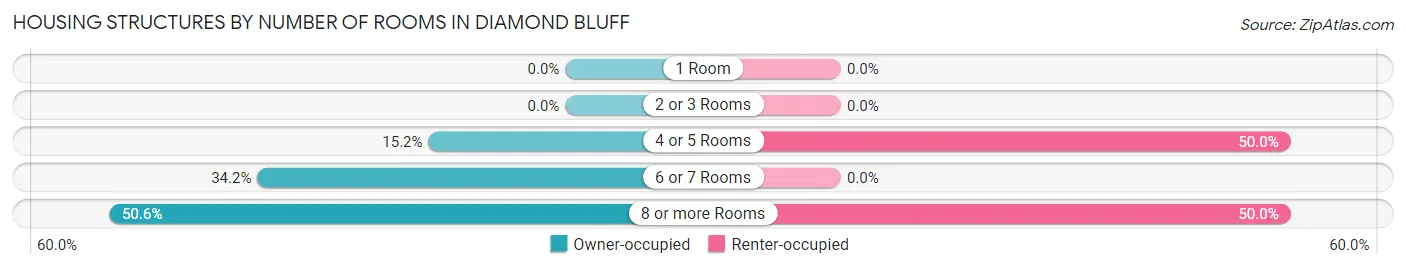
| Number of Rooms | Owner-occupied | Renter-occupied |
| 1 Room | 0 (0.0%) | 0 (0.0%) |
| 2 or 3 Rooms | 0 (0.0%) | 0 (0.0%) |
| 4 or 5 Rooms | 12 (15.2%) | 1 (50.0%) |
| 6 or 7 Rooms | 27 (34.2%) | 0 (0.0%) |
| 8 or more Rooms | 40 (50.6%) | 1 (50.0%) |
| Total | 79 (100.0%) | 2 (100.0%) |
Housing Structure by Heating Type in Diamond Bluff
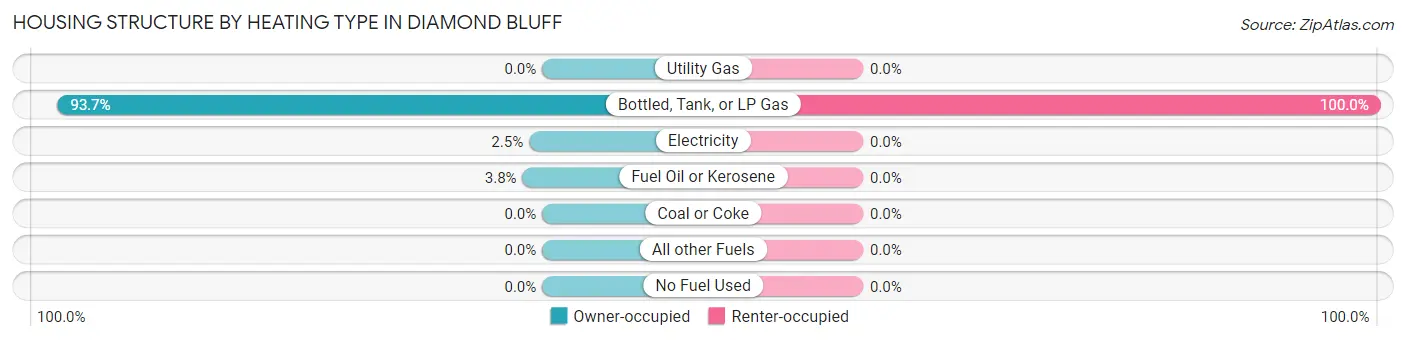
| Heating Type | Owner-occupied | Renter-occupied |
| Utility Gas | 0 (0.0%) | 0 (0.0%) |
| Bottled, Tank, or LP Gas | 74 (93.7%) | 2 (100.0%) |
| Electricity | 2 (2.5%) | 0 (0.0%) |
| Fuel Oil or Kerosene | 3 (3.8%) | 0 (0.0%) |
| Coal or Coke | 0 (0.0%) | 0 (0.0%) |
| All other Fuels | 0 (0.0%) | 0 (0.0%) |
| No Fuel Used | 0 (0.0%) | 0 (0.0%) |
| Total | 79 (100.0%) | 2 (100.0%) |
Household Vehicle Usage in Diamond Bluff
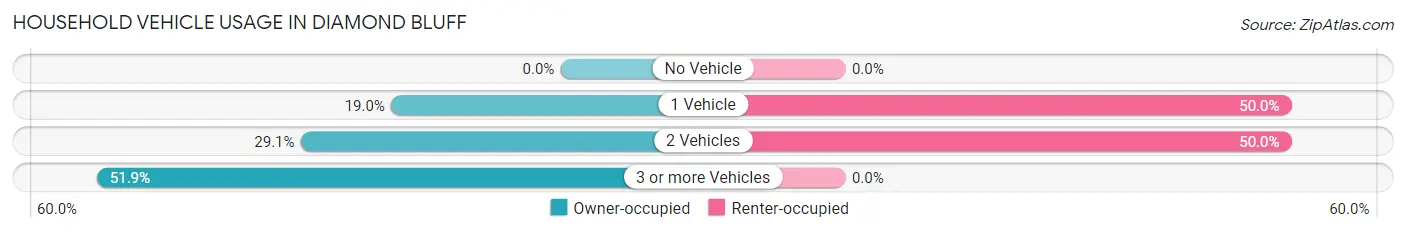
| Vehicles per Household | Owner-occupied | Renter-occupied |
| No Vehicle | 0 (0.0%) | 0 (0.0%) |
| 1 Vehicle | 15 (19.0%) | 1 (50.0%) |
| 2 Vehicles | 23 (29.1%) | 1 (50.0%) |
| 3 or more Vehicles | 41 (51.9%) | 0 (0.0%) |
| Total | 79 (100.0%) | 2 (100.0%) |
Real Estate & Mortgages in Diamond Bluff
Real Estate and Mortgage Overview in Diamond Bluff
| Characteristic | Without Mortgage | With Mortgage |
| Housing Units | 34 | 45 |
| Median Property Value | $175,000 | $0 |
| Median Household Income | $50,000 | $22 |
| Monthly Housing Costs | $617 | $23 |
| Real Estate Taxes | $2,250 | $0 |
Property Value by Mortgage Status in Diamond Bluff
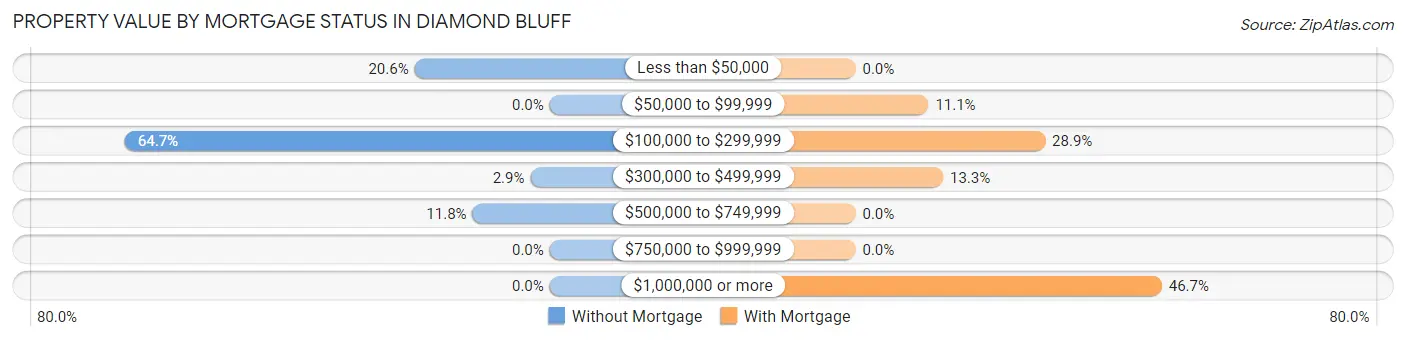
| Property Value | Without Mortgage | With Mortgage |
| Less than $50,000 | 7 (20.6%) | 0 (0.0%) |
| $50,000 to $99,999 | 0 (0.0%) | 5 (11.1%) |
| $100,000 to $299,999 | 22 (64.7%) | 13 (28.9%) |
| $300,000 to $499,999 | 1 (2.9%) | 6 (13.3%) |
| $500,000 to $749,999 | 4 (11.8%) | 0 (0.0%) |
| $750,000 to $999,999 | 0 (0.0%) | 0 (0.0%) |
| $1,000,000 or more | 0 (0.0%) | 21 (46.7%) |
| Total | 34 (100.0%) | 45 (100.0%) |
Household Income by Mortgage Status in Diamond Bluff
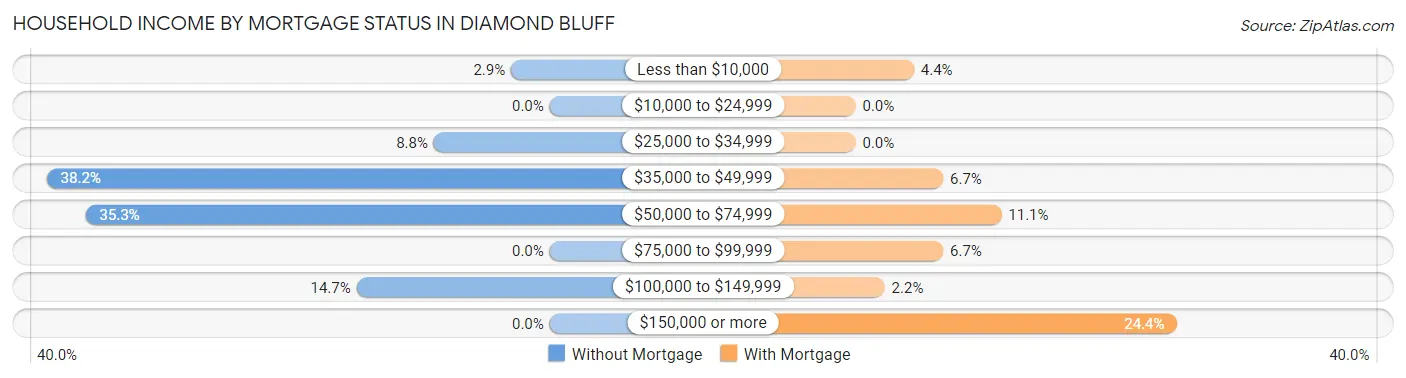
| Household Income | Without Mortgage | With Mortgage |
| Less than $10,000 | 1 (2.9%) | 2 (4.4%) |
| $10,000 to $24,999 | 0 (0.0%) | 0 (0.0%) |
| $25,000 to $34,999 | 3 (8.8%) | 0 (0.0%) |
| $35,000 to $49,999 | 13 (38.2%) | 3 (6.7%) |
| $50,000 to $74,999 | 12 (35.3%) | 5 (11.1%) |
| $75,000 to $99,999 | 0 (0.0%) | 3 (6.7%) |
| $100,000 to $149,999 | 5 (14.7%) | 1 (2.2%) |
| $150,000 or more | 0 (0.0%) | 11 (24.4%) |
| Total | 34 (100.0%) | 45 (100.0%) |
Property Value to Household Income Ratio in Diamond Bluff
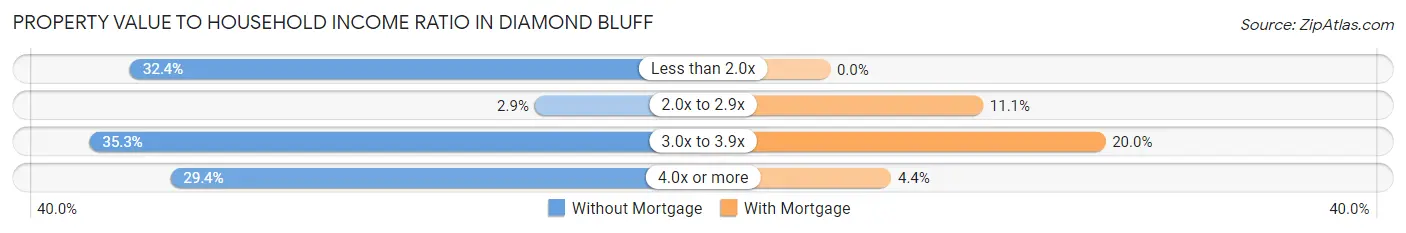
| Value-to-Income Ratio | Without Mortgage | With Mortgage |
| Less than 2.0x | 11 (32.4%) | 0 (0.0%) |
| 2.0x to 2.9x | 1 (2.9%) | 5 (11.1%) |
| 3.0x to 3.9x | 12 (35.3%) | 9 (20.0%) |
| 4.0x or more | 10 (29.4%) | 2 (4.4%) |
| Total | 34 (100.0%) | 45 (100.0%) |
Real Estate Taxes by Mortgage Status in Diamond Bluff
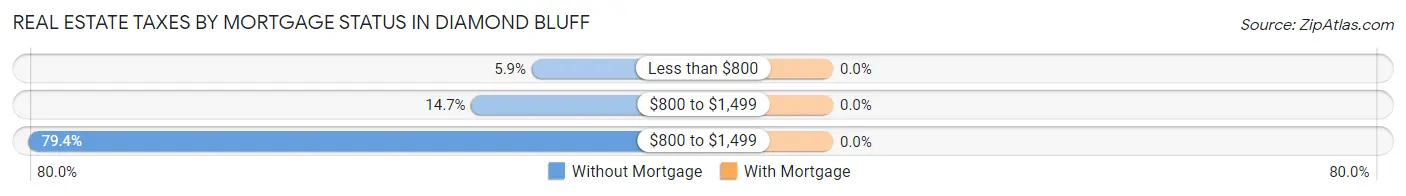
| Property Taxes | Without Mortgage | With Mortgage |
| Less than $800 | 2 (5.9%) | 0 (0.0%) |
| $800 to $1,499 | 5 (14.7%) | 0 (0.0%) |
| $800 to $1,499 | 27 (79.4%) | 0 (0.0%) |
| Total | 34 (100.0%) | 45 (100.0%) |
Health & Disability in Diamond Bluff
Health Insurance Coverage by Age in Diamond Bluff
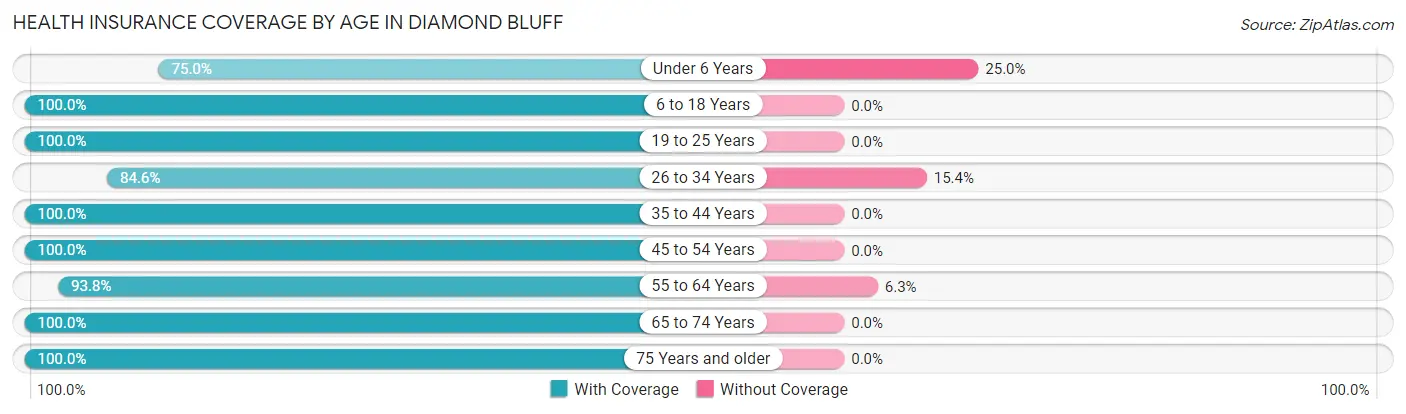
| Age Bracket | With Coverage | Without Coverage |
| Under 6 Years | 3 (75.0%) | 1 (25.0%) |
| 6 to 18 Years | 51 (100.0%) | 0 (0.0%) |
| 19 to 25 Years | 3 (100.0%) | 0 (0.0%) |
| 26 to 34 Years | 11 (84.6%) | 2 (15.4%) |
| 35 to 44 Years | 49 (100.0%) | 0 (0.0%) |
| 45 to 54 Years | 22 (100.0%) | 0 (0.0%) |
| 55 to 64 Years | 30 (93.8%) | 2 (6.2%) |
| 65 to 74 Years | 18 (100.0%) | 0 (0.0%) |
| 75 Years and older | 17 (100.0%) | 0 (0.0%) |
| Total | 204 (97.6%) | 5 (2.4%) |
Health Insurance Coverage by Citizenship Status in Diamond Bluff
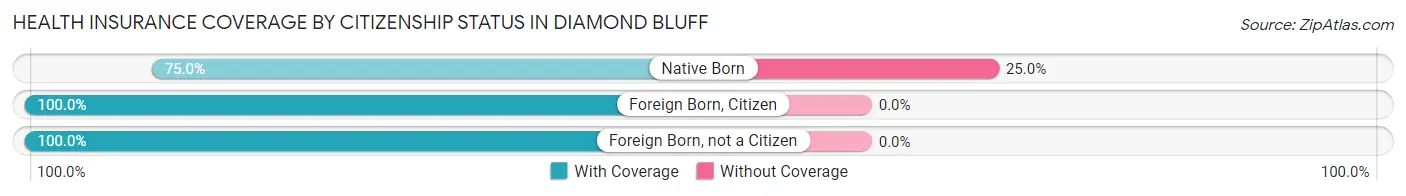
| Citizenship Status | With Coverage | Without Coverage |
| Native Born | 3 (75.0%) | 1 (25.0%) |
| Foreign Born, Citizen | 51 (100.0%) | 0 (0.0%) |
| Foreign Born, not a Citizen | 3 (100.0%) | 0 (0.0%) |
Health Insurance Coverage by Household Income in Diamond Bluff
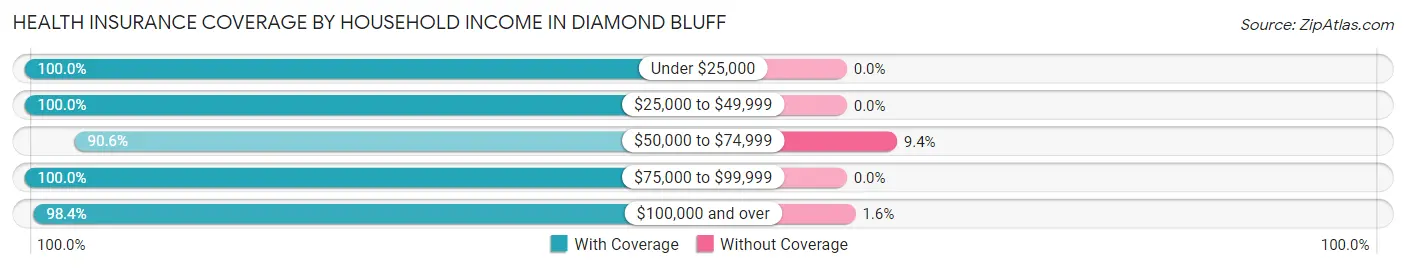
| Household Income | With Coverage | Without Coverage |
| Under $25,000 | 8 (100.0%) | 0 (0.0%) |
| $25,000 to $49,999 | 37 (100.0%) | 0 (0.0%) |
| $50,000 to $74,999 | 29 (90.6%) | 3 (9.4%) |
| $75,000 to $99,999 | 9 (100.0%) | 0 (0.0%) |
| $100,000 and over | 121 (98.4%) | 2 (1.6%) |
Public vs Private Health Insurance Coverage by Age in Diamond Bluff
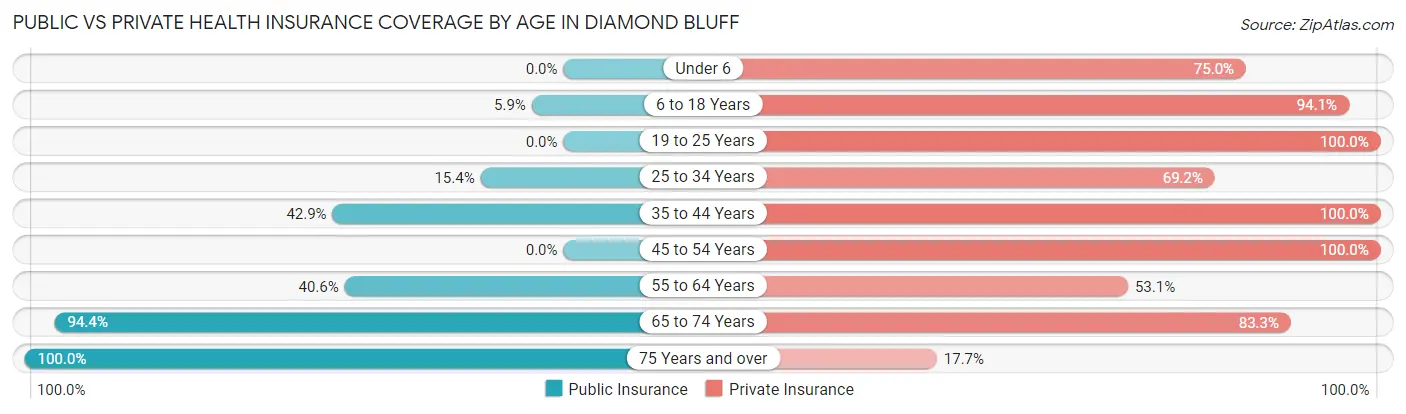
| Age Bracket | Public Insurance | Private Insurance |
| Under 6 | 0 (0.0%) | 3 (75.0%) |
| 6 to 18 Years | 3 (5.9%) | 48 (94.1%) |
| 19 to 25 Years | 0 (0.0%) | 3 (100.0%) |
| 25 to 34 Years | 2 (15.4%) | 9 (69.2%) |
| 35 to 44 Years | 21 (42.9%) | 49 (100.0%) |
| 45 to 54 Years | 0 (0.0%) | 22 (100.0%) |
| 55 to 64 Years | 13 (40.6%) | 17 (53.1%) |
| 65 to 74 Years | 17 (94.4%) | 15 (83.3%) |
| 75 Years and over | 17 (100.0%) | 3 (17.6%) |
| Total | 73 (34.9%) | 169 (80.9%) |
Disability Status by Sex by Age in Diamond Bluff
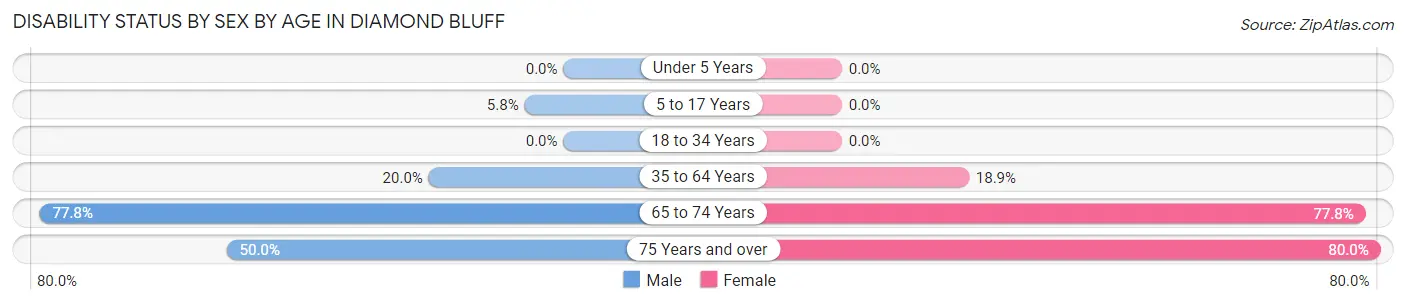
| Age Bracket | Male | Female |
| Under 5 Years | 0 (0.0%) | 0 (0.0%) |
| 5 to 17 Years | 3 (5.8%) | 0 (0.0%) |
| 18 to 34 Years | 0 (0.0%) | 0 (0.0%) |
| 35 to 64 Years | 10 (20.0%) | 10 (18.9%) |
| 65 to 74 Years | 7 (77.8%) | 7 (77.8%) |
| 75 Years and over | 6 (50.0%) | 4 (80.0%) |
Disability Class by Sex by Age in Diamond Bluff
Disability Class: Hearing Difficulty
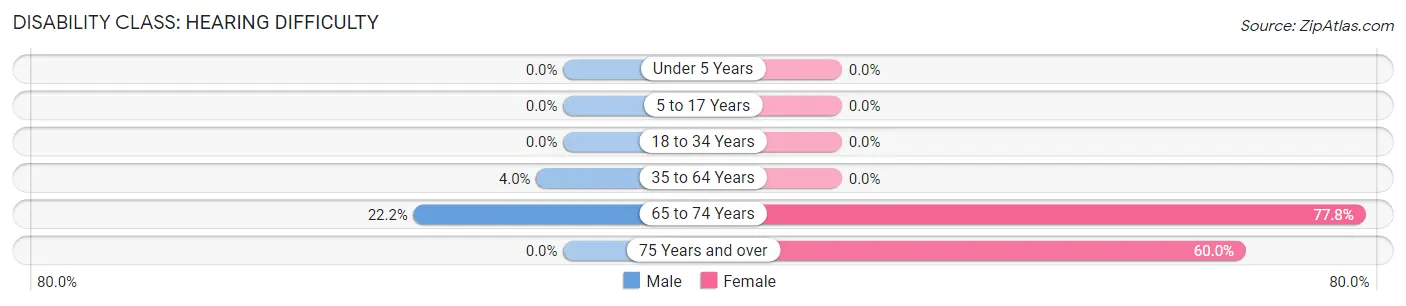
| Age Bracket | Male | Female |
| Under 5 Years | 0 (0.0%) | 0 (0.0%) |
| 5 to 17 Years | 0 (0.0%) | 0 (0.0%) |
| 18 to 34 Years | 0 (0.0%) | 0 (0.0%) |
| 35 to 64 Years | 2 (4.0%) | 0 (0.0%) |
| 65 to 74 Years | 2 (22.2%) | 7 (77.8%) |
| 75 Years and over | 0 (0.0%) | 3 (60.0%) |
Disability Class: Vision Difficulty
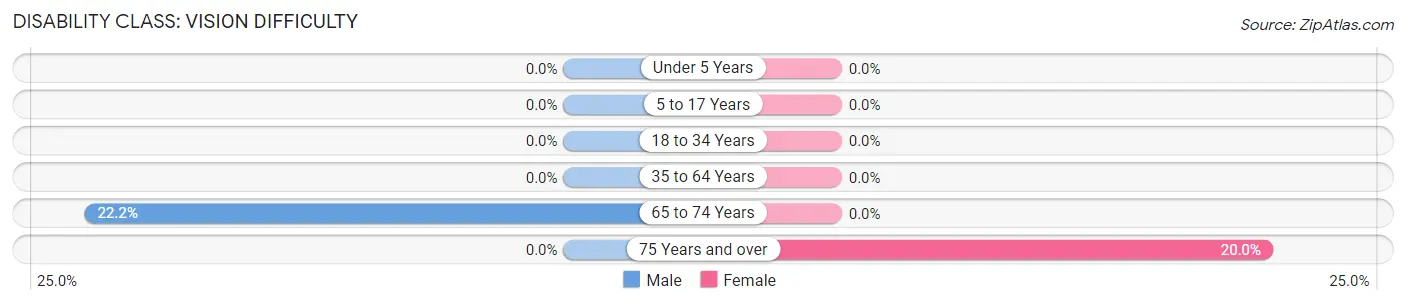
| Age Bracket | Male | Female |
| Under 5 Years | 0 (0.0%) | 0 (0.0%) |
| 5 to 17 Years | 0 (0.0%) | 0 (0.0%) |
| 18 to 34 Years | 0 (0.0%) | 0 (0.0%) |
| 35 to 64 Years | 0 (0.0%) | 0 (0.0%) |
| 65 to 74 Years | 2 (22.2%) | 0 (0.0%) |
| 75 Years and over | 0 (0.0%) | 1 (20.0%) |
Disability Class: Cognitive Difficulty
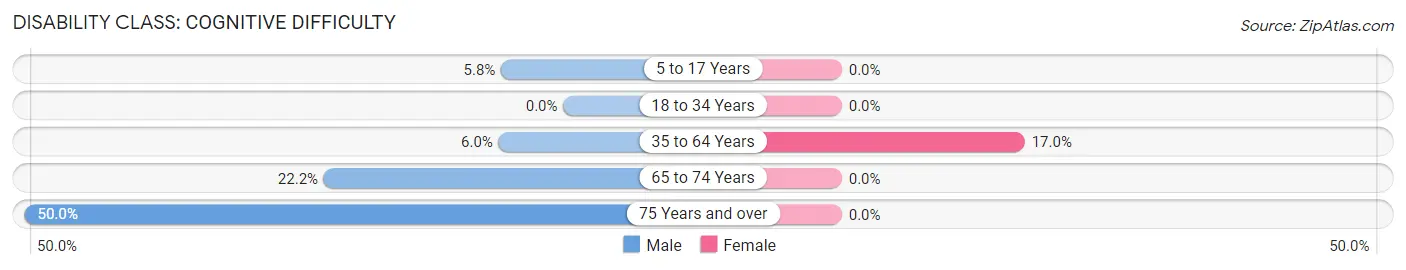
| Age Bracket | Male | Female |
| 5 to 17 Years | 3 (5.8%) | 0 (0.0%) |
| 18 to 34 Years | 0 (0.0%) | 0 (0.0%) |
| 35 to 64 Years | 3 (6.0%) | 9 (17.0%) |
| 65 to 74 Years | 2 (22.2%) | 0 (0.0%) |
| 75 Years and over | 6 (50.0%) | 0 (0.0%) |
Disability Class: Ambulatory Difficulty
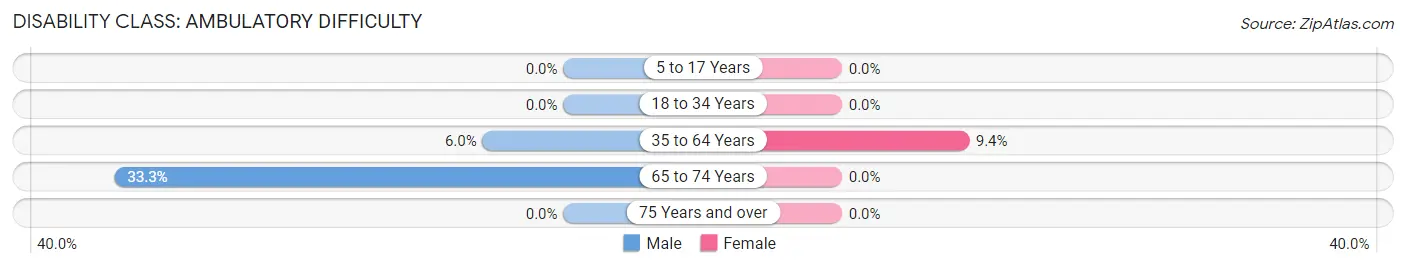
| Age Bracket | Male | Female |
| 5 to 17 Years | 0 (0.0%) | 0 (0.0%) |
| 18 to 34 Years | 0 (0.0%) | 0 (0.0%) |
| 35 to 64 Years | 3 (6.0%) | 5 (9.4%) |
| 65 to 74 Years | 3 (33.3%) | 0 (0.0%) |
| 75 Years and over | 0 (0.0%) | 0 (0.0%) |
Disability Class: Self-Care Difficulty
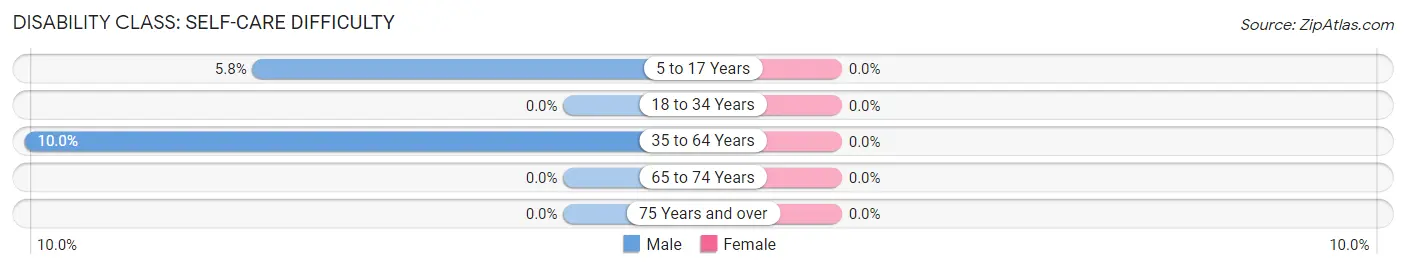
| Age Bracket | Male | Female |
| 5 to 17 Years | 3 (5.8%) | 0 (0.0%) |
| 18 to 34 Years | 0 (0.0%) | 0 (0.0%) |
| 35 to 64 Years | 5 (10.0%) | 0 (0.0%) |
| 65 to 74 Years | 0 (0.0%) | 0 (0.0%) |
| 75 Years and over | 0 (0.0%) | 0 (0.0%) |
Technology Access in Diamond Bluff
Computing Device Access in Diamond Bluff
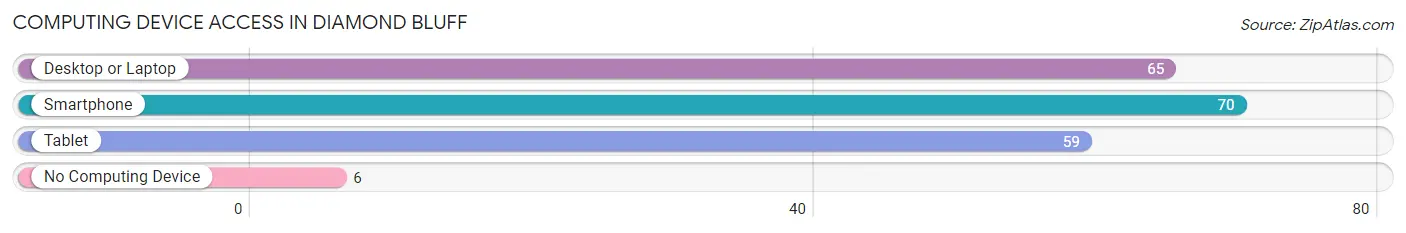
| Device Type | # Households | % Households |
| Desktop or Laptop | 65 | 80.2% |
| Smartphone | 70 | 86.4% |
| Tablet | 59 | 72.8% |
| No Computing Device | 6 | 7.4% |
| Total | 81 | 100.0% |
Internet Access in Diamond Bluff
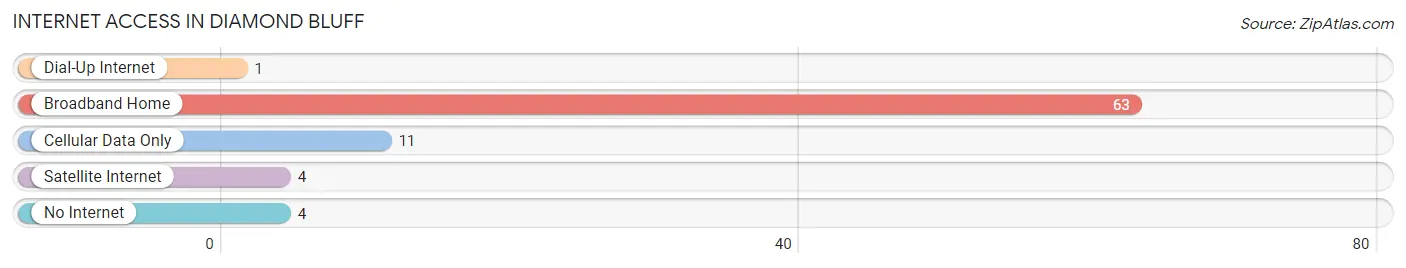
| Internet Type | # Households | % Households |
| Dial-Up Internet | 1 | 1.2% |
| Broadband Home | 63 | 77.8% |
| Cellular Data Only | 11 | 13.6% |
| Satellite Internet | 4 | 4.9% |
| No Internet | 4 | 4.9% |
| Total | 81 | 100.0% |
Diamond Bluff Summary
Diamond Bluff is a small unincorporated community located in the town of Trenton in Pierce County, Wisconsin, United States. It is situated on the banks of the Mississippi River, just south of the city of Prescott. The population of Diamond Bluff was estimated to be around 200 people in 2000.
History
Diamond Bluff was first settled in the early 1800s by French-Canadian fur traders. The area was known as “Diamond Bluff” due to the presence of quartz crystals in the area. The first permanent settlers arrived in the area in the 1840s and the community was officially established in 1848.
The town was named after the quartz crystals found in the area, which were said to resemble diamonds. The town was also known for its abundance of wild game, which attracted hunters from all over the region.
In the late 1800s, Diamond Bluff became a popular tourist destination due to its scenic beauty and abundance of outdoor activities. The town was also known for its excellent fishing and hunting opportunities.
In the early 1900s, Diamond Bluff was home to a number of resorts and hotels, which attracted visitors from all over the Midwest. The town was also home to a number of small businesses, including a general store, a blacksmith, and a sawmill.
Geography
Diamond Bluff is located in the town of Trenton in Pierce County, Wisconsin. It is situated on the banks of the Mississippi River, just south of the city of Prescott. The town is located in a rural area and is surrounded by rolling hills and forests.
The climate in Diamond Bluff is typical of the Midwest, with hot summers and cold winters. The average temperature in the summer is around 75 degrees Fahrenheit, while the average temperature in the winter is around 25 degrees Fahrenheit.
Economy
The economy of Diamond Bluff is largely based on tourism and outdoor recreation. The town is home to a number of resorts and hotels, which attract visitors from all over the Midwest. The town is also home to a number of small businesses, including a general store, a blacksmith, and a sawmill.
The town is also home to a number of farms, which produce a variety of crops, including corn, soybeans, and hay. The town is also home to a number of wineries, which produce a variety of wines.
Demographics
The population of Diamond Bluff was estimated to be around 200 people in 2000. The town is predominantly white, with a small minority population. The median household income in the town is around $40,000. The town has a high rate of homeownership, with around 80% of the population owning their own homes.
Conclusion
Diamond Bluff is a small unincorporated community located in the town of Trenton in Pierce County, Wisconsin. It is situated on the banks of the Mississippi River, just south of the city of Prescott. The population of Diamond Bluff was estimated to be around 200 people in 2000. The town is predominantly white, with a small minority population. The economy of Diamond Bluff is largely based on tourism and outdoor recreation. The town is home to a number of resorts and hotels, which attract visitors from all over the Midwest. The town is also home to a number of small businesses, including a general store, a blacksmith, and a sawmill. The town is also home to a number of farms, which produce a variety of crops, including corn, soybeans, and hay. The town is also home to a number of wineries, which produce a variety of wines.
Common Questions
What is Per Capita Income in Diamond Bluff?
Per Capita income in Diamond Bluff is $40,891.
What is the Median Family Income in Diamond Bluff?
Median Family Income in Diamond Bluff is $112,917.
What is the Median Household income in Diamond Bluff?
Median Household Income in Diamond Bluff is $72,250.
What is Income or Wage Gap in Diamond Bluff?
Income or Wage Gap in Diamond Bluff is 64.8%.
Women in Diamond Bluff earn 35.2 cents for every dollar earned by a man.
What is Inequality or Gini Index in Diamond Bluff?
Inequality or Gini Index in Diamond Bluff is 0.34.
What is the Total Population of Diamond Bluff?
Total Population of Diamond Bluff is 209.
What is the Total Male Population of Diamond Bluff?
Total Male Population of Diamond Bluff is 133.
What is the Total Female Population of Diamond Bluff?
Total Female Population of Diamond Bluff is 76.
What is the Ratio of Males per 100 Females in Diamond Bluff?
There are 175.00 Males per 100 Females in Diamond Bluff.
What is the Ratio of Females per 100 Males in Diamond Bluff?
There are 57.14 Females per 100 Males in Diamond Bluff.
What is the Median Population Age in Diamond Bluff?
Median Population Age in Diamond Bluff is 44.4 Years.
What is the Average Family Size in Diamond Bluff
Average Family Size in Diamond Bluff is 3.0 People.
What is the Average Household Size in Diamond Bluff
Average Household Size in Diamond Bluff is 2.6 People.
How Large is the Labor Force in Diamond Bluff?
There are 103 People in the Labor Forcein in Diamond Bluff.
What is the Percentage of People in the Labor Force in Diamond Bluff?
66.9% of People are in the Labor Force in Diamond Bluff.
What is the Unemployment Rate in Diamond Bluff?
Unemployment Rate in Diamond Bluff is 19.4%.