Clear Lake, WI Map & Demographics
Clear Lake Map
Clear Lake Overview
$31,838
PER CAPITA INCOME
$79,438
AVG FAMILY INCOME
$71,705
AVG HOUSEHOLD INCOME
29.8%
WAGE / INCOME GAP [ % ]
70.2¢/ $1
WAGE / INCOME GAP [ $ ]
0.36
INEQUALITY / GINI INDEX
1,048
TOTAL POPULATION
545
MALE POPULATION
503
FEMALE POPULATION
108.35
MALES / 100 FEMALES
92.29
FEMALES / 100 MALES
38.6
MEDIAN AGE
3.1
AVG FAMILY SIZE
2.4
AVG HOUSEHOLD SIZE
514
LABOR FORCE [ PEOPLE ]
64.5%
PERCENT IN LABOR FORCE
3.9%
UNEMPLOYMENT RATE
Clear Lake Zip Codes
Clear Lake Area Codes
Income in Clear Lake
Income Overview in Clear Lake
Per Capita Income in Clear Lake is $31,838, while median incomes of families and households are $79,438 and $71,705 respectively.
| Characteristic | Number | Measure |
| Per Capita Income | 1,048 | $31,838 |
| Median Family Income | 253 | $79,438 |
| Mean Family Income | 253 | $95,723 |
| Median Household Income | 437 | $71,705 |
| Mean Household Income | 437 | $78,181 |
| Income Deficit | 253 | $0 |
| Wage / Income Gap (%) | 1,048 | 29.85% |
| Wage / Income Gap ($) | 1,048 | 70.15¢ per $1 |
| Gini / Inequality Index | 1,048 | 0.36 |
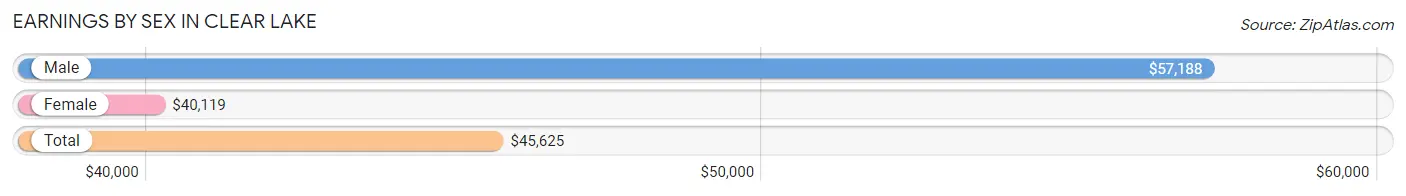
Earnings by Sex in Clear Lake
Average Earnings in Clear Lake are $45,625, $57,188 for men and $40,119 for women, a difference of 29.8%.
| Sex | Number | Average Earnings |
| Male | 275 (52.4%) | $57,188 |
| Female | 250 (47.6%) | $40,119 |
| Total | 525 (100.0%) | $45,625 |
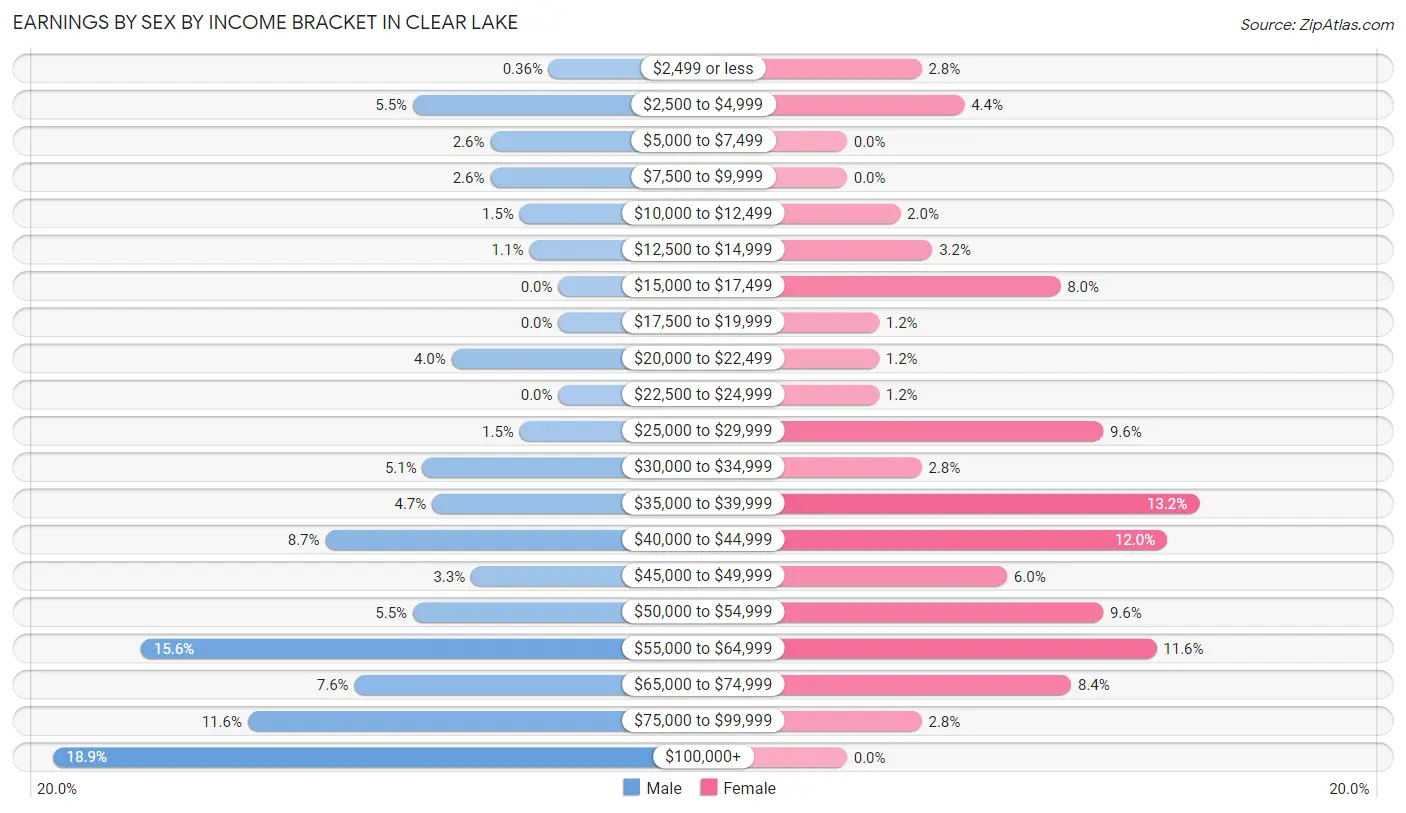
Earnings by Sex by Income Bracket in Clear Lake
The most common earnings brackets in Clear Lake are $100,000+ for men (52 | 18.9%) and $35,000 to $39,999 for women (33 | 13.2%).
| Income | Male | Female |
| $2,499 or less | 1 (0.4%) | 7 (2.8%) |
| $2,500 to $4,999 | 15 (5.4%) | 11 (4.4%) |
| $5,000 to $7,499 | 7 (2.5%) | 0 (0.0%) |
| $7,500 to $9,999 | 7 (2.5%) | 0 (0.0%) |
| $10,000 to $12,499 | 4 (1.5%) | 5 (2.0%) |
| $12,500 to $14,999 | 3 (1.1%) | 8 (3.2%) |
| $15,000 to $17,499 | 0 (0.0%) | 20 (8.0%) |
| $17,500 to $19,999 | 0 (0.0%) | 3 (1.2%) |
| $20,000 to $22,499 | 11 (4.0%) | 3 (1.2%) |
| $22,500 to $24,999 | 0 (0.0%) | 3 (1.2%) |
| $25,000 to $29,999 | 4 (1.5%) | 24 (9.6%) |
| $30,000 to $34,999 | 14 (5.1%) | 7 (2.8%) |
| $35,000 to $39,999 | 13 (4.7%) | 33 (13.2%) |
| $40,000 to $44,999 | 24 (8.7%) | 30 (12.0%) |
| $45,000 to $49,999 | 9 (3.3%) | 15 (6.0%) |
| $50,000 to $54,999 | 15 (5.4%) | 24 (9.6%) |
| $55,000 to $64,999 | 43 (15.6%) | 29 (11.6%) |
| $65,000 to $74,999 | 21 (7.6%) | 21 (8.4%) |
| $75,000 to $99,999 | 32 (11.6%) | 7 (2.8%) |
| $100,000+ | 52 (18.9%) | 0 (0.0%) |
| Total | 275 (100.0%) | 250 (100.0%) |
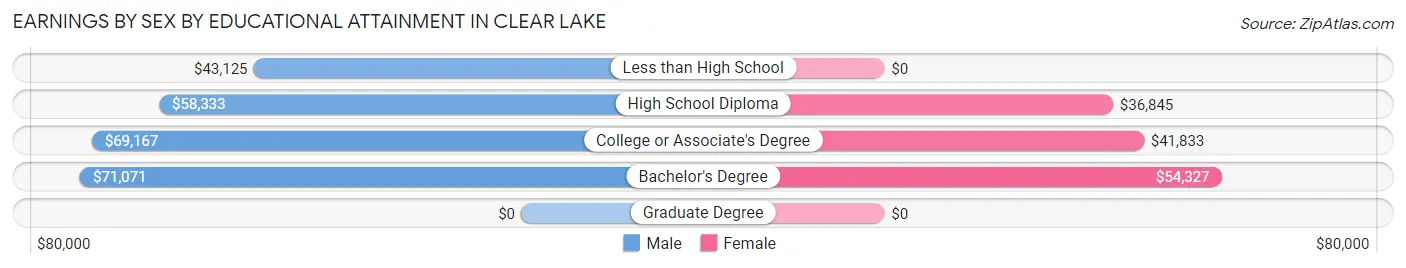
Earnings by Sex by Educational Attainment in Clear Lake
Average earnings in Clear Lake are $59,286 for men and $42,083 for women, a difference of 29.0%. Men with an educational attainment of bachelor's degree enjoy the highest average annual earnings of $71,071, while those with less than high school education earn the least with $43,125. Women with an educational attainment of bachelor's degree earn the most with the average annual earnings of $54,327, while those with high school diploma education have the smallest earnings of $36,845.
| Educational Attainment | Male Income | Female Income |
| Less than High School | $43,125 | $0 |
| High School Diploma | $58,333 | $36,845 |
| College or Associate's Degree | $69,167 | $41,833 |
| Bachelor's Degree | $71,071 | $54,327 |
| Graduate Degree | - | - |
| Total | $59,286 | $42,083 |
Family Income in Clear Lake
Family Income Brackets in Clear Lake
According to the Clear Lake family income data, there are 61 families falling into the $50,000 to $74,999 income range, which is the most common income bracket and makes up 24.1% of all families.
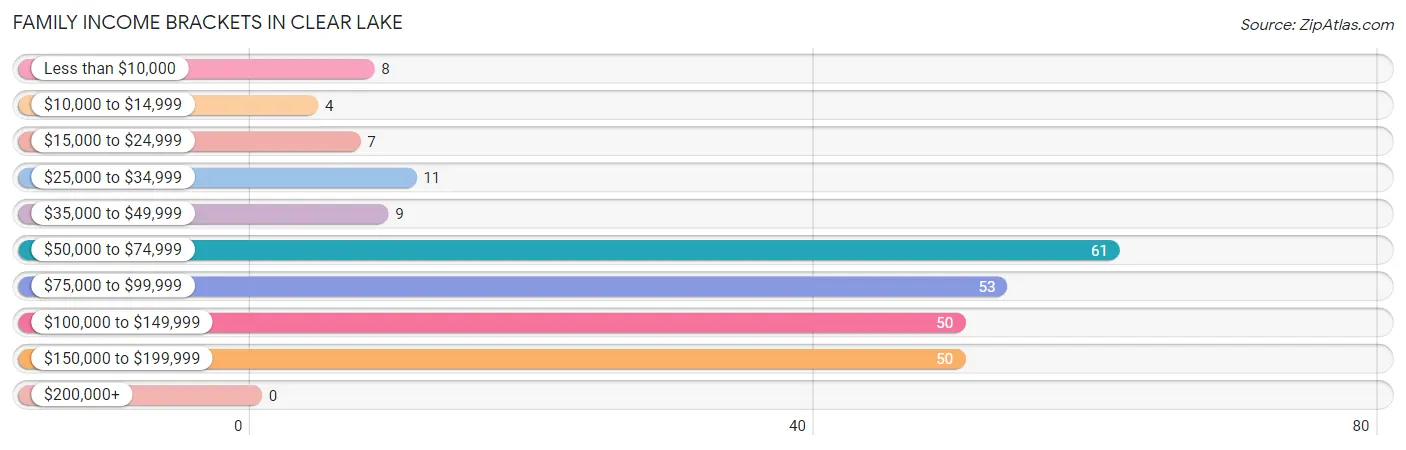
| Income Bracket | # Families | % Families |
| Less than $10,000 | 8 | 3.2% |
| $10,000 to $14,999 | 4 | 1.6% |
| $15,000 to $24,999 | 7 | 2.8% |
| $25,000 to $34,999 | 11 | 4.3% |
| $35,000 to $49,999 | 9 | 3.6% |
| $50,000 to $74,999 | 61 | 24.1% |
| $75,000 to $99,999 | 53 | 20.9% |
| $100,000 to $149,999 | 50 | 19.8% |
| $150,000 to $199,999 | 50 | 19.8% |
| $200,000+ | 0 | 0.0% |
Family Income by Famaliy Size in Clear Lake
3-person families (75 | 29.6%) account for the highest median family income in Clear Lake with $177,796 per family, while 3-person families (75 | 29.6%) have the highest median income of $59,265 per family member.
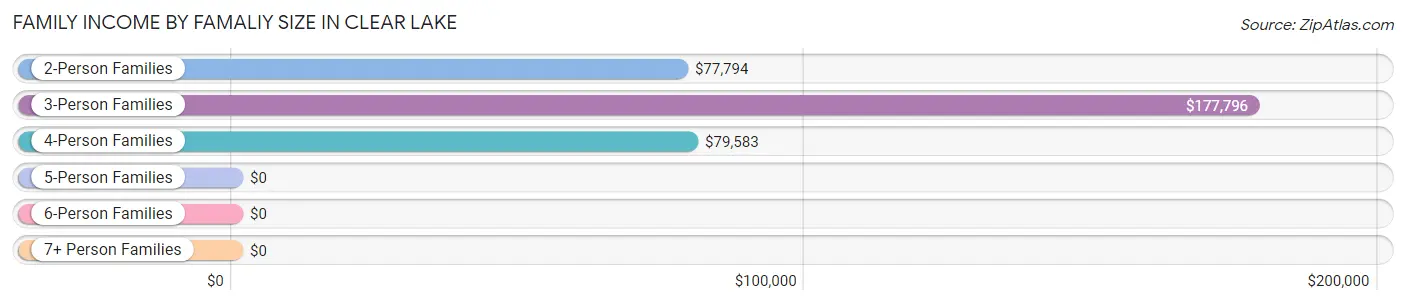
| Income Bracket | # Families | Median Income |
| 2-Person Families | 104 (41.1%) | $77,794 |
| 3-Person Families | 75 (29.6%) | $177,796 |
| 4-Person Families | 47 (18.6%) | $79,583 |
| 5-Person Families | 18 (7.1%) | $0 |
| 6-Person Families | 9 (3.6%) | $0 |
| 7+ Person Families | 0 (0.0%) | $0 |
| Total | 253 (100.0%) | $79,438 |
Family Income by Number of Earners in Clear Lake
The median family income in Clear Lake is $79,438, with families comprising 2 earners (129) having the highest median family income of $113,906, while families with no earners (40) have the lowest median family income of $65,833, accounting for 51.0% and 15.8% of families, respectively.
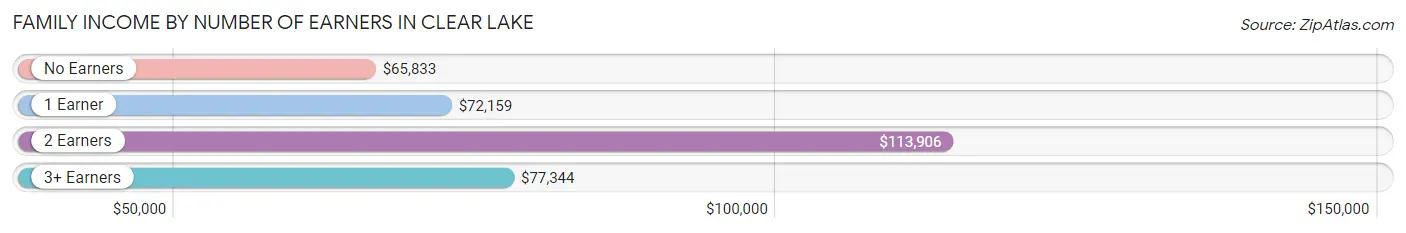
| Number of Earners | # Families | Median Income |
| No Earners | 40 (15.8%) | $65,833 |
| 1 Earner | 69 (27.3%) | $72,159 |
| 2 Earners | 129 (51.0%) | $113,906 |
| 3+ Earners | 15 (5.9%) | $77,344 |
| Total | 253 (100.0%) | $79,438 |
Household Income in Clear Lake
Household Income Brackets in Clear Lake
With 96 households falling in the category, the $50,000 to $74,999 income range is the most frequent in Clear Lake, accounting for 22.0% of all households.
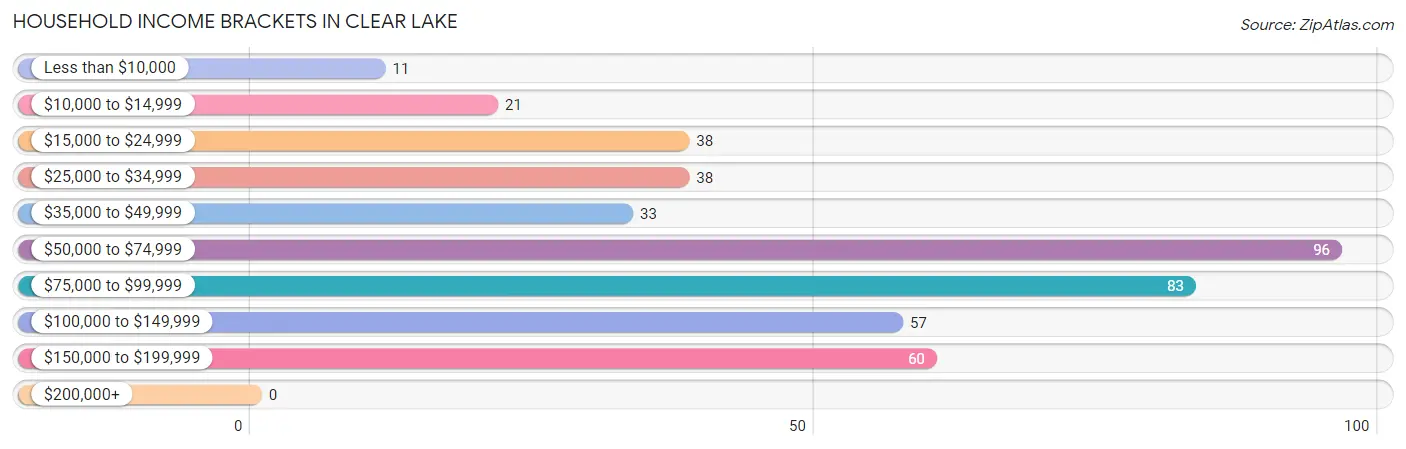
| Income Bracket | # Households | % Households |
| Less than $10,000 | 11 | 2.5% |
| $10,000 to $14,999 | 21 | 4.8% |
| $15,000 to $24,999 | 38 | 8.7% |
| $25,000 to $34,999 | 38 | 8.7% |
| $35,000 to $49,999 | 33 | 7.6% |
| $50,000 to $74,999 | 96 | 22.0% |
| $75,000 to $99,999 | 83 | 19.0% |
| $100,000 to $149,999 | 57 | 13.0% |
| $150,000 to $199,999 | 60 | 13.7% |
| $200,000+ | 0 | 0.0% |
Household Income by Householder Age in Clear Lake
The median household income in Clear Lake is $71,705, with the highest median household income of $83,750 found in the 25 to 44 years age bracket for the primary householder. A total of 102 households (23.3%) fall into this category. Meanwhile, the 15 to 24 years age bracket for the primary householder has the lowest median household income of $0, with 10 households (2.3%) in this group.
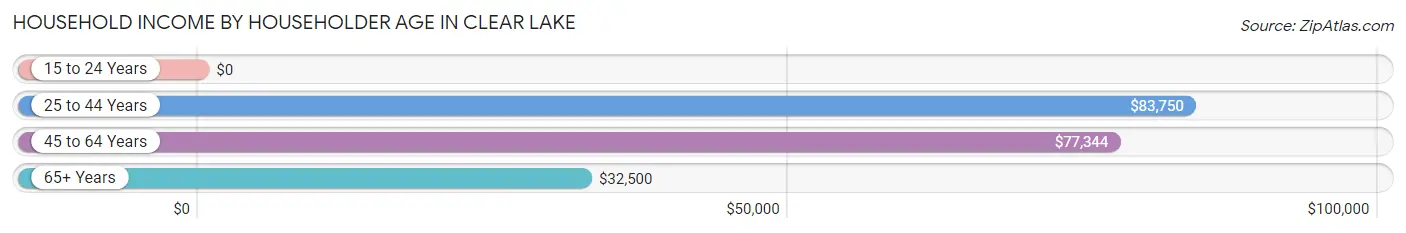
| Income Bracket | # Households | Median Income |
| 15 to 24 Years | 10 (2.3%) | $0 |
| 25 to 44 Years | 102 (23.3%) | $83,750 |
| 45 to 64 Years | 211 (48.3%) | $77,344 |
| 65+ Years | 114 (26.1%) | $32,500 |
| Total | 437 (100.0%) | $71,705 |
Poverty in Clear Lake
Income Below Poverty by Sex and Age in Clear Lake
With 14.6% poverty level for males and 16.3% for females among the residents of Clear Lake, 6 to 11 year old males and 25 to 34 year old females are the most vulnerable to poverty, with 41 males (62.1%) and 30 females (30.9%) in their respective age groups living below the poverty level.
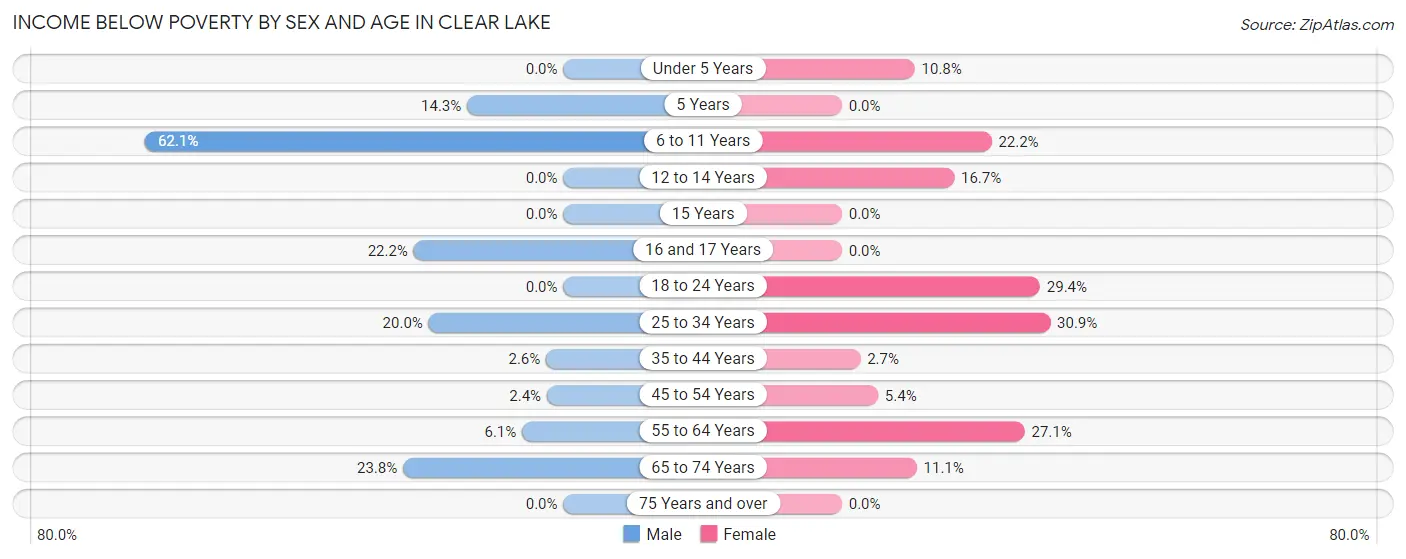
| Age Bracket | Male | Female |
| Under 5 Years | 0 (0.0%) | 4 (10.8%) |
| 5 Years | 3 (14.3%) | 0 (0.0%) |
| 6 to 11 Years | 41 (62.1%) | 6 (22.2%) |
| 12 to 14 Years | 0 (0.0%) | 3 (16.7%) |
| 15 Years | 0 (0.0%) | 0 (0.0%) |
| 16 and 17 Years | 4 (22.2%) | 0 (0.0%) |
| 18 to 24 Years | 0 (0.0%) | 10 (29.4%) |
| 25 to 34 Years | 12 (20.0%) | 30 (30.9%) |
| 35 to 44 Years | 1 (2.6%) | 2 (2.7%) |
| 45 to 54 Years | 2 (2.4%) | 3 (5.4%) |
| 55 to 64 Years | 6 (6.1%) | 19 (27.1%) |
| 65 to 74 Years | 10 (23.8%) | 5 (11.1%) |
| 75 Years and over | 0 (0.0%) | 0 (0.0%) |
| Total | 79 (14.6%) | 82 (16.3%) |
Income Above Poverty by Sex and Age in Clear Lake
According to the poverty statistics in Clear Lake, males aged under 5 years and females aged 15 years are the age groups that are most secure financially, with 100.0% of males and 100.0% of females in these age groups living above the poverty line.
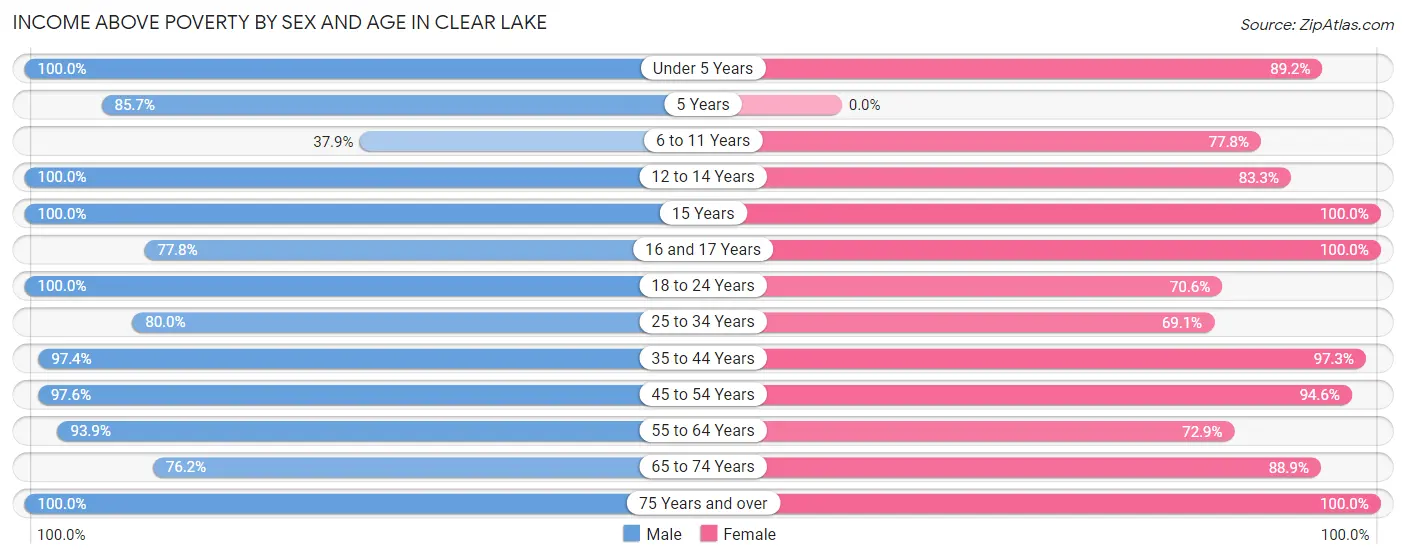
| Age Bracket | Male | Female |
| Under 5 Years | 43 (100.0%) | 33 (89.2%) |
| 5 Years | 18 (85.7%) | 0 (0.0%) |
| 6 to 11 Years | 25 (37.9%) | 21 (77.8%) |
| 12 to 14 Years | 22 (100.0%) | 15 (83.3%) |
| 15 Years | 11 (100.0%) | 3 (100.0%) |
| 16 and 17 Years | 14 (77.8%) | 5 (100.0%) |
| 18 to 24 Years | 9 (100.0%) | 24 (70.6%) |
| 25 to 34 Years | 48 (80.0%) | 67 (69.1%) |
| 35 to 44 Years | 38 (97.4%) | 71 (97.3%) |
| 45 to 54 Years | 80 (97.6%) | 53 (94.6%) |
| 55 to 64 Years | 92 (93.9%) | 51 (72.9%) |
| 65 to 74 Years | 32 (76.2%) | 40 (88.9%) |
| 75 Years and over | 31 (100.0%) | 38 (100.0%) |
| Total | 463 (85.4%) | 421 (83.7%) |
Income Below Poverty Among Married-Couple Families in Clear Lake
The poverty statistics for married-couple families in Clear Lake show that 5.3% or 11 of the total 206 families live below the poverty line. Families with 1 or 2 children have the highest poverty rate of 7.6%, comprising of 7 families. On the other hand, families with no children have the lowest poverty rate of 3.2%, which includes 3 families.
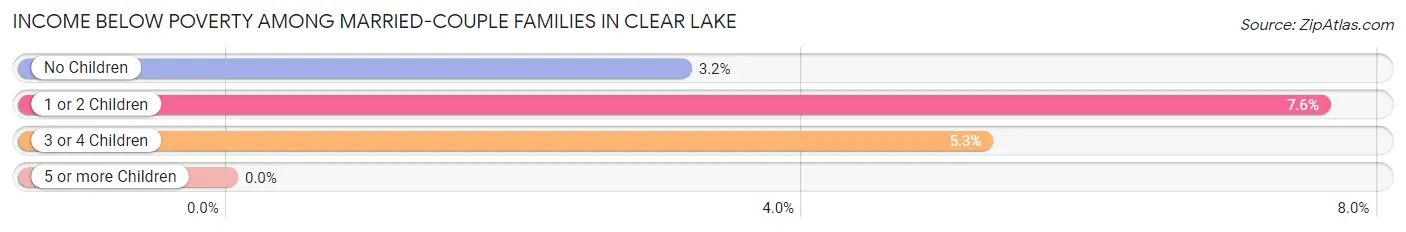
| Children | Above Poverty | Below Poverty |
| No Children | 92 (96.8%) | 3 (3.2%) |
| 1 or 2 Children | 85 (92.4%) | 7 (7.6%) |
| 3 or 4 Children | 18 (94.7%) | 1 (5.3%) |
| 5 or more Children | 0 (0.0%) | 0 (0.0%) |
| Total | 195 (94.7%) | 11 (5.3%) |
Income Below Poverty Among Single-Parent Households in Clear Lake
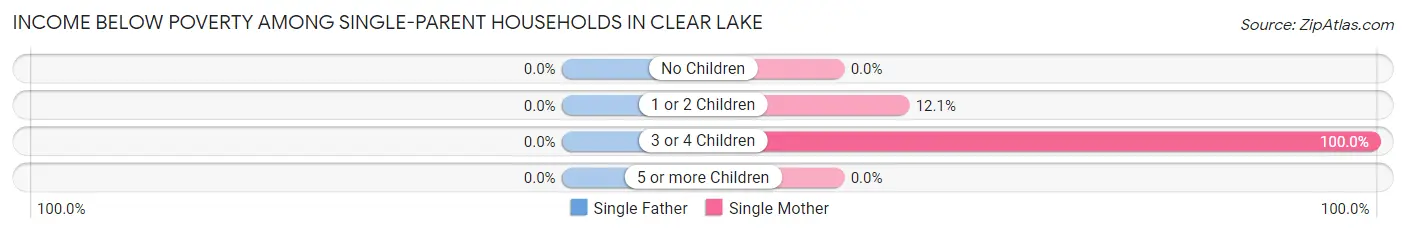
| Children | Single Father | Single Mother |
| No Children | 0 (0.0%) | 0 (0.0%) |
| 1 or 2 Children | 0 (0.0%) | 4 (12.1%) |
| 3 or 4 Children | 0 (0.0%) | 4 (100.0%) |
| 5 or more Children | 0 (0.0%) | 0 (0.0%) |
| Total | 0 (0.0%) | 8 (18.2%) |
Income Below Poverty Among Married-Couple vs Single-Parent Households in Clear Lake
The poverty data for Clear Lake shows that 11 of the married-couple family households (5.3%) and 8 of the single-parent households (17.0%) are living below the poverty level. Within the married-couple family households, those with 1 or 2 children have the highest poverty rate, with 7 households (7.6%) falling below the poverty line. Among the single-parent households, those with 3 or 4 children have the highest poverty rate, with 4 household (100.0%) living below poverty.
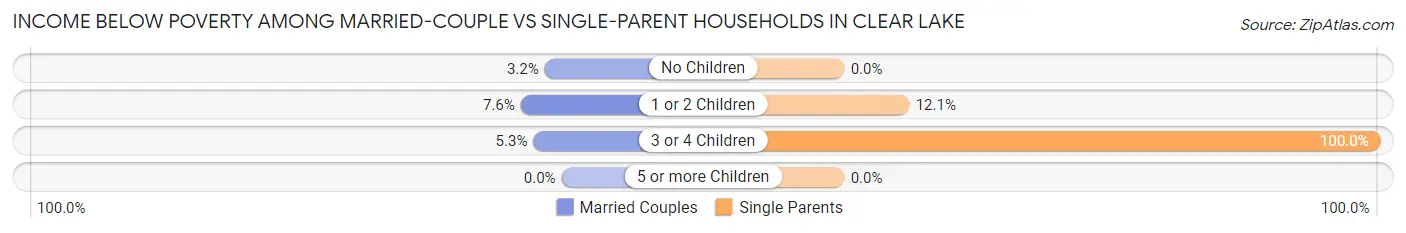
| Children | Married-Couple Families | Single-Parent Households |
| No Children | 3 (3.2%) | 0 (0.0%) |
| 1 or 2 Children | 7 (7.6%) | 4 (12.1%) |
| 3 or 4 Children | 1 (5.3%) | 4 (100.0%) |
| 5 or more Children | 0 (0.0%) | 0 (0.0%) |
| Total | 11 (5.3%) | 8 (17.0%) |
Race in Clear Lake
The most populous races in Clear Lake are White / Caucasian (982 | 93.7%), Hispanic or Latino (62 | 5.9%), and Two or more Races (56 | 5.3%).
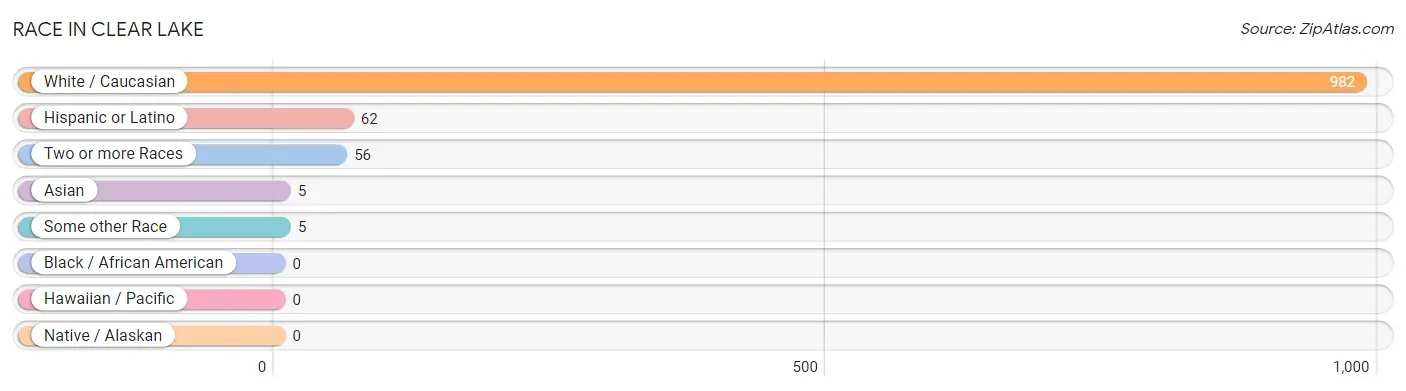
| Race | # Population | % Population |
| Asian | 5 | 0.5% |
| Black / African American | 0 | 0.0% |
| Hawaiian / Pacific | 0 | 0.0% |
| Hispanic or Latino | 62 | 5.9% |
| Native / Alaskan | 0 | 0.0% |
| White / Caucasian | 982 | 93.7% |
| Two or more Races | 56 | 5.3% |
| Some other Race | 5 | 0.5% |
| Total | 1,048 | 100.0% |
Ancestry in Clear Lake
The most populous ancestries reported in Clear Lake are German (340 | 32.4%), Norwegian (199 | 19.0%), Irish (100 | 9.5%), Swedish (83 | 7.9%), and Mexican (62 | 5.9%), together accounting for 74.8% of all Clear Lake residents.
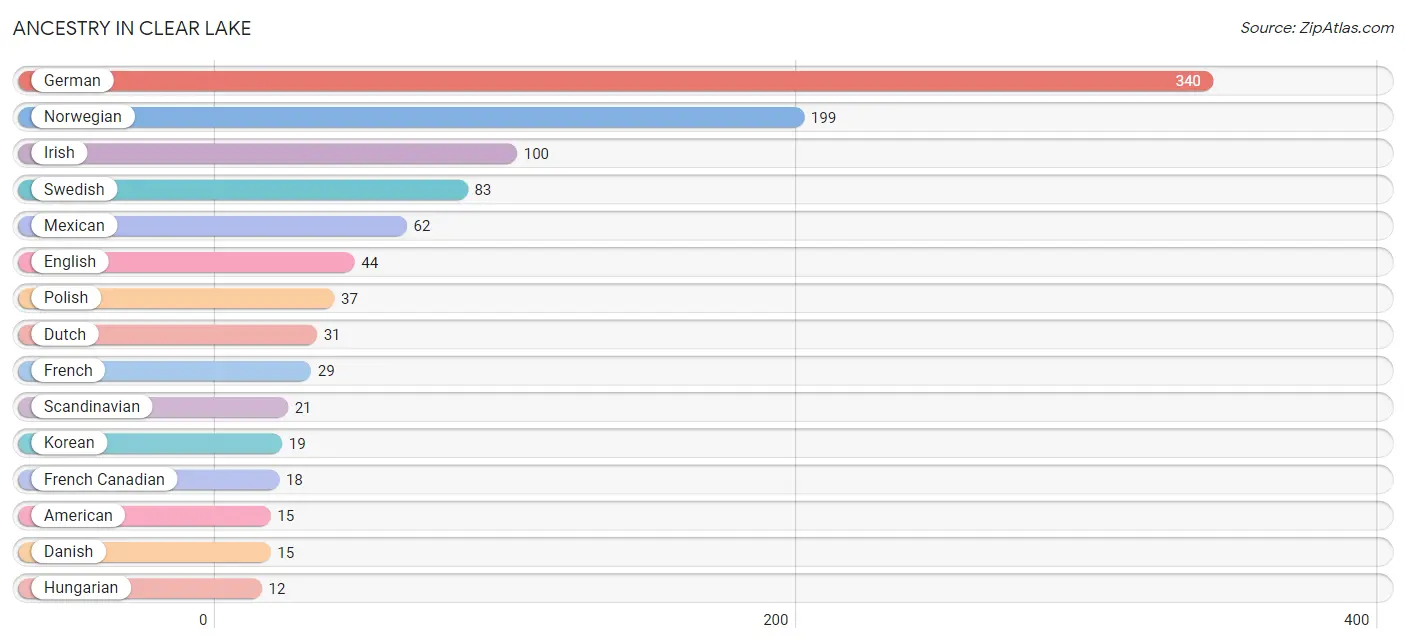
| Ancestry | # Population | % Population |
| American | 15 | 1.4% |
| Czech | 8 | 0.8% |
| Danish | 15 | 1.4% |
| Dutch | 31 | 3.0% |
| English | 44 | 4.2% |
| European | 8 | 0.8% |
| Finnish | 7 | 0.7% |
| French | 29 | 2.8% |
| French Canadian | 18 | 1.7% |
| German | 340 | 32.4% |
| Hungarian | 12 | 1.1% |
| Irish | 100 | 9.5% |
| Italian | 5 | 0.5% |
| Korean | 19 | 1.8% |
| Mexican | 62 | 5.9% |
| Norwegian | 199 | 19.0% |
| Polish | 37 | 3.5% |
| Russian | 7 | 0.7% |
| Scandinavian | 21 | 2.0% |
| Scotch-Irish | 9 | 0.9% |
| Sioux | 1 | 0.1% |
| Sri Lankan | 5 | 0.5% |
| Swedish | 83 | 7.9% |
| Swiss | 4 | 0.4% |
| Thai | 4 | 0.4% | View All 25 Rows |
Immigrants in Clear Lake
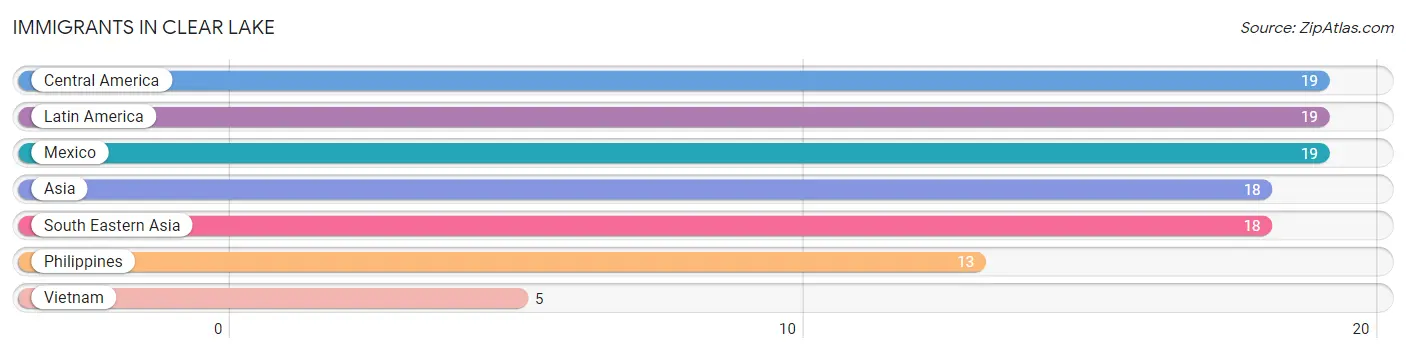
The most numerous immigrant groups reported in Clear Lake came from Central America (19 | 1.8%), Latin America (19 | 1.8%), Mexico (19 | 1.8%), Asia (18 | 1.7%), and South Eastern Asia (18 | 1.7%), together accounting for 8.9% of all Clear Lake residents.
| Immigration Origin | # Population | % Population |
| Asia | 18 | 1.7% |
| Central America | 19 | 1.8% |
| Latin America | 19 | 1.8% |
| Mexico | 19 | 1.8% |
| Philippines | 13 | 1.2% |
| South Eastern Asia | 18 | 1.7% |
| Vietnam | 5 | 0.5% | View All 7 Rows |
Sex and Age in Clear Lake
Sex and Age in Clear Lake
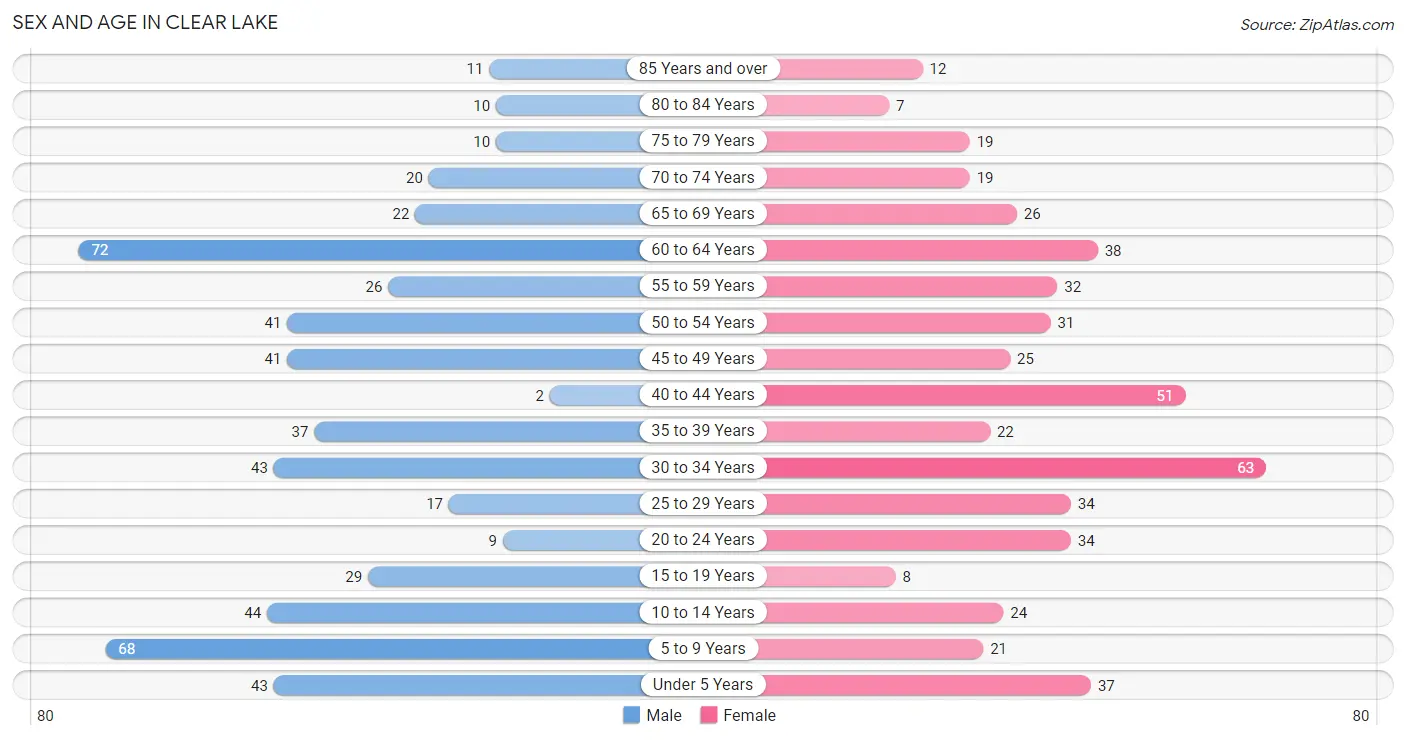
The most populous age groups in Clear Lake are 60 to 64 Years (72 | 13.2%) for men and 30 to 34 Years (63 | 12.5%) for women.
| Age Bracket | Male | Female |
| Under 5 Years | 43 (7.9%) | 37 (7.4%) |
| 5 to 9 Years | 68 (12.5%) | 21 (4.2%) |
| 10 to 14 Years | 44 (8.1%) | 24 (4.8%) |
| 15 to 19 Years | 29 (5.3%) | 8 (1.6%) |
| 20 to 24 Years | 9 (1.7%) | 34 (6.8%) |
| 25 to 29 Years | 17 (3.1%) | 34 (6.8%) |
| 30 to 34 Years | 43 (7.9%) | 63 (12.5%) |
| 35 to 39 Years | 37 (6.8%) | 22 (4.4%) |
| 40 to 44 Years | 2 (0.4%) | 51 (10.1%) |
| 45 to 49 Years | 41 (7.5%) | 25 (5.0%) |
| 50 to 54 Years | 41 (7.5%) | 31 (6.2%) |
| 55 to 59 Years | 26 (4.8%) | 32 (6.4%) |
| 60 to 64 Years | 72 (13.2%) | 38 (7.5%) |
| 65 to 69 Years | 22 (4.0%) | 26 (5.2%) |
| 70 to 74 Years | 20 (3.7%) | 19 (3.8%) |
| 75 to 79 Years | 10 (1.8%) | 19 (3.8%) |
| 80 to 84 Years | 10 (1.8%) | 7 (1.4%) |
| 85 Years and over | 11 (2.0%) | 12 (2.4%) |
| Total | 545 (100.0%) | 503 (100.0%) |
Families and Households in Clear Lake
Median Family Size in Clear Lake
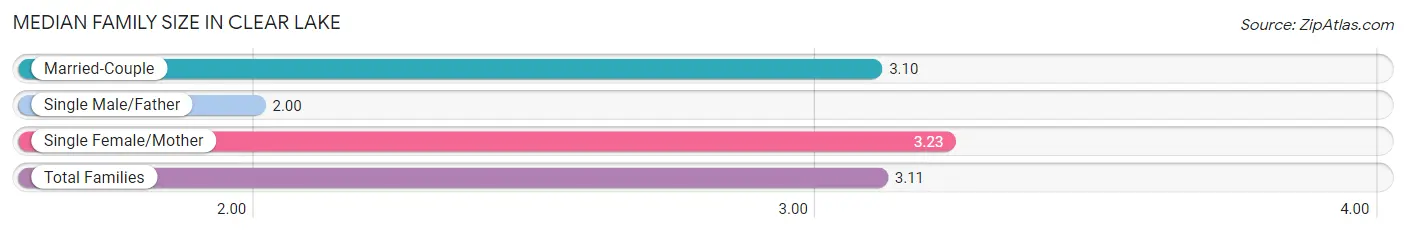
The median family size in Clear Lake is 3.11 persons per family, with single female/mother families (44 | 17.4%) accounting for the largest median family size of 3.23 persons per family. On the other hand, single male/father families (3 | 1.2%) represent the smallest median family size with 2.00 persons per family.
| Family Type | # Families | Family Size |
| Married-Couple | 206 (81.4%) | 3.10 |
| Single Male/Father | 3 (1.2%) | 2.00 |
| Single Female/Mother | 44 (17.4%) | 3.23 |
| Total Families | 253 (100.0%) | 3.11 |
Median Household Size in Clear Lake
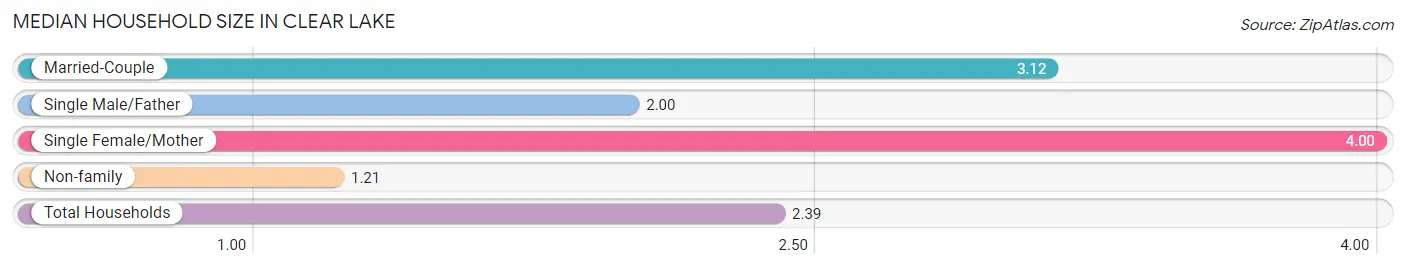
The median household size in Clear Lake is 2.39 persons per household, with single female/mother households (44 | 10.1%) accounting for the largest median household size of 4 persons per household. non-family households (184 | 42.1%) represent the smallest median household size with 1.21 persons per household.
| Household Type | # Households | Household Size |
| Married-Couple | 206 (47.1%) | 3.12 |
| Single Male/Father | 3 (0.7%) | 2.00 |
| Single Female/Mother | 44 (10.1%) | 4.00 |
| Non-family | 184 (42.1%) | 1.21 |
| Total Households | 437 (100.0%) | 2.39 |
Household Size by Marriage Status in Clear Lake
Out of a total of 437 households in Clear Lake, 253 (57.9%) are family households, while 184 (42.1%) are nonfamily households. The most numerous type of family households are 2-person households, comprising 99, and the most common type of nonfamily households are 1-person households, comprising 151.
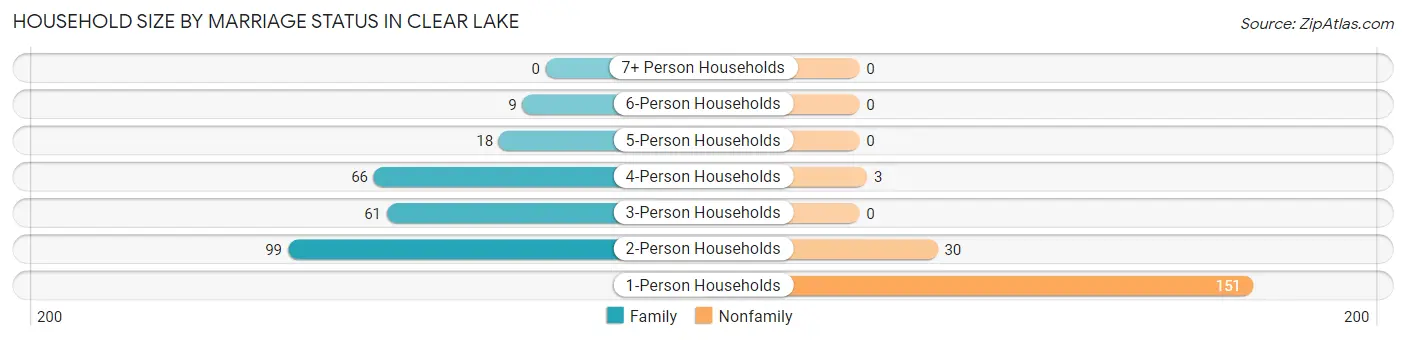
| Household Size | Family Households | Nonfamily Households |
| 1-Person Households | - | 151 (34.5%) |
| 2-Person Households | 99 (22.7%) | 30 (6.9%) |
| 3-Person Households | 61 (14.0%) | 0 (0.0%) |
| 4-Person Households | 66 (15.1%) | 3 (0.7%) |
| 5-Person Households | 18 (4.1%) | 0 (0.0%) |
| 6-Person Households | 9 (2.1%) | 0 (0.0%) |
| 7+ Person Households | 0 (0.0%) | 0 (0.0%) |
| Total | 253 (57.9%) | 184 (42.1%) |
Female Fertility in Clear Lake
Fertility by Age in Clear Lake
Average fertility rate in Clear Lake is 77.0 births per 1,000 women. Women in the age bracket of 20 to 34 years have the highest fertility rate with 145.0 births per 1,000 women. Women in the age bracket of 20 to 34 years acount for 100.0% of all women with births.
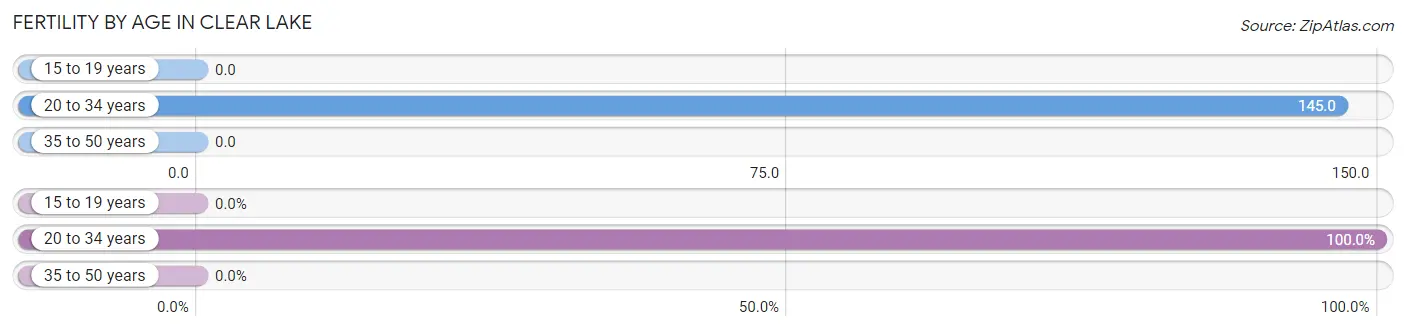
| Age Bracket | Women with Births | Births / 1,000 Women |
| 15 to 19 years | 0 (0.0%) | 0.0 |
| 20 to 34 years | 19 (100.0%) | 145.0 |
| 35 to 50 years | 0 (0.0%) | 0.0 |
| Total | 19 (100.0%) | 77.0 |
Fertility by Age by Marriage Status in Clear Lake
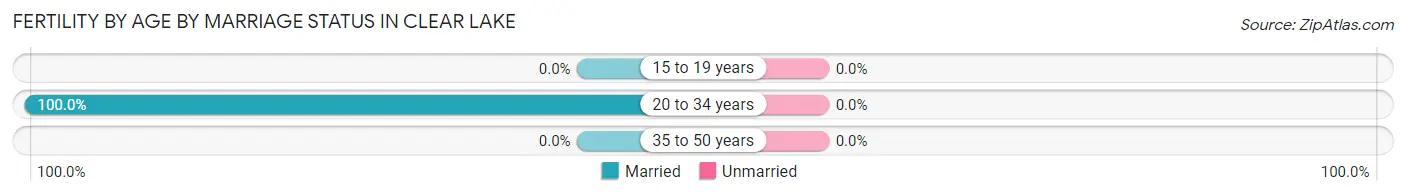
| Age Bracket | Married | Unmarried |
| 15 to 19 years | 0 (0.0%) | 0 (0.0%) |
| 20 to 34 years | 19 (100.0%) | 0 (0.0%) |
| 35 to 50 years | 0 (0.0%) | 0 (0.0%) |
| Total | 19 (100.0%) | 0 (0.0%) |
Fertility by Education in Clear Lake
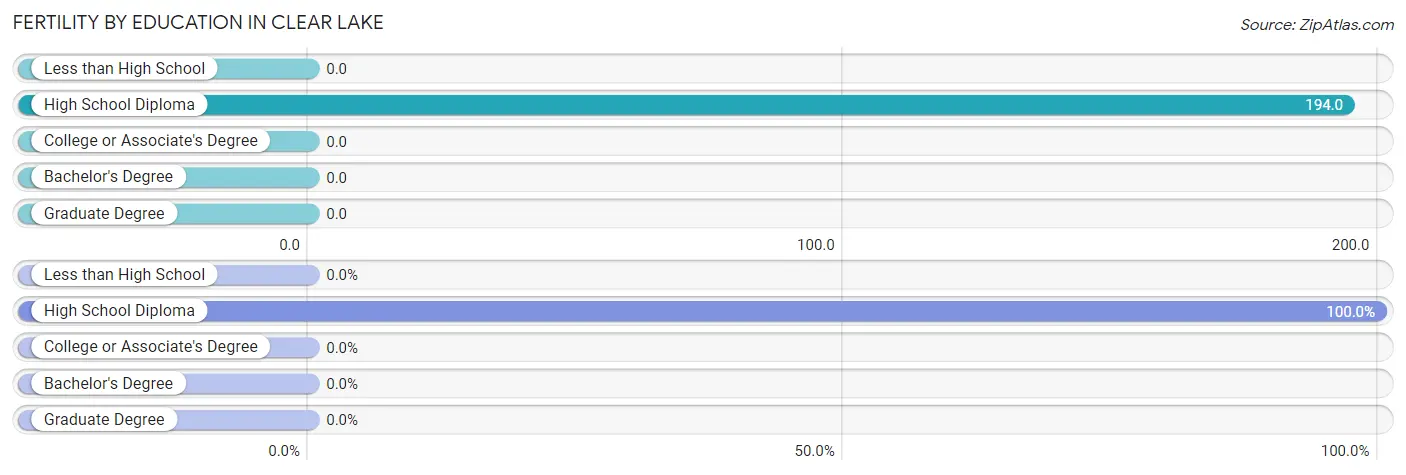
| Educational Attainment | Women with Births | Births / 1,000 Women |
| Less than High School | 0 (0.0%) | 0.0 |
| High School Diploma | 19 (100.0%) | 194.0 |
| College or Associate's Degree | 0 (0.0%) | 0.0 |
| Bachelor's Degree | 0 (0.0%) | 0.0 |
| Graduate Degree | 0 (0.0%) | 0.0 |
| Total | 19 (100.0%) | 77.0 |
Fertility by Education by Marriage Status in Clear Lake
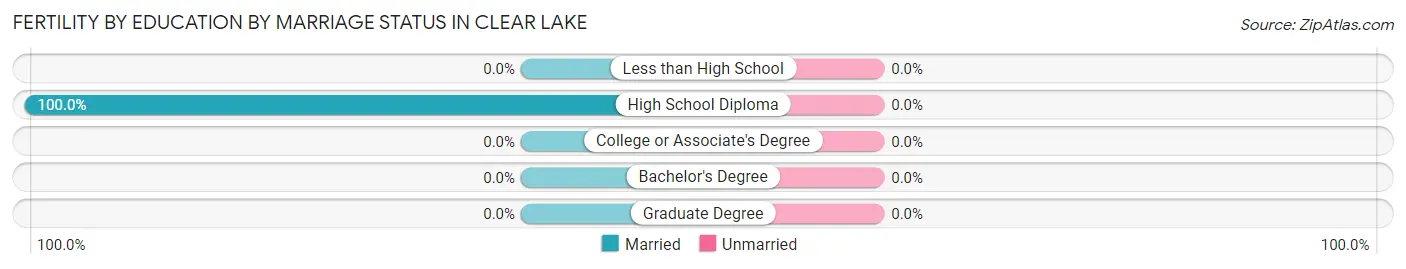
| Educational Attainment | Married | Unmarried |
| Less than High School | 0 (0.0%) | 0 (0.0%) |
| High School Diploma | 19 (100.0%) | 0 (0.0%) |
| College or Associate's Degree | 0 (0.0%) | 0 (0.0%) |
| Bachelor's Degree | 0 (0.0%) | 0 (0.0%) |
| Graduate Degree | 0 (0.0%) | 0 (0.0%) |
| Total | 19 (100.0%) | 0 (0.0%) |
Employment Characteristics in Clear Lake
Employment by Class of Employer in Clear Lake
Among the 491 employed individuals in Clear Lake, private company employees (331 | 67.4%), self-employed (not incorporated) (70 | 14.3%), and local government employees (30 | 6.1%) make up the most common classes of employment.
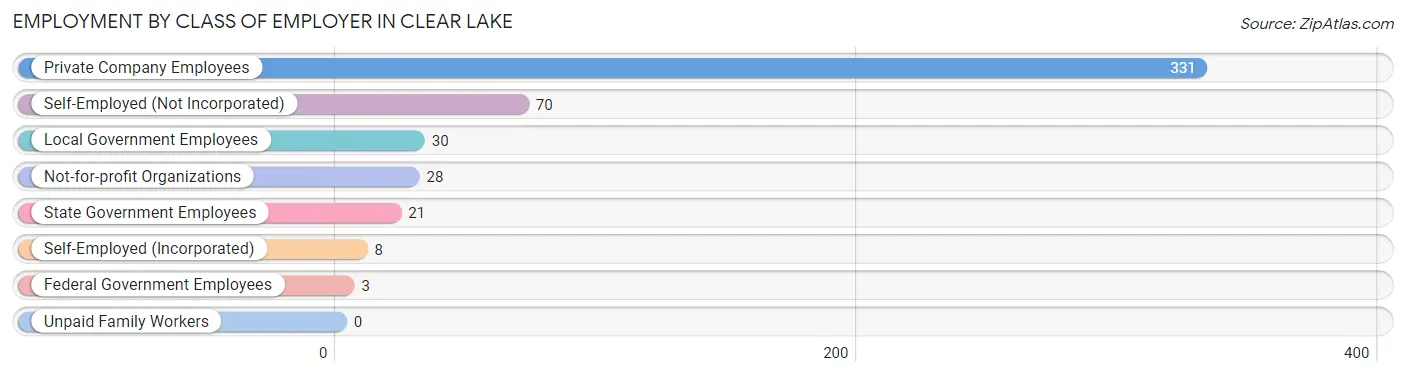
| Employer Class | # Employees | % Employees |
| Private Company Employees | 331 | 67.4% |
| Self-Employed (Incorporated) | 8 | 1.6% |
| Self-Employed (Not Incorporated) | 70 | 14.3% |
| Not-for-profit Organizations | 28 | 5.7% |
| Local Government Employees | 30 | 6.1% |
| State Government Employees | 21 | 4.3% |
| Federal Government Employees | 3 | 0.6% |
| Unpaid Family Workers | 0 | 0.0% |
| Total | 491 | 100.0% |
Employment Status by Age in Clear Lake
According to the labor force statistics for Clear Lake, out of the total population over 16 years of age (797), 64.5% or 514 individuals are in the labor force, with 3.9% or 20 of them unemployed. The age group with the highest labor force participation rate is 35 to 44 years, with 100.0% or 112 individuals in the labor force. Within the labor force, the 20 to 24 years age range has the highest percentage of unemployed individuals, with 10.8% or 4 of them being unemployed.
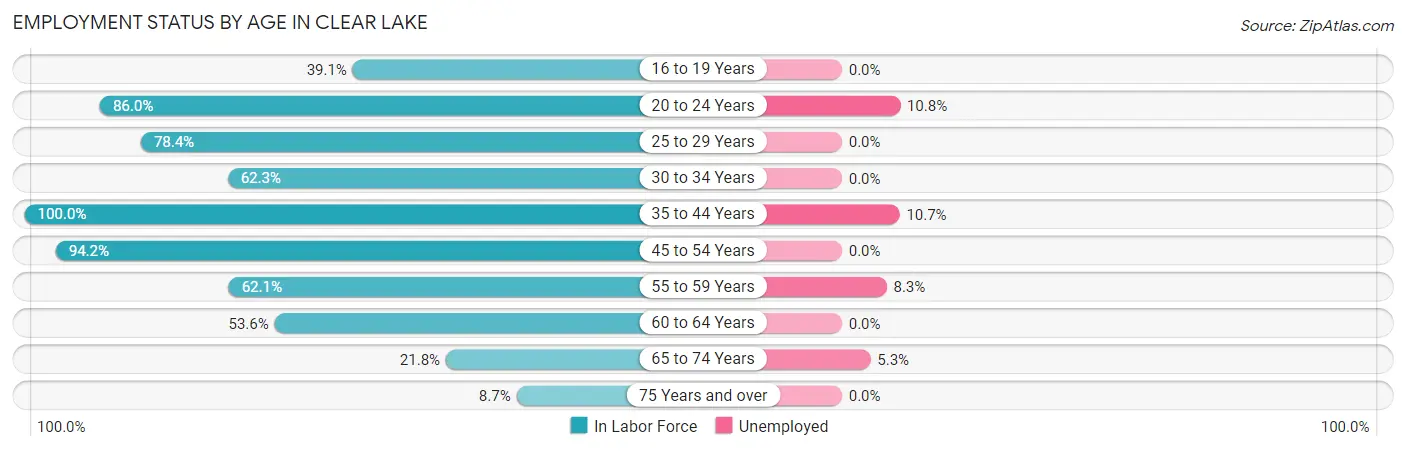
| Age Bracket | In Labor Force | Unemployed |
| 16 to 19 Years | 9 (39.1%) | 0 (0.0%) |
| 20 to 24 Years | 37 (86.0%) | 4 (10.8%) |
| 25 to 29 Years | 40 (78.4%) | 0 (0.0%) |
| 30 to 34 Years | 66 (62.3%) | 0 (0.0%) |
| 35 to 44 Years | 112 (100.0%) | 12 (10.7%) |
| 45 to 54 Years | 130 (94.2%) | 0 (0.0%) |
| 55 to 59 Years | 36 (62.1%) | 3 (8.3%) |
| 60 to 64 Years | 59 (53.6%) | 0 (0.0%) |
| 65 to 74 Years | 19 (21.8%) | 1 (5.3%) |
| 75 Years and over | 6 (8.7%) | 0 (0.0%) |
| Total | 514 (64.5%) | 20 (3.9%) |
Employment Status by Educational Attainment in Clear Lake
According to labor force statistics for Clear Lake, 77.0% of individuals (443) out of the total population between 25 and 64 years of age (575) are in the labor force, with 3.4% or 15 of them being unemployed. The group with the highest labor force participation rate are those with the educational attainment of bachelor's degree or higher, with 86.7% or 72 individuals in the labor force. Within the labor force, individuals with college / associate degree education have the highest percentage of unemployment, with 6.6% or 12 of them being unemployed.
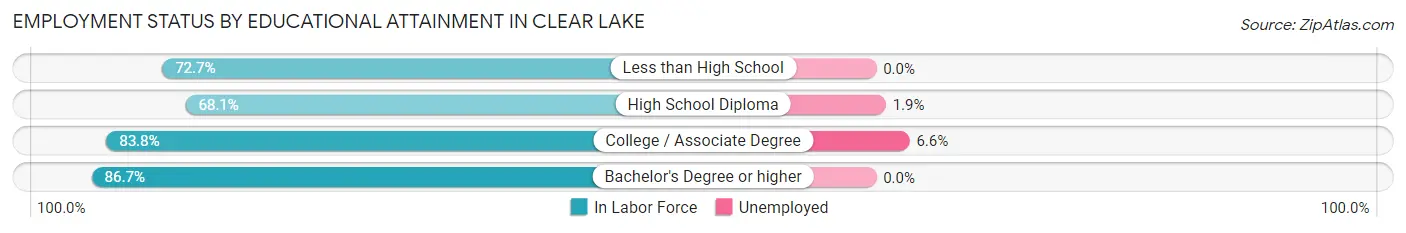
| Educational Attainment | In Labor Force | Unemployed |
| Less than High School | 32 (72.7%) | 0 (0.0%) |
| High School Diploma | 158 (68.1%) | 4 (1.9%) |
| College / Associate Degree | 181 (83.8%) | 14 (6.6%) |
| Bachelor's Degree or higher | 72 (86.7%) | 0 (0.0%) |
| Total | 443 (77.0%) | 20 (3.4%) |
Employment Occupations by Sex in Clear Lake
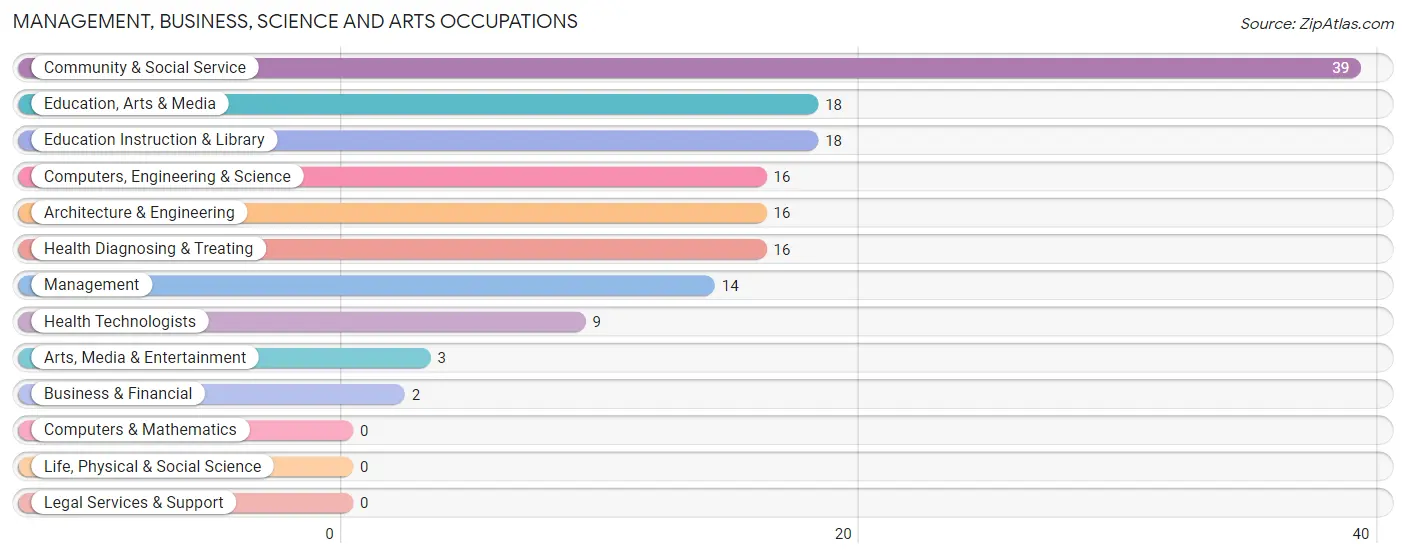
Management, Business, Science and Arts Occupations
The most common Management, Business, Science and Arts occupations in Clear Lake are Community & Social Service (39 | 7.9%), Education, Arts & Media (18 | 3.6%), Education Instruction & Library (18 | 3.6%), Computers, Engineering & Science (16 | 3.2%), and Architecture & Engineering (16 | 3.2%).
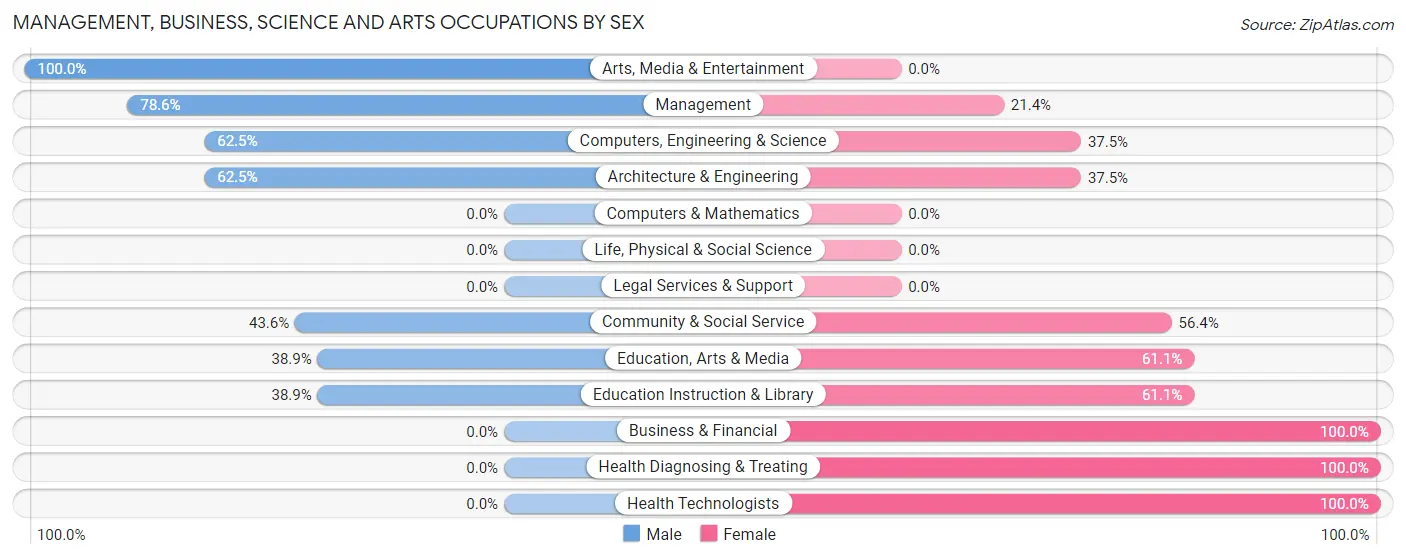
Management, Business, Science and Arts Occupations by Sex
Within the Management, Business, Science and Arts occupations in Clear Lake, the most male-oriented occupations are Arts, Media & Entertainment (100.0%), Management (78.6%), and Computers, Engineering & Science (62.5%), while the most female-oriented occupations are Business & Financial (100.0%), Health Diagnosing & Treating (100.0%), and Health Technologists (100.0%).
| Occupation | Male | Female |
| Management | 11 (78.6%) | 3 (21.4%) |
| Business & Financial | 0 (0.0%) | 2 (100.0%) |
| Computers, Engineering & Science | 10 (62.5%) | 6 (37.5%) |
| Computers & Mathematics | 0 (0.0%) | 0 (0.0%) |
| Architecture & Engineering | 10 (62.5%) | 6 (37.5%) |
| Life, Physical & Social Science | 0 (0.0%) | 0 (0.0%) |
| Community & Social Service | 17 (43.6%) | 22 (56.4%) |
| Education, Arts & Media | 7 (38.9%) | 11 (61.1%) |
| Legal Services & Support | 0 (0.0%) | 0 (0.0%) |
| Education Instruction & Library | 7 (38.9%) | 11 (61.1%) |
| Arts, Media & Entertainment | 3 (100.0%) | 0 (0.0%) |
| Health Diagnosing & Treating | 0 (0.0%) | 16 (100.0%) |
| Health Technologists | 0 (0.0%) | 9 (100.0%) |
| Total (Category) | 38 (43.7%) | 49 (56.3%) |
| Total (Overall) | 253 (51.2%) | 241 (48.8%) |
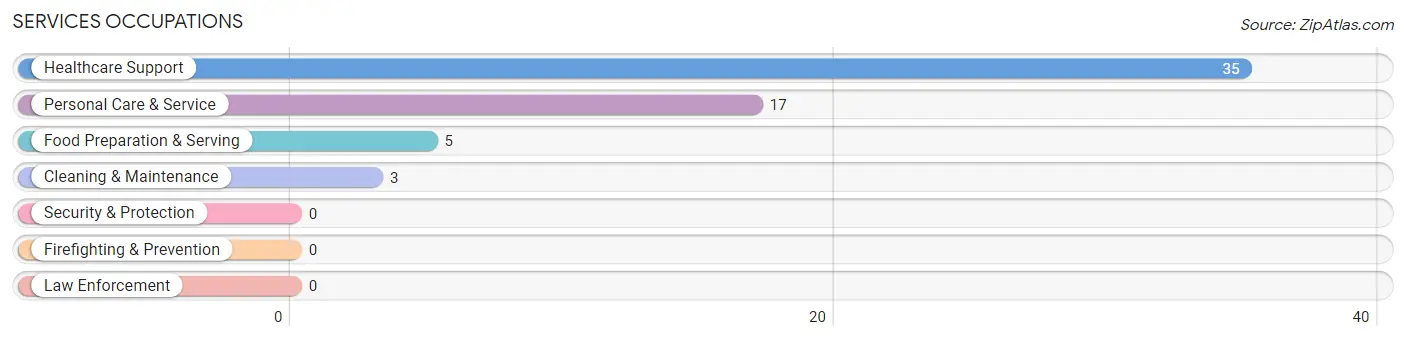
Services Occupations
The most common Services occupations in Clear Lake are Healthcare Support (35 | 7.1%), Personal Care & Service (17 | 3.4%), Food Preparation & Serving (5 | 1.0%), and Cleaning & Maintenance (3 | 0.6%).
Services Occupations by Sex
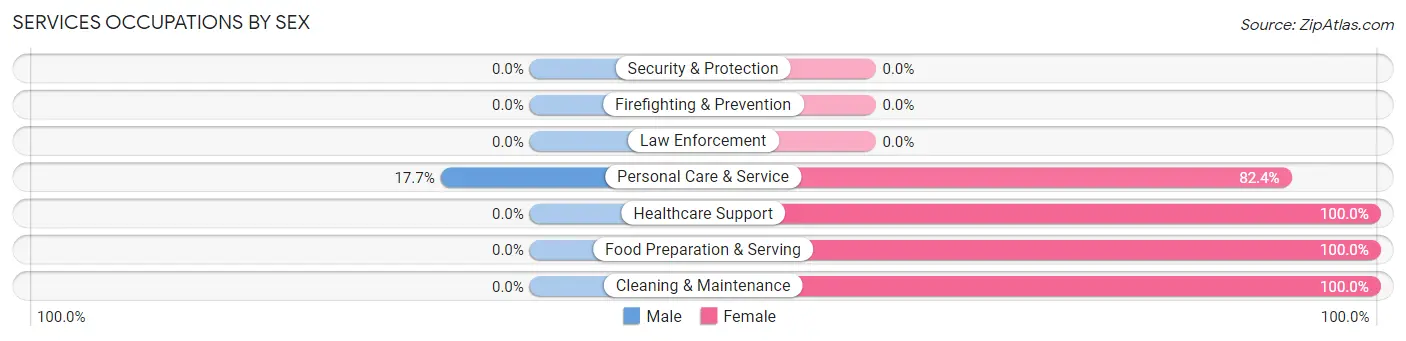
| Occupation | Male | Female |
| Healthcare Support | 0 (0.0%) | 35 (100.0%) |
| Security & Protection | 0 (0.0%) | 0 (0.0%) |
| Firefighting & Prevention | 0 (0.0%) | 0 (0.0%) |
| Law Enforcement | 0 (0.0%) | 0 (0.0%) |
| Food Preparation & Serving | 0 (0.0%) | 5 (100.0%) |
| Cleaning & Maintenance | 0 (0.0%) | 3 (100.0%) |
| Personal Care & Service | 3 (17.6%) | 14 (82.4%) |
| Total (Category) | 3 (5.0%) | 57 (95.0%) |
| Total (Overall) | 253 (51.2%) | 241 (48.8%) |
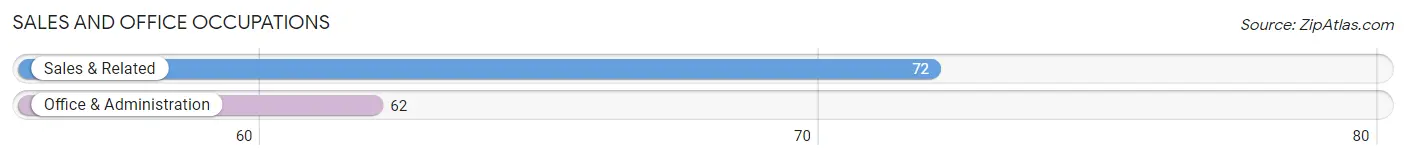
Sales and Office Occupations
The most common Sales and Office occupations in Clear Lake are Sales & Related (72 | 14.6%), and Office & Administration (62 | 12.6%).
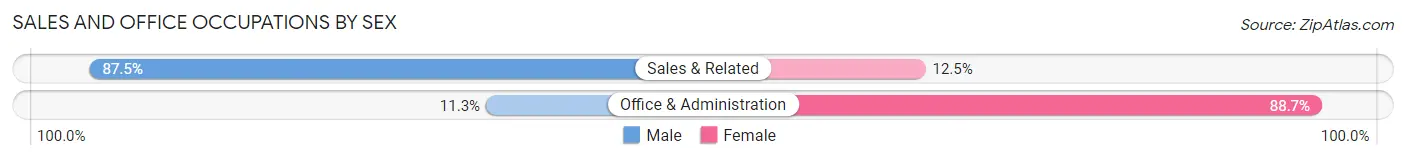
Sales and Office Occupations by Sex
| Occupation | Male | Female |
| Sales & Related | 63 (87.5%) | 9 (12.5%) |
| Office & Administration | 7 (11.3%) | 55 (88.7%) |
| Total (Category) | 70 (52.2%) | 64 (47.8%) |
| Total (Overall) | 253 (51.2%) | 241 (48.8%) |
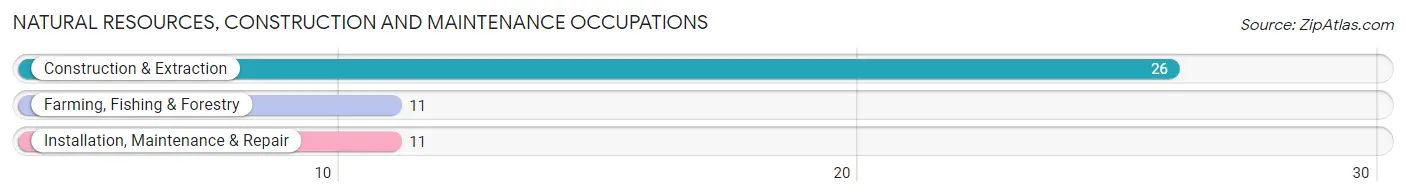
Natural Resources, Construction and Maintenance Occupations
The most common Natural Resources, Construction and Maintenance occupations in Clear Lake are Construction & Extraction (26 | 5.3%), Farming, Fishing & Forestry (11 | 2.2%), and Installation, Maintenance & Repair (11 | 2.2%).
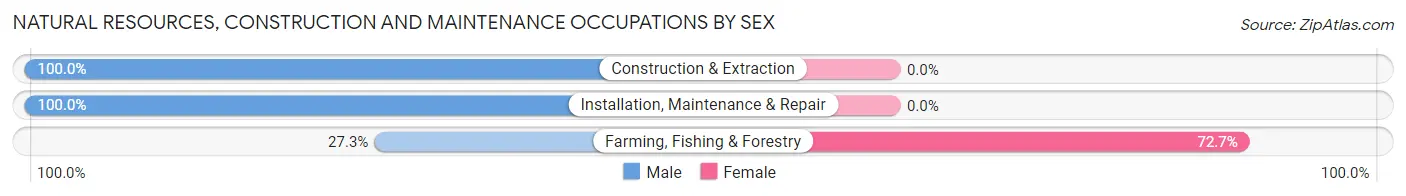
Natural Resources, Construction and Maintenance Occupations by Sex
| Occupation | Male | Female |
| Farming, Fishing & Forestry | 3 (27.3%) | 8 (72.7%) |
| Construction & Extraction | 26 (100.0%) | 0 (0.0%) |
| Installation, Maintenance & Repair | 11 (100.0%) | 0 (0.0%) |
| Total (Category) | 40 (83.3%) | 8 (16.7%) |
| Total (Overall) | 253 (51.2%) | 241 (48.8%) |
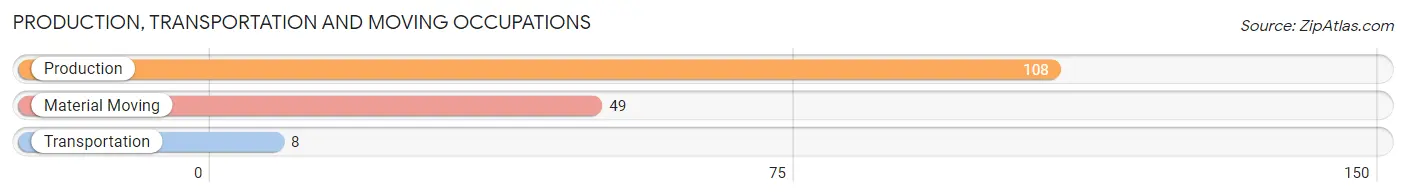
Production, Transportation and Moving Occupations
The most common Production, Transportation and Moving occupations in Clear Lake are Production (108 | 21.9%), Material Moving (49 | 9.9%), and Transportation (8 | 1.6%).
Production, Transportation and Moving Occupations by Sex
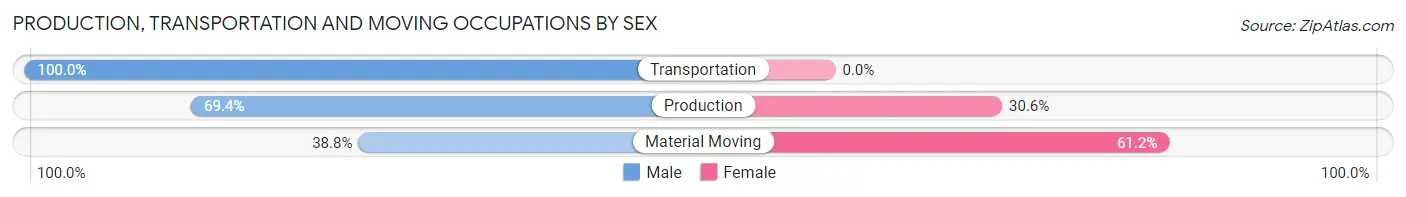
| Occupation | Male | Female |
| Production | 75 (69.4%) | 33 (30.6%) |
| Transportation | 8 (100.0%) | 0 (0.0%) |
| Material Moving | 19 (38.8%) | 30 (61.2%) |
| Total (Category) | 102 (61.8%) | 63 (38.2%) |
| Total (Overall) | 253 (51.2%) | 241 (48.8%) |
Employment Industries by Sex in Clear Lake
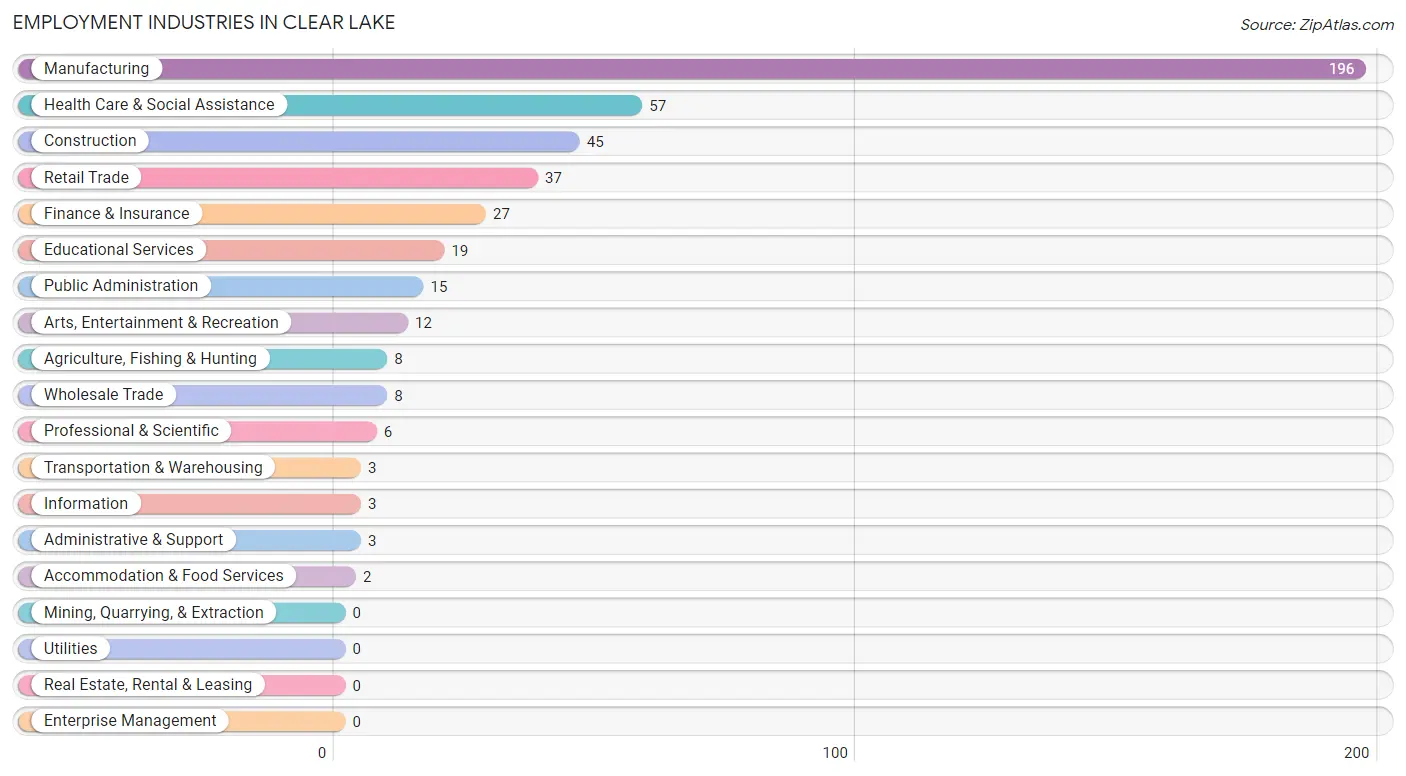
Employment Industries in Clear Lake
The major employment industries in Clear Lake include Manufacturing (196 | 39.7%), Health Care & Social Assistance (57 | 11.5%), Construction (45 | 9.1%), Retail Trade (37 | 7.5%), and Finance & Insurance (27 | 5.5%).
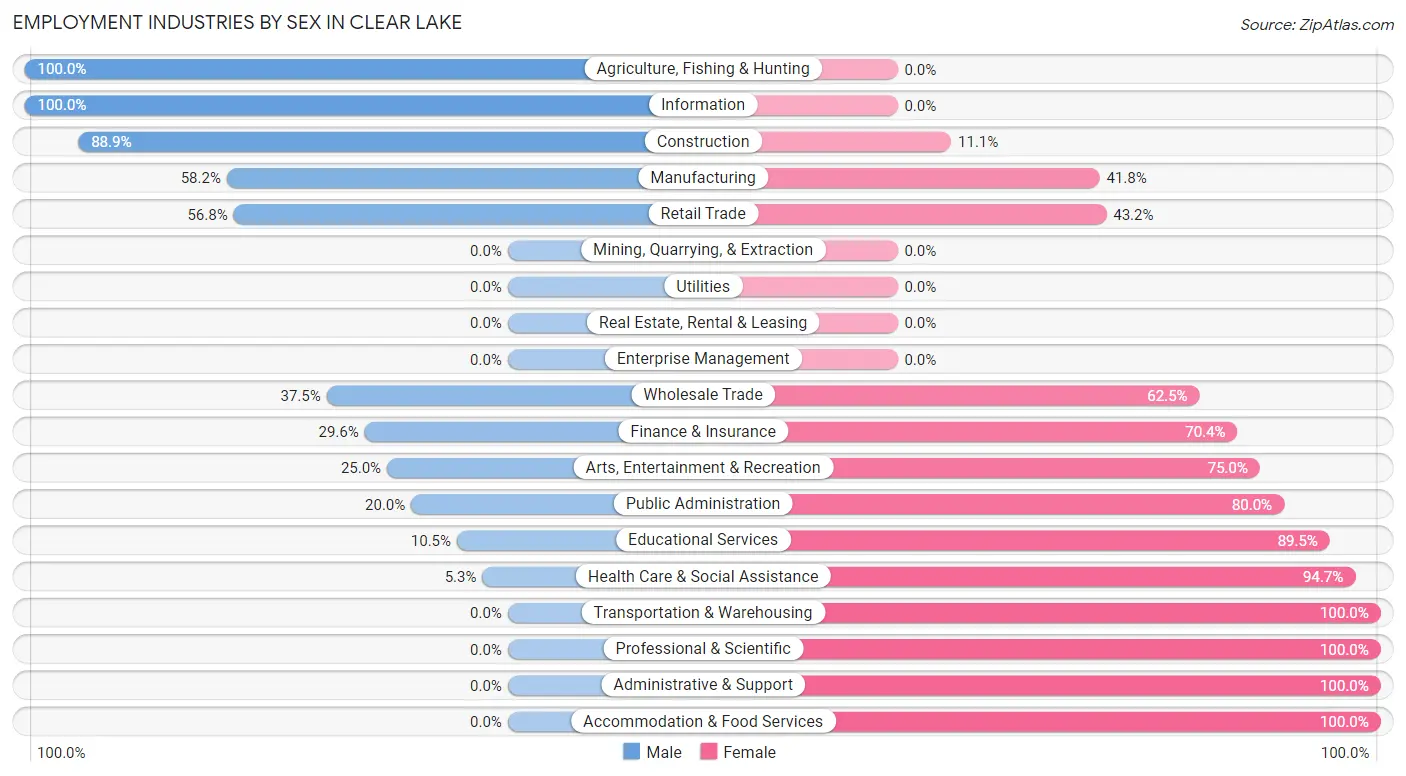
Employment Industries by Sex in Clear Lake
The Clear Lake industries that see more men than women are Agriculture, Fishing & Hunting (100.0%), Information (100.0%), and Construction (88.9%), whereas the industries that tend to have a higher number of women are Transportation & Warehousing (100.0%), Professional & Scientific (100.0%), and Administrative & Support (100.0%).
| Industry | Male | Female |
| Agriculture, Fishing & Hunting | 8 (100.0%) | 0 (0.0%) |
| Mining, Quarrying, & Extraction | 0 (0.0%) | 0 (0.0%) |
| Construction | 40 (88.9%) | 5 (11.1%) |
| Manufacturing | 114 (58.2%) | 82 (41.8%) |
| Wholesale Trade | 3 (37.5%) | 5 (62.5%) |
| Retail Trade | 21 (56.8%) | 16 (43.2%) |
| Transportation & Warehousing | 0 (0.0%) | 3 (100.0%) |
| Utilities | 0 (0.0%) | 0 (0.0%) |
| Information | 3 (100.0%) | 0 (0.0%) |
| Finance & Insurance | 8 (29.6%) | 19 (70.4%) |
| Real Estate, Rental & Leasing | 0 (0.0%) | 0 (0.0%) |
| Professional & Scientific | 0 (0.0%) | 6 (100.0%) |
| Enterprise Management | 0 (0.0%) | 0 (0.0%) |
| Administrative & Support | 0 (0.0%) | 3 (100.0%) |
| Educational Services | 2 (10.5%) | 17 (89.5%) |
| Health Care & Social Assistance | 3 (5.3%) | 54 (94.7%) |
| Arts, Entertainment & Recreation | 3 (25.0%) | 9 (75.0%) |
| Accommodation & Food Services | 0 (0.0%) | 2 (100.0%) |
| Public Administration | 3 (20.0%) | 12 (80.0%) |
| Total | 253 (51.2%) | 241 (48.8%) |
Education in Clear Lake
School Enrollment in Clear Lake
The most common levels of schooling among the 225 students in Clear Lake are high school (66 | 29.3%), kindergarten (39 | 17.3%), and middle school (39 | 17.3%).
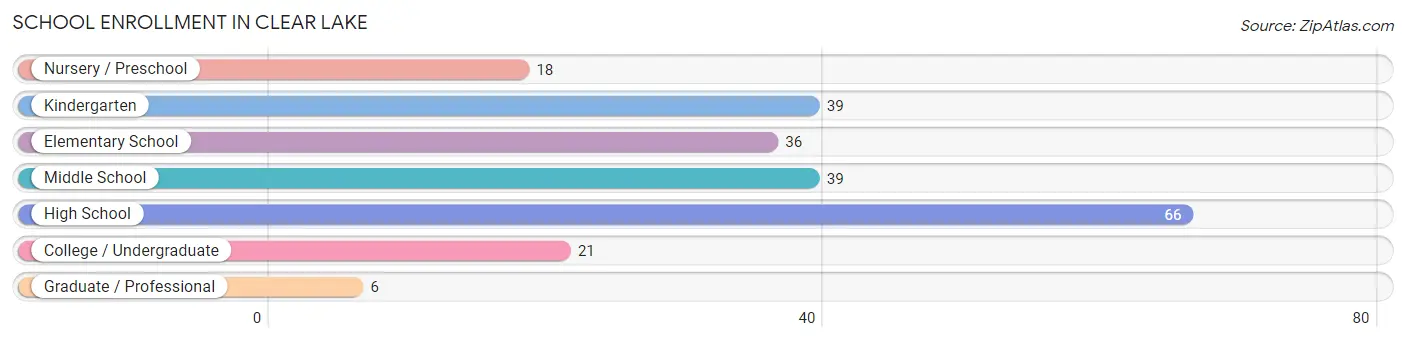
| School Level | # Students | % Students |
| Nursery / Preschool | 18 | 8.0% |
| Kindergarten | 39 | 17.3% |
| Elementary School | 36 | 16.0% |
| Middle School | 39 | 17.3% |
| High School | 66 | 29.3% |
| College / Undergraduate | 21 | 9.3% |
| Graduate / Professional | 6 | 2.7% |
| Total | 225 | 100.0% |
School Enrollment by Age by Funding Source in Clear Lake
Out of a total of 225 students who are enrolled in schools in Clear Lake, 4 (1.8%) attend a private institution, while the remaining 221 (98.2%) are enrolled in public schools. The age group of 10 to 14 year olds has the highest likelihood of being enrolled in private schools, with 4 (5.9% in the age bracket) enrolled. Conversely, the age group of 3 to 4 year olds has the lowest likelihood of being enrolled in a private school, with 4 (100.0% in the age bracket) attending a public institution.
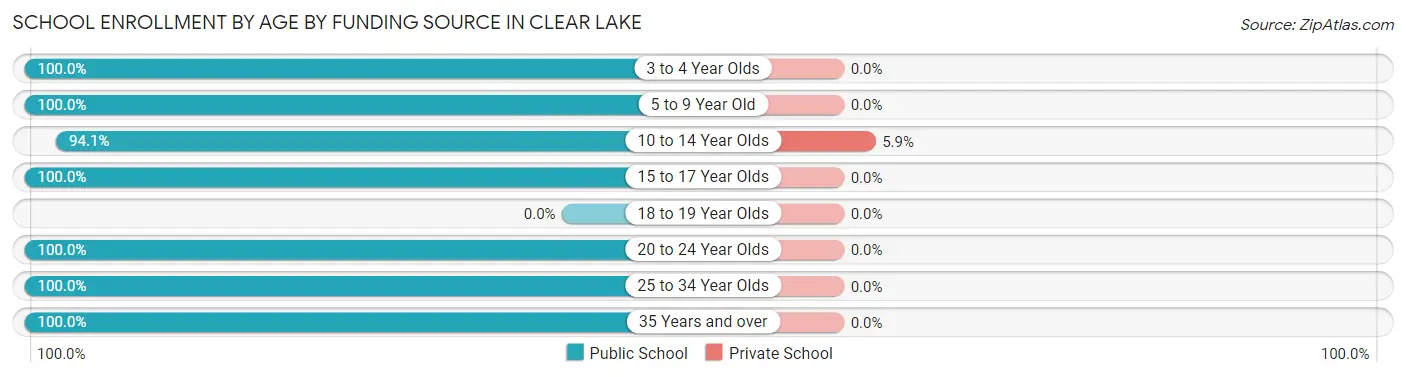
| Age Bracket | Public School | Private School |
| 3 to 4 Year Olds | 4 (100.0%) | 0 (0.0%) |
| 5 to 9 Year Old | 89 (100.0%) | 0 (0.0%) |
| 10 to 14 Year Olds | 64 (94.1%) | 4 (5.9%) |
| 15 to 17 Year Olds | 37 (100.0%) | 0 (0.0%) |
| 18 to 19 Year Olds | 0 (0.0%) | 0 (0.0%) |
| 20 to 24 Year Olds | 14 (100.0%) | 0 (0.0%) |
| 25 to 34 Year Olds | 6 (100.0%) | 0 (0.0%) |
| 35 Years and over | 7 (100.0%) | 0 (0.0%) |
| Total | 221 (98.2%) | 4 (1.8%) |
Educational Attainment by Field of Study in Clear Lake
Arts & humanities (25 | 27.8%), business (21 | 23.3%), engineering (11 | 12.2%), education (10 | 11.1%), and bio, nature & agricultural (7 | 7.8%) are the most common fields of study among 90 individuals in Clear Lake who have obtained a bachelor's degree or higher.
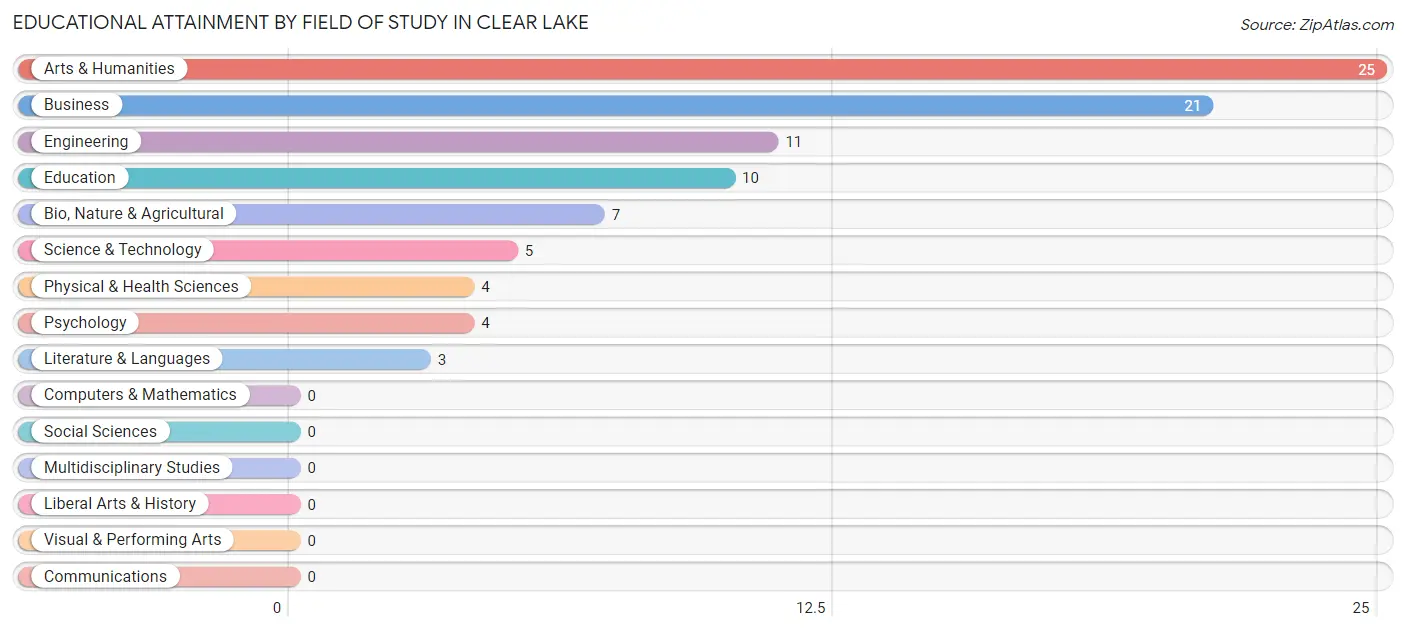
| Field of Study | # Graduates | % Graduates |
| Computers & Mathematics | 0 | 0.0% |
| Bio, Nature & Agricultural | 7 | 7.8% |
| Physical & Health Sciences | 4 | 4.4% |
| Psychology | 4 | 4.4% |
| Social Sciences | 0 | 0.0% |
| Engineering | 11 | 12.2% |
| Multidisciplinary Studies | 0 | 0.0% |
| Science & Technology | 5 | 5.6% |
| Business | 21 | 23.3% |
| Education | 10 | 11.1% |
| Literature & Languages | 3 | 3.3% |
| Liberal Arts & History | 0 | 0.0% |
| Visual & Performing Arts | 0 | 0.0% |
| Communications | 0 | 0.0% |
| Arts & Humanities | 25 | 27.8% |
| Total | 90 | 100.0% |
Transportation & Commute in Clear Lake
Vehicle Availability by Sex in Clear Lake
The most prevalent vehicle ownership categories in Clear Lake are males with 2 vehicles (79, accounting for 31.2%) and females with 2 vehicles (88, making up 33.2%).
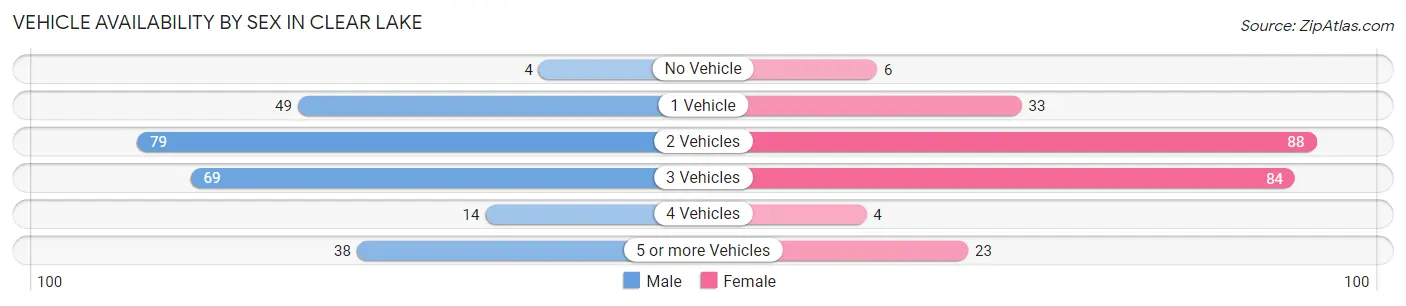
| Vehicles Available | Male | Female |
| No Vehicle | 4 (1.6%) | 6 (2.5%) |
| 1 Vehicle | 49 (19.4%) | 33 (13.9%) |
| 2 Vehicles | 79 (31.2%) | 88 (37.0%) |
| 3 Vehicles | 69 (27.3%) | 84 (35.3%) |
| 4 Vehicles | 14 (5.5%) | 4 (1.7%) |
| 5 or more Vehicles | 38 (15.0%) | 23 (9.7%) |
| Total | 253 (100.0%) | 238 (100.0%) |
Commute Time in Clear Lake
The most frequently occuring commute durations in Clear Lake are 5 to 9 minutes (162 commuters, 34.3%), less than 5 minutes (58 commuters, 12.3%), and 10 to 14 minutes (44 commuters, 9.3%).
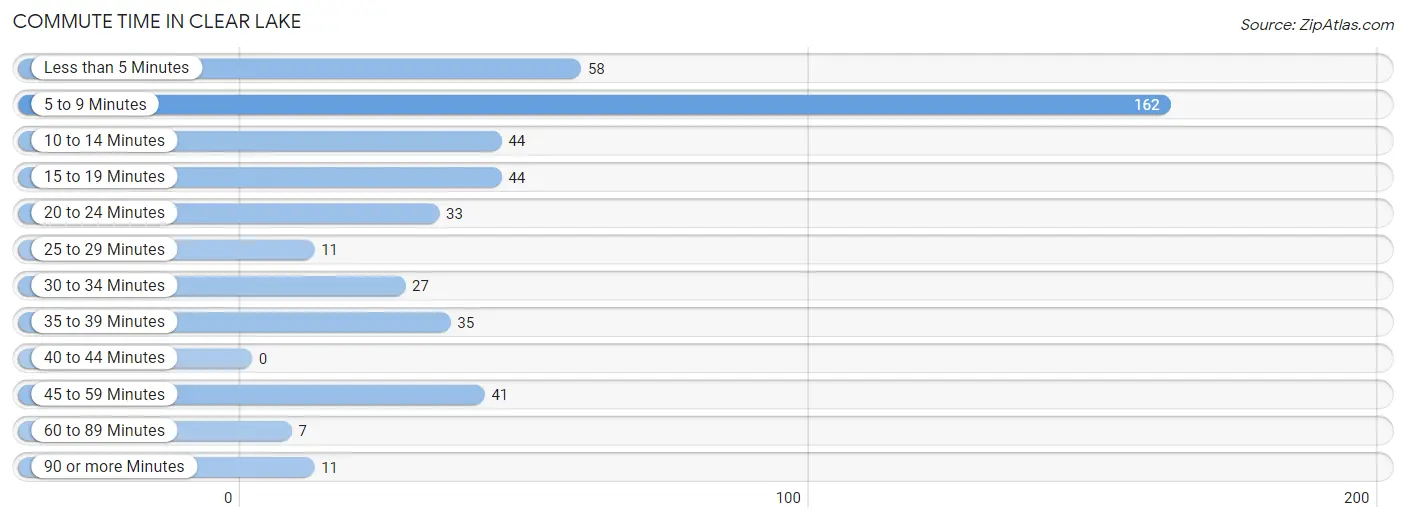
| Commute Time | # Commuters | % Commuters |
| Less than 5 Minutes | 58 | 12.3% |
| 5 to 9 Minutes | 162 | 34.3% |
| 10 to 14 Minutes | 44 | 9.3% |
| 15 to 19 Minutes | 44 | 9.3% |
| 20 to 24 Minutes | 33 | 7.0% |
| 25 to 29 Minutes | 11 | 2.3% |
| 30 to 34 Minutes | 27 | 5.7% |
| 35 to 39 Minutes | 35 | 7.4% |
| 40 to 44 Minutes | 0 | 0.0% |
| 45 to 59 Minutes | 41 | 8.7% |
| 60 to 89 Minutes | 7 | 1.5% |
| 90 or more Minutes | 11 | 2.3% |
Commute Time by Sex in Clear Lake
The most common commute times in Clear Lake are 5 to 9 minutes (95 commuters, 39.4%) for males and 5 to 9 minutes (67 commuters, 28.9%) for females.
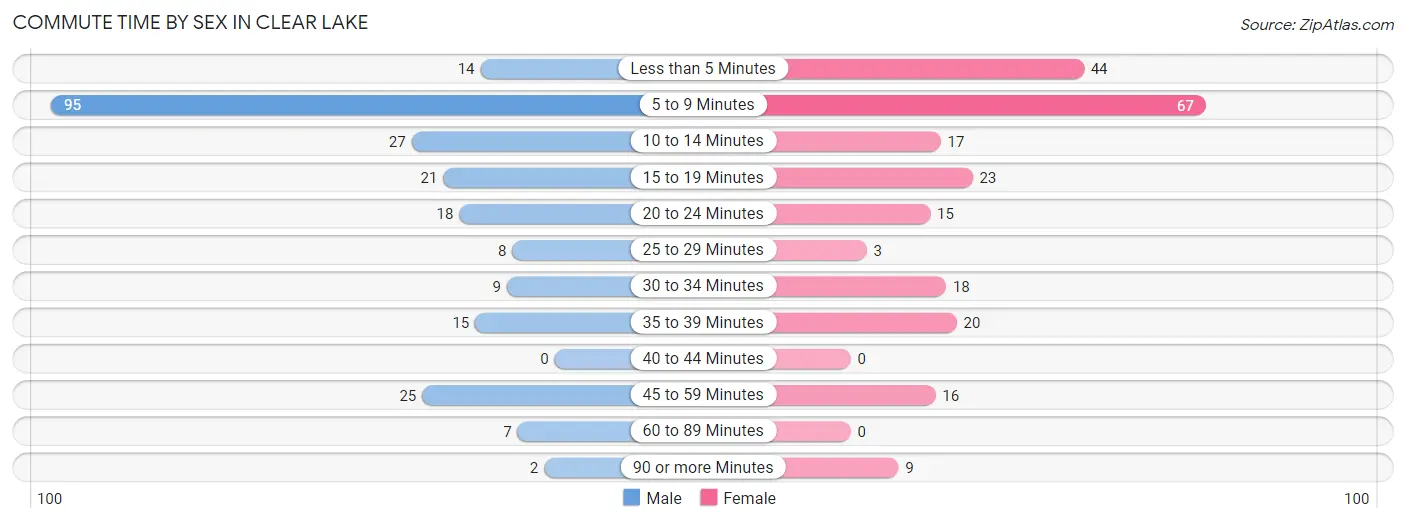
| Commute Time | Male | Female |
| Less than 5 Minutes | 14 (5.8%) | 44 (19.0%) |
| 5 to 9 Minutes | 95 (39.4%) | 67 (28.9%) |
| 10 to 14 Minutes | 27 (11.2%) | 17 (7.3%) |
| 15 to 19 Minutes | 21 (8.7%) | 23 (9.9%) |
| 20 to 24 Minutes | 18 (7.5%) | 15 (6.5%) |
| 25 to 29 Minutes | 8 (3.3%) | 3 (1.3%) |
| 30 to 34 Minutes | 9 (3.7%) | 18 (7.8%) |
| 35 to 39 Minutes | 15 (6.2%) | 20 (8.6%) |
| 40 to 44 Minutes | 0 (0.0%) | 0 (0.0%) |
| 45 to 59 Minutes | 25 (10.4%) | 16 (6.9%) |
| 60 to 89 Minutes | 7 (2.9%) | 0 (0.0%) |
| 90 or more Minutes | 2 (0.8%) | 9 (3.9%) |
Time of Departure to Work by Sex in Clear Lake
The most frequent times of departure to work in Clear Lake are 7:30 AM to 7:59 AM (56, 23.2%) for males and 7:30 AM to 7:59 AM (72, 31.0%) for females.
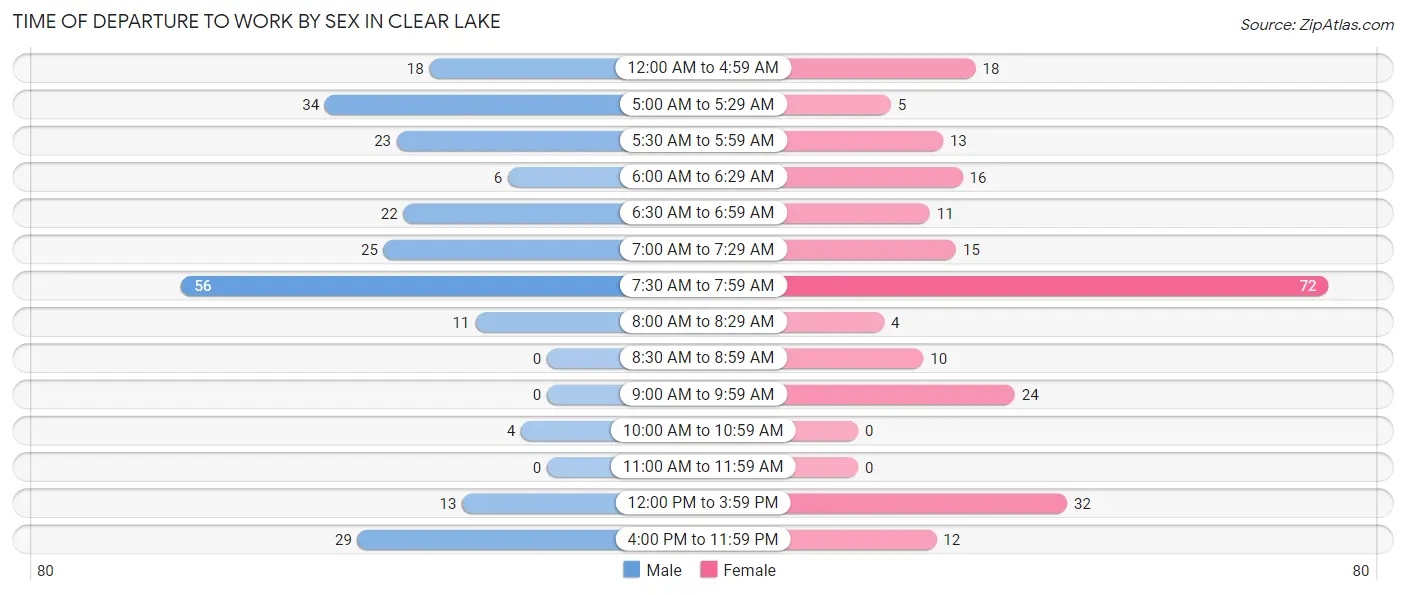
| Time of Departure | Male | Female |
| 12:00 AM to 4:59 AM | 18 (7.5%) | 18 (7.8%) |
| 5:00 AM to 5:29 AM | 34 (14.1%) | 5 (2.2%) |
| 5:30 AM to 5:59 AM | 23 (9.5%) | 13 (5.6%) |
| 6:00 AM to 6:29 AM | 6 (2.5%) | 16 (6.9%) |
| 6:30 AM to 6:59 AM | 22 (9.1%) | 11 (4.7%) |
| 7:00 AM to 7:29 AM | 25 (10.4%) | 15 (6.5%) |
| 7:30 AM to 7:59 AM | 56 (23.2%) | 72 (31.0%) |
| 8:00 AM to 8:29 AM | 11 (4.6%) | 4 (1.7%) |
| 8:30 AM to 8:59 AM | 0 (0.0%) | 10 (4.3%) |
| 9:00 AM to 9:59 AM | 0 (0.0%) | 24 (10.3%) |
| 10:00 AM to 10:59 AM | 4 (1.7%) | 0 (0.0%) |
| 11:00 AM to 11:59 AM | 0 (0.0%) | 0 (0.0%) |
| 12:00 PM to 3:59 PM | 13 (5.4%) | 32 (13.8%) |
| 4:00 PM to 11:59 PM | 29 (12.0%) | 12 (5.2%) |
| Total | 241 (100.0%) | 232 (100.0%) |
Housing Occupancy in Clear Lake
Occupancy by Ownership in Clear Lake
Of the total 437 dwellings in Clear Lake, owner-occupied units account for 324 (74.1%), while renter-occupied units make up 113 (25.9%).
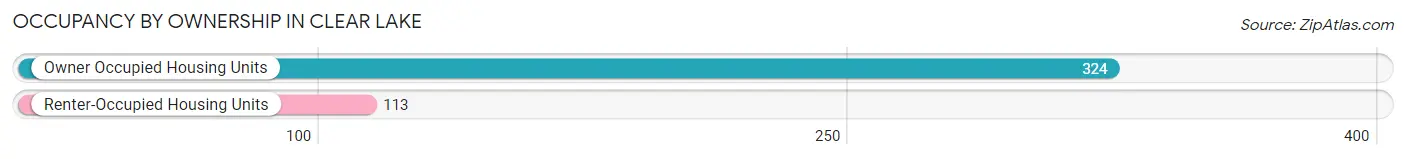
| Occupancy | # Housing Units | % Housing Units |
| Owner Occupied Housing Units | 324 | 74.1% |
| Renter-Occupied Housing Units | 113 | 25.9% |
| Total Occupied Housing Units | 437 | 100.0% |
Occupancy by Household Size in Clear Lake
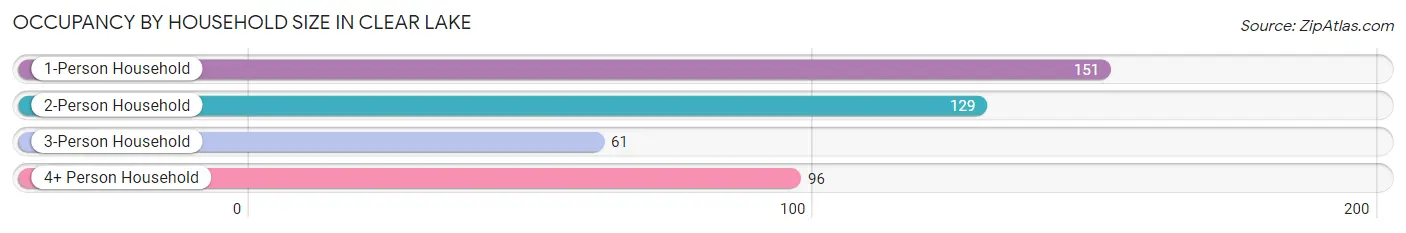
| Household Size | # Housing Units | % Housing Units |
| 1-Person Household | 151 | 34.5% |
| 2-Person Household | 129 | 29.5% |
| 3-Person Household | 61 | 14.0% |
| 4+ Person Household | 96 | 22.0% |
| Total Housing Units | 437 | 100.0% |
Occupancy by Ownership by Household Size in Clear Lake
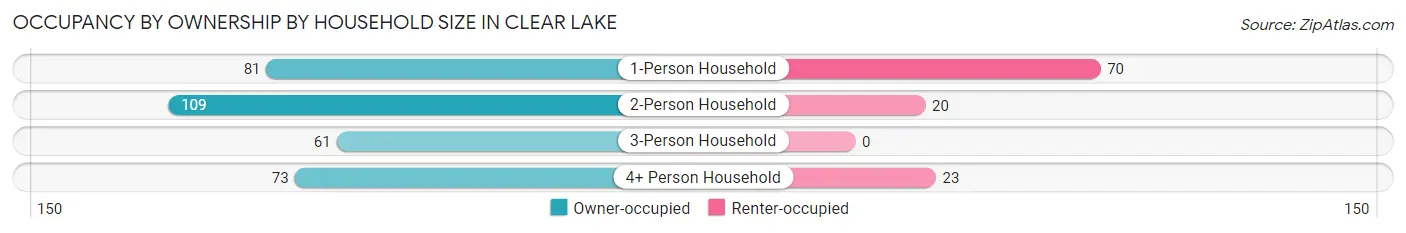
| Household Size | Owner-occupied | Renter-occupied |
| 1-Person Household | 81 (53.6%) | 70 (46.4%) |
| 2-Person Household | 109 (84.5%) | 20 (15.5%) |
| 3-Person Household | 61 (100.0%) | 0 (0.0%) |
| 4+ Person Household | 73 (76.0%) | 23 (24.0%) |
| Total Housing Units | 324 (74.1%) | 113 (25.9%) |
Occupancy by Educational Attainment in Clear Lake
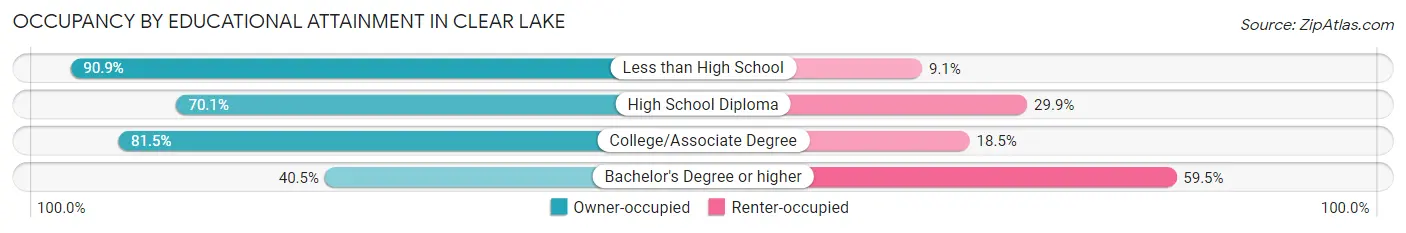
| Household Size | Owner-occupied | Renter-occupied |
| Less than High School | 30 (90.9%) | 3 (9.1%) |
| High School Diploma | 110 (70.1%) | 47 (29.9%) |
| College/Associate Degree | 167 (81.5%) | 38 (18.5%) |
| Bachelor's Degree or higher | 17 (40.5%) | 25 (59.5%) |
Occupancy by Age of Householder in Clear Lake
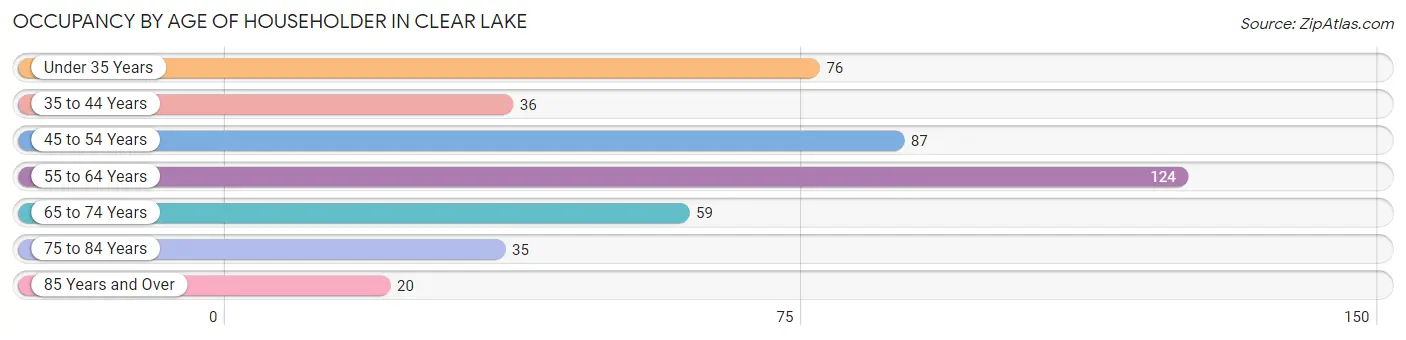
| Age Bracket | # Households | % Households |
| Under 35 Years | 76 | 17.4% |
| 35 to 44 Years | 36 | 8.2% |
| 45 to 54 Years | 87 | 19.9% |
| 55 to 64 Years | 124 | 28.4% |
| 65 to 74 Years | 59 | 13.5% |
| 75 to 84 Years | 35 | 8.0% |
| 85 Years and Over | 20 | 4.6% |
| Total | 437 | 100.0% |
Housing Finances in Clear Lake
Median Income by Occupancy in Clear Lake
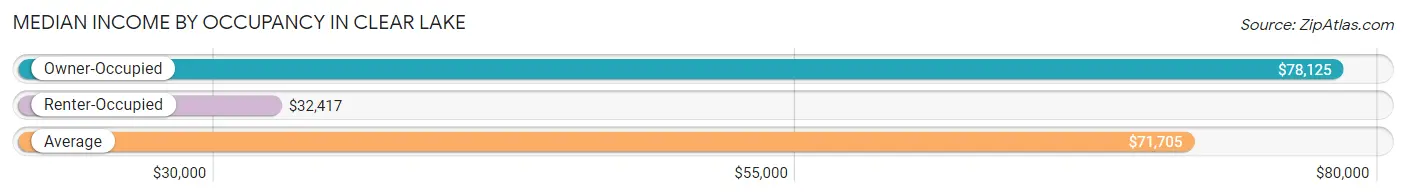
| Occupancy Type | # Households | Median Income |
| Owner-Occupied | 324 (74.1%) | $78,125 |
| Renter-Occupied | 113 (25.9%) | $32,417 |
| Average | 437 (100.0%) | $71,705 |
Occupancy by Householder Income Bracket in Clear Lake
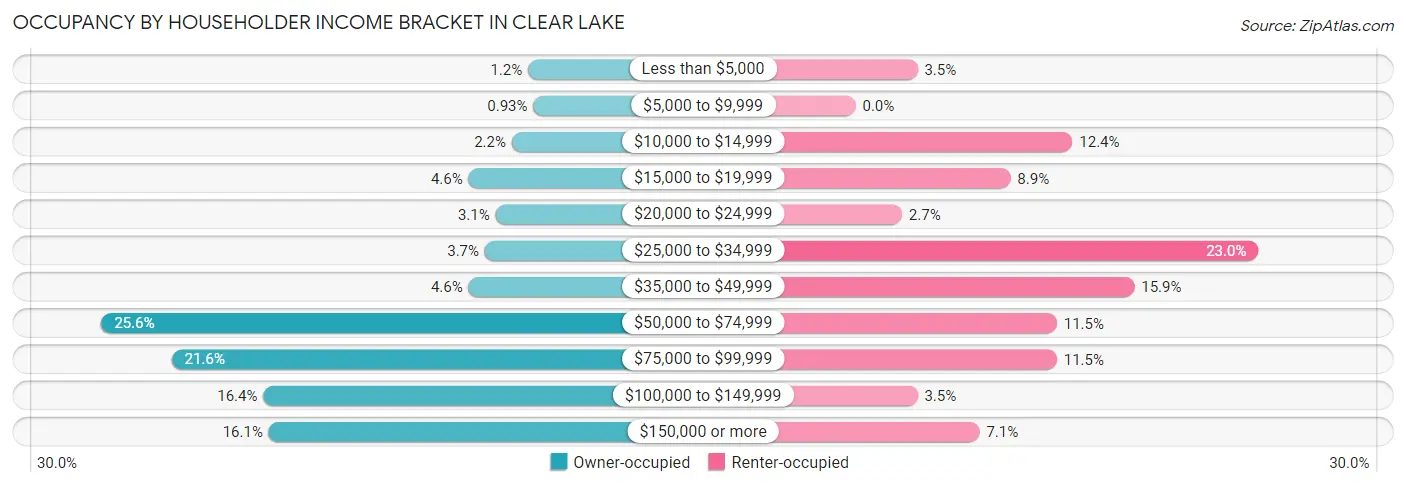
| Income Bracket | Owner-occupied | Renter-occupied |
| Less than $5,000 | 4 (1.2%) | 4 (3.5%) |
| $5,000 to $9,999 | 3 (0.9%) | 0 (0.0%) |
| $10,000 to $14,999 | 7 (2.2%) | 14 (12.4%) |
| $15,000 to $19,999 | 15 (4.6%) | 10 (8.8%) |
| $20,000 to $24,999 | 10 (3.1%) | 3 (2.6%) |
| $25,000 to $34,999 | 12 (3.7%) | 26 (23.0%) |
| $35,000 to $49,999 | 15 (4.6%) | 18 (15.9%) |
| $50,000 to $74,999 | 83 (25.6%) | 13 (11.5%) |
| $75,000 to $99,999 | 70 (21.6%) | 13 (11.5%) |
| $100,000 to $149,999 | 53 (16.4%) | 4 (3.5%) |
| $150,000 or more | 52 (16.1%) | 8 (7.1%) |
| Total | 324 (100.0%) | 113 (100.0%) |
Monthly Housing Cost Tiers in Clear Lake
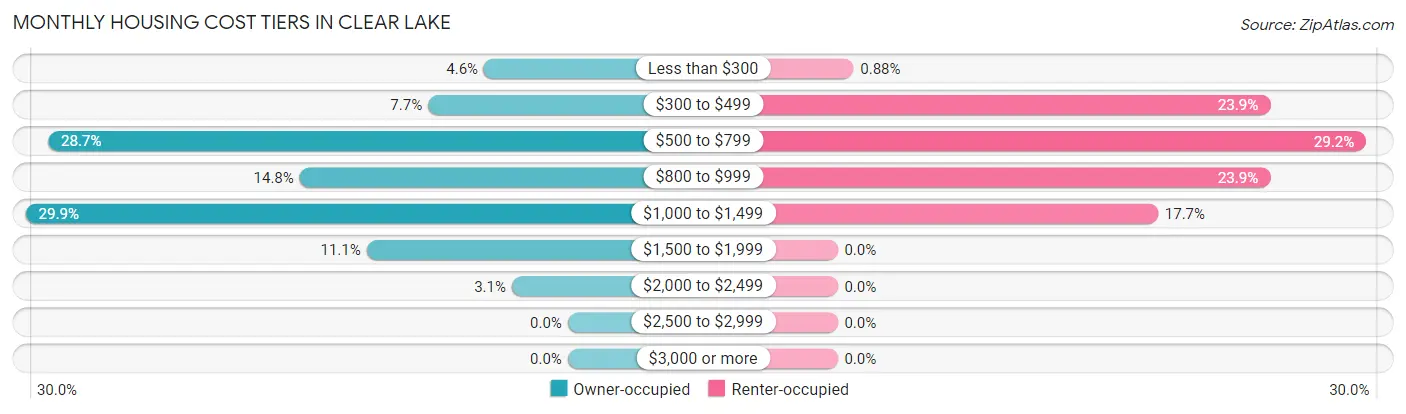
| Monthly Cost | Owner-occupied | Renter-occupied |
| Less than $300 | 15 (4.6%) | 1 (0.9%) |
| $300 to $499 | 25 (7.7%) | 27 (23.9%) |
| $500 to $799 | 93 (28.7%) | 33 (29.2%) |
| $800 to $999 | 48 (14.8%) | 27 (23.9%) |
| $1,000 to $1,499 | 97 (29.9%) | 20 (17.7%) |
| $1,500 to $1,999 | 36 (11.1%) | 0 (0.0%) |
| $2,000 to $2,499 | 10 (3.1%) | 0 (0.0%) |
| $2,500 to $2,999 | 0 (0.0%) | 0 (0.0%) |
| $3,000 or more | 0 (0.0%) | 0 (0.0%) |
| Total | 324 (100.0%) | 113 (100.0%) |
Physical Housing Characteristics in Clear Lake
Housing Structures in Clear Lake
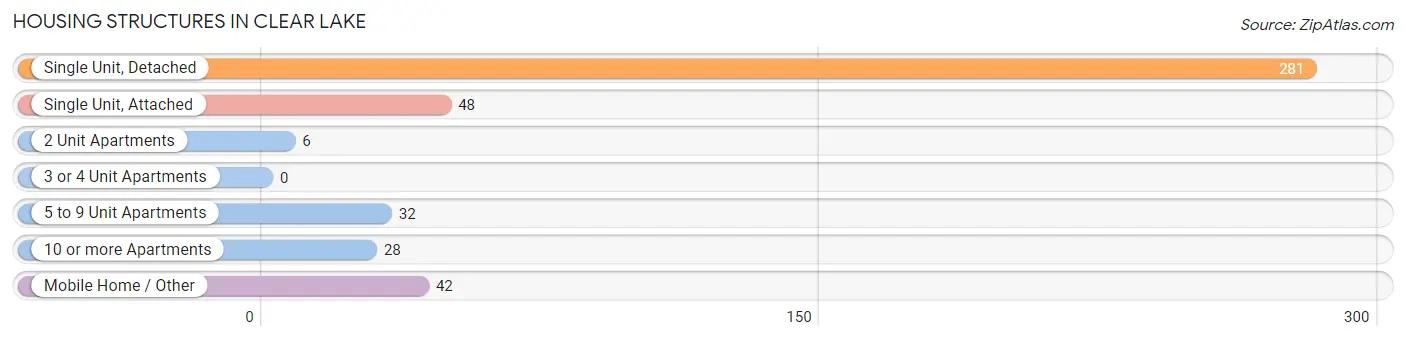
| Structure Type | # Housing Units | % Housing Units |
| Single Unit, Detached | 281 | 64.3% |
| Single Unit, Attached | 48 | 11.0% |
| 2 Unit Apartments | 6 | 1.4% |
| 3 or 4 Unit Apartments | 0 | 0.0% |
| 5 to 9 Unit Apartments | 32 | 7.3% |
| 10 or more Apartments | 28 | 6.4% |
| Mobile Home / Other | 42 | 9.6% |
| Total | 437 | 100.0% |
Housing Structures by Occupancy in Clear Lake
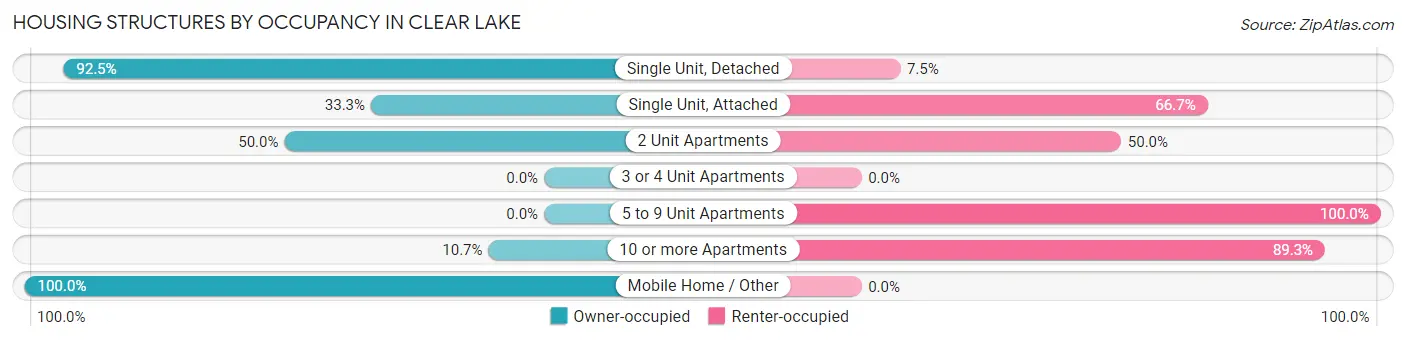
| Structure Type | Owner-occupied | Renter-occupied |
| Single Unit, Detached | 260 (92.5%) | 21 (7.5%) |
| Single Unit, Attached | 16 (33.3%) | 32 (66.7%) |
| 2 Unit Apartments | 3 (50.0%) | 3 (50.0%) |
| 3 or 4 Unit Apartments | 0 (0.0%) | 0 (0.0%) |
| 5 to 9 Unit Apartments | 0 (0.0%) | 32 (100.0%) |
| 10 or more Apartments | 3 (10.7%) | 25 (89.3%) |
| Mobile Home / Other | 42 (100.0%) | 0 (0.0%) |
| Total | 324 (74.1%) | 113 (25.9%) |
Housing Structures by Number of Rooms in Clear Lake
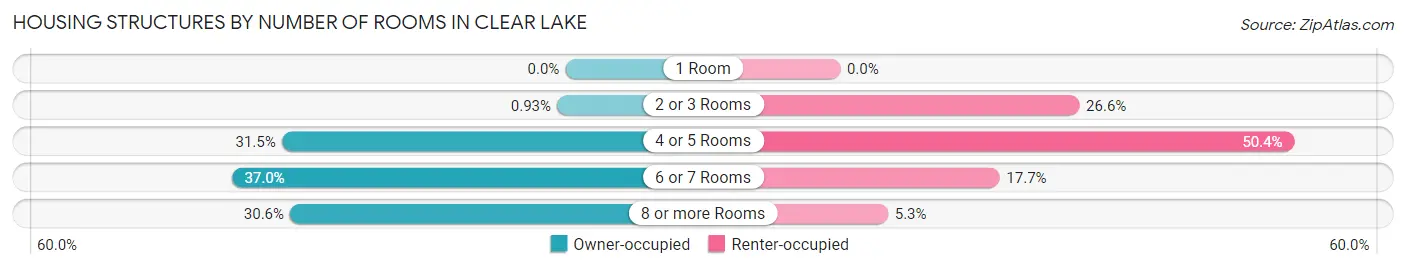
| Number of Rooms | Owner-occupied | Renter-occupied |
| 1 Room | 0 (0.0%) | 0 (0.0%) |
| 2 or 3 Rooms | 3 (0.9%) | 30 (26.6%) |
| 4 or 5 Rooms | 102 (31.5%) | 57 (50.4%) |
| 6 or 7 Rooms | 120 (37.0%) | 20 (17.7%) |
| 8 or more Rooms | 99 (30.6%) | 6 (5.3%) |
| Total | 324 (100.0%) | 113 (100.0%) |
Housing Structure by Heating Type in Clear Lake
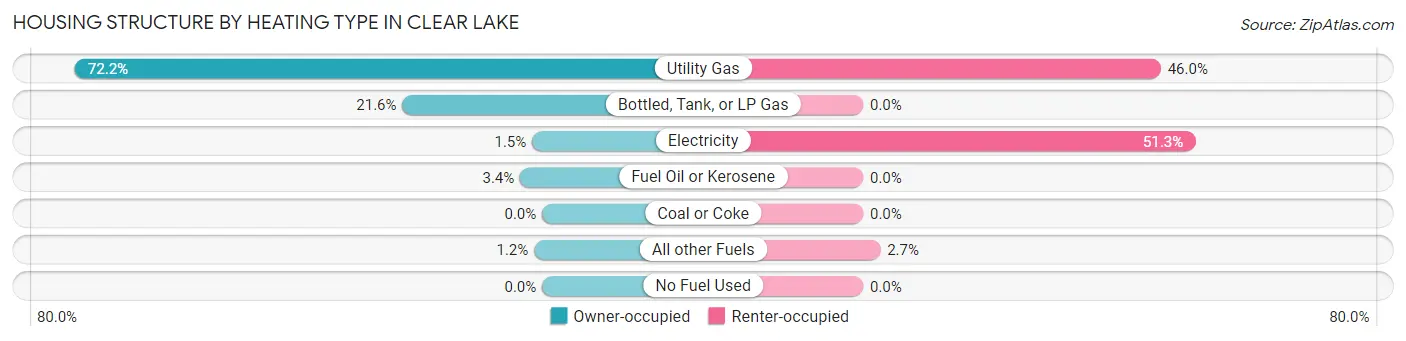
| Heating Type | Owner-occupied | Renter-occupied |
| Utility Gas | 234 (72.2%) | 52 (46.0%) |
| Bottled, Tank, or LP Gas | 70 (21.6%) | 0 (0.0%) |
| Electricity | 5 (1.5%) | 58 (51.3%) |
| Fuel Oil or Kerosene | 11 (3.4%) | 0 (0.0%) |
| Coal or Coke | 0 (0.0%) | 0 (0.0%) |
| All other Fuels | 4 (1.2%) | 3 (2.6%) |
| No Fuel Used | 0 (0.0%) | 0 (0.0%) |
| Total | 324 (100.0%) | 113 (100.0%) |
Household Vehicle Usage in Clear Lake
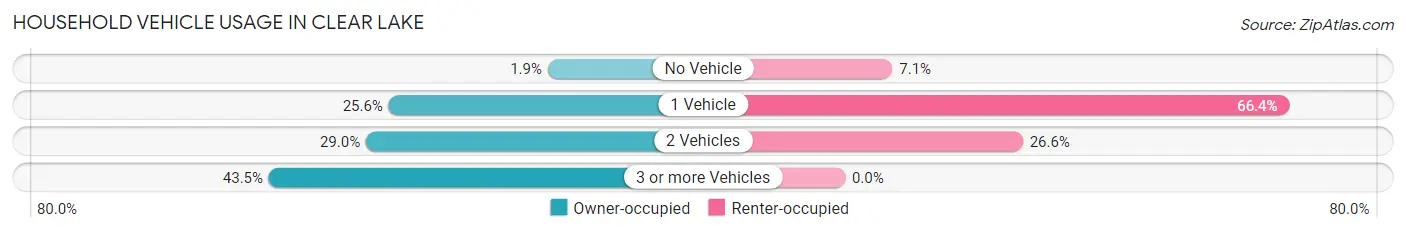
| Vehicles per Household | Owner-occupied | Renter-occupied |
| No Vehicle | 6 (1.8%) | 8 (7.1%) |
| 1 Vehicle | 83 (25.6%) | 75 (66.4%) |
| 2 Vehicles | 94 (29.0%) | 30 (26.6%) |
| 3 or more Vehicles | 141 (43.5%) | 0 (0.0%) |
| Total | 324 (100.0%) | 113 (100.0%) |
Real Estate & Mortgages in Clear Lake
Real Estate and Mortgage Overview in Clear Lake
| Characteristic | Without Mortgage | With Mortgage |
| Housing Units | 136 | 188 |
| Median Property Value | $200,000 | $160,900 |
| Median Household Income | $85,417 | $10 |
| Monthly Housing Costs | $541 | $0 |
| Real Estate Taxes | $2,292 | $0 |
Property Value by Mortgage Status in Clear Lake
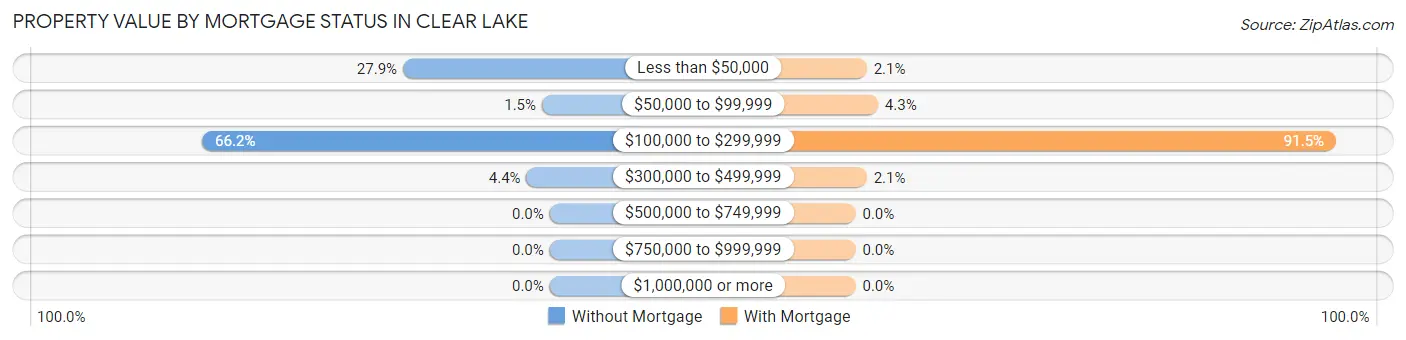
| Property Value | Without Mortgage | With Mortgage |
| Less than $50,000 | 38 (27.9%) | 4 (2.1%) |
| $50,000 to $99,999 | 2 (1.5%) | 8 (4.3%) |
| $100,000 to $299,999 | 90 (66.2%) | 172 (91.5%) |
| $300,000 to $499,999 | 6 (4.4%) | 4 (2.1%) |
| $500,000 to $749,999 | 0 (0.0%) | 0 (0.0%) |
| $750,000 to $999,999 | 0 (0.0%) | 0 (0.0%) |
| $1,000,000 or more | 0 (0.0%) | 0 (0.0%) |
| Total | 136 (100.0%) | 188 (100.0%) |
Household Income by Mortgage Status in Clear Lake
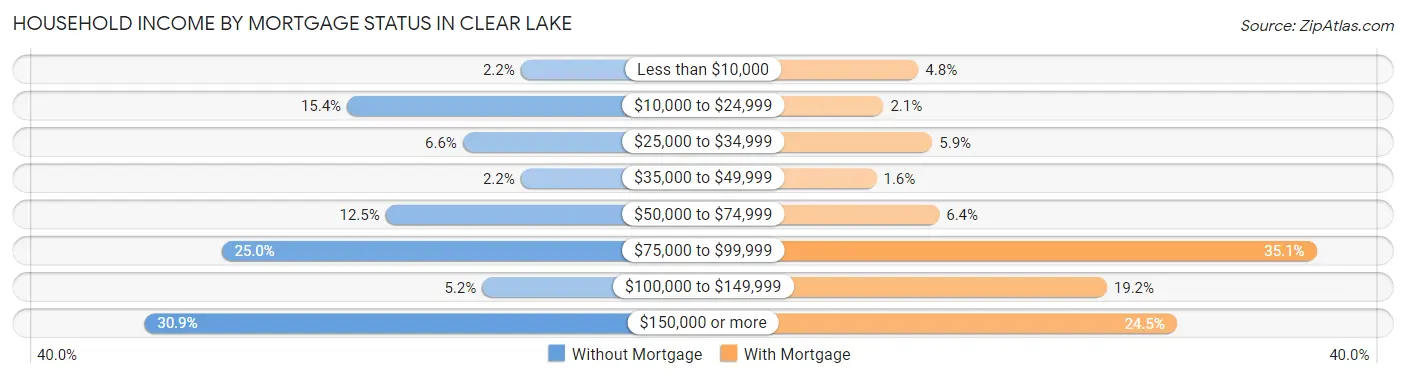
| Household Income | Without Mortgage | With Mortgage |
| Less than $10,000 | 3 (2.2%) | 9 (4.8%) |
| $10,000 to $24,999 | 21 (15.4%) | 4 (2.1%) |
| $25,000 to $34,999 | 9 (6.6%) | 11 (5.9%) |
| $35,000 to $49,999 | 3 (2.2%) | 3 (1.6%) |
| $50,000 to $74,999 | 17 (12.5%) | 12 (6.4%) |
| $75,000 to $99,999 | 34 (25.0%) | 66 (35.1%) |
| $100,000 to $149,999 | 7 (5.1%) | 36 (19.2%) |
| $150,000 or more | 42 (30.9%) | 46 (24.5%) |
| Total | 136 (100.0%) | 188 (100.0%) |
Property Value to Household Income Ratio in Clear Lake
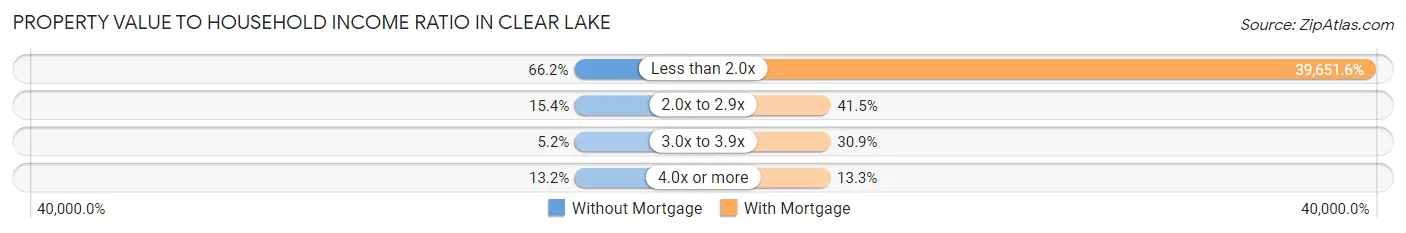
| Value-to-Income Ratio | Without Mortgage | With Mortgage |
| Less than 2.0x | 90 (66.2%) | 74,545 (39,651.6%) |
| 2.0x to 2.9x | 21 (15.4%) | 78 (41.5%) |
| 3.0x to 3.9x | 7 (5.1%) | 58 (30.8%) |
| 4.0x or more | 18 (13.2%) | 25 (13.3%) |
| Total | 136 (100.0%) | 188 (100.0%) |
Real Estate Taxes by Mortgage Status in Clear Lake
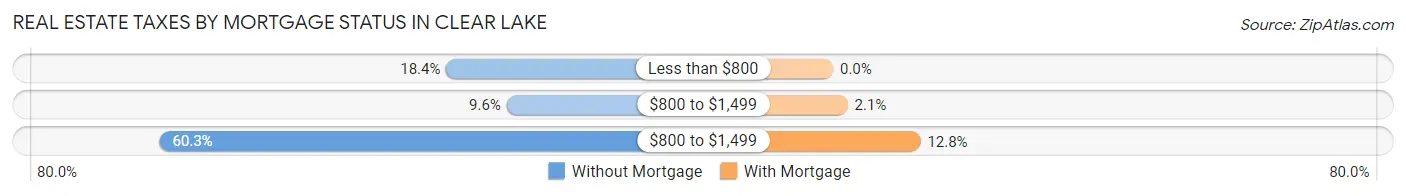
| Property Taxes | Without Mortgage | With Mortgage |
| Less than $800 | 25 (18.4%) | 0 (0.0%) |
| $800 to $1,499 | 13 (9.6%) | 4 (2.1%) |
| $800 to $1,499 | 82 (60.3%) | 24 (12.8%) |
| Total | 136 (100.0%) | 188 (100.0%) |
Health & Disability in Clear Lake
Health Insurance Coverage by Age in Clear Lake
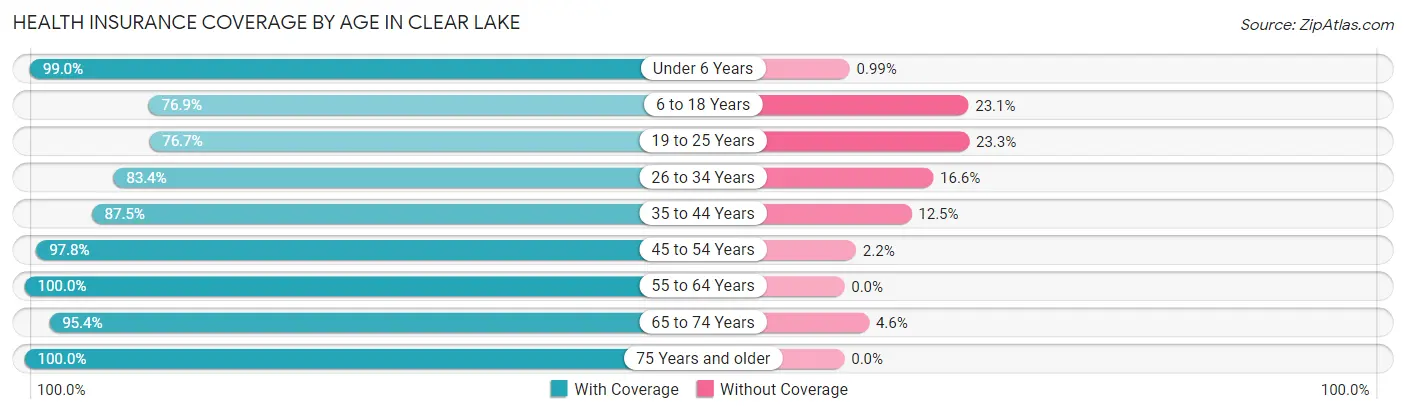
| Age Bracket | With Coverage | Without Coverage |
| Under 6 Years | 100 (99.0%) | 1 (1.0%) |
| 6 to 18 Years | 133 (76.9%) | 40 (23.1%) |
| 19 to 25 Years | 33 (76.7%) | 10 (23.3%) |
| 26 to 34 Years | 131 (83.4%) | 26 (16.6%) |
| 35 to 44 Years | 98 (87.5%) | 14 (12.5%) |
| 45 to 54 Years | 135 (97.8%) | 3 (2.2%) |
| 55 to 64 Years | 168 (100.0%) | 0 (0.0%) |
| 65 to 74 Years | 83 (95.4%) | 4 (4.6%) |
| 75 Years and older | 69 (100.0%) | 0 (0.0%) |
| Total | 950 (90.6%) | 98 (9.3%) |
Health Insurance Coverage by Citizenship Status in Clear Lake
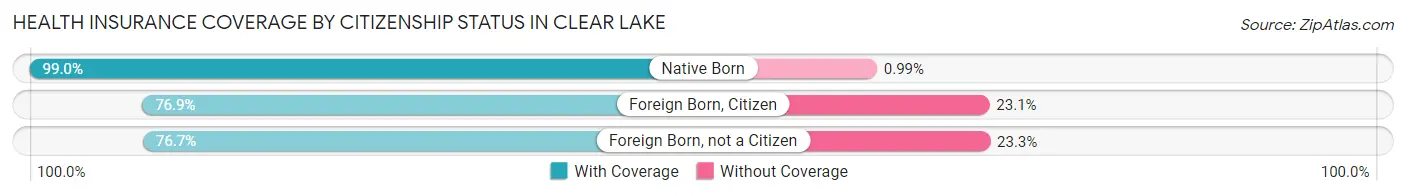
| Citizenship Status | With Coverage | Without Coverage |
| Native Born | 100 (99.0%) | 1 (1.0%) |
| Foreign Born, Citizen | 133 (76.9%) | 40 (23.1%) |
| Foreign Born, not a Citizen | 33 (76.7%) | 10 (23.3%) |
Health Insurance Coverage by Household Income in Clear Lake
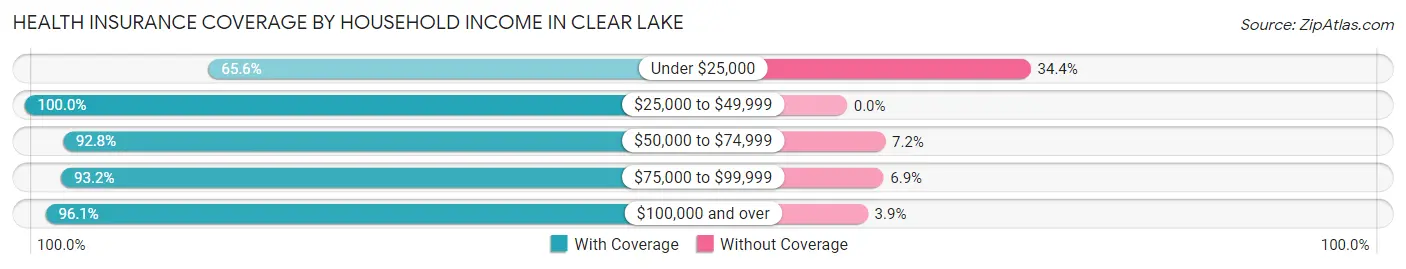
| Household Income | With Coverage | Without Coverage |
| Under $25,000 | 99 (65.6%) | 52 (34.4%) |
| $25,000 to $49,999 | 103 (100.0%) | 0 (0.0%) |
| $50,000 to $74,999 | 220 (92.8%) | 17 (7.2%) |
| $75,000 to $99,999 | 231 (93.1%) | 17 (6.9%) |
| $100,000 and over | 295 (96.1%) | 12 (3.9%) |
Public vs Private Health Insurance Coverage by Age in Clear Lake
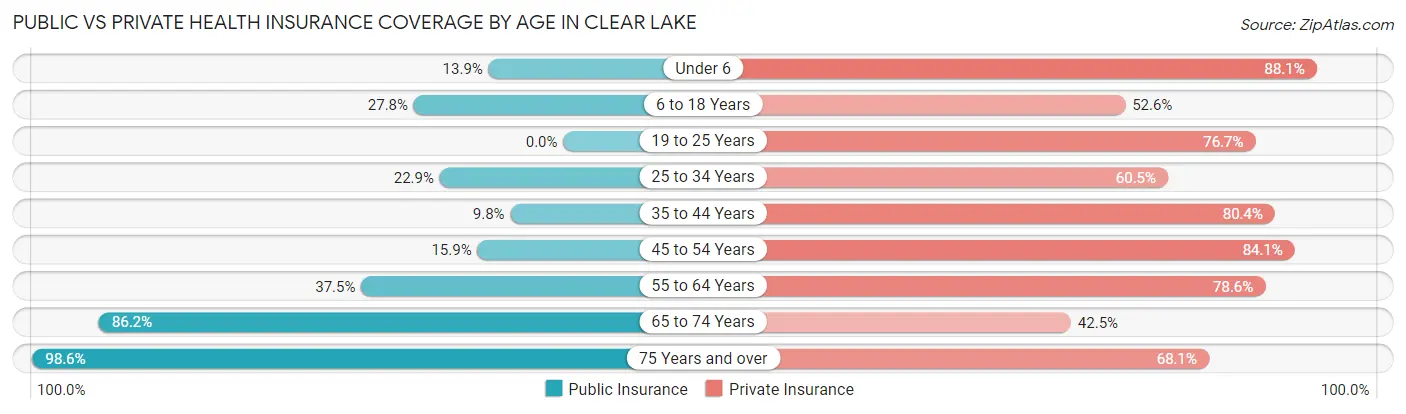
| Age Bracket | Public Insurance | Private Insurance |
| Under 6 | 14 (13.9%) | 89 (88.1%) |
| 6 to 18 Years | 48 (27.8%) | 91 (52.6%) |
| 19 to 25 Years | 0 (0.0%) | 33 (76.7%) |
| 25 to 34 Years | 36 (22.9%) | 95 (60.5%) |
| 35 to 44 Years | 11 (9.8%) | 90 (80.4%) |
| 45 to 54 Years | 22 (15.9%) | 116 (84.1%) |
| 55 to 64 Years | 63 (37.5%) | 132 (78.6%) |
| 65 to 74 Years | 75 (86.2%) | 37 (42.5%) |
| 75 Years and over | 68 (98.6%) | 47 (68.1%) |
| Total | 337 (32.2%) | 730 (69.7%) |
Disability Status by Sex by Age in Clear Lake
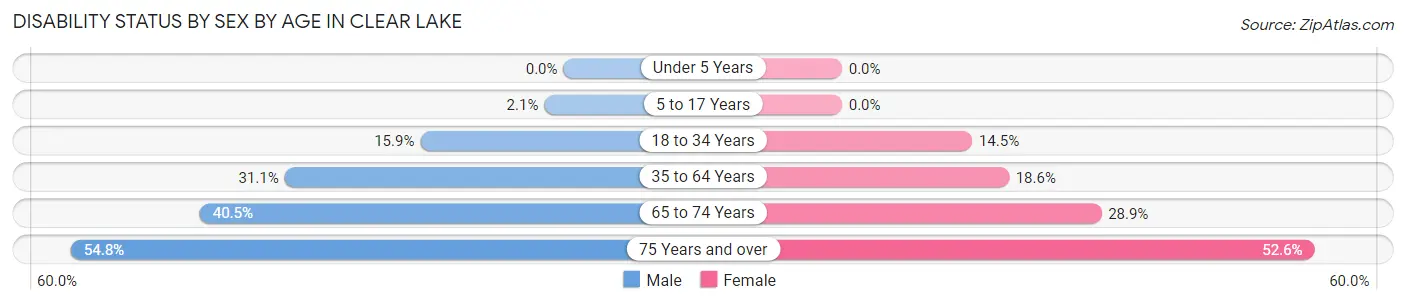
| Age Bracket | Male | Female |
| Under 5 Years | 0 (0.0%) | 0 (0.0%) |
| 5 to 17 Years | 3 (2.1%) | 0 (0.0%) |
| 18 to 34 Years | 11 (15.9%) | 19 (14.5%) |
| 35 to 64 Years | 68 (31.0%) | 37 (18.6%) |
| 65 to 74 Years | 17 (40.5%) | 13 (28.9%) |
| 75 Years and over | 17 (54.8%) | 20 (52.6%) |
Disability Class by Sex by Age in Clear Lake
Disability Class: Hearing Difficulty
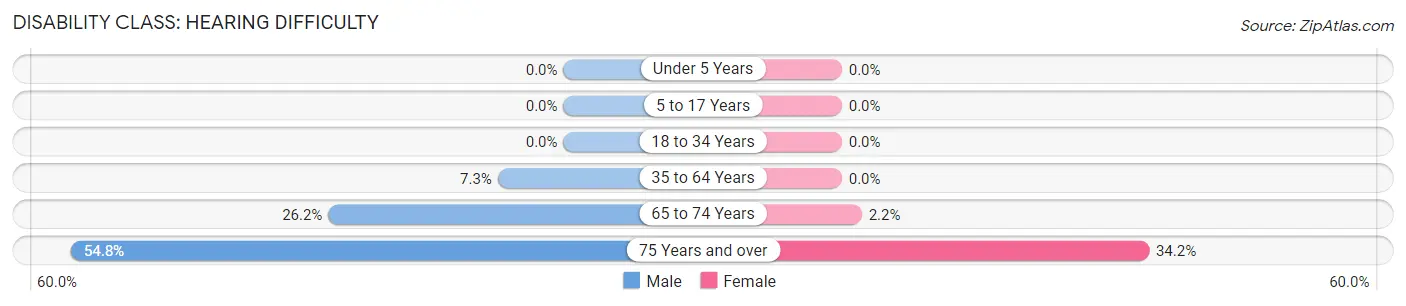
| Age Bracket | Male | Female |
| Under 5 Years | 0 (0.0%) | 0 (0.0%) |
| 5 to 17 Years | 0 (0.0%) | 0 (0.0%) |
| 18 to 34 Years | 0 (0.0%) | 0 (0.0%) |
| 35 to 64 Years | 16 (7.3%) | 0 (0.0%) |
| 65 to 74 Years | 11 (26.2%) | 1 (2.2%) |
| 75 Years and over | 17 (54.8%) | 13 (34.2%) |
Disability Class: Vision Difficulty
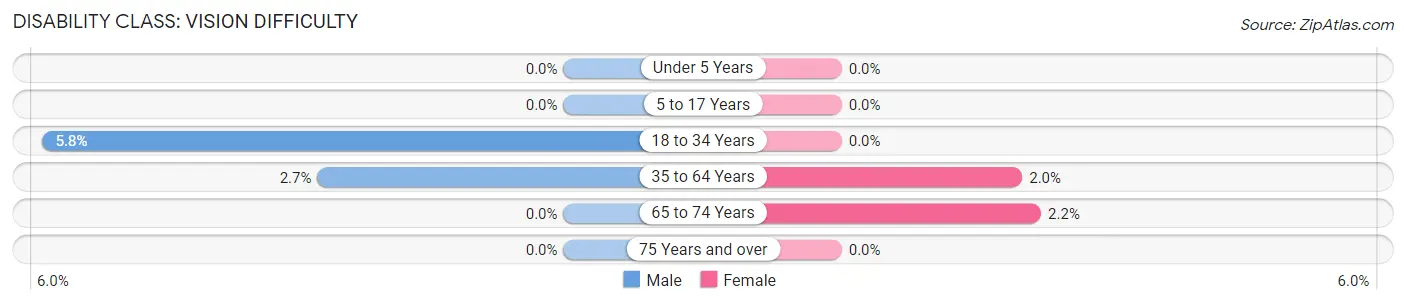
| Age Bracket | Male | Female |
| Under 5 Years | 0 (0.0%) | 0 (0.0%) |
| 5 to 17 Years | 0 (0.0%) | 0 (0.0%) |
| 18 to 34 Years | 4 (5.8%) | 0 (0.0%) |
| 35 to 64 Years | 6 (2.7%) | 4 (2.0%) |
| 65 to 74 Years | 0 (0.0%) | 1 (2.2%) |
| 75 Years and over | 0 (0.0%) | 0 (0.0%) |
Disability Class: Cognitive Difficulty
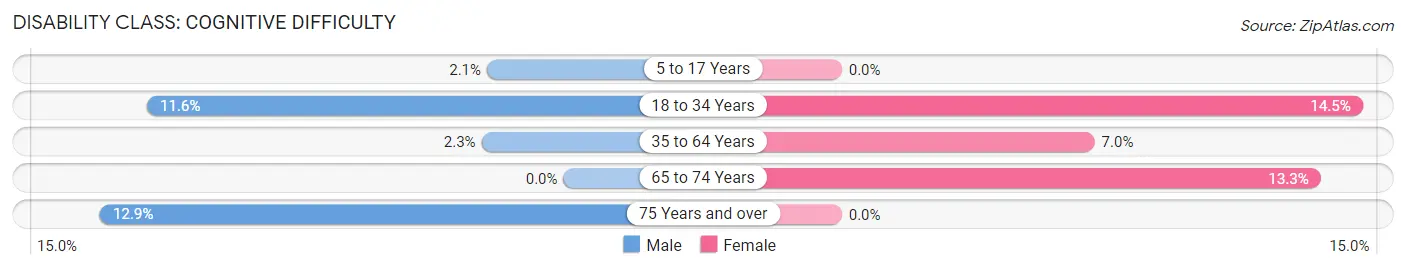
| Age Bracket | Male | Female |
| 5 to 17 Years | 3 (2.1%) | 0 (0.0%) |
| 18 to 34 Years | 8 (11.6%) | 19 (14.5%) |
| 35 to 64 Years | 5 (2.3%) | 14 (7.0%) |
| 65 to 74 Years | 0 (0.0%) | 6 (13.3%) |
| 75 Years and over | 4 (12.9%) | 0 (0.0%) |
Disability Class: Ambulatory Difficulty
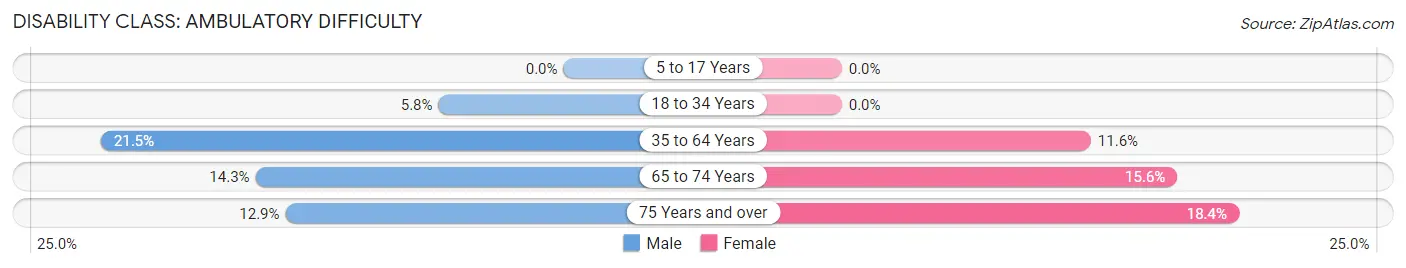
| Age Bracket | Male | Female |
| 5 to 17 Years | 0 (0.0%) | 0 (0.0%) |
| 18 to 34 Years | 4 (5.8%) | 0 (0.0%) |
| 35 to 64 Years | 47 (21.5%) | 23 (11.6%) |
| 65 to 74 Years | 6 (14.3%) | 7 (15.6%) |
| 75 Years and over | 4 (12.9%) | 7 (18.4%) |
Disability Class: Self-Care Difficulty
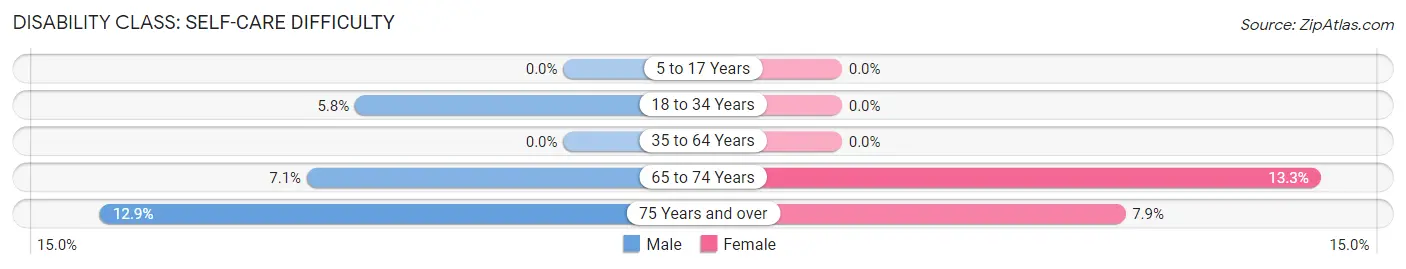
| Age Bracket | Male | Female |
| 5 to 17 Years | 0 (0.0%) | 0 (0.0%) |
| 18 to 34 Years | 4 (5.8%) | 0 (0.0%) |
| 35 to 64 Years | 0 (0.0%) | 0 (0.0%) |
| 65 to 74 Years | 3 (7.1%) | 6 (13.3%) |
| 75 Years and over | 4 (12.9%) | 3 (7.9%) |
Technology Access in Clear Lake
Computing Device Access in Clear Lake
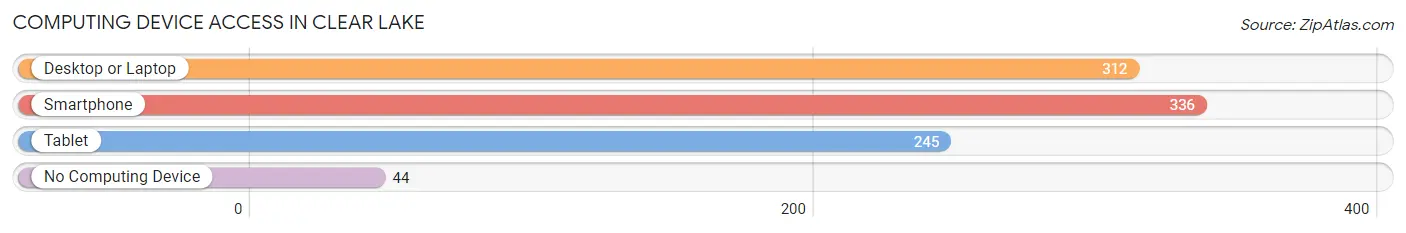
| Device Type | # Households | % Households |
| Desktop or Laptop | 312 | 71.4% |
| Smartphone | 336 | 76.9% |
| Tablet | 245 | 56.1% |
| No Computing Device | 44 | 10.1% |
| Total | 437 | 100.0% |
Internet Access in Clear Lake
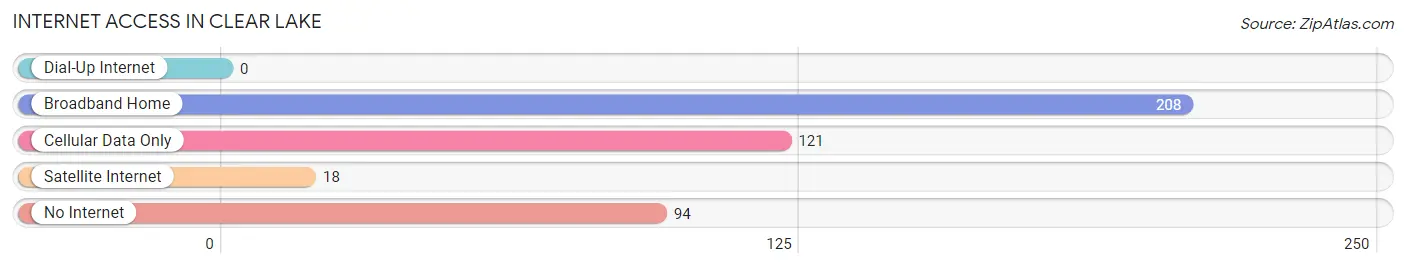
| Internet Type | # Households | % Households |
| Dial-Up Internet | 0 | 0.0% |
| Broadband Home | 208 | 47.6% |
| Cellular Data Only | 121 | 27.7% |
| Satellite Internet | 18 | 4.1% |
| No Internet | 94 | 21.5% |
| Total | 437 | 100.0% |
Clear Lake Summary
History
Clear Lake is a small town located in Polk County, Wisconsin. It was first settled in 1854 by a group of Norwegian immigrants who were looking for a place to settle and farm. The town was originally called Clearwater, but the name was changed to Clear Lake in 1872. The town was officially incorporated in 1876.
The town was originally a farming community, but it soon became a popular tourist destination due to its proximity to the St. Croix River. The town was known for its resorts, which attracted visitors from all over the Midwest. The resorts offered a variety of activities, including fishing, boating, swimming, and camping.
In the early 1900s, the town began to experience a period of growth and development. The railroad arrived in 1906, and the town was connected to the rest of the state. This allowed for the development of businesses and industries, such as sawmills, a creamery, and a cheese factory.
The town continued to grow and prosper throughout the 20th century. In the 1950s, the town was connected to the interstate highway system, which allowed for further growth and development. The town also experienced a population boom in the 1960s and 1970s, as people moved to the area for its natural beauty and recreational opportunities.
Geography
Clear Lake is located in Polk County, Wisconsin. It is situated on the banks of the St. Croix River, which forms the border between Wisconsin and Minnesota. The town is located about 25 miles north of the city of St. Paul, Minnesota.
The town is surrounded by rolling hills and forests, and is home to several lakes, including Clear Lake, which is the largest lake in the area. The town is also home to several parks, including Clear Lake State Park, which offers camping, fishing, and other recreational activities.
The town has a total area of 4.2 square miles, all of which is land. The town has a humid continental climate, with cold winters and warm summers.
Economy
Clear Lake’s economy is largely based on tourism and recreation. The town is home to several resorts, which attract visitors from all over the Midwest. The town is also home to several parks, which offer camping, fishing, and other recreational activities.
The town is also home to several businesses, including sawmills, a creamery, and a cheese factory. The town is also home to several small businesses, such as restaurants, shops, and other services.
Demographics
As of the 2010 census, the town had a population of 1,845. The racial makeup of the town was 97.2% White, 0.3% African American, 0.2% Native American, 0.4% Asian, 0.1% Pacific Islander, 0.7% from other races, and 1.1% from two or more races. Hispanic or Latino of any race were 1.7% of the population.
The median income for a household in the town was $45,625, and the median income for a family was $50,000. The per capita income for the town was $20,945. About 8.3% of families and 10.2% of the population were below the poverty line, including 14.3% of those under age 18 and 6.2% of those age 65 or over.
Common Questions
What is Per Capita Income in Clear Lake?
Per Capita income in Clear Lake is $31,838.
What is the Median Family Income in Clear Lake?
Median Family Income in Clear Lake is $79,438.
What is the Median Household income in Clear Lake?
Median Household Income in Clear Lake is $71,705.
What is Income or Wage Gap in Clear Lake?
Income or Wage Gap in Clear Lake is 29.8%.
Women in Clear Lake earn 70.2 cents for every dollar earned by a man.
What is Inequality or Gini Index in Clear Lake?
Inequality or Gini Index in Clear Lake is 0.36.
What is the Total Population of Clear Lake?
Total Population of Clear Lake is 1,048.
What is the Total Male Population of Clear Lake?
Total Male Population of Clear Lake is 545.
What is the Total Female Population of Clear Lake?
Total Female Population of Clear Lake is 503.
What is the Ratio of Males per 100 Females in Clear Lake?
There are 108.35 Males per 100 Females in Clear Lake.
What is the Ratio of Females per 100 Males in Clear Lake?
There are 92.29 Females per 100 Males in Clear Lake.
What is the Median Population Age in Clear Lake?
Median Population Age in Clear Lake is 38.6 Years.
What is the Average Family Size in Clear Lake
Average Family Size in Clear Lake is 3.1 People.
What is the Average Household Size in Clear Lake
Average Household Size in Clear Lake is 2.4 People.
How Large is the Labor Force in Clear Lake?
There are 514 People in the Labor Forcein in Clear Lake.
What is the Percentage of People in the Labor Force in Clear Lake?
64.5% of People are in the Labor Force in Clear Lake.
What is the Unemployment Rate in Clear Lake?
Unemployment Rate in Clear Lake is 3.9%.