Springbrook, WI Map & Demographics
Springbrook Map
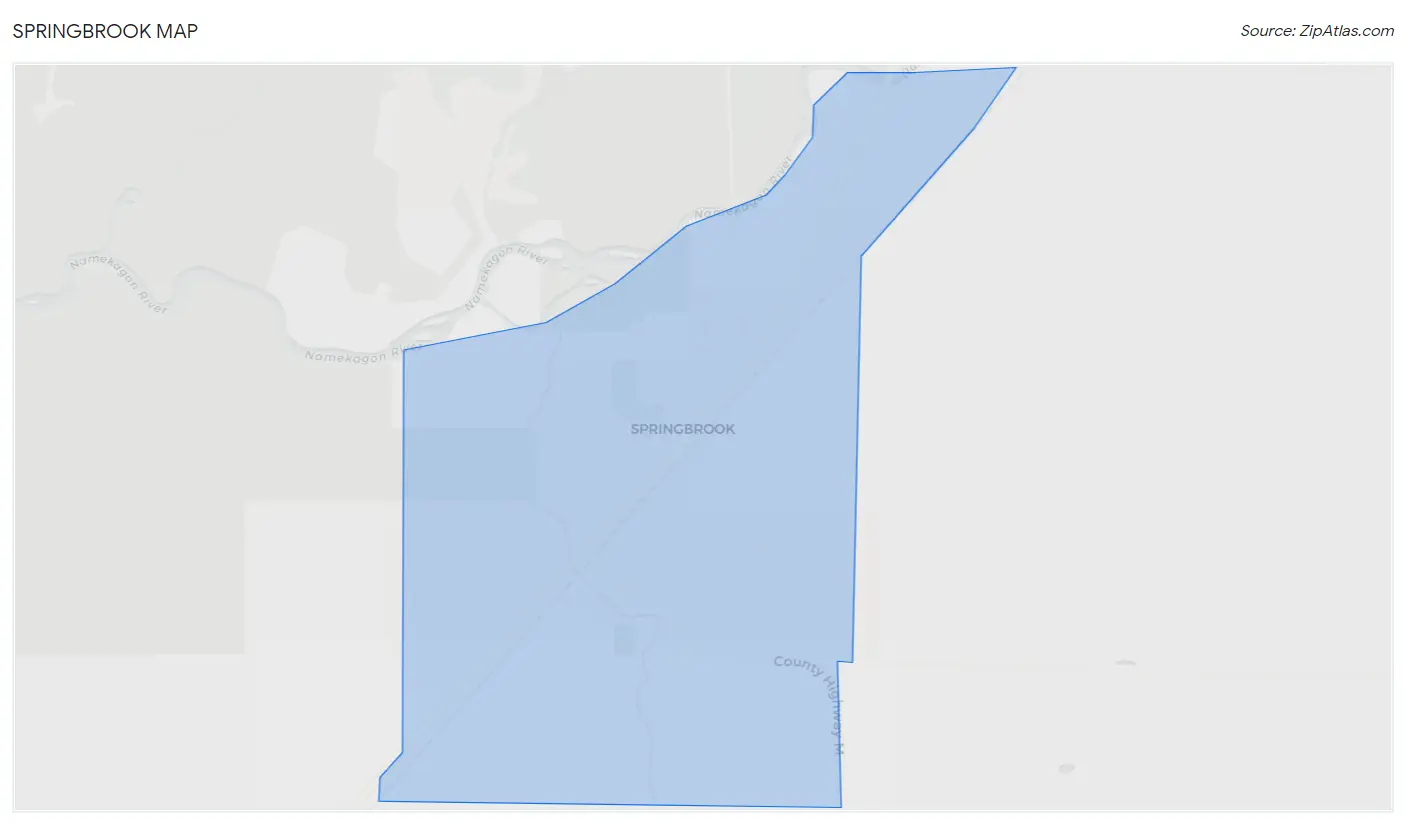
Springbrook Overview
$26,978
PER CAPITA INCOME
$33,875
AVG FAMILY INCOME
$41,875
AVG HOUSEHOLD INCOME
0.40
INEQUALITY / GINI INDEX
74
TOTAL POPULATION
37
MALE POPULATION
37
FEMALE POPULATION
100.00
MALES / 100 FEMALES
100.00
FEMALES / 100 MALES
42.3
MEDIAN AGE
2.4
AVG FAMILY SIZE
2.1
AVG HOUSEHOLD SIZE
37
LABOR FORCE [ PEOPLE ]
60.7%
PERCENT IN LABOR FORCE
Springbrook Zip Codes
Springbrook Area Codes
Income in Springbrook
Income Overview in Springbrook
Per Capita Income in Springbrook is $26,978, while median incomes of families and households are $33,875 and $41,875 respectively.
| Characteristic | Number | Measure |
| Per Capita Income | 74 | $26,978 |
| Median Family Income | 19 | $33,875 |
| Mean Family Income | 19 | $42,984 |
| Median Household Income | 35 | $41,875 |
| Mean Household Income | 35 | $58,209 |
| Income Deficit | 19 | $0 |
| Wage / Income Gap (%) | 74 | 0.00% |
| Wage / Income Gap ($) | 74 | 100.00¢ per $1 |
| Gini / Inequality Index | 74 | 0.40 |
Earnings by Sex in Springbrook
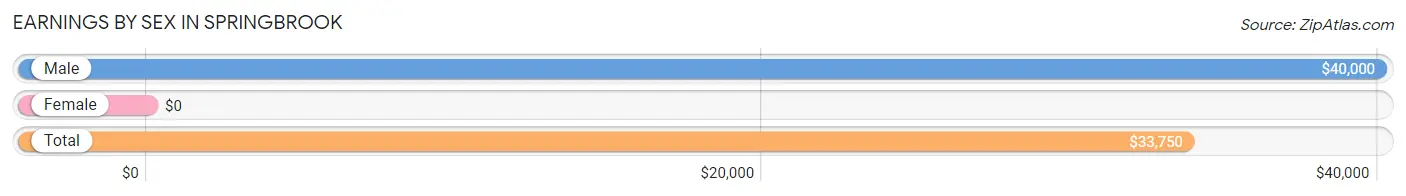
| Sex | Number | Average Earnings |
| Male | 20 (54.0%) | $40,000 |
| Female | 17 (46.0%) | $0 |
| Total | 37 (100.0%) | $33,750 |
Earnings by Sex by Income Bracket in Springbrook
The most common earnings brackets in Springbrook are $30,000 to $34,999 for men (10 | 50.0%) and $5,000 to $7,499 for women (9 | 52.9%).
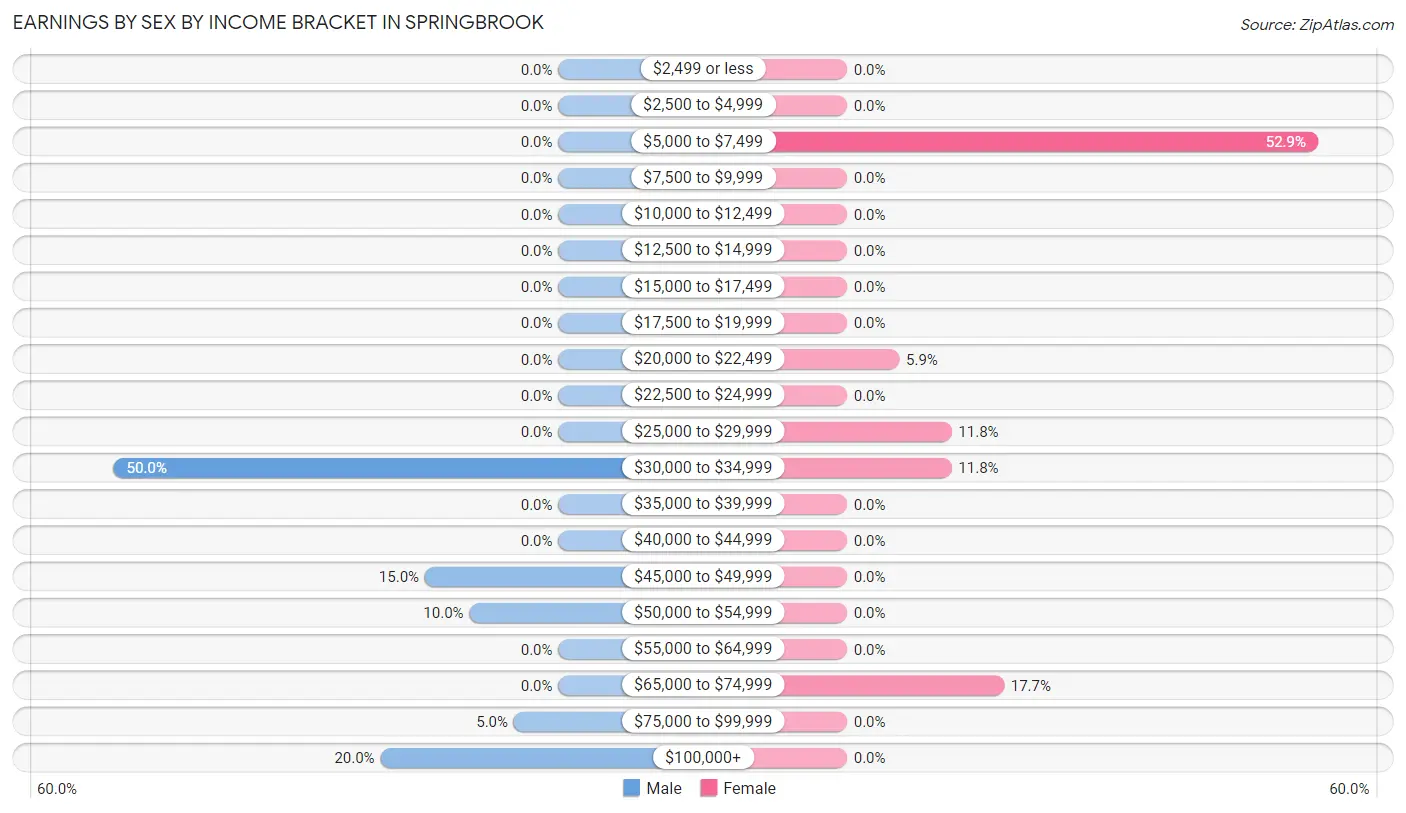
| Income | Male | Female |
| $2,499 or less | 0 (0.0%) | 0 (0.0%) |
| $2,500 to $4,999 | 0 (0.0%) | 0 (0.0%) |
| $5,000 to $7,499 | 0 (0.0%) | 9 (52.9%) |
| $7,500 to $9,999 | 0 (0.0%) | 0 (0.0%) |
| $10,000 to $12,499 | 0 (0.0%) | 0 (0.0%) |
| $12,500 to $14,999 | 0 (0.0%) | 0 (0.0%) |
| $15,000 to $17,499 | 0 (0.0%) | 0 (0.0%) |
| $17,500 to $19,999 | 0 (0.0%) | 0 (0.0%) |
| $20,000 to $22,499 | 0 (0.0%) | 1 (5.9%) |
| $22,500 to $24,999 | 0 (0.0%) | 0 (0.0%) |
| $25,000 to $29,999 | 0 (0.0%) | 2 (11.8%) |
| $30,000 to $34,999 | 10 (50.0%) | 2 (11.8%) |
| $35,000 to $39,999 | 0 (0.0%) | 0 (0.0%) |
| $40,000 to $44,999 | 0 (0.0%) | 0 (0.0%) |
| $45,000 to $49,999 | 3 (15.0%) | 0 (0.0%) |
| $50,000 to $54,999 | 2 (10.0%) | 0 (0.0%) |
| $55,000 to $64,999 | 0 (0.0%) | 0 (0.0%) |
| $65,000 to $74,999 | 0 (0.0%) | 3 (17.6%) |
| $75,000 to $99,999 | 1 (5.0%) | 0 (0.0%) |
| $100,000+ | 4 (20.0%) | 0 (0.0%) |
| Total | 20 (100.0%) | 17 (100.0%) |
Earnings by Sex by Educational Attainment in Springbrook
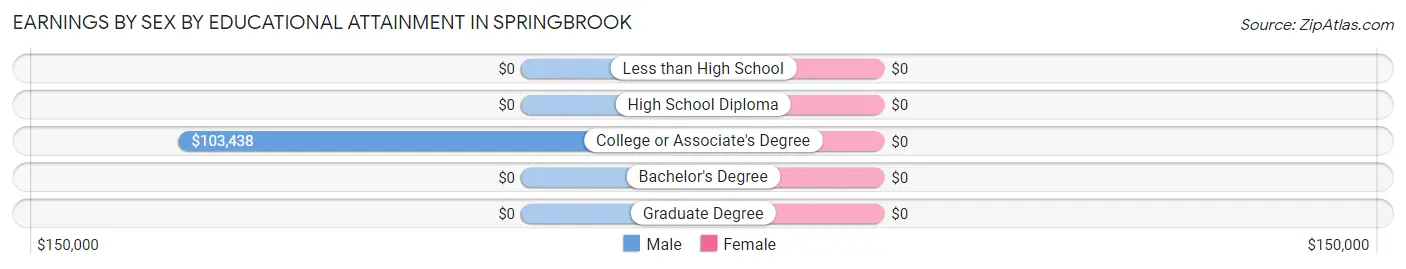
| Educational Attainment | Male Income | Female Income |
| Less than High School | - | - |
| High School Diploma | - | - |
| College or Associate's Degree | $103,438 | $0 |
| Bachelor's Degree | - | - |
| Graduate Degree | - | - |
| Total | $63,750 | $0 |
Family Income in Springbrook
Family Income Brackets in Springbrook
According to the Springbrook family income data, there are 11 families falling into the $25,000 to $34,999 income range, which is the most common income bracket and makes up 57.9% of all families.
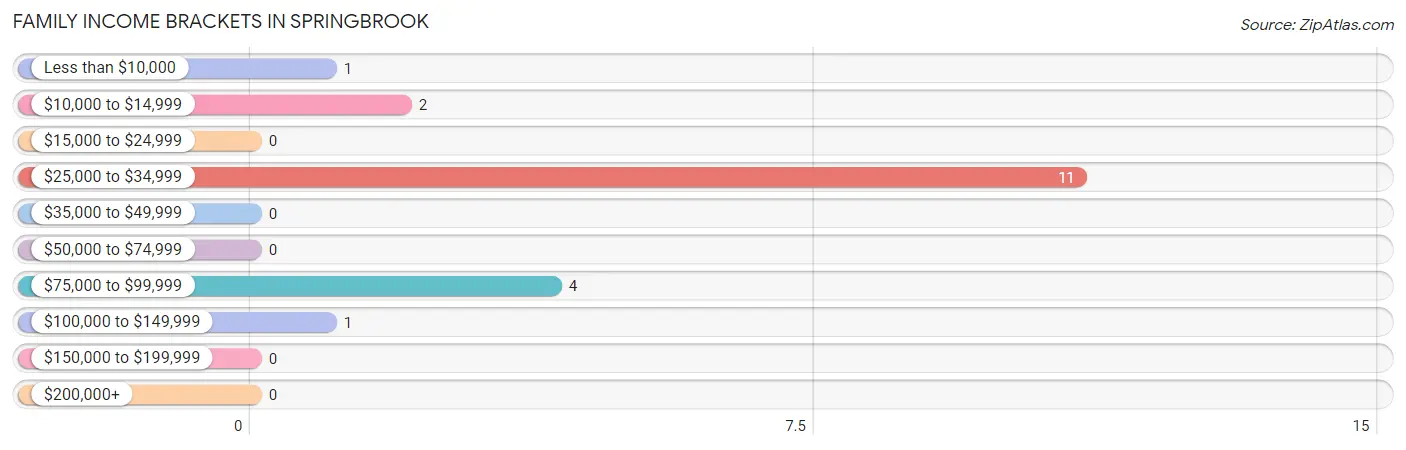
| Income Bracket | # Families | % Families |
| Less than $10,000 | 1 | 5.3% |
| $10,000 to $14,999 | 2 | 10.5% |
| $15,000 to $24,999 | 0 | 0.0% |
| $25,000 to $34,999 | 11 | 57.9% |
| $35,000 to $49,999 | 0 | 0.0% |
| $50,000 to $74,999 | 0 | 0.0% |
| $75,000 to $99,999 | 4 | 21.1% |
| $100,000 to $149,999 | 1 | 5.3% |
| $150,000 to $199,999 | 0 | 0.0% |
| $200,000+ | 0 | 0.0% |
Family Income by Famaliy Size in Springbrook
2-person families (16 | 84.2%) account for the highest median family income in Springbrook with $33,750 per family, while 2-person families (16 | 84.2%) have the highest median income of $16,875 per family member.
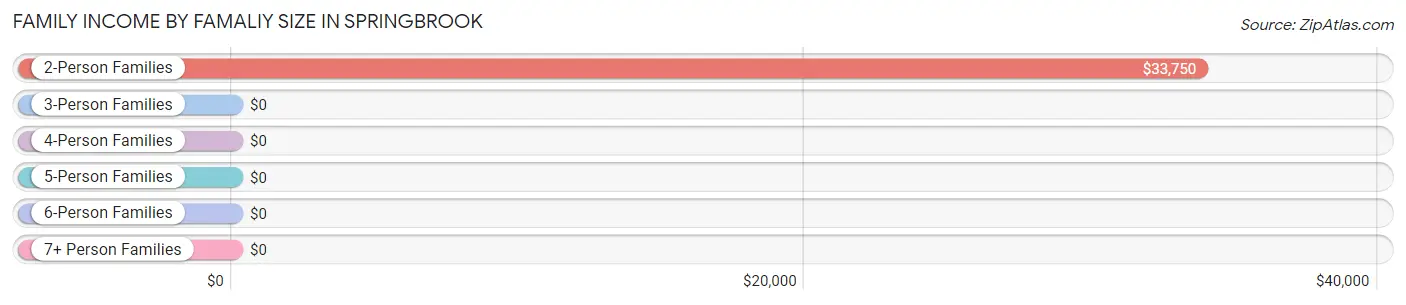
| Income Bracket | # Families | Median Income |
| 2-Person Families | 16 (84.2%) | $33,750 |
| 3-Person Families | 2 (10.5%) | $0 |
| 4-Person Families | 0 (0.0%) | $0 |
| 5-Person Families | 1 (5.3%) | $0 |
| 6-Person Families | 0 (0.0%) | $0 |
| 7+ Person Families | 0 (0.0%) | $0 |
| Total | 19 (100.0%) | $33,875 |
Family Income by Number of Earners in Springbrook
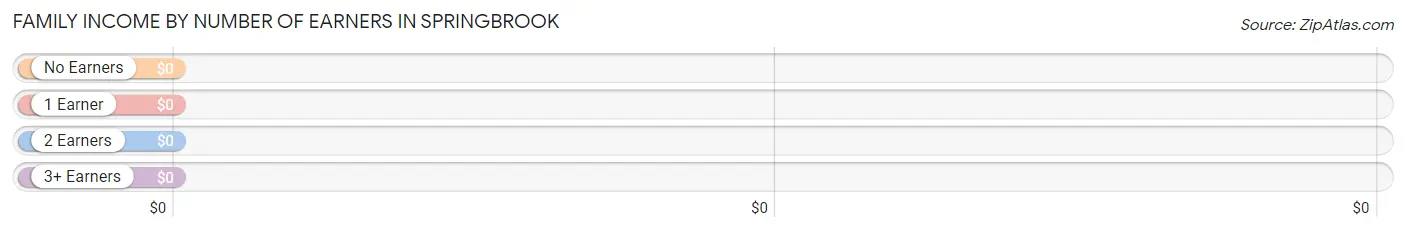
| Number of Earners | # Families | Median Income |
| No Earners | 7 (36.8%) | $0 |
| 1 Earner | 11 (57.9%) | $0 |
| 2 Earners | 1 (5.3%) | $0 |
| 3+ Earners | 0 (0.0%) | $0 |
| Total | 19 (100.0%) | $33,875 |
Household Income in Springbrook
Household Income Brackets in Springbrook
With 13 households falling in the category, the $35,000 to $49,999 income range is the most frequent in Springbrook, accounting for 37.1% of all households.
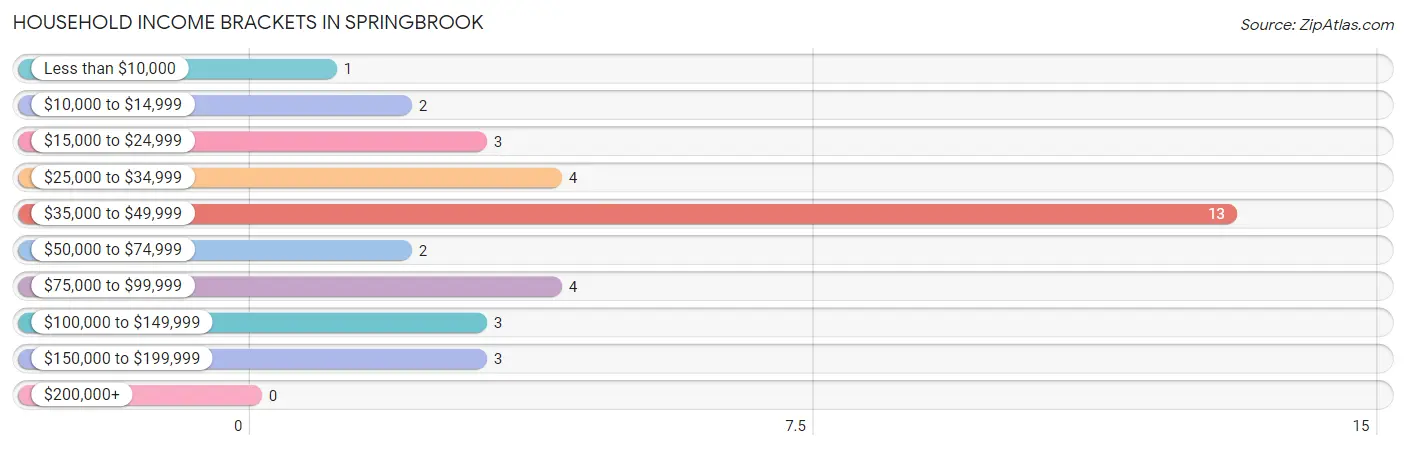
| Income Bracket | # Households | % Households |
| Less than $10,000 | 1 | 2.9% |
| $10,000 to $14,999 | 2 | 5.7% |
| $15,000 to $24,999 | 3 | 8.6% |
| $25,000 to $34,999 | 4 | 11.4% |
| $35,000 to $49,999 | 13 | 37.1% |
| $50,000 to $74,999 | 2 | 5.7% |
| $75,000 to $99,999 | 4 | 11.4% |
| $100,000 to $149,999 | 3 | 8.6% |
| $150,000 to $199,999 | 3 | 8.6% |
| $200,000+ | 0 | 0.0% |
Household Income by Householder Age in Springbrook
The median household income in Springbrook is $41,875, with the highest median household income of $48,750 found in the 45 to 64 years age bracket for the primary householder. A total of 10 households (28.6%) fall into this category. Meanwhile, the 15 to 24 years age bracket for the primary householder has the lowest median household income of $0, with 10 households (28.6%) in this group.
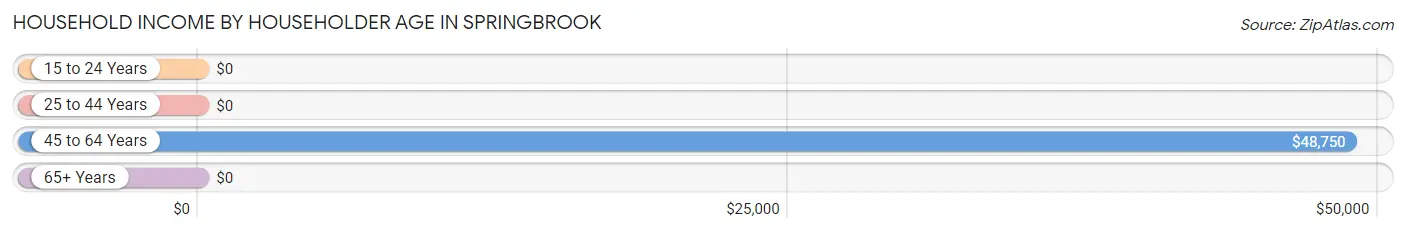
| Income Bracket | # Households | Median Income |
| 15 to 24 Years | 10 (28.6%) | $0 |
| 25 to 44 Years | 4 (11.4%) | $0 |
| 45 to 64 Years | 10 (28.6%) | $48,750 |
| 65+ Years | 11 (31.4%) | $0 |
| Total | 35 (100.0%) | $41,875 |
Poverty in Springbrook
Income Below Poverty by Sex and Age in Springbrook
With 21.6% poverty level for males and 40.5% for females among the residents of Springbrook, 6 to 11 year old males and 18 to 24 year old females are the most vulnerable to poverty, with 3 males (100.0%) and 9 females (100.0%) in their respective age groups living below the poverty level.
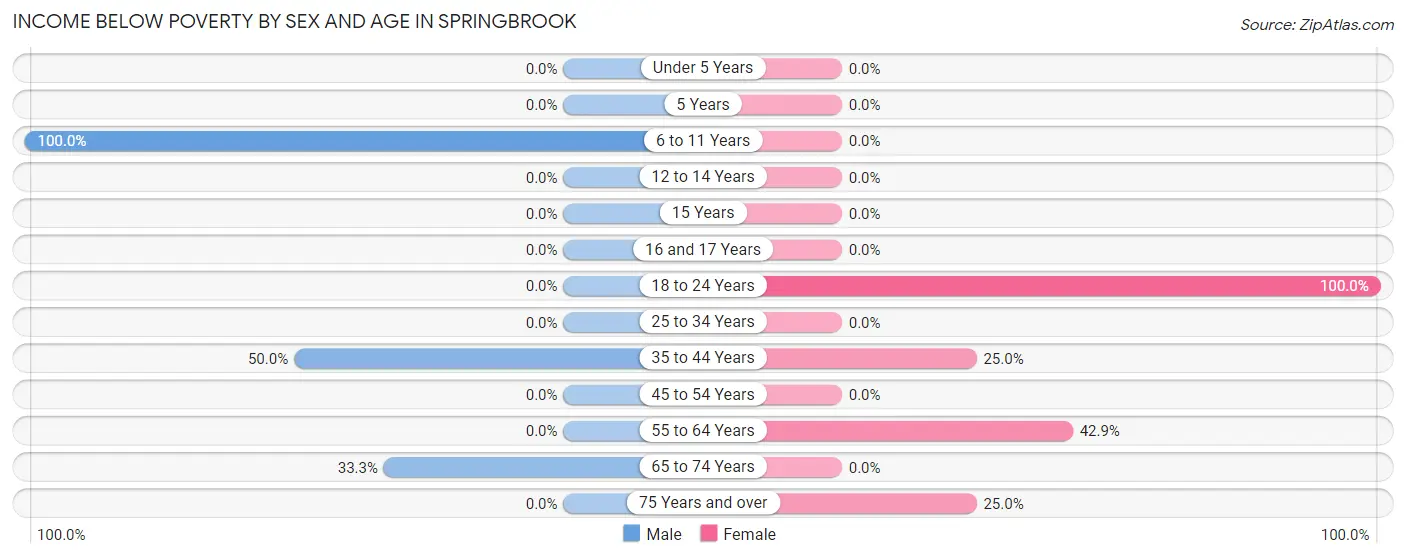
| Age Bracket | Male | Female |
| Under 5 Years | 0 (0.0%) | 0 (0.0%) |
| 5 Years | 0 (0.0%) | 0 (0.0%) |
| 6 to 11 Years | 3 (100.0%) | 0 (0.0%) |
| 12 to 14 Years | 0 (0.0%) | 0 (0.0%) |
| 15 Years | 0 (0.0%) | 0 (0.0%) |
| 16 and 17 Years | 0 (0.0%) | 0 (0.0%) |
| 18 to 24 Years | 0 (0.0%) | 9 (100.0%) |
| 25 to 34 Years | 0 (0.0%) | 0 (0.0%) |
| 35 to 44 Years | 3 (50.0%) | 1 (25.0%) |
| 45 to 54 Years | 0 (0.0%) | 0 (0.0%) |
| 55 to 64 Years | 0 (0.0%) | 3 (42.9%) |
| 65 to 74 Years | 2 (33.3%) | 0 (0.0%) |
| 75 Years and over | 0 (0.0%) | 2 (25.0%) |
| Total | 8 (21.6%) | 15 (40.5%) |
Income Above Poverty by Sex and Age in Springbrook
According to the poverty statistics in Springbrook, males aged 12 to 14 years and females aged under 5 years are the age groups that are most secure financially, with 100.0% of males and 100.0% of females in these age groups living above the poverty line.
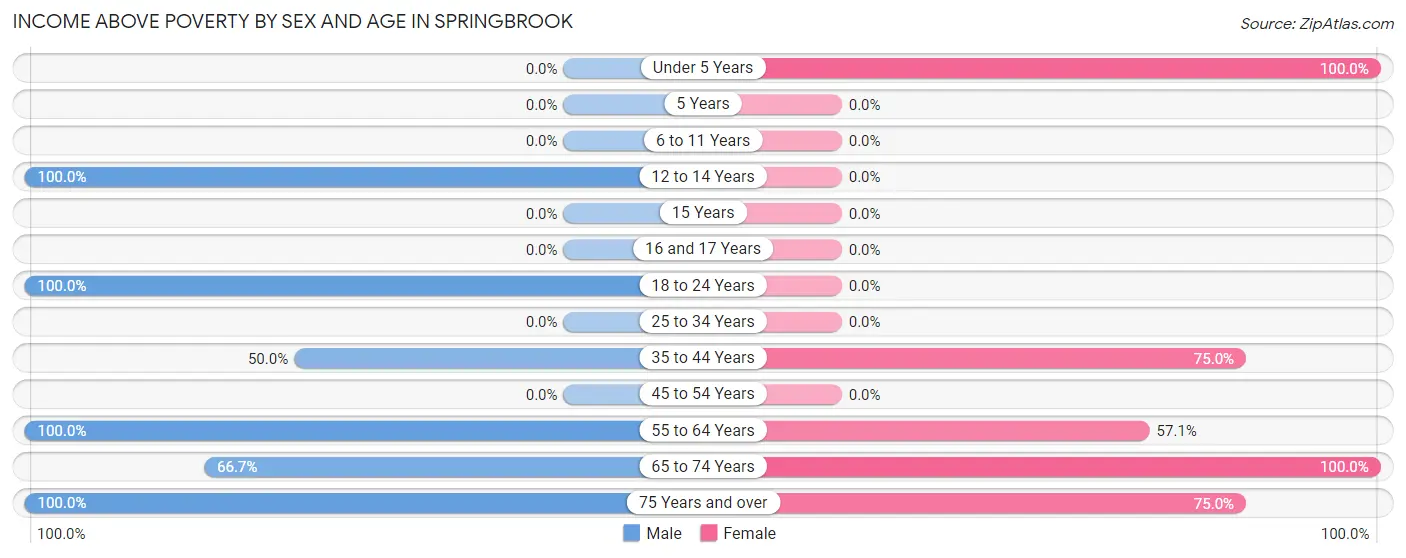
| Age Bracket | Male | Female |
| Under 5 Years | 0 (0.0%) | 7 (100.0%) |
| 5 Years | 0 (0.0%) | 0 (0.0%) |
| 6 to 11 Years | 0 (0.0%) | 0 (0.0%) |
| 12 to 14 Years | 3 (100.0%) | 0 (0.0%) |
| 15 Years | 0 (0.0%) | 0 (0.0%) |
| 16 and 17 Years | 0 (0.0%) | 0 (0.0%) |
| 18 to 24 Years | 10 (100.0%) | 0 (0.0%) |
| 25 to 34 Years | 0 (0.0%) | 0 (0.0%) |
| 35 to 44 Years | 3 (50.0%) | 3 (75.0%) |
| 45 to 54 Years | 0 (0.0%) | 0 (0.0%) |
| 55 to 64 Years | 7 (100.0%) | 4 (57.1%) |
| 65 to 74 Years | 4 (66.7%) | 2 (100.0%) |
| 75 Years and over | 2 (100.0%) | 6 (75.0%) |
| Total | 29 (78.4%) | 22 (59.5%) |
Income Below Poverty Among Married-Couple Families in Springbrook
The poverty statistics for married-couple families in Springbrook show that 50.0% or 3 of the total 6 families live below the poverty line. Families with 1 or 2 children have the highest poverty rate of 100.0%, comprising of 1 families. On the other hand, families with no children have the lowest poverty rate of 40.0%, which includes 2 families.
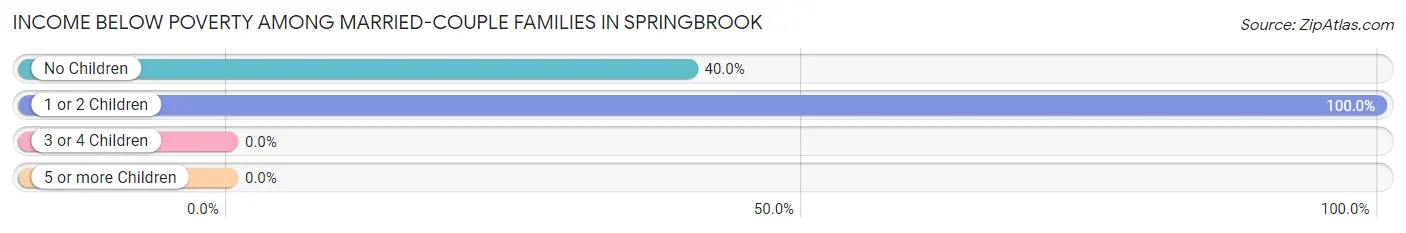
| Children | Above Poverty | Below Poverty |
| No Children | 3 (60.0%) | 2 (40.0%) |
| 1 or 2 Children | 0 (0.0%) | 1 (100.0%) |
| 3 or 4 Children | 0 (0.0%) | 0 (0.0%) |
| 5 or more Children | 0 (0.0%) | 0 (0.0%) |
| Total | 3 (50.0%) | 3 (50.0%) |
Income Below Poverty Among Single-Parent Households in Springbrook
| Children | Single Father | Single Mother |
| No Children | 0 (0.0%) | 0 (0.0%) |
| 1 or 2 Children | 0 (0.0%) | 1 (100.0%) |
| 3 or 4 Children | 0 (0.0%) | 0 (0.0%) |
| 5 or more Children | 0 (0.0%) | 0 (0.0%) |
| Total | 0 (0.0%) | 1 (100.0%) |
Income Below Poverty Among Married-Couple vs Single-Parent Households in Springbrook
The poverty data for Springbrook shows that 3 of the married-couple family households (50.0%) and 1 of the single-parent households (7.7%) are living below the poverty level. Within the married-couple family households, those with 1 or 2 children have the highest poverty rate, with 1 households (100.0%) falling below the poverty line. Among the single-parent households, those with 1 or 2 children have the highest poverty rate, with 1 household (7.7%) living below poverty.
| Children | Married-Couple Families | Single-Parent Households |
| No Children | 2 (40.0%) | 0 (0.0%) |
| 1 or 2 Children | 1 (100.0%) | 1 (7.7%) |
| 3 or 4 Children | 0 (0.0%) | 0 (0.0%) |
| 5 or more Children | 0 (0.0%) | 0 (0.0%) |
| Total | 3 (50.0%) | 1 (7.7%) |
Race in Springbrook
The most populous races in Springbrook are White / Caucasian (63 | 85.1%), Two or more Races (9 | 12.2%), and Hispanic or Latino (3 | 4.1%).
| Race | # Population | % Population |
| Asian | 2 | 2.7% |
| Black / African American | 0 | 0.0% |
| Hawaiian / Pacific | 0 | 0.0% |
| Hispanic or Latino | 3 | 4.1% |
| Native / Alaskan | 0 | 0.0% |
| White / Caucasian | 63 | 85.1% |
| Two or more Races | 9 | 12.2% |
| Some other Race | 0 | 0.0% |
| Total | 74 | 100.0% |
Ancestry in Springbrook
The most populous ancestries reported in Springbrook are Scandinavian (16 | 21.6%), German (11 | 14.9%), Irish (11 | 14.9%), Chippewa (8 | 10.8%), and English (7 | 9.5%), together accounting for 71.6% of all Springbrook residents.
| Ancestry | # Population | % Population |
| American | 2 | 2.7% |
| Central American | 3 | 4.1% |
| Chippewa | 8 | 10.8% |
| Dutch | 2 | 2.7% |
| English | 7 | 9.5% |
| German | 11 | 14.9% |
| Guatemalan | 3 | 4.1% |
| Irish | 11 | 14.9% |
| Jamaican | 3 | 4.1% |
| Korean | 2 | 2.7% |
| Norwegian | 5 | 6.8% |
| Scandinavian | 16 | 21.6% |
| Scottish | 3 | 4.1% | View All 13 Rows |
Immigrants in Springbrook
The most numerous immigrant groups reported in Springbrook came from Asia (2 | 2.7%), Philippines (2 | 2.7%), and South Eastern Asia (2 | 2.7%), together accounting for 8.1% of all Springbrook residents.
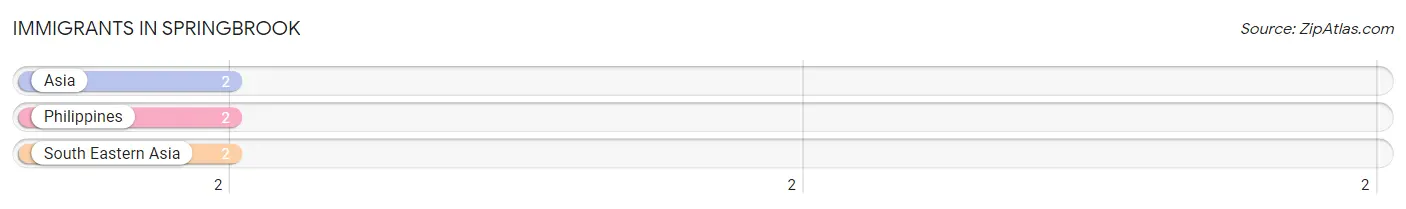
| Immigration Origin | # Population | % Population |
| Asia | 2 | 2.7% |
| Philippines | 2 | 2.7% |
| South Eastern Asia | 2 | 2.7% | View All 3 Rows |
Sex and Age in Springbrook
Sex and Age in Springbrook
The most populous age groups in Springbrook are 20 to 24 Years (10 | 27.0%) for men and 20 to 24 Years (9 | 24.3%) for women.
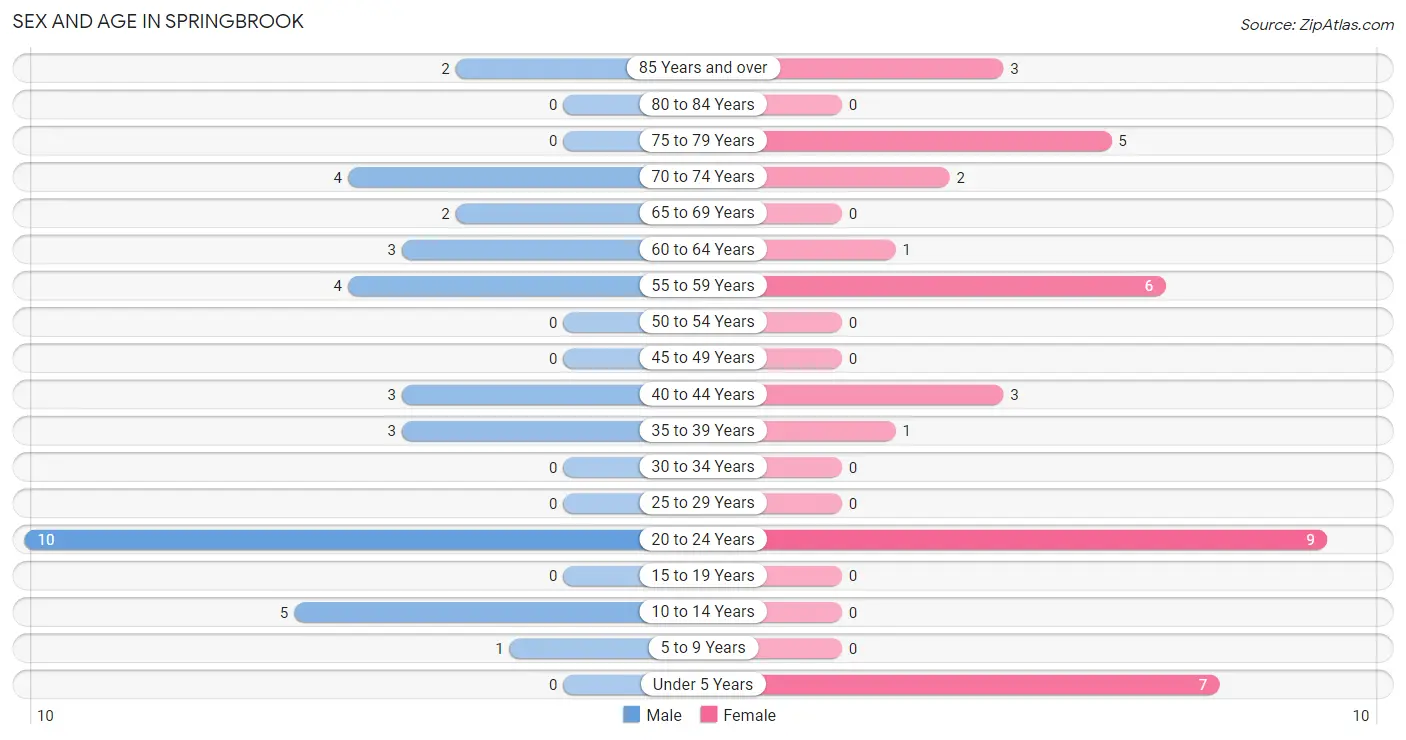
| Age Bracket | Male | Female |
| Under 5 Years | 0 (0.0%) | 7 (18.9%) |
| 5 to 9 Years | 1 (2.7%) | 0 (0.0%) |
| 10 to 14 Years | 5 (13.5%) | 0 (0.0%) |
| 15 to 19 Years | 0 (0.0%) | 0 (0.0%) |
| 20 to 24 Years | 10 (27.0%) | 9 (24.3%) |
| 25 to 29 Years | 0 (0.0%) | 0 (0.0%) |
| 30 to 34 Years | 0 (0.0%) | 0 (0.0%) |
| 35 to 39 Years | 3 (8.1%) | 1 (2.7%) |
| 40 to 44 Years | 3 (8.1%) | 3 (8.1%) |
| 45 to 49 Years | 0 (0.0%) | 0 (0.0%) |
| 50 to 54 Years | 0 (0.0%) | 0 (0.0%) |
| 55 to 59 Years | 4 (10.8%) | 6 (16.2%) |
| 60 to 64 Years | 3 (8.1%) | 1 (2.7%) |
| 65 to 69 Years | 2 (5.4%) | 0 (0.0%) |
| 70 to 74 Years | 4 (10.8%) | 2 (5.4%) |
| 75 to 79 Years | 0 (0.0%) | 5 (13.5%) |
| 80 to 84 Years | 0 (0.0%) | 0 (0.0%) |
| 85 Years and over | 2 (5.4%) | 3 (8.1%) |
| Total | 37 (100.0%) | 37 (100.0%) |
Families and Households in Springbrook
Median Family Size in Springbrook
The median family size in Springbrook is 2.37 persons per family, with married-couple families (6 | 31.6%) accounting for the largest median family size of 3 persons per family. On the other hand, single female/mother families (1 | 5.3%) represent the smallest median family size with 2.00 persons per family.
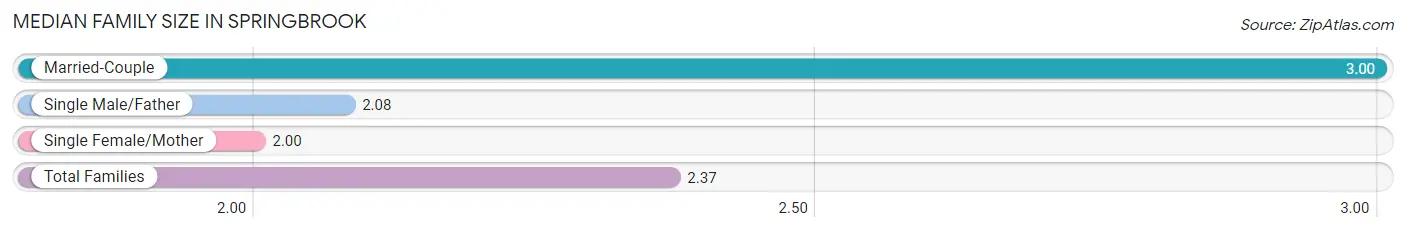
| Family Type | # Families | Family Size |
| Married-Couple | 6 (31.6%) | 3.00 |
| Single Male/Father | 12 (63.2%) | 2.08 |
| Single Female/Mother | 1 (5.3%) | 2.00 |
| Total Families | 19 (100.0%) | 2.37 |
Median Household Size in Springbrook
The median household size in Springbrook is 2.11 persons per household, with married-couple households (6 | 17.1%) accounting for the largest median household size of 3 persons per household. non-family households (16 | 45.7%) represent the smallest median household size with 1.25 persons per household.
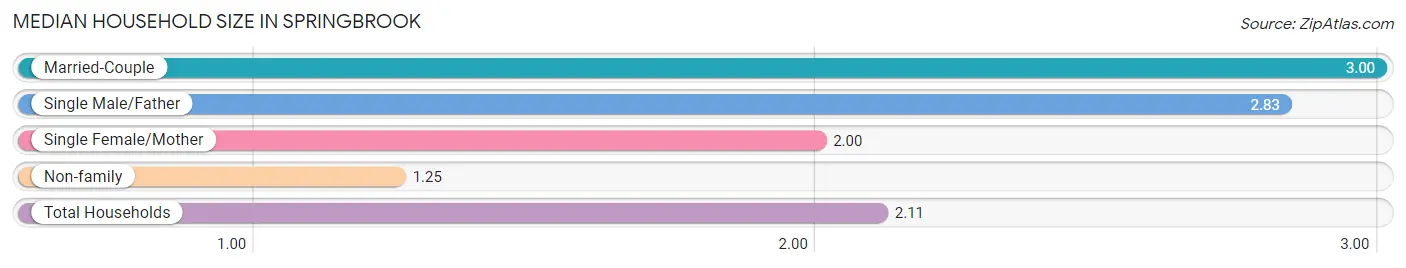
| Household Type | # Households | Household Size |
| Married-Couple | 6 (17.1%) | 3.00 |
| Single Male/Father | 12 (34.3%) | 2.83 |
| Single Female/Mother | 1 (2.9%) | 2.00 |
| Non-family | 16 (45.7%) | 1.25 |
| Total Households | 35 (100.0%) | 2.11 |
Household Size by Marriage Status in Springbrook
Out of a total of 35 households in Springbrook, 19 (54.3%) are family households, while 16 (45.7%) are nonfamily households. The most numerous type of family households are 3-person households, comprising 12, and the most common type of nonfamily households are 1-person households, comprising 11.
| Household Size | Family Households | Nonfamily Households |
| 1-Person Households | - | 11 (31.4%) |
| 2-Person Households | 6 (17.1%) | 5 (14.3%) |
| 3-Person Households | 12 (34.3%) | 0 (0.0%) |
| 4-Person Households | 0 (0.0%) | 0 (0.0%) |
| 5-Person Households | 1 (2.9%) | 0 (0.0%) |
| 6-Person Households | 0 (0.0%) | 0 (0.0%) |
| 7+ Person Households | 0 (0.0%) | 0 (0.0%) |
| Total | 19 (54.3%) | 16 (45.7%) |
Female Fertility in Springbrook
Fertility by Age in Springbrook
Average fertility rate in Springbrook is 692.0 births per 1,000 women. Women in the age bracket of 20 to 34 years have the highest fertility rate with 1,000.0 births per 1,000 women. Women in the age bracket of 20 to 34 years acount for 100.0% of all women with births.
| Age Bracket | Women with Births | Births / 1,000 Women |
| 15 to 19 years | 0 (0.0%) | 0.0 |
| 20 to 34 years | 9 (100.0%) | 1,000.0 |
| 35 to 50 years | 0 (0.0%) | 0.0 |
| Total | 9 (100.0%) | 692.0 |
Fertility by Age by Marriage Status in Springbrook
| Age Bracket | Married | Unmarried |
| 15 to 19 years | 0 (0.0%) | 0 (0.0%) |
| 20 to 34 years | 0 (0.0%) | 9 (100.0%) |
| 35 to 50 years | 0 (0.0%) | 0 (0.0%) |
| Total | 0 (0.0%) | 9 (100.0%) |
Fertility by Education in Springbrook
| Educational Attainment | Women with Births | Births / 1,000 Women |
| Less than High School | 0 (0.0%) | 0.0 |
| High School Diploma | 9 (100.0%) | 750.0 |
| College or Associate's Degree | 0 (0.0%) | 0.0 |
| Bachelor's Degree | 0 (0.0%) | 0.0 |
| Graduate Degree | 0 (0.0%) | 0.0 |
| Total | 9 (100.0%) | 692.0 |
Fertility by Education by Marriage Status in Springbrook
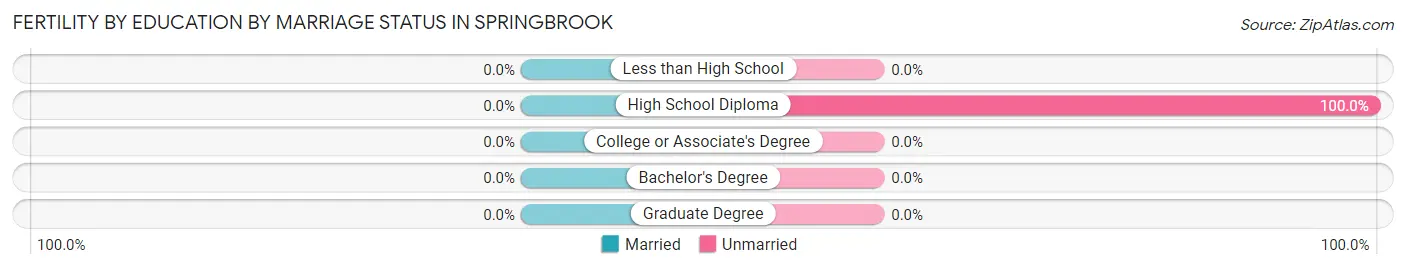
| Educational Attainment | Married | Unmarried |
| Less than High School | 0 (0.0%) | 0 (0.0%) |
| High School Diploma | 0 (0.0%) | 9 (100.0%) |
| College or Associate's Degree | 0 (0.0%) | 0 (0.0%) |
| Bachelor's Degree | 0 (0.0%) | 0 (0.0%) |
| Graduate Degree | 0 (0.0%) | 0 (0.0%) |
| Total | 0 (0.0%) | 9 (100.0%) |
Employment Characteristics in Springbrook
Employment by Class of Employer in Springbrook
Among the 27 employed individuals in Springbrook, self-employed (not incorporated) (15 | 55.6%), and private company employees (12 | 44.4%) make up the most common classes of employment.
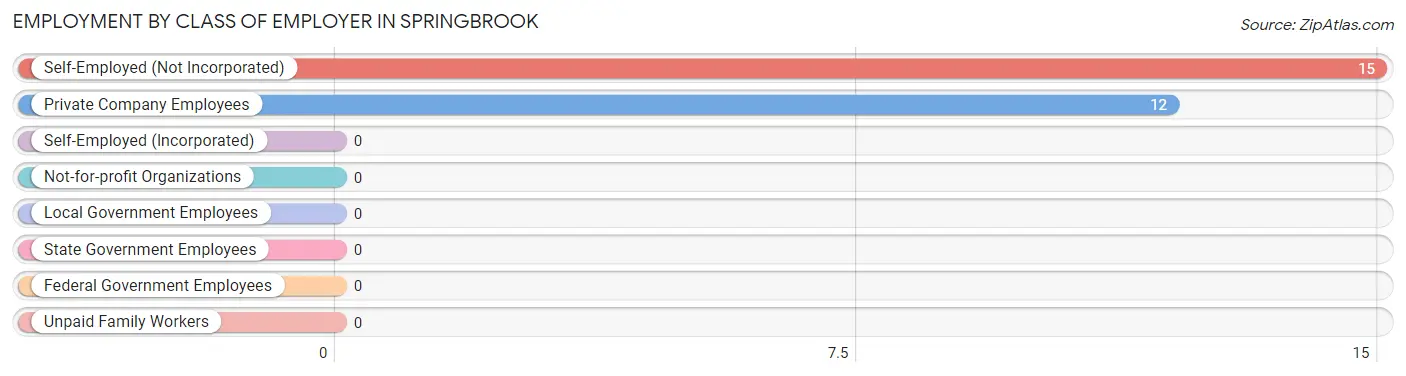
| Employer Class | # Employees | % Employees |
| Private Company Employees | 12 | 44.4% |
| Self-Employed (Incorporated) | 0 | 0.0% |
| Self-Employed (Not Incorporated) | 15 | 55.6% |
| Not-for-profit Organizations | 0 | 0.0% |
| Local Government Employees | 0 | 0.0% |
| State Government Employees | 0 | 0.0% |
| Federal Government Employees | 0 | 0.0% |
| Unpaid Family Workers | 0 | 0.0% |
| Total | 27 | 100.0% |
Employment Status by Age in Springbrook
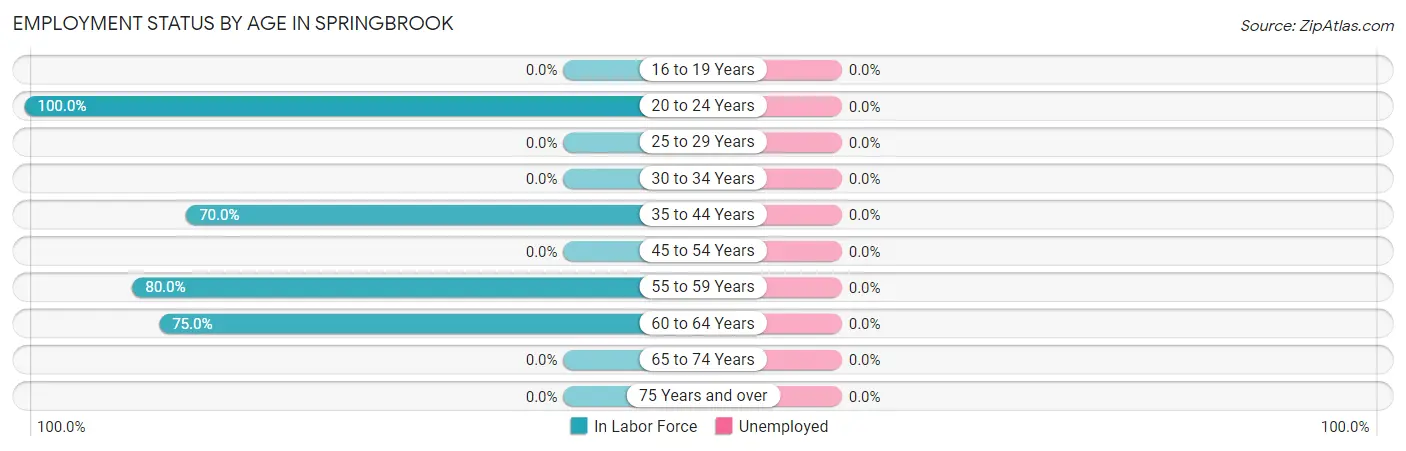
| Age Bracket | In Labor Force | Unemployed |
| 16 to 19 Years | 0 (0.0%) | 0 (0.0%) |
| 20 to 24 Years | 19 (100.0%) | 0 (0.0%) |
| 25 to 29 Years | 0 (0.0%) | 0 (0.0%) |
| 30 to 34 Years | 0 (0.0%) | 0 (0.0%) |
| 35 to 44 Years | 7 (70.0%) | 0 (0.0%) |
| 45 to 54 Years | 0 (0.0%) | 0 (0.0%) |
| 55 to 59 Years | 8 (80.0%) | 0 (0.0%) |
| 60 to 64 Years | 3 (75.0%) | 0 (0.0%) |
| 65 to 74 Years | 0 (0.0%) | 0 (0.0%) |
| 75 Years and over | 0 (0.0%) | 0 (0.0%) |
| Total | 37 (60.7%) | 0 (0.0%) |
Employment Status by Educational Attainment in Springbrook
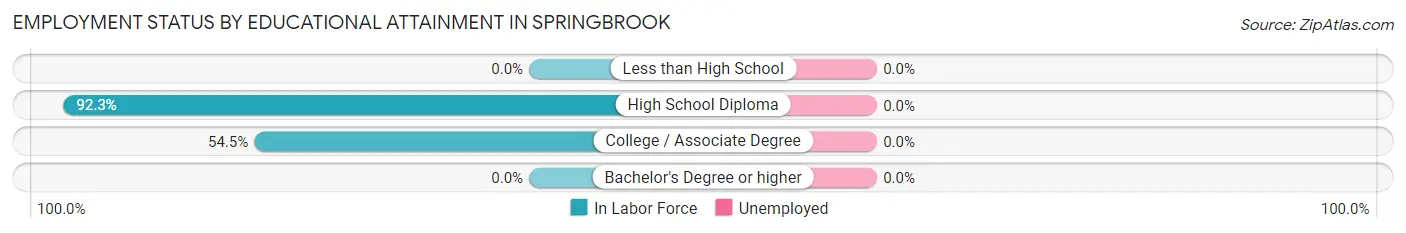
| Educational Attainment | In Labor Force | Unemployed |
| Less than High School | 0 (0.0%) | 0 (0.0%) |
| High School Diploma | 12 (92.3%) | 0 (0.0%) |
| College / Associate Degree | 6 (54.5%) | 0 (0.0%) |
| Bachelor's Degree or higher | 0 (0.0%) | 0 (0.0%) |
| Total | 18 (75.0%) | 0 (0.0%) |
Employment Occupations by Sex in Springbrook
Management, Business, Science and Arts Occupations
The most common Management, Business, Science and Arts occupations in Springbrook are Community & Social Service (3 | 8.1%), Arts, Media & Entertainment (2 | 5.4%), Education, Arts & Media (1 | 2.7%), and Health Diagnosing & Treating (1 | 2.7%).
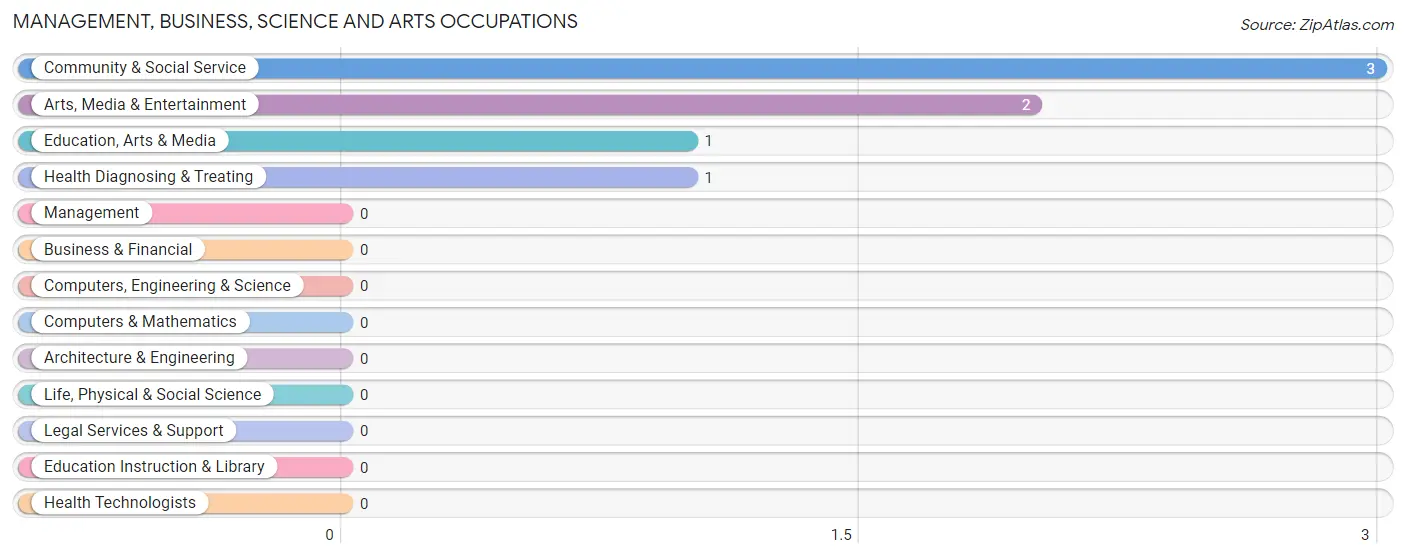
Management, Business, Science and Arts Occupations by Sex
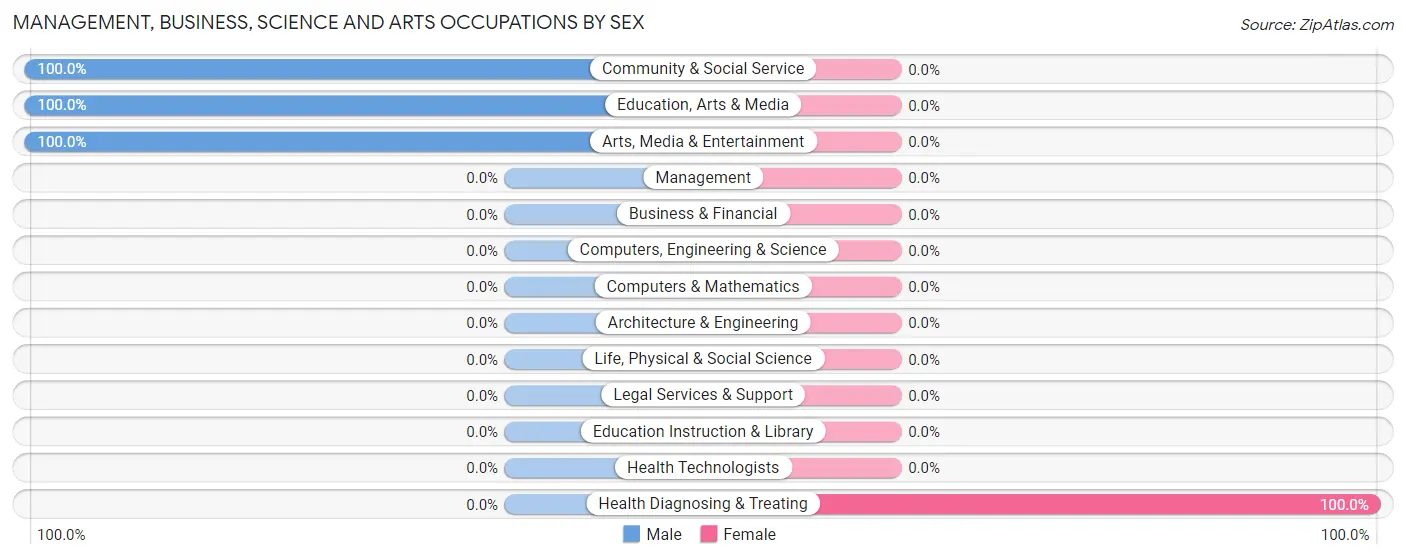
| Occupation | Male | Female |
| Management | 0 (0.0%) | 0 (0.0%) |
| Business & Financial | 0 (0.0%) | 0 (0.0%) |
| Computers, Engineering & Science | 0 (0.0%) | 0 (0.0%) |
| Computers & Mathematics | 0 (0.0%) | 0 (0.0%) |
| Architecture & Engineering | 0 (0.0%) | 0 (0.0%) |
| Life, Physical & Social Science | 0 (0.0%) | 0 (0.0%) |
| Community & Social Service | 3 (100.0%) | 0 (0.0%) |
| Education, Arts & Media | 1 (100.0%) | 0 (0.0%) |
| Legal Services & Support | 0 (0.0%) | 0 (0.0%) |
| Education Instruction & Library | 0 (0.0%) | 0 (0.0%) |
| Arts, Media & Entertainment | 2 (100.0%) | 0 (0.0%) |
| Health Diagnosing & Treating | 0 (0.0%) | 1 (100.0%) |
| Health Technologists | 0 (0.0%) | 0 (0.0%) |
| Total (Category) | 3 (75.0%) | 1 (25.0%) |
| Total (Overall) | 20 (54.0%) | 17 (46.0%) |
Services Occupations
The most common Services occupations in Springbrook are Cleaning & Maintenance (10 | 27.0%), and Food Preparation & Serving (2 | 5.4%).
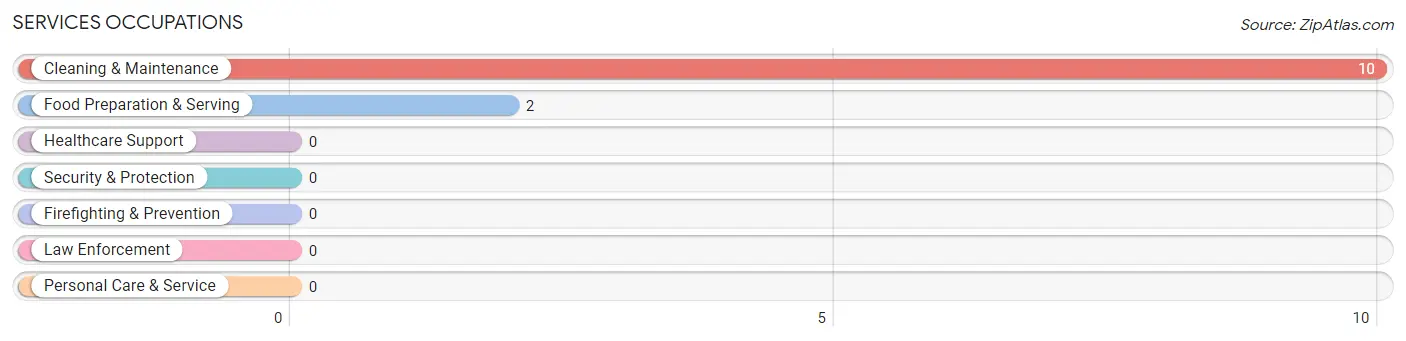
Services Occupations by Sex
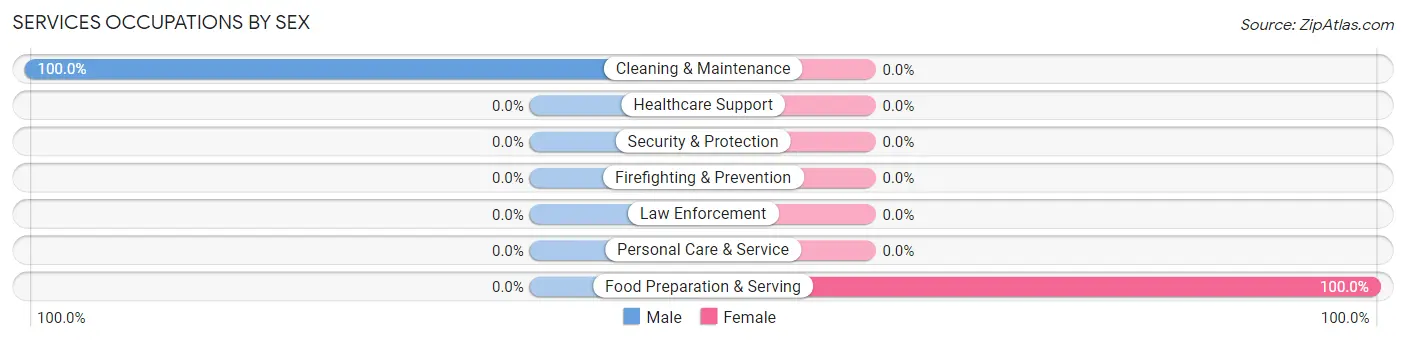
| Occupation | Male | Female |
| Healthcare Support | 0 (0.0%) | 0 (0.0%) |
| Security & Protection | 0 (0.0%) | 0 (0.0%) |
| Firefighting & Prevention | 0 (0.0%) | 0 (0.0%) |
| Law Enforcement | 0 (0.0%) | 0 (0.0%) |
| Food Preparation & Serving | 0 (0.0%) | 2 (100.0%) |
| Cleaning & Maintenance | 10 (100.0%) | 0 (0.0%) |
| Personal Care & Service | 0 (0.0%) | 0 (0.0%) |
| Total (Category) | 10 (83.3%) | 2 (16.7%) |
| Total (Overall) | 20 (54.0%) | 17 (46.0%) |
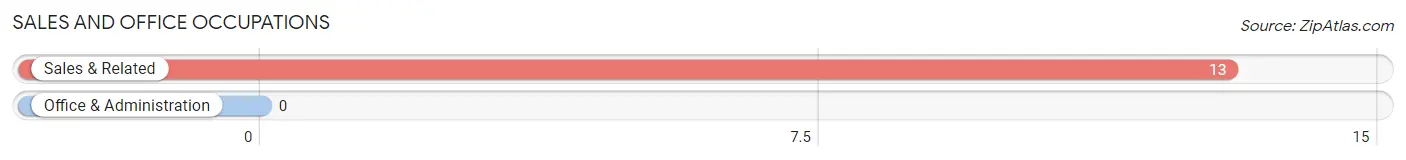
Sales and Office Occupations
The most common Sales and Office occupations in Springbrook are , and Sales & Related (13 | 35.1%).
Sales and Office Occupations by Sex
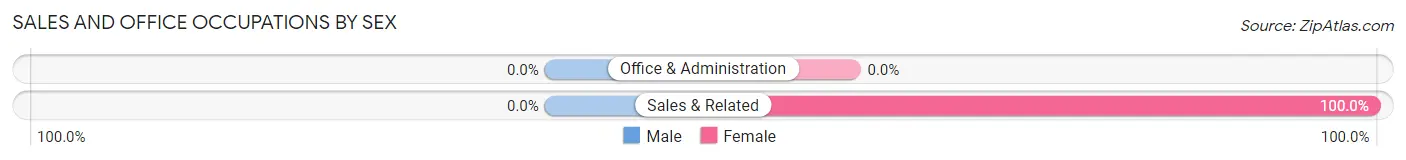
| Occupation | Male | Female |
| Sales & Related | 0 (0.0%) | 13 (100.0%) |
| Office & Administration | 0 (0.0%) | 0 (0.0%) |
| Total (Category) | 0 (0.0%) | 13 (100.0%) |
| Total (Overall) | 20 (54.0%) | 17 (46.0%) |
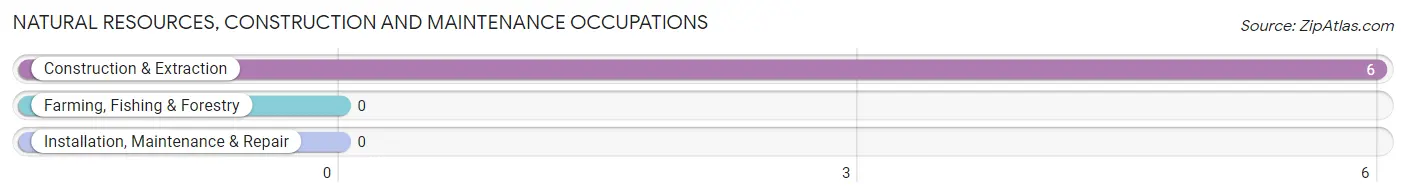
Natural Resources, Construction and Maintenance Occupations
The most common Natural Resources, Construction and Maintenance occupations in Springbrook are , and Construction & Extraction (6 | 16.2%).
Natural Resources, Construction and Maintenance Occupations by Sex
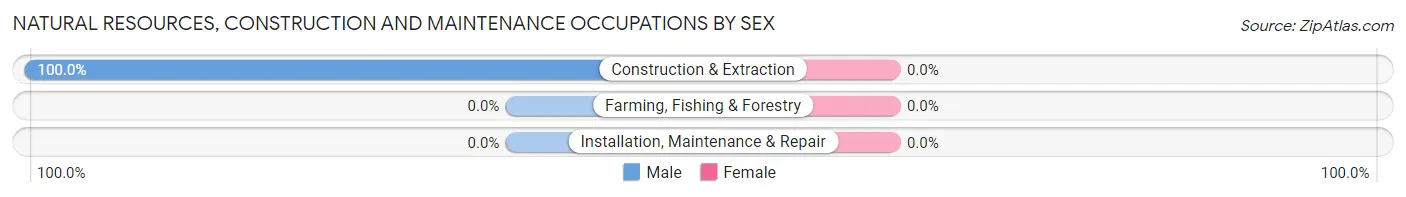
| Occupation | Male | Female |
| Farming, Fishing & Forestry | 0 (0.0%) | 0 (0.0%) |
| Construction & Extraction | 6 (100.0%) | 0 (0.0%) |
| Installation, Maintenance & Repair | 0 (0.0%) | 0 (0.0%) |
| Total (Category) | 6 (100.0%) | 0 (0.0%) |
| Total (Overall) | 20 (54.0%) | 17 (46.0%) |
Production, Transportation and Moving Occupations
The most common Production, Transportation and Moving occupations in Springbrook are Production (1 | 2.7%), and Material Moving (1 | 2.7%).
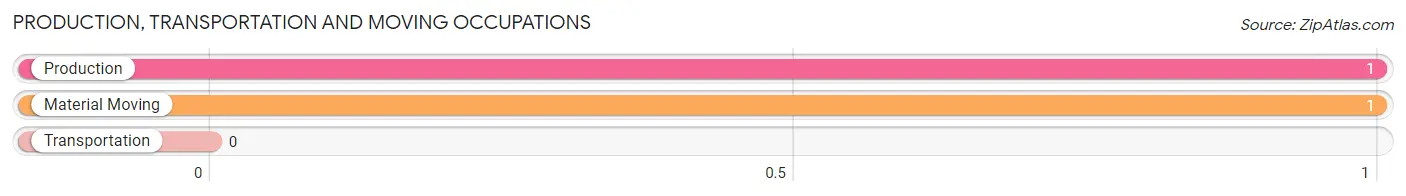
Production, Transportation and Moving Occupations by Sex
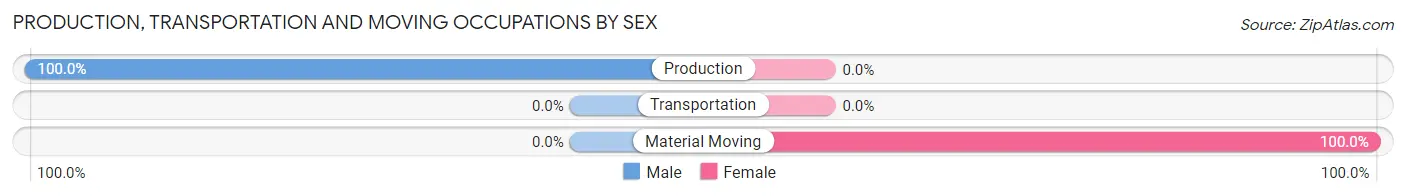
| Occupation | Male | Female |
| Production | 1 (100.0%) | 0 (0.0%) |
| Transportation | 0 (0.0%) | 0 (0.0%) |
| Material Moving | 0 (0.0%) | 1 (100.0%) |
| Total (Category) | 1 (50.0%) | 1 (50.0%) |
| Total (Overall) | 20 (54.0%) | 17 (46.0%) |
Employment Industries by Sex in Springbrook
Employment Industries in Springbrook
The major employment industries in Springbrook include Retail Trade (15 | 40.5%), Administrative & Support (10 | 27.0%), Construction (6 | 16.2%), Health Care & Social Assistance (2 | 5.4%), and Arts, Entertainment & Recreation (2 | 5.4%).
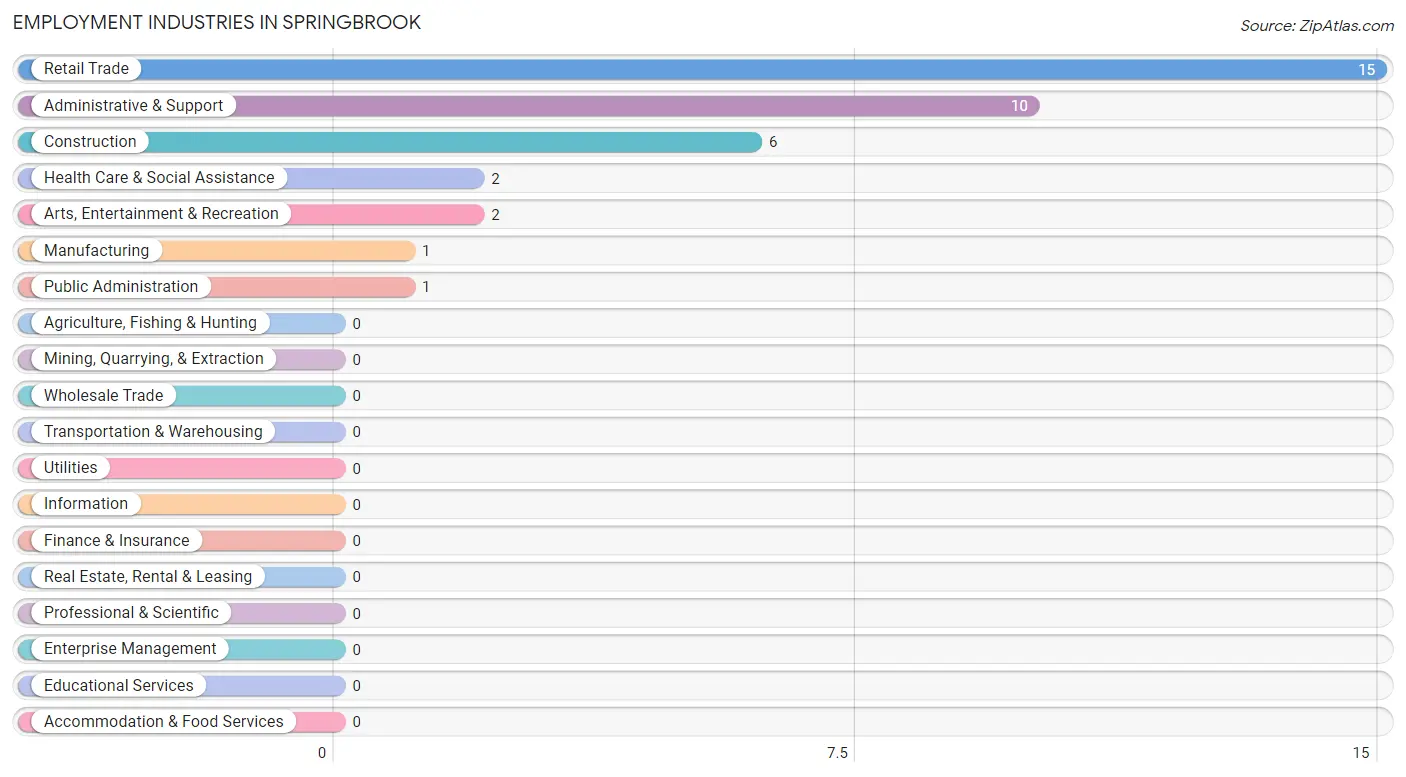
Employment Industries by Sex in Springbrook
The Springbrook industries that see more men than women are Construction (100.0%), Manufacturing (100.0%), and Administrative & Support (100.0%), whereas the industries that tend to have a higher number of women are Retail Trade (100.0%), and Health Care & Social Assistance (100.0%).
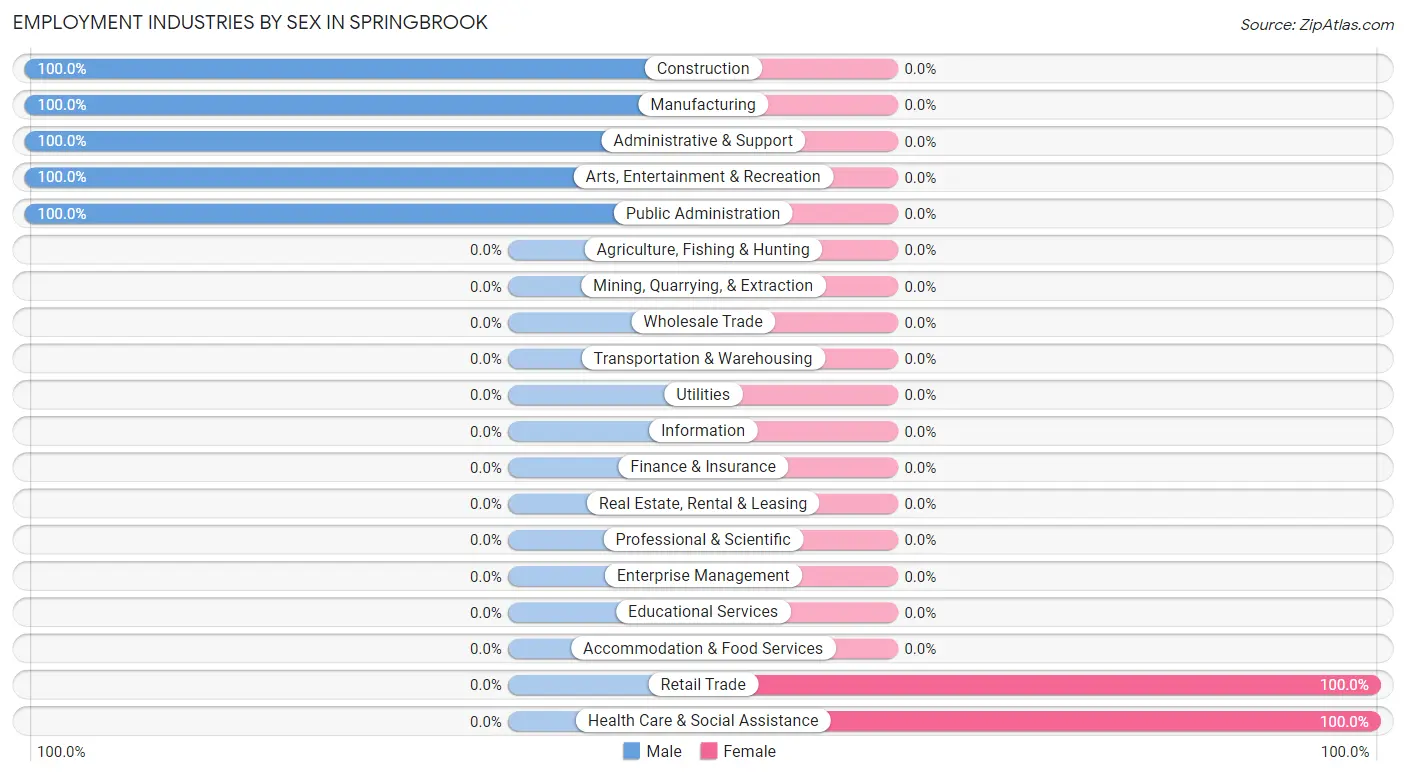
| Industry | Male | Female |
| Agriculture, Fishing & Hunting | 0 (0.0%) | 0 (0.0%) |
| Mining, Quarrying, & Extraction | 0 (0.0%) | 0 (0.0%) |
| Construction | 6 (100.0%) | 0 (0.0%) |
| Manufacturing | 1 (100.0%) | 0 (0.0%) |
| Wholesale Trade | 0 (0.0%) | 0 (0.0%) |
| Retail Trade | 0 (0.0%) | 15 (100.0%) |
| Transportation & Warehousing | 0 (0.0%) | 0 (0.0%) |
| Utilities | 0 (0.0%) | 0 (0.0%) |
| Information | 0 (0.0%) | 0 (0.0%) |
| Finance & Insurance | 0 (0.0%) | 0 (0.0%) |
| Real Estate, Rental & Leasing | 0 (0.0%) | 0 (0.0%) |
| Professional & Scientific | 0 (0.0%) | 0 (0.0%) |
| Enterprise Management | 0 (0.0%) | 0 (0.0%) |
| Administrative & Support | 10 (100.0%) | 0 (0.0%) |
| Educational Services | 0 (0.0%) | 0 (0.0%) |
| Health Care & Social Assistance | 0 (0.0%) | 2 (100.0%) |
| Arts, Entertainment & Recreation | 2 (100.0%) | 0 (0.0%) |
| Accommodation & Food Services | 0 (0.0%) | 0 (0.0%) |
| Public Administration | 1 (100.0%) | 0 (0.0%) |
| Total | 20 (54.0%) | 17 (46.0%) |
Education in Springbrook
School Enrollment in Springbrook
The most common levels of schooling among the 5 students in Springbrook are high school (3 | 60.0%), and elementary school (2 | 40.0%).
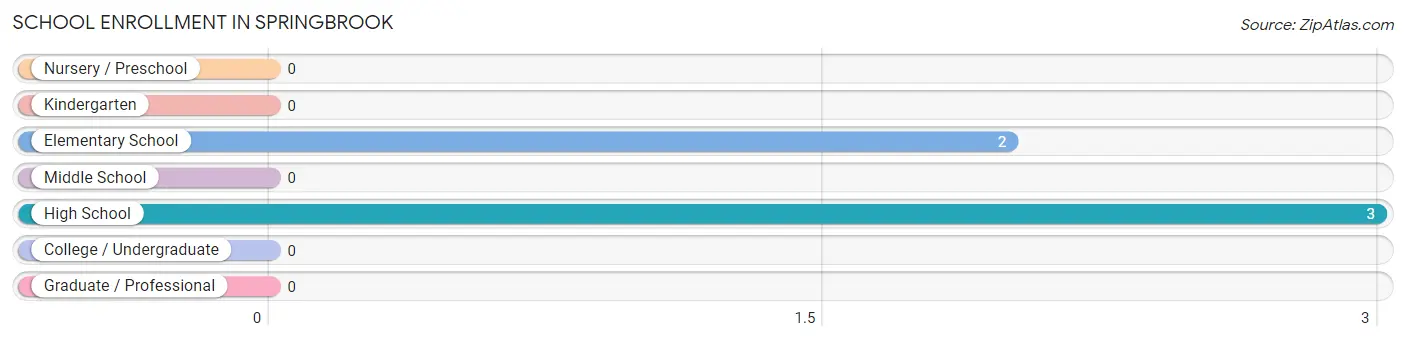
| School Level | # Students | % Students |
| Nursery / Preschool | 0 | 0.0% |
| Kindergarten | 0 | 0.0% |
| Elementary School | 2 | 40.0% |
| Middle School | 0 | 0.0% |
| High School | 3 | 60.0% |
| College / Undergraduate | 0 | 0.0% |
| Graduate / Professional | 0 | 0.0% |
| Total | 5 | 100.0% |
School Enrollment by Age by Funding Source in Springbrook
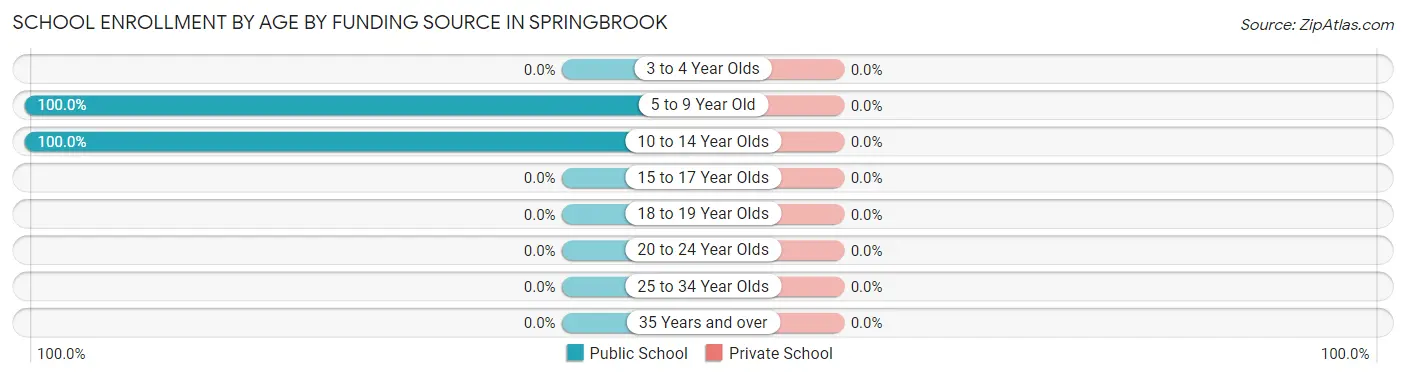
| Age Bracket | Public School | Private School |
| 3 to 4 Year Olds | 0 (0.0%) | 0 (0.0%) |
| 5 to 9 Year Old | 1 (100.0%) | 0 (0.0%) |
| 10 to 14 Year Olds | 4 (100.0%) | 0 (0.0%) |
| 15 to 17 Year Olds | 0 (0.0%) | 0 (0.0%) |
| 18 to 19 Year Olds | 0 (0.0%) | 0 (0.0%) |
| 20 to 24 Year Olds | 0 (0.0%) | 0 (0.0%) |
| 25 to 34 Year Olds | 0 (0.0%) | 0 (0.0%) |
| 35 Years and over | 0 (0.0%) | 0 (0.0%) |
| Total | 5 (100.0%) | 0 (0.0%) |
Educational Attainment by Field of Study in Springbrook
| Field of Study | # Graduates | % Graduates |
| Computers & Mathematics | 0 | 0.0% |
| Bio, Nature & Agricultural | 0 | 0.0% |
| Physical & Health Sciences | 0 | 0.0% |
| Psychology | 0 | 0.0% |
| Social Sciences | 0 | 0.0% |
| Engineering | 0 | 0.0% |
| Multidisciplinary Studies | 0 | 0.0% |
| Science & Technology | 0 | 0.0% |
| Business | 0 | 0.0% |
| Education | 0 | 0.0% |
| Literature & Languages | 0 | 0.0% |
| Liberal Arts & History | 0 | 0.0% |
| Visual & Performing Arts | 0 | 0.0% |
| Communications | 0 | 0.0% |
| Arts & Humanities | 0 | 0.0% |
| Total | 0 | 0.0% |
Transportation & Commute in Springbrook
Vehicle Availability by Sex in Springbrook
The most prevalent vehicle ownership categories in Springbrook are males with 3 vehicles (11, accounting for 57.9%) and females with 3 vehicles (1, making up 137.5%).
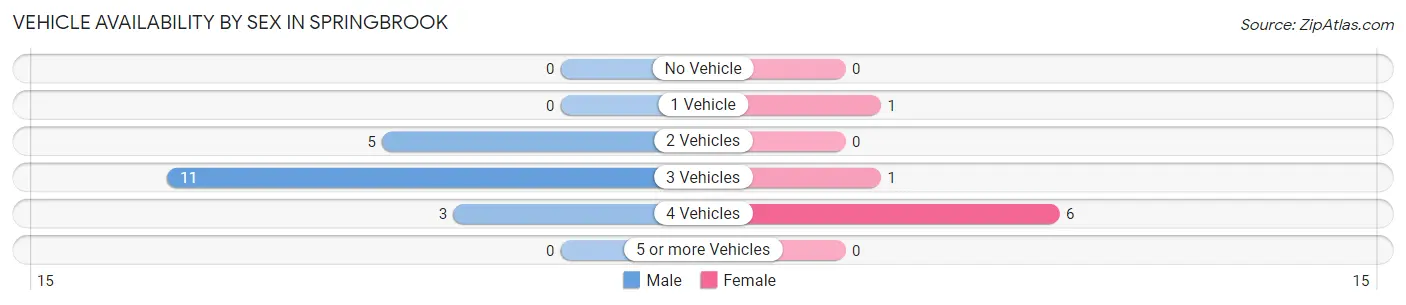
| Vehicles Available | Male | Female |
| No Vehicle | 0 (0.0%) | 0 (0.0%) |
| 1 Vehicle | 0 (0.0%) | 1 (12.5%) |
| 2 Vehicles | 5 (26.3%) | 0 (0.0%) |
| 3 Vehicles | 11 (57.9%) | 1 (12.5%) |
| 4 Vehicles | 3 (15.8%) | 6 (75.0%) |
| 5 or more Vehicles | 0 (0.0%) | 0 (0.0%) |
| Total | 19 (100.0%) | 8 (100.0%) |
Commute Time in Springbrook
The most frequently occuring commute durations in Springbrook are 20 to 24 minutes (5 commuters, 29.4%), 40 to 44 minutes (3 commuters, 17.6%), and 90 or more minutes (3 commuters, 17.6%).
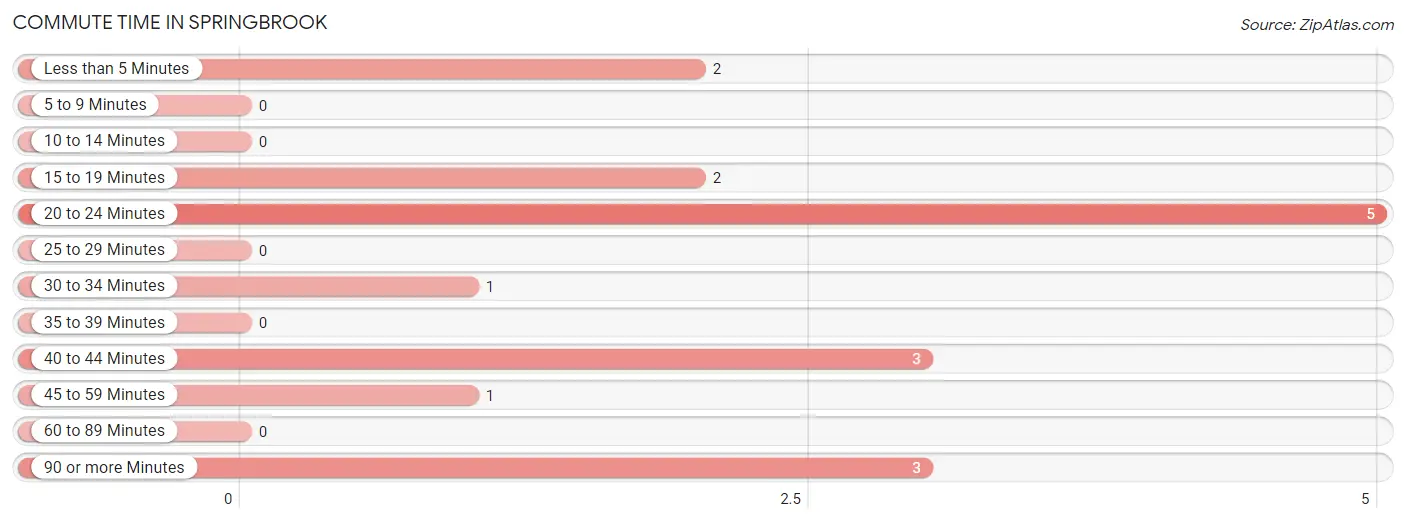
| Commute Time | # Commuters | % Commuters |
| Less than 5 Minutes | 2 | 11.8% |
| 5 to 9 Minutes | 0 | 0.0% |
| 10 to 14 Minutes | 0 | 0.0% |
| 15 to 19 Minutes | 2 | 11.8% |
| 20 to 24 Minutes | 5 | 29.4% |
| 25 to 29 Minutes | 0 | 0.0% |
| 30 to 34 Minutes | 1 | 5.9% |
| 35 to 39 Minutes | 0 | 0.0% |
| 40 to 44 Minutes | 3 | 17.6% |
| 45 to 59 Minutes | 1 | 5.9% |
| 60 to 89 Minutes | 0 | 0.0% |
| 90 or more Minutes | 3 | 17.6% |
Commute Time by Sex in Springbrook
The most common commute times in Springbrook are 20 to 24 minutes (3 commuters, 33.3%) for males and 40 to 44 minutes (3 commuters, 37.5%) for females.
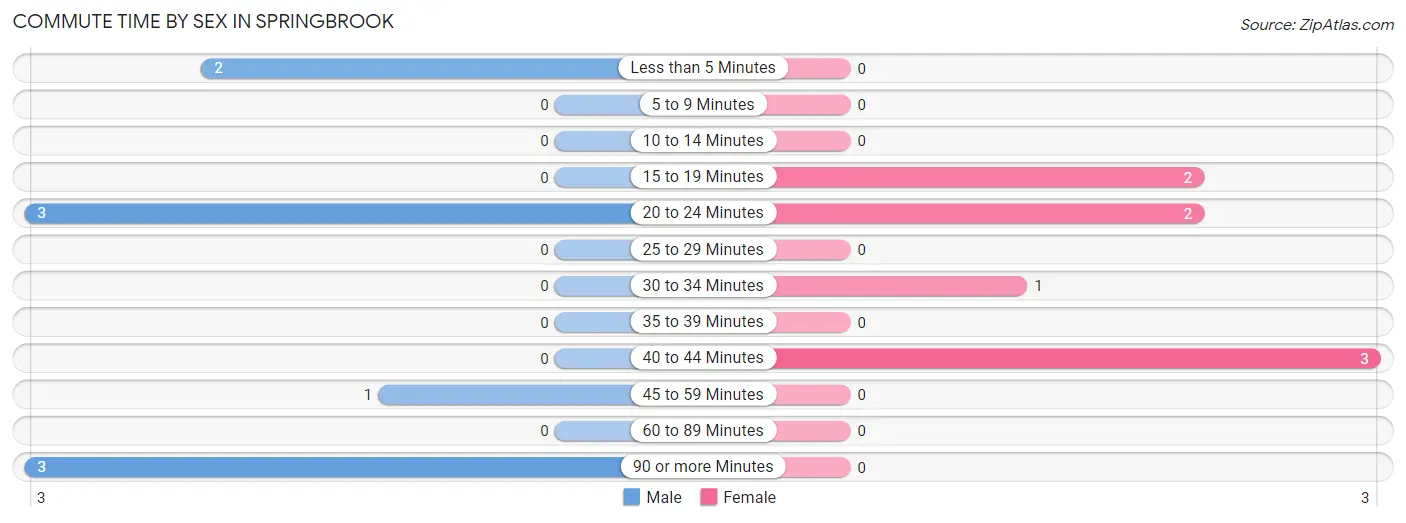
| Commute Time | Male | Female |
| Less than 5 Minutes | 2 (22.2%) | 0 (0.0%) |
| 5 to 9 Minutes | 0 (0.0%) | 0 (0.0%) |
| 10 to 14 Minutes | 0 (0.0%) | 0 (0.0%) |
| 15 to 19 Minutes | 0 (0.0%) | 2 (25.0%) |
| 20 to 24 Minutes | 3 (33.3%) | 2 (25.0%) |
| 25 to 29 Minutes | 0 (0.0%) | 0 (0.0%) |
| 30 to 34 Minutes | 0 (0.0%) | 1 (12.5%) |
| 35 to 39 Minutes | 0 (0.0%) | 0 (0.0%) |
| 40 to 44 Minutes | 0 (0.0%) | 3 (37.5%) |
| 45 to 59 Minutes | 1 (11.1%) | 0 (0.0%) |
| 60 to 89 Minutes | 0 (0.0%) | 0 (0.0%) |
| 90 or more Minutes | 3 (33.3%) | 0 (0.0%) |
Time of Departure to Work by Sex in Springbrook
The most frequent times of departure to work in Springbrook are 12:00 AM to 4:59 AM (3, 33.3%) for males and 7:00 AM to 7:29 AM (3, 37.5%) for females.
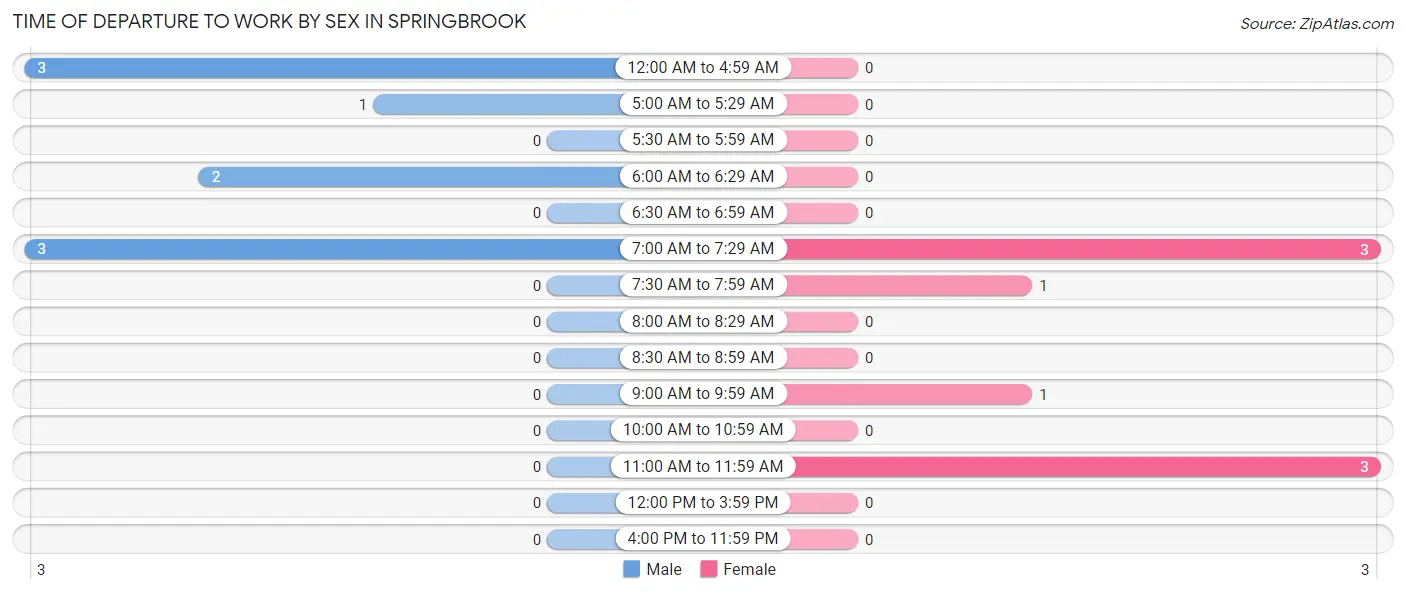
| Time of Departure | Male | Female |
| 12:00 AM to 4:59 AM | 3 (33.3%) | 0 (0.0%) |
| 5:00 AM to 5:29 AM | 1 (11.1%) | 0 (0.0%) |
| 5:30 AM to 5:59 AM | 0 (0.0%) | 0 (0.0%) |
| 6:00 AM to 6:29 AM | 2 (22.2%) | 0 (0.0%) |
| 6:30 AM to 6:59 AM | 0 (0.0%) | 0 (0.0%) |
| 7:00 AM to 7:29 AM | 3 (33.3%) | 3 (37.5%) |
| 7:30 AM to 7:59 AM | 0 (0.0%) | 1 (12.5%) |
| 8:00 AM to 8:29 AM | 0 (0.0%) | 0 (0.0%) |
| 8:30 AM to 8:59 AM | 0 (0.0%) | 0 (0.0%) |
| 9:00 AM to 9:59 AM | 0 (0.0%) | 1 (12.5%) |
| 10:00 AM to 10:59 AM | 0 (0.0%) | 0 (0.0%) |
| 11:00 AM to 11:59 AM | 0 (0.0%) | 3 (37.5%) |
| 12:00 PM to 3:59 PM | 0 (0.0%) | 0 (0.0%) |
| 4:00 PM to 11:59 PM | 0 (0.0%) | 0 (0.0%) |
| Total | 9 (100.0%) | 8 (100.0%) |
Housing Occupancy in Springbrook
Occupancy by Ownership in Springbrook
Of the total 35 dwellings in Springbrook, owner-occupied units account for 33 (94.3%), while renter-occupied units make up 2 (5.7%).
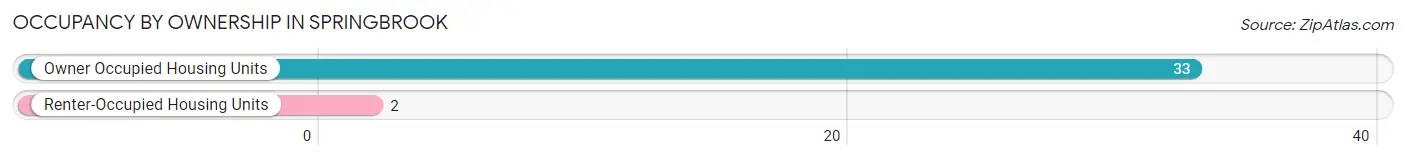
| Occupancy | # Housing Units | % Housing Units |
| Owner Occupied Housing Units | 33 | 94.3% |
| Renter-Occupied Housing Units | 2 | 5.7% |
| Total Occupied Housing Units | 35 | 100.0% |
Occupancy by Household Size in Springbrook
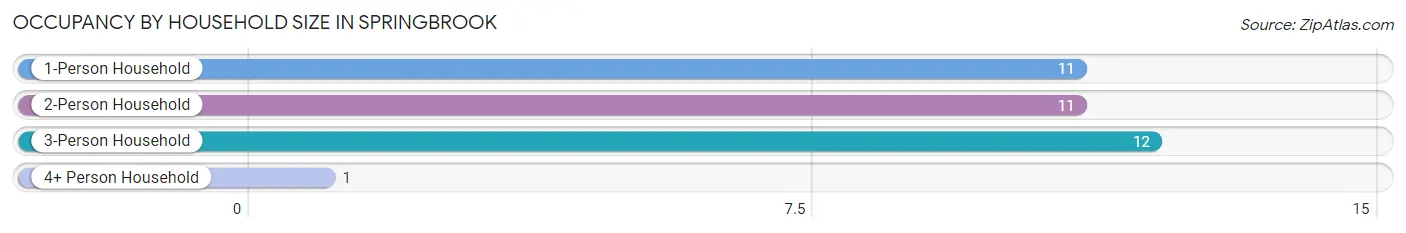
| Household Size | # Housing Units | % Housing Units |
| 1-Person Household | 11 | 31.4% |
| 2-Person Household | 11 | 31.4% |
| 3-Person Household | 12 | 34.3% |
| 4+ Person Household | 1 | 2.9% |
| Total Housing Units | 35 | 100.0% |
Occupancy by Ownership by Household Size in Springbrook
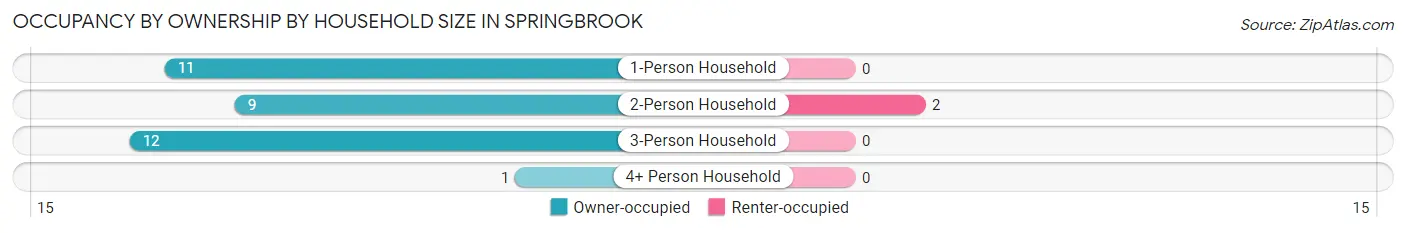
| Household Size | Owner-occupied | Renter-occupied |
| 1-Person Household | 11 (100.0%) | 0 (0.0%) |
| 2-Person Household | 9 (81.8%) | 2 (18.2%) |
| 3-Person Household | 12 (100.0%) | 0 (0.0%) |
| 4+ Person Household | 1 (100.0%) | 0 (0.0%) |
| Total Housing Units | 33 (94.3%) | 2 (5.7%) |
Occupancy by Educational Attainment in Springbrook
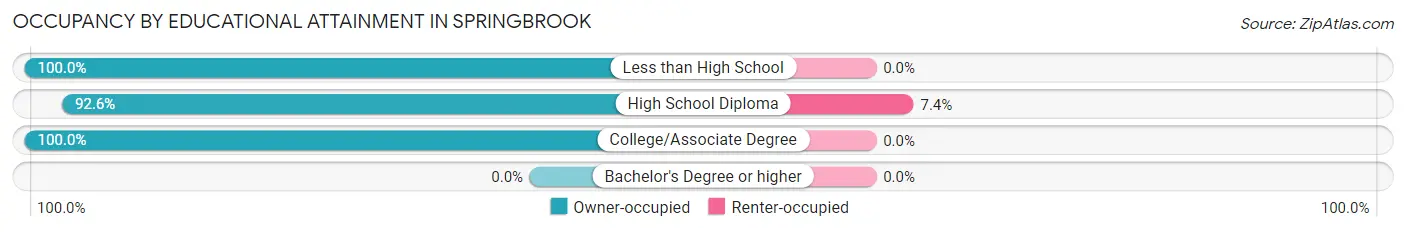
| Household Size | Owner-occupied | Renter-occupied |
| Less than High School | 2 (100.0%) | 0 (0.0%) |
| High School Diploma | 25 (92.6%) | 2 (7.4%) |
| College/Associate Degree | 6 (100.0%) | 0 (0.0%) |
| Bachelor's Degree or higher | 0 (0.0%) | 0 (0.0%) |
Occupancy by Age of Householder in Springbrook
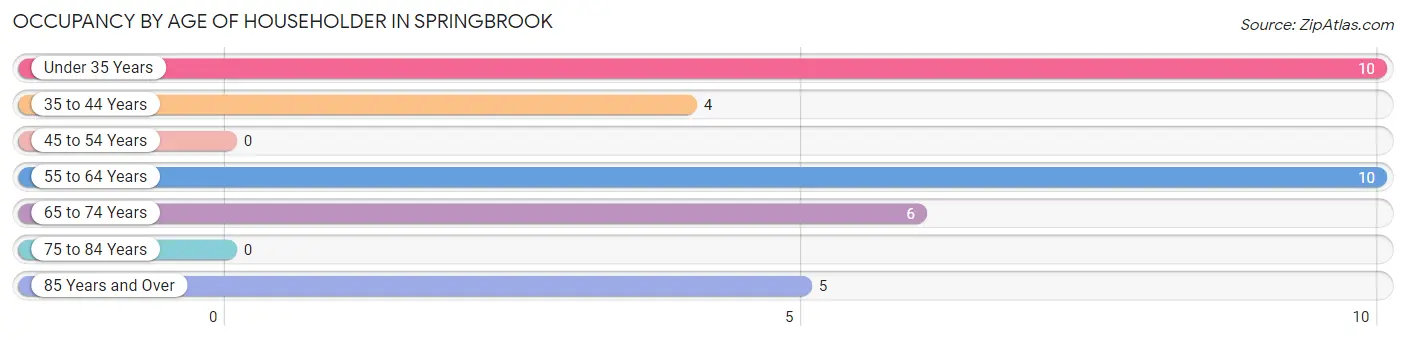
| Age Bracket | # Households | % Households |
| Under 35 Years | 10 | 28.6% |
| 35 to 44 Years | 4 | 11.4% |
| 45 to 54 Years | 0 | 0.0% |
| 55 to 64 Years | 10 | 28.6% |
| 65 to 74 Years | 6 | 17.1% |
| 75 to 84 Years | 0 | 0.0% |
| 85 Years and Over | 5 | 14.3% |
| Total | 35 | 100.0% |
Housing Finances in Springbrook
Median Income by Occupancy in Springbrook
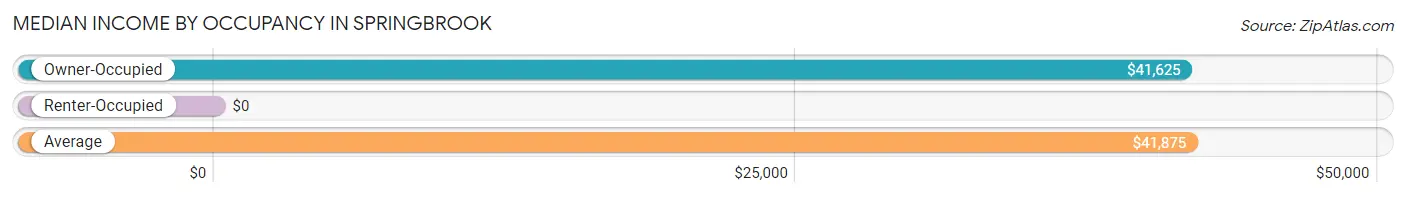
| Occupancy Type | # Households | Median Income |
| Owner-Occupied | 33 (94.3%) | $41,625 |
| Renter-Occupied | 2 (5.7%) | $0 |
| Average | 35 (100.0%) | $41,875 |
Occupancy by Householder Income Bracket in Springbrook
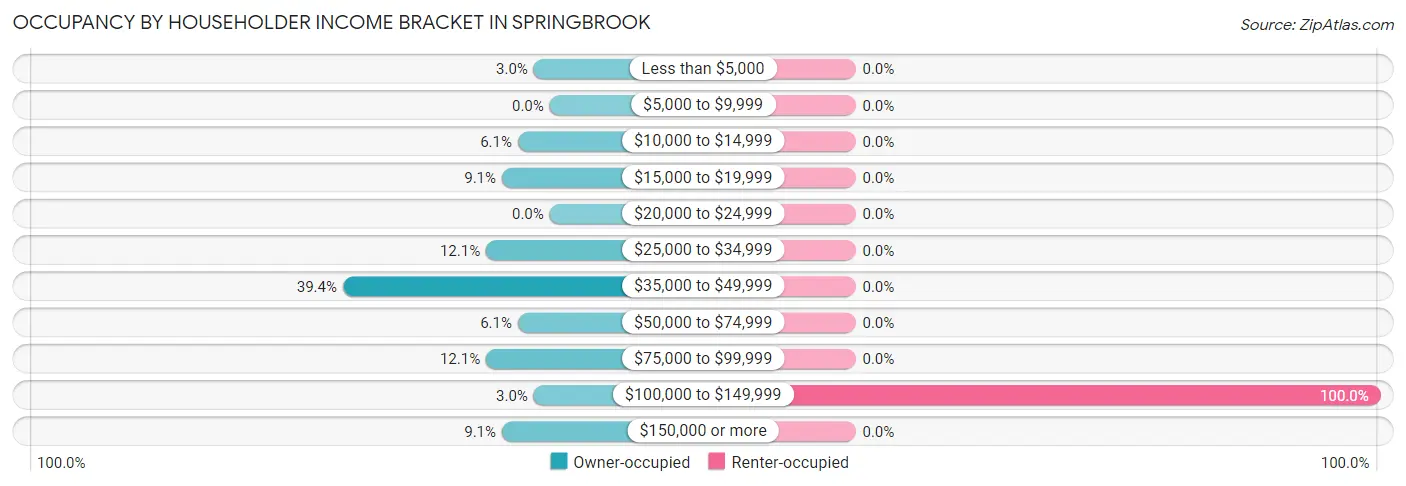
| Income Bracket | Owner-occupied | Renter-occupied |
| Less than $5,000 | 1 (3.0%) | 0 (0.0%) |
| $5,000 to $9,999 | 0 (0.0%) | 0 (0.0%) |
| $10,000 to $14,999 | 2 (6.1%) | 0 (0.0%) |
| $15,000 to $19,999 | 3 (9.1%) | 0 (0.0%) |
| $20,000 to $24,999 | 0 (0.0%) | 0 (0.0%) |
| $25,000 to $34,999 | 4 (12.1%) | 0 (0.0%) |
| $35,000 to $49,999 | 13 (39.4%) | 0 (0.0%) |
| $50,000 to $74,999 | 2 (6.1%) | 0 (0.0%) |
| $75,000 to $99,999 | 4 (12.1%) | 0 (0.0%) |
| $100,000 to $149,999 | 1 (3.0%) | 2 (100.0%) |
| $150,000 or more | 3 (9.1%) | 0 (0.0%) |
| Total | 33 (100.0%) | 2 (100.0%) |
Monthly Housing Cost Tiers in Springbrook
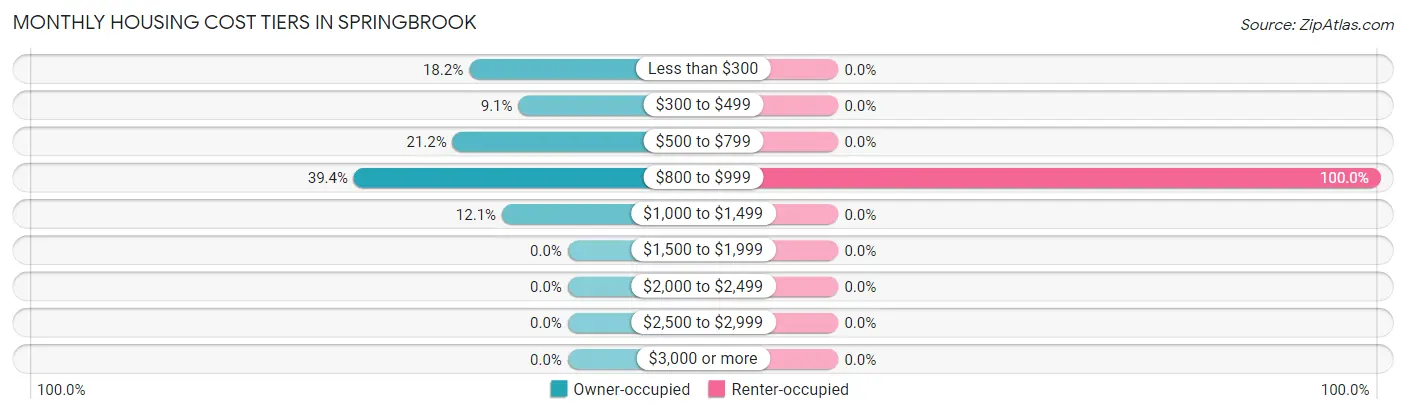
| Monthly Cost | Owner-occupied | Renter-occupied |
| Less than $300 | 6 (18.2%) | 0 (0.0%) |
| $300 to $499 | 3 (9.1%) | 0 (0.0%) |
| $500 to $799 | 7 (21.2%) | 0 (0.0%) |
| $800 to $999 | 13 (39.4%) | 2 (100.0%) |
| $1,000 to $1,499 | 4 (12.1%) | 0 (0.0%) |
| $1,500 to $1,999 | 0 (0.0%) | 0 (0.0%) |
| $2,000 to $2,499 | 0 (0.0%) | 0 (0.0%) |
| $2,500 to $2,999 | 0 (0.0%) | 0 (0.0%) |
| $3,000 or more | 0 (0.0%) | 0 (0.0%) |
| Total | 33 (100.0%) | 2 (100.0%) |
Physical Housing Characteristics in Springbrook
Housing Structures in Springbrook
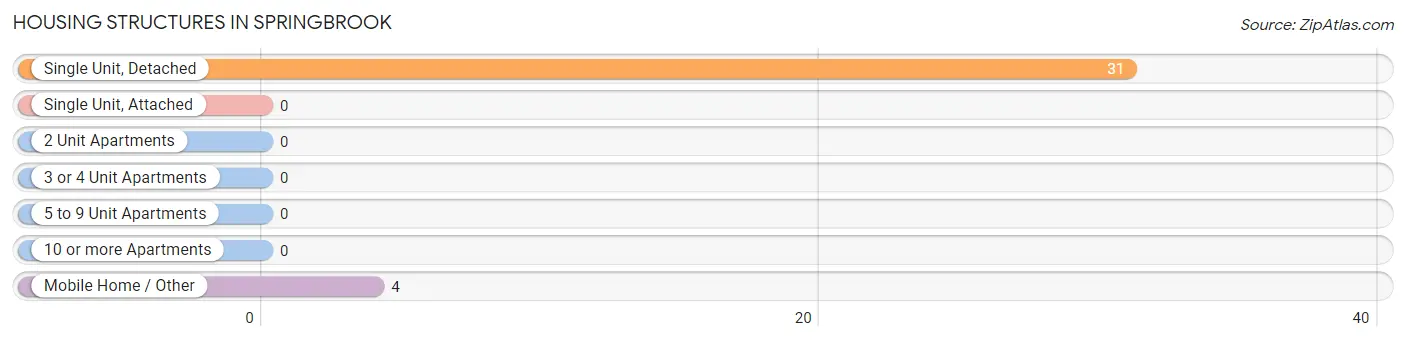
| Structure Type | # Housing Units | % Housing Units |
| Single Unit, Detached | 31 | 88.6% |
| Single Unit, Attached | 0 | 0.0% |
| 2 Unit Apartments | 0 | 0.0% |
| 3 or 4 Unit Apartments | 0 | 0.0% |
| 5 to 9 Unit Apartments | 0 | 0.0% |
| 10 or more Apartments | 0 | 0.0% |
| Mobile Home / Other | 4 | 11.4% |
| Total | 35 | 100.0% |
Housing Structures by Occupancy in Springbrook
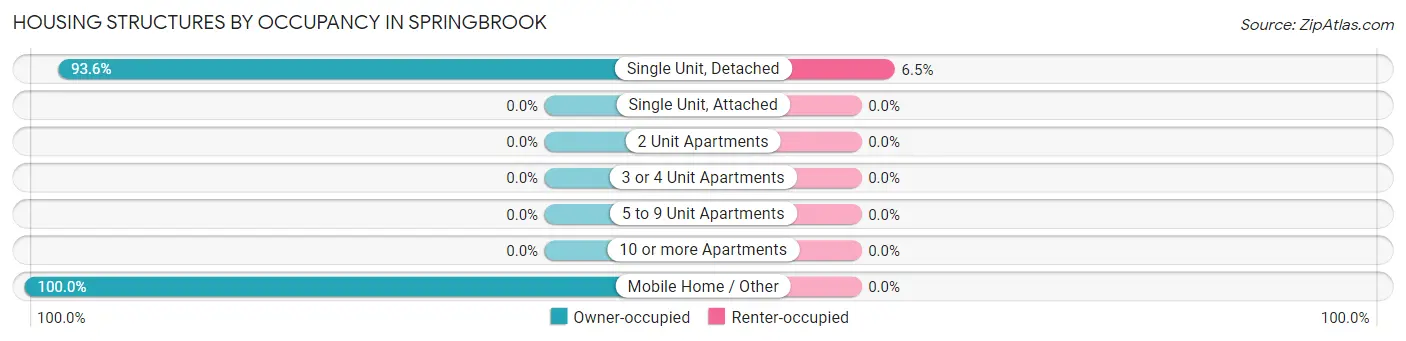
| Structure Type | Owner-occupied | Renter-occupied |
| Single Unit, Detached | 29 (93.5%) | 2 (6.5%) |
| Single Unit, Attached | 0 (0.0%) | 0 (0.0%) |
| 2 Unit Apartments | 0 (0.0%) | 0 (0.0%) |
| 3 or 4 Unit Apartments | 0 (0.0%) | 0 (0.0%) |
| 5 to 9 Unit Apartments | 0 (0.0%) | 0 (0.0%) |
| 10 or more Apartments | 0 (0.0%) | 0 (0.0%) |
| Mobile Home / Other | 4 (100.0%) | 0 (0.0%) |
| Total | 33 (94.3%) | 2 (5.7%) |
Housing Structures by Number of Rooms in Springbrook
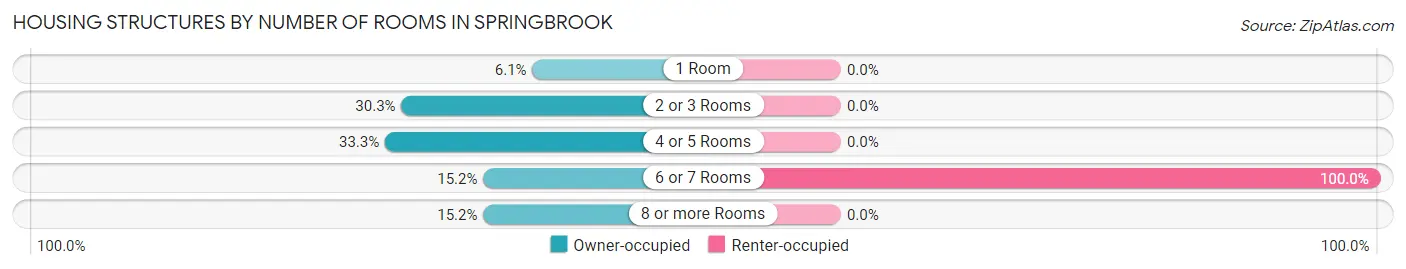
| Number of Rooms | Owner-occupied | Renter-occupied |
| 1 Room | 2 (6.1%) | 0 (0.0%) |
| 2 or 3 Rooms | 10 (30.3%) | 0 (0.0%) |
| 4 or 5 Rooms | 11 (33.3%) | 0 (0.0%) |
| 6 or 7 Rooms | 5 (15.1%) | 2 (100.0%) |
| 8 or more Rooms | 5 (15.1%) | 0 (0.0%) |
| Total | 33 (100.0%) | 2 (100.0%) |
Housing Structure by Heating Type in Springbrook
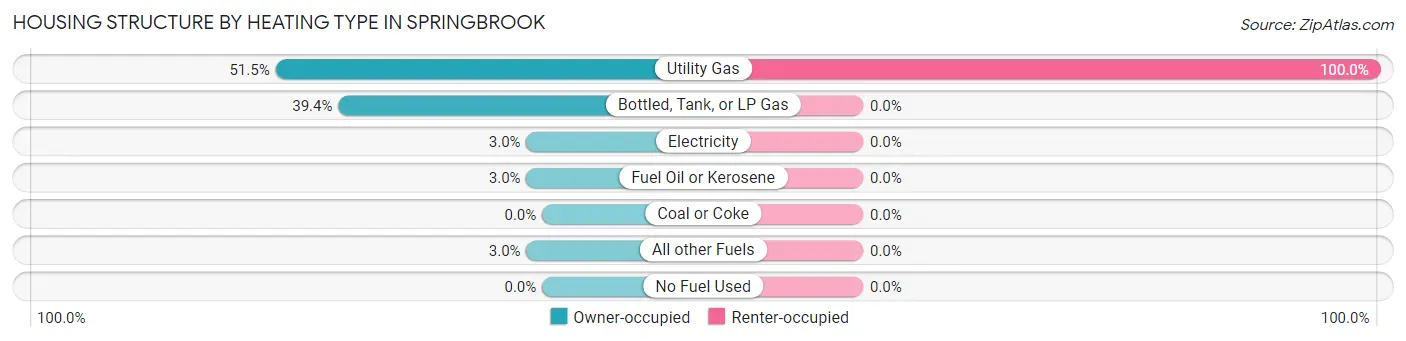
| Heating Type | Owner-occupied | Renter-occupied |
| Utility Gas | 17 (51.5%) | 2 (100.0%) |
| Bottled, Tank, or LP Gas | 13 (39.4%) | 0 (0.0%) |
| Electricity | 1 (3.0%) | 0 (0.0%) |
| Fuel Oil or Kerosene | 1 (3.0%) | 0 (0.0%) |
| Coal or Coke | 0 (0.0%) | 0 (0.0%) |
| All other Fuels | 1 (3.0%) | 0 (0.0%) |
| No Fuel Used | 0 (0.0%) | 0 (0.0%) |
| Total | 33 (100.0%) | 2 (100.0%) |
Household Vehicle Usage in Springbrook
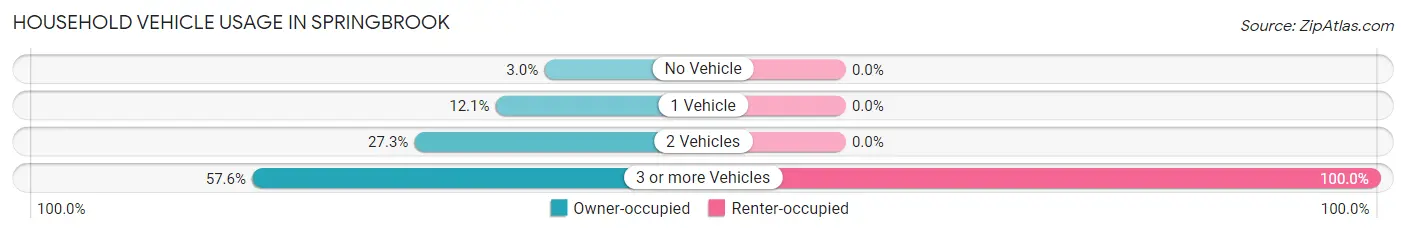
| Vehicles per Household | Owner-occupied | Renter-occupied |
| No Vehicle | 1 (3.0%) | 0 (0.0%) |
| 1 Vehicle | 4 (12.1%) | 0 (0.0%) |
| 2 Vehicles | 9 (27.3%) | 0 (0.0%) |
| 3 or more Vehicles | 19 (57.6%) | 2 (100.0%) |
| Total | 33 (100.0%) | 2 (100.0%) |
Real Estate & Mortgages in Springbrook
Real Estate and Mortgage Overview in Springbrook
| Characteristic | Without Mortgage | With Mortgage |
| Housing Units | 14 | 19 |
| Median Property Value | $106,300 | $111,300 |
| Median Household Income | $29,167 | $3 |
| Monthly Housing Costs | $400 | $0 |
| Real Estate Taxes | $1,125 | $0 |
Property Value by Mortgage Status in Springbrook
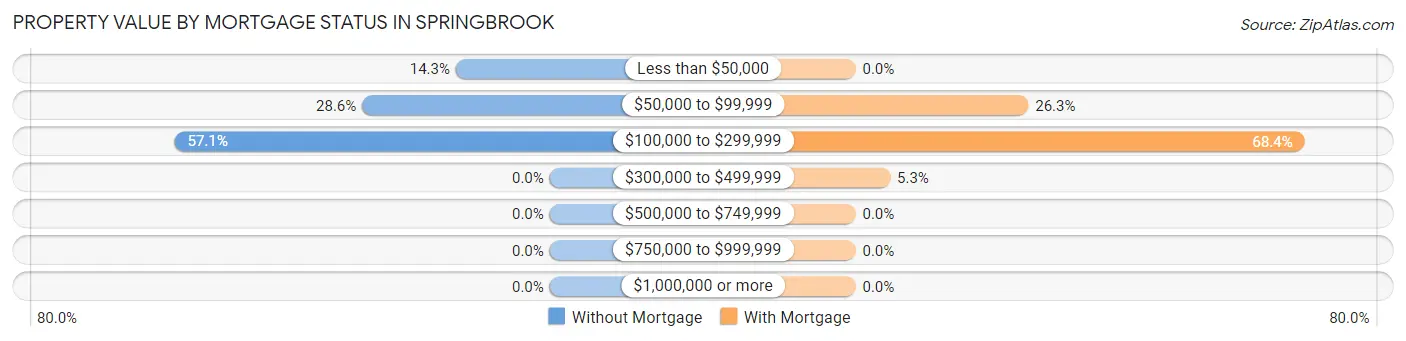
| Property Value | Without Mortgage | With Mortgage |
| Less than $50,000 | 2 (14.3%) | 0 (0.0%) |
| $50,000 to $99,999 | 4 (28.6%) | 5 (26.3%) |
| $100,000 to $299,999 | 8 (57.1%) | 13 (68.4%) |
| $300,000 to $499,999 | 0 (0.0%) | 1 (5.3%) |
| $500,000 to $749,999 | 0 (0.0%) | 0 (0.0%) |
| $750,000 to $999,999 | 0 (0.0%) | 0 (0.0%) |
| $1,000,000 or more | 0 (0.0%) | 0 (0.0%) |
| Total | 14 (100.0%) | 19 (100.0%) |
Household Income by Mortgage Status in Springbrook
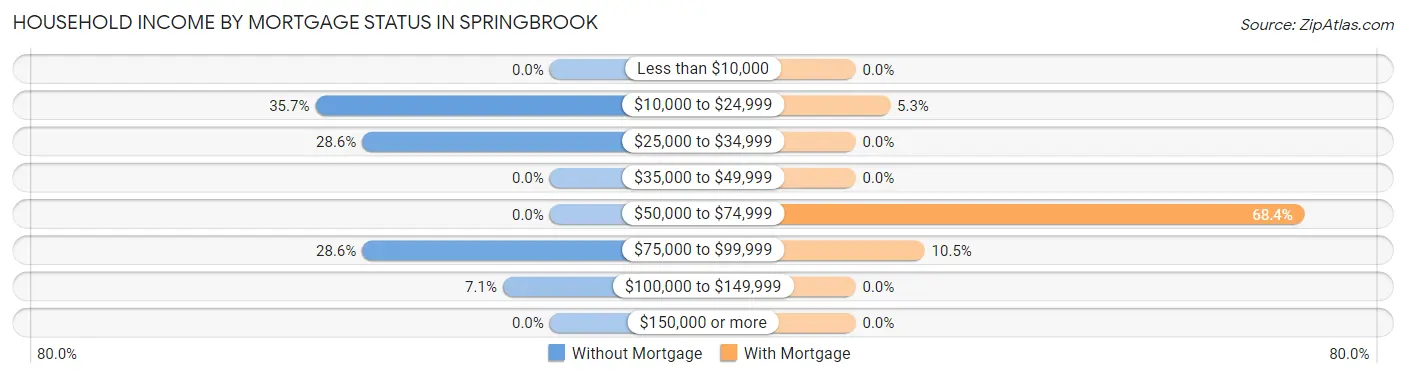
| Household Income | Without Mortgage | With Mortgage |
| Less than $10,000 | 0 (0.0%) | 0 (0.0%) |
| $10,000 to $24,999 | 5 (35.7%) | 1 (5.3%) |
| $25,000 to $34,999 | 4 (28.6%) | 0 (0.0%) |
| $35,000 to $49,999 | 0 (0.0%) | 0 (0.0%) |
| $50,000 to $74,999 | 0 (0.0%) | 13 (68.4%) |
| $75,000 to $99,999 | 4 (28.6%) | 2 (10.5%) |
| $100,000 to $149,999 | 1 (7.1%) | 0 (0.0%) |
| $150,000 or more | 0 (0.0%) | 0 (0.0%) |
| Total | 14 (100.0%) | 19 (100.0%) |
Property Value to Household Income Ratio in Springbrook
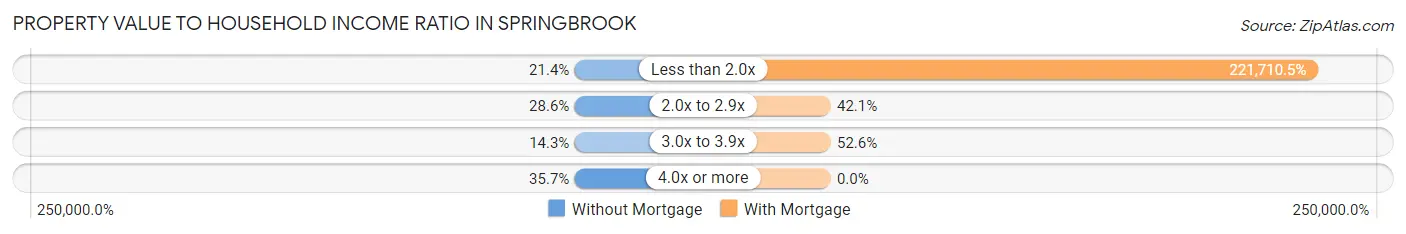
| Value-to-Income Ratio | Without Mortgage | With Mortgage |
| Less than 2.0x | 3 (21.4%) | 42,125 (221,710.5%) |
| 2.0x to 2.9x | 4 (28.6%) | 8 (42.1%) |
| 3.0x to 3.9x | 2 (14.3%) | 10 (52.6%) |
| 4.0x or more | 5 (35.7%) | 0 (0.0%) |
| Total | 14 (100.0%) | 19 (100.0%) |
Real Estate Taxes by Mortgage Status in Springbrook
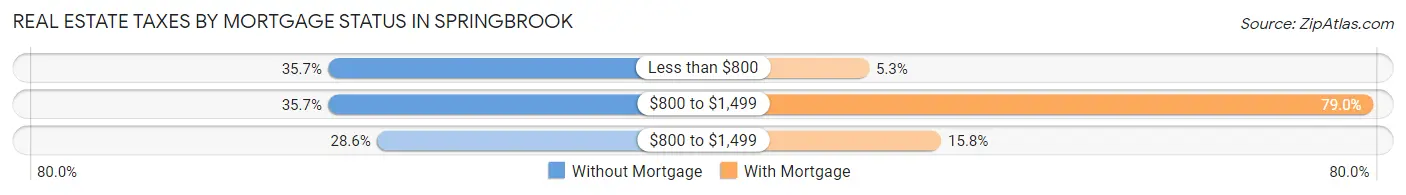
| Property Taxes | Without Mortgage | With Mortgage |
| Less than $800 | 5 (35.7%) | 1 (5.3%) |
| $800 to $1,499 | 5 (35.7%) | 15 (78.9%) |
| $800 to $1,499 | 4 (28.6%) | 3 (15.8%) |
| Total | 14 (100.0%) | 19 (100.0%) |
Health & Disability in Springbrook
Health Insurance Coverage by Age in Springbrook
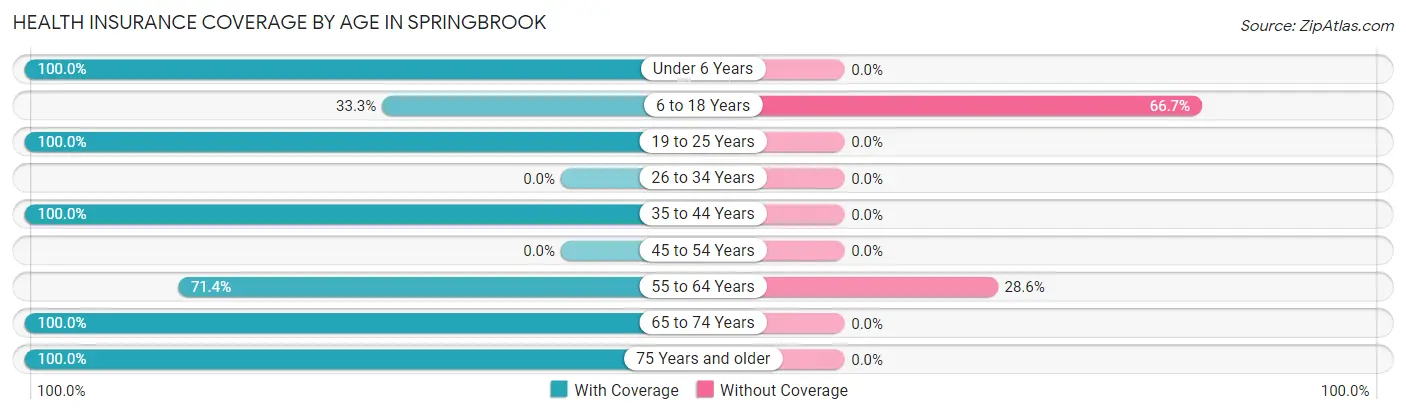
| Age Bracket | With Coverage | Without Coverage |
| Under 6 Years | 7 (100.0%) | 0 (0.0%) |
| 6 to 18 Years | 2 (33.3%) | 4 (66.7%) |
| 19 to 25 Years | 19 (100.0%) | 0 (0.0%) |
| 26 to 34 Years | 0 (0.0%) | 0 (0.0%) |
| 35 to 44 Years | 10 (100.0%) | 0 (0.0%) |
| 45 to 54 Years | 0 (0.0%) | 0 (0.0%) |
| 55 to 64 Years | 10 (71.4%) | 4 (28.6%) |
| 65 to 74 Years | 8 (100.0%) | 0 (0.0%) |
| 75 Years and older | 10 (100.0%) | 0 (0.0%) |
| Total | 66 (89.2%) | 8 (10.8%) |
Health Insurance Coverage by Citizenship Status in Springbrook
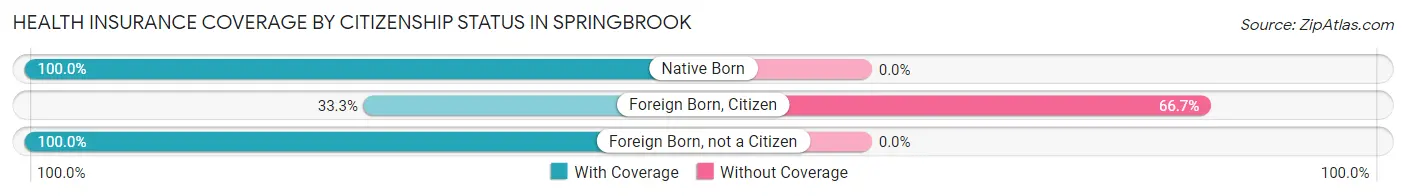
| Citizenship Status | With Coverage | Without Coverage |
| Native Born | 7 (100.0%) | 0 (0.0%) |
| Foreign Born, Citizen | 2 (33.3%) | 4 (66.7%) |
| Foreign Born, not a Citizen | 19 (100.0%) | 0 (0.0%) |
Health Insurance Coverage by Household Income in Springbrook
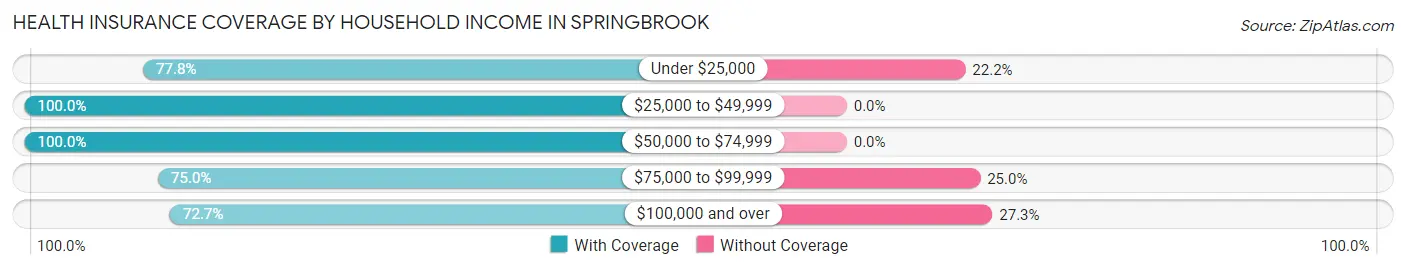
| Household Income | With Coverage | Without Coverage |
| Under $25,000 | 7 (77.8%) | 2 (22.2%) |
| $25,000 to $49,999 | 40 (100.0%) | 0 (0.0%) |
| $50,000 to $74,999 | 2 (100.0%) | 0 (0.0%) |
| $75,000 to $99,999 | 9 (75.0%) | 3 (25.0%) |
| $100,000 and over | 8 (72.7%) | 3 (27.3%) |
Public vs Private Health Insurance Coverage by Age in Springbrook
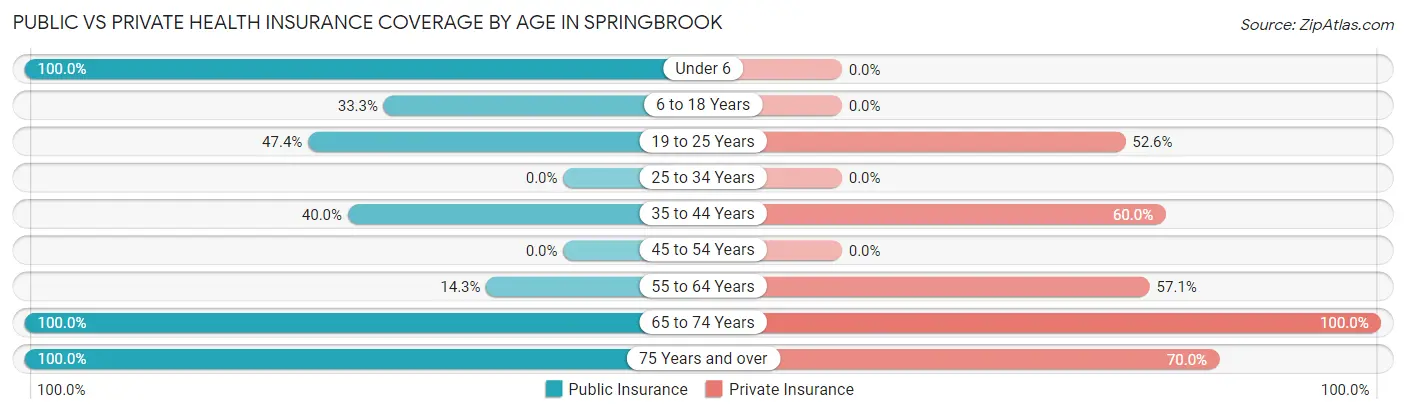
| Age Bracket | Public Insurance | Private Insurance |
| Under 6 | 7 (100.0%) | 0 (0.0%) |
| 6 to 18 Years | 2 (33.3%) | 0 (0.0%) |
| 19 to 25 Years | 9 (47.4%) | 10 (52.6%) |
| 25 to 34 Years | 0 (0.0%) | 0 (0.0%) |
| 35 to 44 Years | 4 (40.0%) | 6 (60.0%) |
| 45 to 54 Years | 0 (0.0%) | 0 (0.0%) |
| 55 to 64 Years | 2 (14.3%) | 8 (57.1%) |
| 65 to 74 Years | 8 (100.0%) | 8 (100.0%) |
| 75 Years and over | 10 (100.0%) | 7 (70.0%) |
| Total | 42 (56.8%) | 39 (52.7%) |
Disability Status by Sex by Age in Springbrook

| Age Bracket | Male | Female |
| Under 5 Years | 0 (0.0%) | 0 (0.0%) |
| 5 to 17 Years | 2 (33.3%) | 0 (0.0%) |
| 18 to 34 Years | 0 (0.0%) | 0 (0.0%) |
| 35 to 64 Years | 4 (30.8%) | 4 (36.4%) |
| 65 to 74 Years | 2 (33.3%) | 0 (0.0%) |
| 75 Years and over | 2 (100.0%) | 3 (37.5%) |
Disability Class by Sex by Age in Springbrook
Disability Class: Hearing Difficulty
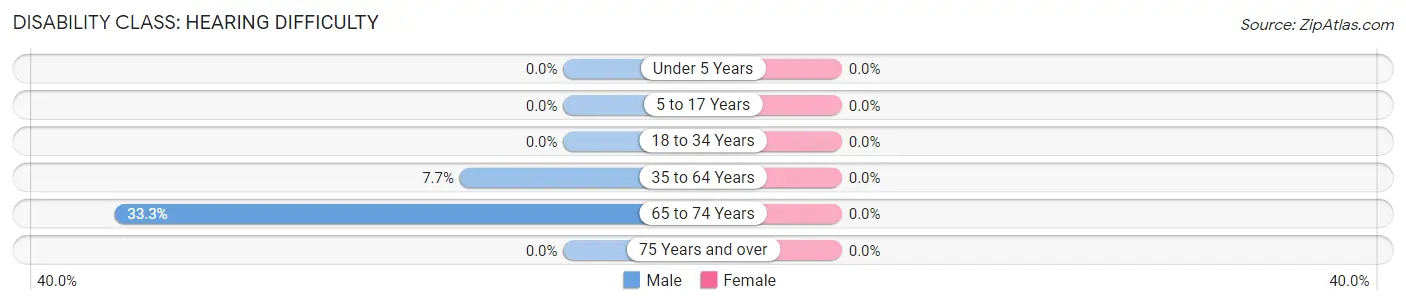
| Age Bracket | Male | Female |
| Under 5 Years | 0 (0.0%) | 0 (0.0%) |
| 5 to 17 Years | 0 (0.0%) | 0 (0.0%) |
| 18 to 34 Years | 0 (0.0%) | 0 (0.0%) |
| 35 to 64 Years | 1 (7.7%) | 0 (0.0%) |
| 65 to 74 Years | 2 (33.3%) | 0 (0.0%) |
| 75 Years and over | 0 (0.0%) | 0 (0.0%) |
Disability Class: Vision Difficulty
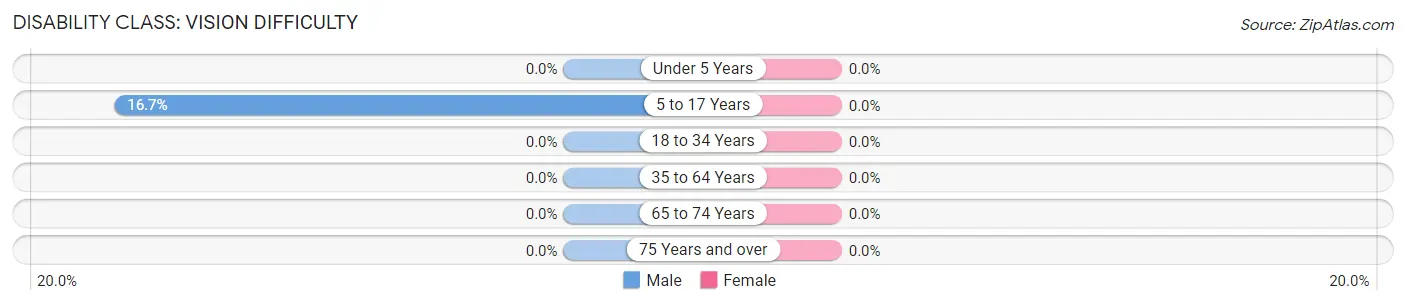
| Age Bracket | Male | Female |
| Under 5 Years | 0 (0.0%) | 0 (0.0%) |
| 5 to 17 Years | 1 (16.7%) | 0 (0.0%) |
| 18 to 34 Years | 0 (0.0%) | 0 (0.0%) |
| 35 to 64 Years | 0 (0.0%) | 0 (0.0%) |
| 65 to 74 Years | 0 (0.0%) | 0 (0.0%) |
| 75 Years and over | 0 (0.0%) | 0 (0.0%) |
Disability Class: Cognitive Difficulty
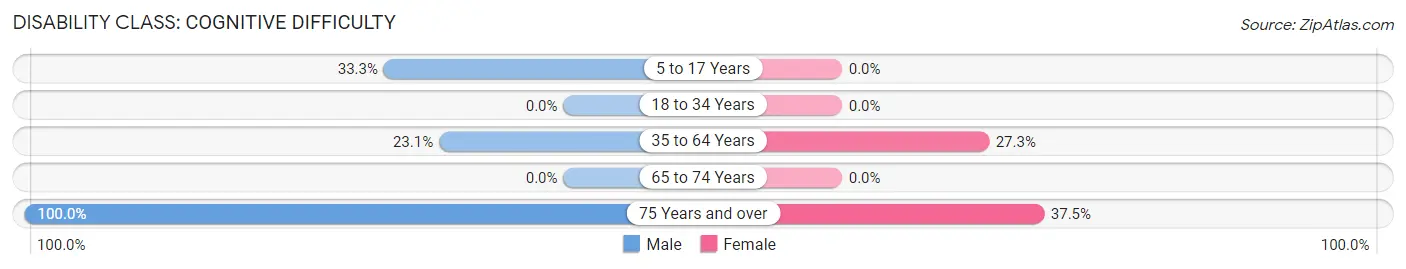
| Age Bracket | Male | Female |
| 5 to 17 Years | 2 (33.3%) | 0 (0.0%) |
| 18 to 34 Years | 0 (0.0%) | 0 (0.0%) |
| 35 to 64 Years | 3 (23.1%) | 3 (27.3%) |
| 65 to 74 Years | 0 (0.0%) | 0 (0.0%) |
| 75 Years and over | 2 (100.0%) | 3 (37.5%) |
Disability Class: Ambulatory Difficulty
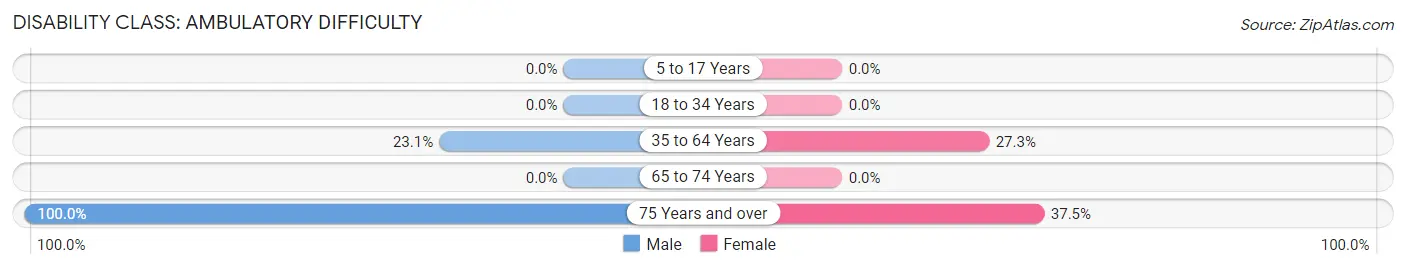
| Age Bracket | Male | Female |
| 5 to 17 Years | 0 (0.0%) | 0 (0.0%) |
| 18 to 34 Years | 0 (0.0%) | 0 (0.0%) |
| 35 to 64 Years | 3 (23.1%) | 3 (27.3%) |
| 65 to 74 Years | 0 (0.0%) | 0 (0.0%) |
| 75 Years and over | 2 (100.0%) | 3 (37.5%) |
Disability Class: Self-Care Difficulty
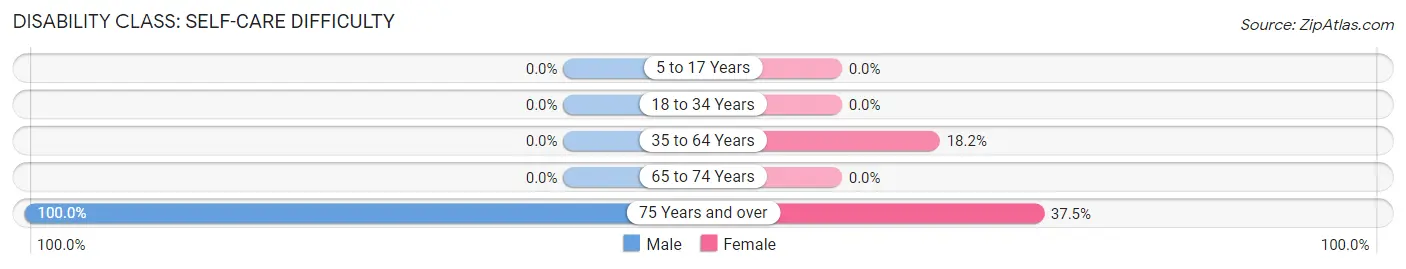
| Age Bracket | Male | Female |
| 5 to 17 Years | 0 (0.0%) | 0 (0.0%) |
| 18 to 34 Years | 0 (0.0%) | 0 (0.0%) |
| 35 to 64 Years | 0 (0.0%) | 2 (18.2%) |
| 65 to 74 Years | 0 (0.0%) | 0 (0.0%) |
| 75 Years and over | 2 (100.0%) | 3 (37.5%) |
Technology Access in Springbrook
Computing Device Access in Springbrook
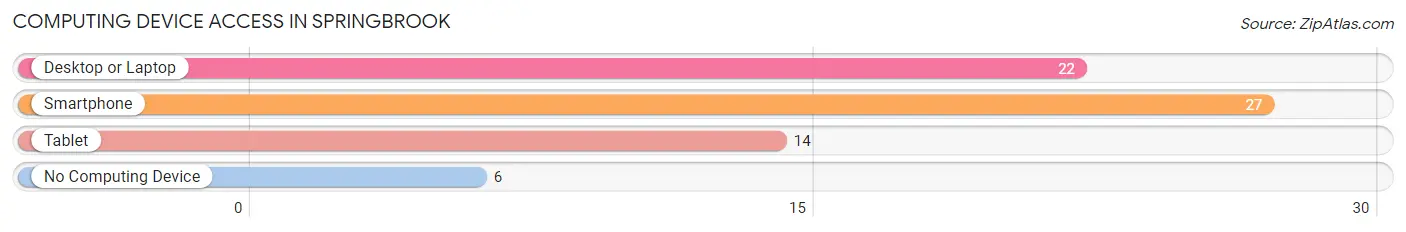
| Device Type | # Households | % Households |
| Desktop or Laptop | 22 | 62.9% |
| Smartphone | 27 | 77.1% |
| Tablet | 14 | 40.0% |
| No Computing Device | 6 | 17.1% |
| Total | 35 | 100.0% |
Internet Access in Springbrook
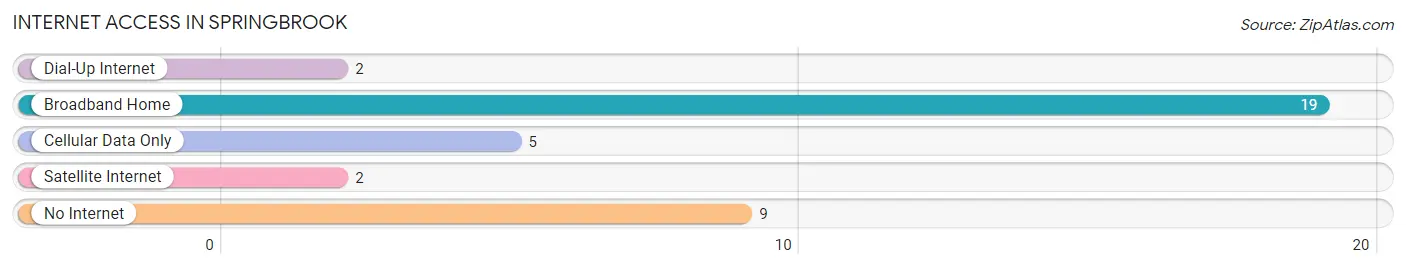
| Internet Type | # Households | % Households |
| Dial-Up Internet | 2 | 5.7% |
| Broadband Home | 19 | 54.3% |
| Cellular Data Only | 5 | 14.3% |
| Satellite Internet | 2 | 5.7% |
| No Internet | 9 | 25.7% |
| Total | 35 | 100.0% |
Springbrook Summary
History
Springbrook, Wisconsin is a small unincorporated community located in the town of Springbrook in Douglas County. The community was first settled in the late 1800s by a group of Norwegian immigrants who were looking for a place to call home. The first settlers were mostly farmers and the community grew slowly over the years. The first post office was established in 1891 and the first school was built in 1895.
The community was named after the nearby Spring Brook, which was a popular fishing spot for the early settlers. The community was also known for its logging industry, which provided jobs for many of the residents. The logging industry eventually declined in the early 1900s, but the community continued to grow and thrive.
In the early 1900s, the community was home to a number of businesses, including a general store, a blacksmith shop, a sawmill, and a cheese factory. The cheese factory was especially important to the community, as it provided a steady source of income for many of the residents.
The community also had a number of churches, including the Norwegian Lutheran Church, which was founded in 1891. The church was a major part of the community and served as a gathering place for the residents.
Geography
Springbrook is located in the town of Springbrook in Douglas County, Wisconsin. The community is situated on the banks of the Spring Brook, which is a tributary of the Chippewa River. The community is surrounded by rolling hills and forests, and is located about 25 miles north of the city of Superior.
The climate in Springbrook is typical of the Upper Midwest, with cold winters and warm summers. The average annual temperature is around 40 degrees Fahrenheit, and the average annual precipitation is around 30 inches.
Economy
The economy of Springbrook is largely based on agriculture and tourism. The community is home to a number of small farms, which produce a variety of crops, including corn, soybeans, and hay. The farms also provide jobs for many of the residents.
The community is also home to a number of tourist attractions, including the Spring Brook Resort, which offers a variety of recreational activities, such as fishing, boating, and hiking. The resort also provides lodging and dining options for visitors.
Demographics
As of the 2010 census, the population of Springbrook was 1,093. The racial makeup of the community was 97.3% White, 0.7% African American, 0.2% Native American, 0.2% Asian, 0.1% Pacific Islander, and 1.5% from other races. The median household income was $41,250, and the median family income was $50,000.
The population of Springbrook is largely rural, with most of the residents living in single-family homes. The community is served by a number of small businesses, including a general store, a gas station, and a few restaurants. The community also has a post office and a library.
Common Questions
What is Per Capita Income in Springbrook?
Per Capita income in Springbrook is $26,978.
What is the Median Family Income in Springbrook?
Median Family Income in Springbrook is $33,875.
What is the Median Household income in Springbrook?
Median Household Income in Springbrook is $41,875.
What is Inequality or Gini Index in Springbrook?
Inequality or Gini Index in Springbrook is 0.40.
What is the Total Population of Springbrook?
Total Population of Springbrook is 74.
What is the Total Male Population of Springbrook?
Total Male Population of Springbrook is 37.
What is the Total Female Population of Springbrook?
Total Female Population of Springbrook is 37.
What is the Ratio of Males per 100 Females in Springbrook?
There are 100.00 Males per 100 Females in Springbrook.
What is the Ratio of Females per 100 Males in Springbrook?
There are 100.00 Females per 100 Males in Springbrook.
What is the Median Population Age in Springbrook?
Median Population Age in Springbrook is 42.3 Years.
What is the Average Family Size in Springbrook
Average Family Size in Springbrook is 2.4 People.
What is the Average Household Size in Springbrook
Average Household Size in Springbrook is 2.1 People.
How Large is the Labor Force in Springbrook?
There are 37 People in the Labor Forcein in Springbrook.
What is the Percentage of People in the Labor Force in Springbrook?
60.7% of People are in the Labor Force in Springbrook.