Polonia, WI Map & Demographics
Polonia Map
Polonia Overview
$44,274
PER CAPITA INCOME
$152,696
AVG FAMILY INCOME
$124,722
AVG HOUSEHOLD INCOME
38.1%
WAGE / INCOME GAP [ % ]
61.9¢/ $1
WAGE / INCOME GAP [ $ ]
$11,910
FAMILY INCOME DEFICIT
0.27
INEQUALITY / GINI INDEX
665
TOTAL POPULATION
352
MALE POPULATION
313
FEMALE POPULATION
112.46
MALES / 100 FEMALES
88.92
FEMALES / 100 MALES
47.2
MEDIAN AGE
3.2
AVG FAMILY SIZE
2.8
AVG HOUSEHOLD SIZE
448
LABOR FORCE [ PEOPLE ]
82.1%
PERCENT IN LABOR FORCE
2.5%
UNEMPLOYMENT RATE
Income in Polonia
Income Overview in Polonia
Per Capita Income in Polonia is $44,274, while median incomes of families and households are $152,696 and $124,722 respectively.
| Characteristic | Number | Measure |
| Per Capita Income | 665 | $44,274 |
| Median Family Income | 184 | $152,696 |
| Mean Family Income | 184 | $130,229 |
| Median Household Income | 236 | $124,722 |
| Mean Household Income | 236 | $119,281 |
| Income Deficit | 184 | $11,910 |
| Wage / Income Gap (%) | 665 | 38.05% |
| Wage / Income Gap ($) | 665 | 61.95¢ per $1 |
| Gini / Inequality Index | 665 | 0.27 |
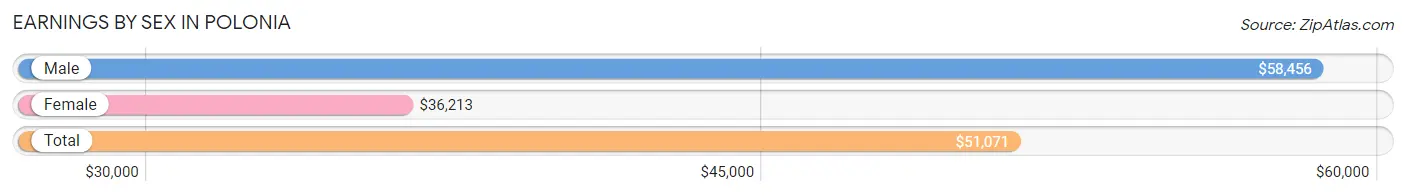
Earnings by Sex in Polonia
Average Earnings in Polonia are $51,071, $58,456 for men and $36,213 for women, a difference of 38.1%.
| Sex | Number | Average Earnings |
| Male | 231 (49.6%) | $58,456 |
| Female | 235 (50.4%) | $36,213 |
| Total | 466 (100.0%) | $51,071 |
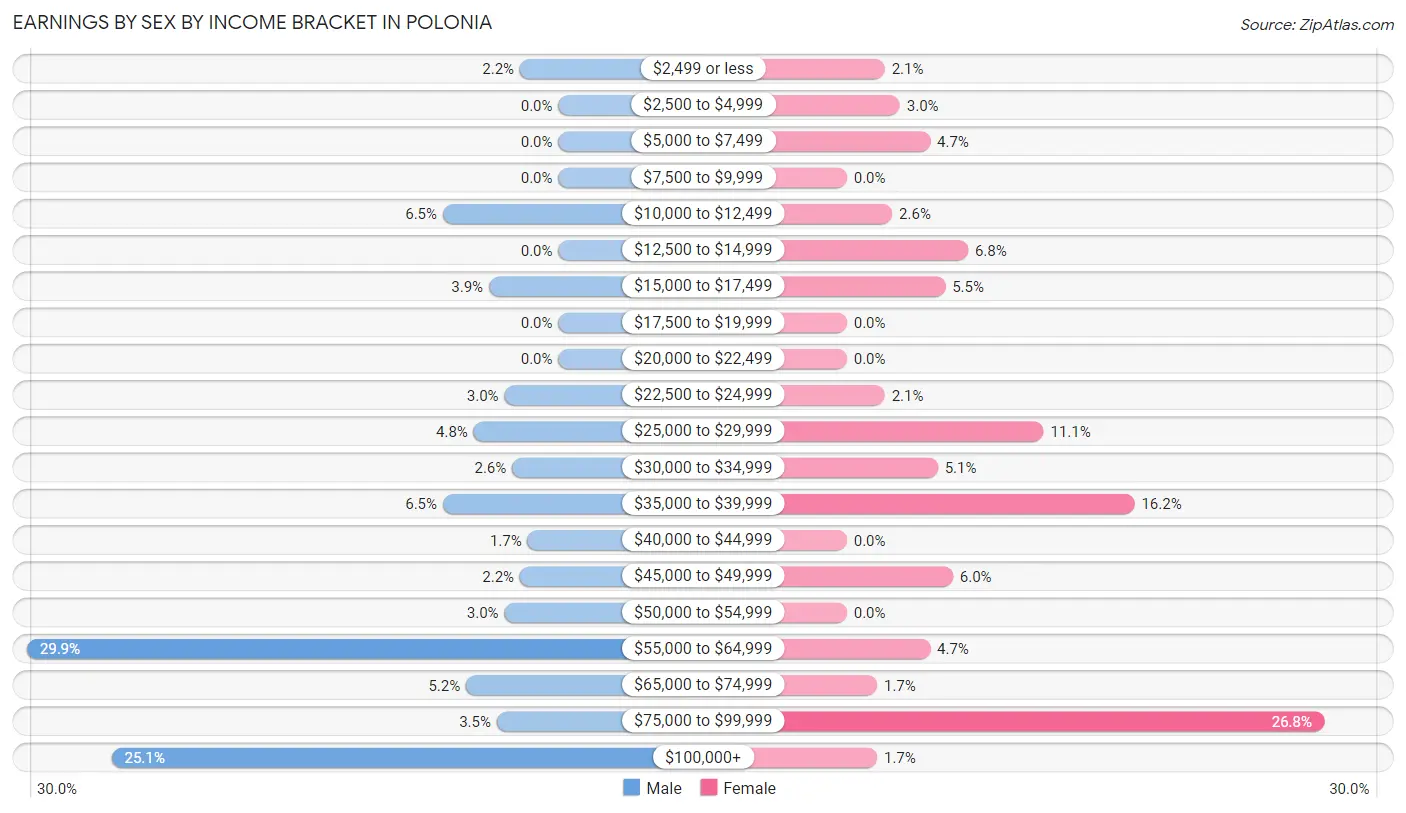
Earnings by Sex by Income Bracket in Polonia
The most common earnings brackets in Polonia are $55,000 to $64,999 for men (69 | 29.9%) and $75,000 to $99,999 for women (63 | 26.8%).
| Income | Male | Female |
| $2,499 or less | 5 (2.2%) | 5 (2.1%) |
| $2,500 to $4,999 | 0 (0.0%) | 7 (3.0%) |
| $5,000 to $7,499 | 0 (0.0%) | 11 (4.7%) |
| $7,500 to $9,999 | 0 (0.0%) | 0 (0.0%) |
| $10,000 to $12,499 | 15 (6.5%) | 6 (2.5%) |
| $12,500 to $14,999 | 0 (0.0%) | 16 (6.8%) |
| $15,000 to $17,499 | 9 (3.9%) | 13 (5.5%) |
| $17,500 to $19,999 | 0 (0.0%) | 0 (0.0%) |
| $20,000 to $22,499 | 0 (0.0%) | 0 (0.0%) |
| $22,500 to $24,999 | 7 (3.0%) | 5 (2.1%) |
| $25,000 to $29,999 | 11 (4.8%) | 26 (11.1%) |
| $30,000 to $34,999 | 6 (2.6%) | 12 (5.1%) |
| $35,000 to $39,999 | 15 (6.5%) | 38 (16.2%) |
| $40,000 to $44,999 | 4 (1.7%) | 0 (0.0%) |
| $45,000 to $49,999 | 5 (2.2%) | 14 (6.0%) |
| $50,000 to $54,999 | 7 (3.0%) | 0 (0.0%) |
| $55,000 to $64,999 | 69 (29.9%) | 11 (4.7%) |
| $65,000 to $74,999 | 12 (5.2%) | 4 (1.7%) |
| $75,000 to $99,999 | 8 (3.5%) | 63 (26.8%) |
| $100,000+ | 58 (25.1%) | 4 (1.7%) |
| Total | 231 (100.0%) | 235 (100.0%) |
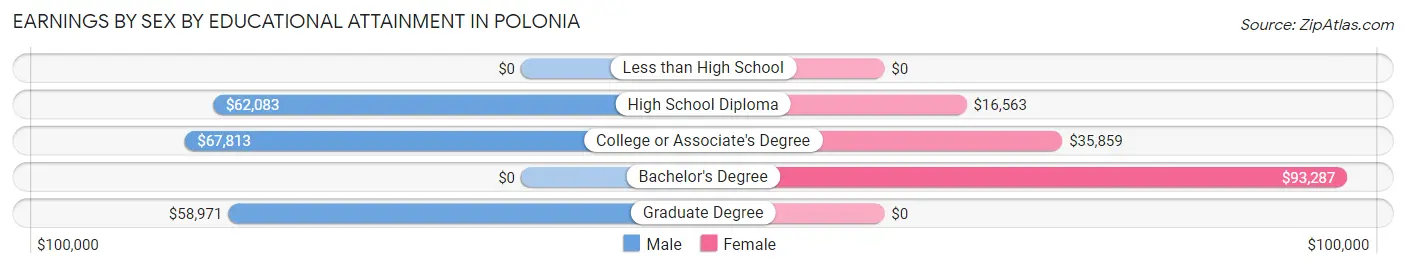
Earnings by Sex by Educational Attainment in Polonia
Average earnings in Polonia are $59,191 for men and $46,705 for women, a difference of 21.1%. Men with an educational attainment of college or associate's degree enjoy the highest average annual earnings of $67,813, while those with graduate degree education earn the least with $58,971. Women with an educational attainment of bachelor's degree earn the most with the average annual earnings of $93,287, while those with high school diploma education have the smallest earnings of $16,563.
| Educational Attainment | Male Income | Female Income |
| Less than High School | - | - |
| High School Diploma | $62,083 | $16,563 |
| College or Associate's Degree | $67,813 | $35,859 |
| Bachelor's Degree | - | - |
| Graduate Degree | $58,971 | $0 |
| Total | $59,191 | $46,705 |
Family Income in Polonia
Family Income Brackets in Polonia
According to the Polonia family income data, there are 81 families falling into the $150,000 to $199,999 income range, which is the most common income bracket and makes up 44.0% of all families.
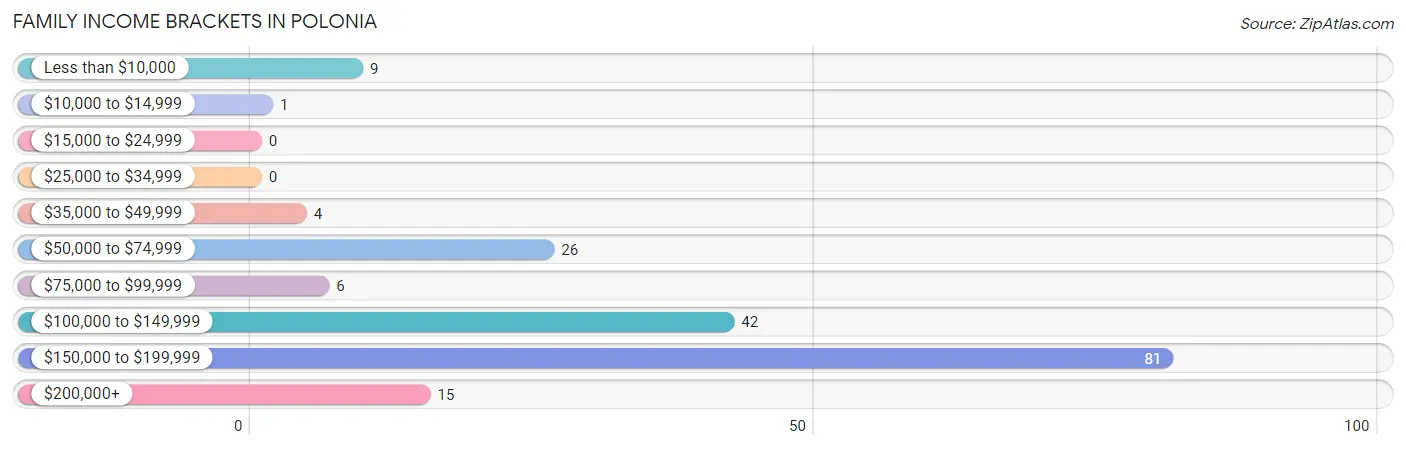
| Income Bracket | # Families | % Families |
| Less than $10,000 | 9 | 4.9% |
| $10,000 to $14,999 | 1 | 0.5% |
| $15,000 to $24,999 | 0 | 0.0% |
| $25,000 to $34,999 | 0 | 0.0% |
| $35,000 to $49,999 | 4 | 2.2% |
| $50,000 to $74,999 | 26 | 14.1% |
| $75,000 to $99,999 | 6 | 3.3% |
| $100,000 to $149,999 | 42 | 22.8% |
| $150,000 to $199,999 | 81 | 44.0% |
| $200,000+ | 15 | 8.2% |
Family Income by Famaliy Size in Polonia
4-person families (43 | 23.4%) account for the highest median family income in Polonia with $170,250 per family, while 2-person families (107 | 58.2%) have the highest median income of $76,287 per family member.
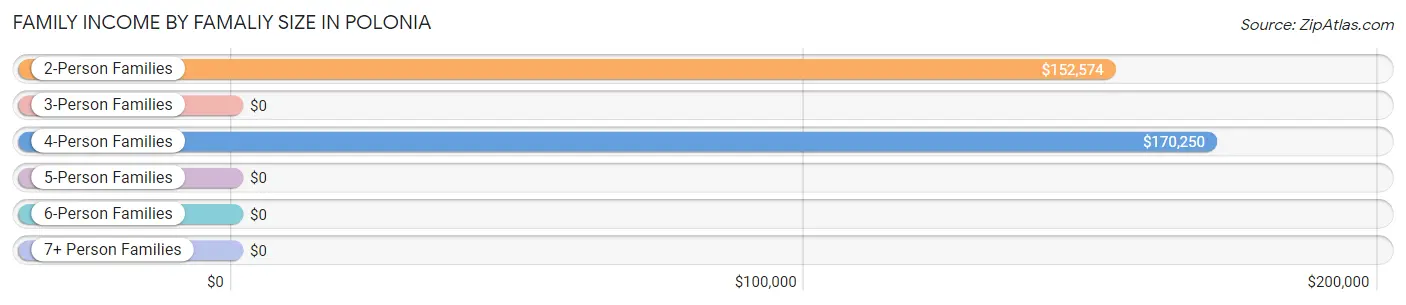
| Income Bracket | # Families | Median Income |
| 2-Person Families | 107 (58.2%) | $152,574 |
| 3-Person Families | 16 (8.7%) | $0 |
| 4-Person Families | 43 (23.4%) | $170,250 |
| 5-Person Families | 12 (6.5%) | $0 |
| 6-Person Families | 0 (0.0%) | $0 |
| 7+ Person Families | 6 (3.3%) | $0 |
| Total | 184 (100.0%) | $152,696 |
Family Income by Number of Earners in Polonia
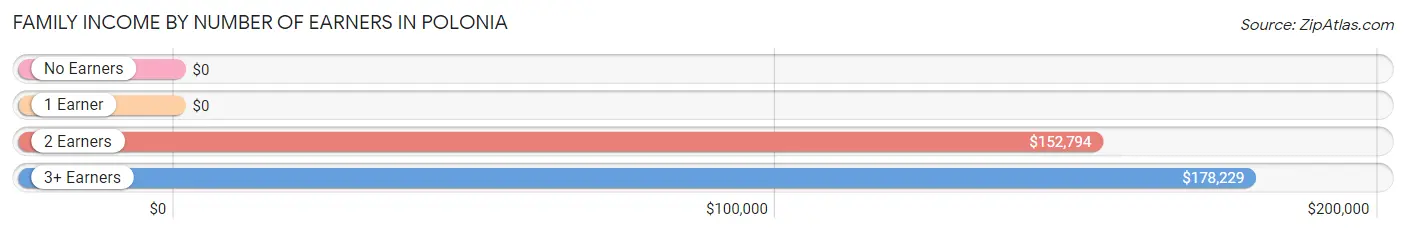
| Number of Earners | # Families | Median Income |
| No Earners | 14 (7.6%) | $0 |
| 1 Earner | 27 (14.7%) | $0 |
| 2 Earners | 98 (53.3%) | $152,794 |
| 3+ Earners | 45 (24.5%) | $178,229 |
| Total | 184 (100.0%) | $152,696 |
Household Income in Polonia
Household Income Brackets in Polonia
With 93 households falling in the category, the $150,000 to $199,999 income range is the most frequent in Polonia, accounting for 39.4% of all households.
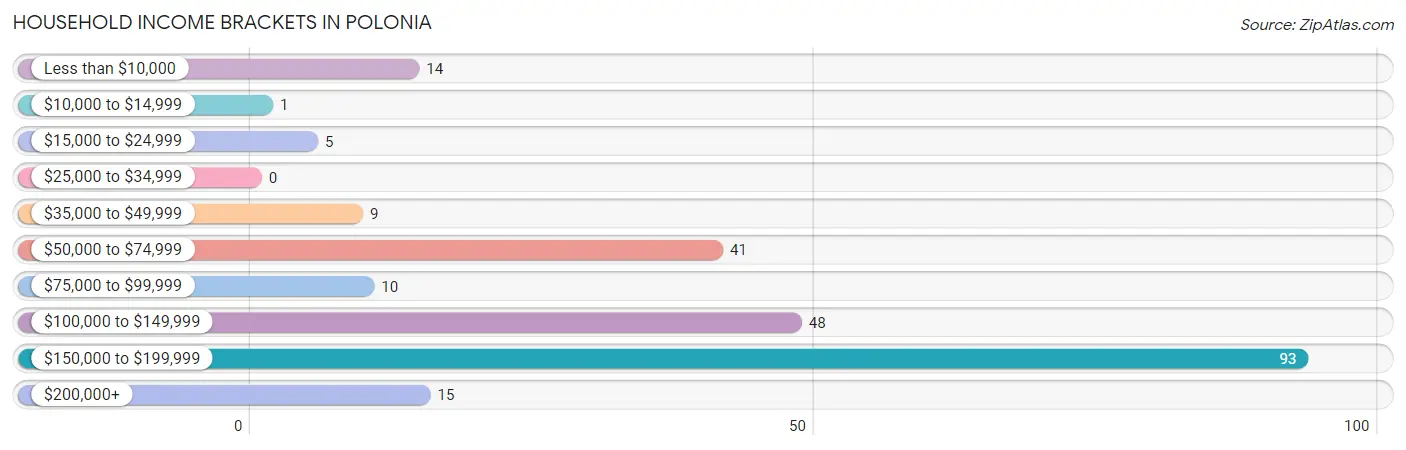
| Income Bracket | # Households | % Households |
| Less than $10,000 | 14 | 5.9% |
| $10,000 to $14,999 | 1 | 0.4% |
| $15,000 to $24,999 | 5 | 2.1% |
| $25,000 to $34,999 | 0 | 0.0% |
| $35,000 to $49,999 | 9 | 3.8% |
| $50,000 to $74,999 | 41 | 17.4% |
| $75,000 to $99,999 | 10 | 4.2% |
| $100,000 to $149,999 | 48 | 20.3% |
| $150,000 to $199,999 | 93 | 39.4% |
| $200,000+ | 15 | 6.4% |
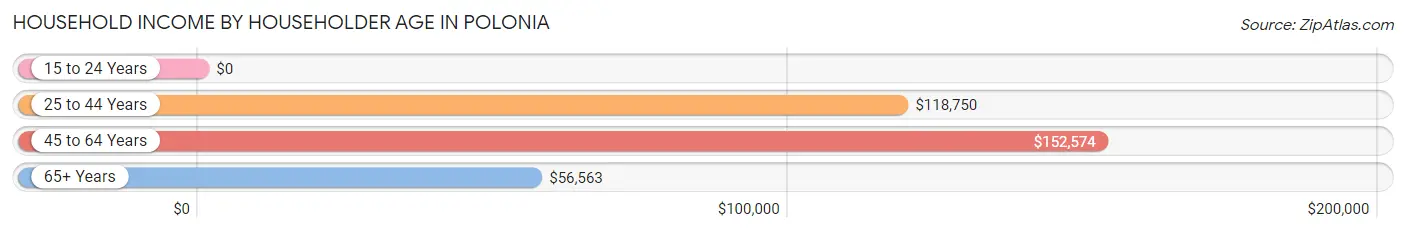
Household Income by Householder Age in Polonia
The median household income in Polonia is $124,722, with the highest median household income of $152,574 found in the 45 to 64 years age bracket for the primary householder. A total of 169 households (71.6%) fall into this category.
| Income Bracket | # Households | Median Income |
| 15 to 24 Years | 0 (0.0%) | $0 |
| 25 to 44 Years | 47 (19.9%) | $118,750 |
| 45 to 64 Years | 169 (71.6%) | $152,574 |
| 65+ Years | 20 (8.5%) | $56,563 |
| Total | 236 (100.0%) | $124,722 |
Poverty in Polonia
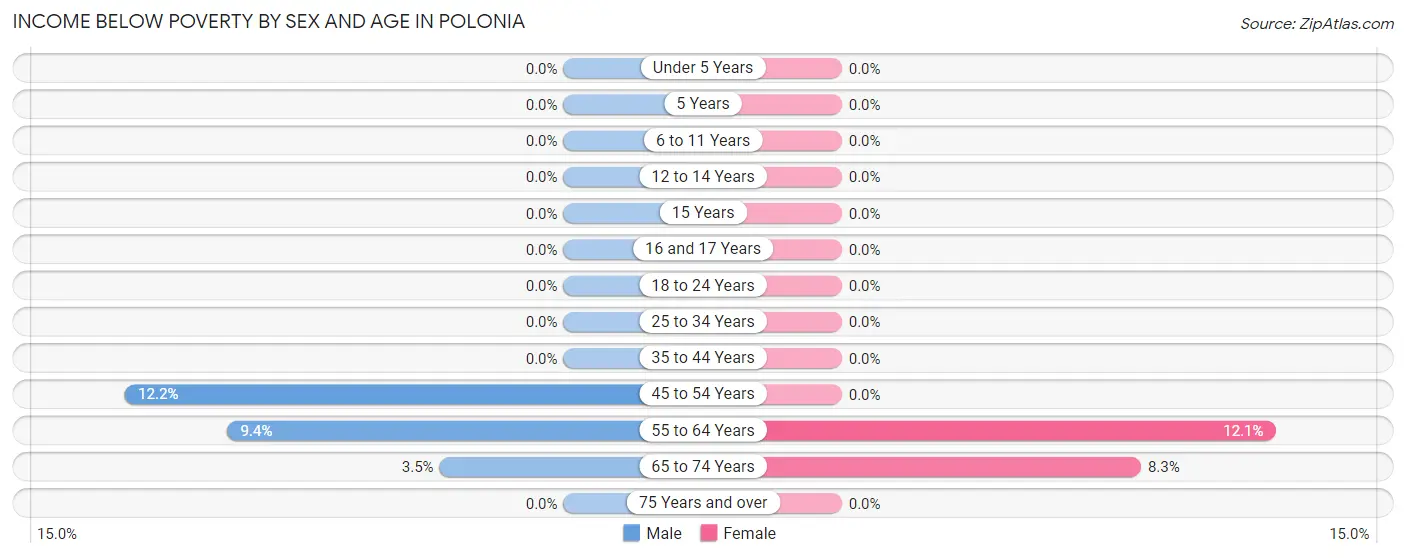
Income Below Poverty by Sex and Age in Polonia
With 4.5% poverty level for males and 4.8% for females among the residents of Polonia, 45 to 54 year old males and 55 to 64 year old females are the most vulnerable to poverty, with 5 males (12.2%) and 14 females (12.1%) in their respective age groups living below the poverty level.
| Age Bracket | Male | Female |
| Under 5 Years | 0 (0.0%) | 0 (0.0%) |
| 5 Years | 0 (0.0%) | 0 (0.0%) |
| 6 to 11 Years | 0 (0.0%) | 0 (0.0%) |
| 12 to 14 Years | 0 (0.0%) | 0 (0.0%) |
| 15 Years | 0 (0.0%) | 0 (0.0%) |
| 16 and 17 Years | 0 (0.0%) | 0 (0.0%) |
| 18 to 24 Years | 0 (0.0%) | 0 (0.0%) |
| 25 to 34 Years | 0 (0.0%) | 0 (0.0%) |
| 35 to 44 Years | 0 (0.0%) | 0 (0.0%) |
| 45 to 54 Years | 5 (12.2%) | 0 (0.0%) |
| 55 to 64 Years | 10 (9.3%) | 14 (12.1%) |
| 65 to 74 Years | 1 (3.5%) | 1 (8.3%) |
| 75 Years and over | 0 (0.0%) | 0 (0.0%) |
| Total | 16 (4.5%) | 15 (4.8%) |
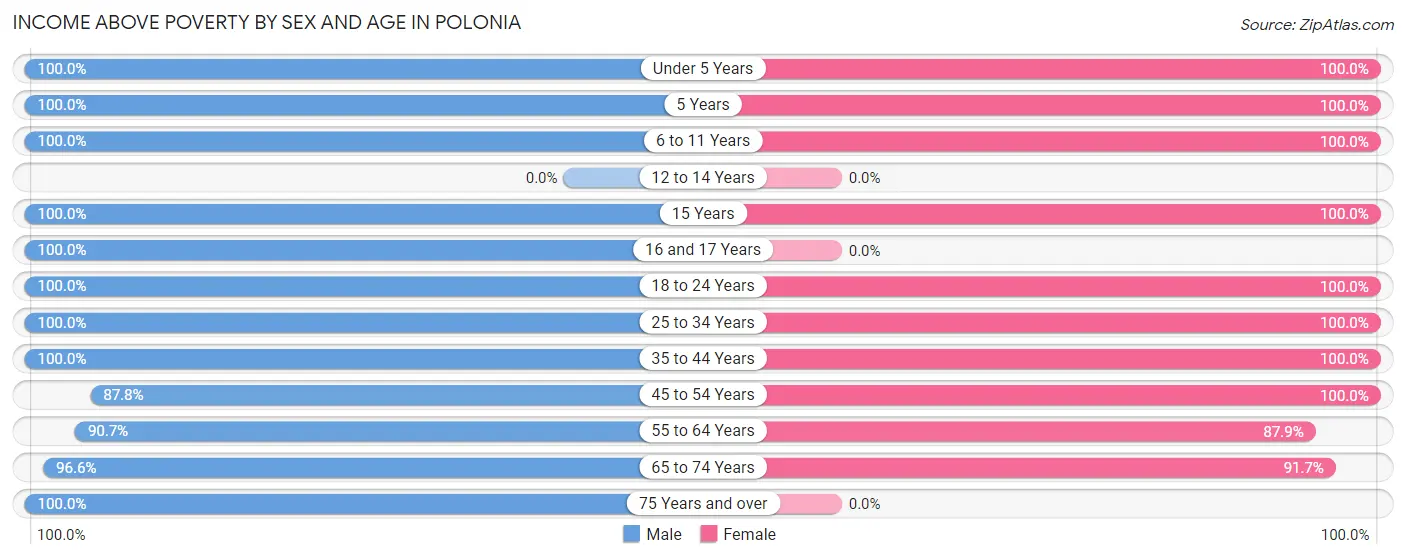
Income Above Poverty by Sex and Age in Polonia
According to the poverty statistics in Polonia, males aged under 5 years and females aged under 5 years are the age groups that are most secure financially, with 100.0% of males and 100.0% of females in these age groups living above the poverty line.
| Age Bracket | Male | Female |
| Under 5 Years | 30 (100.0%) | 10 (100.0%) |
| 5 Years | 25 (100.0%) | 5 (100.0%) |
| 6 to 11 Years | 28 (100.0%) | 11 (100.0%) |
| 12 to 14 Years | 0 (0.0%) | 0 (0.0%) |
| 15 Years | 5 (100.0%) | 5 (100.0%) |
| 16 and 17 Years | 5 (100.0%) | 0 (0.0%) |
| 18 to 24 Years | 25 (100.0%) | 58 (100.0%) |
| 25 to 34 Years | 16 (100.0%) | 48 (100.0%) |
| 35 to 44 Years | 37 (100.0%) | 10 (100.0%) |
| 45 to 54 Years | 36 (87.8%) | 38 (100.0%) |
| 55 to 64 Years | 97 (90.6%) | 102 (87.9%) |
| 65 to 74 Years | 28 (96.6%) | 11 (91.7%) |
| 75 Years and over | 4 (100.0%) | 0 (0.0%) |
| Total | 336 (95.5%) | 298 (95.2%) |
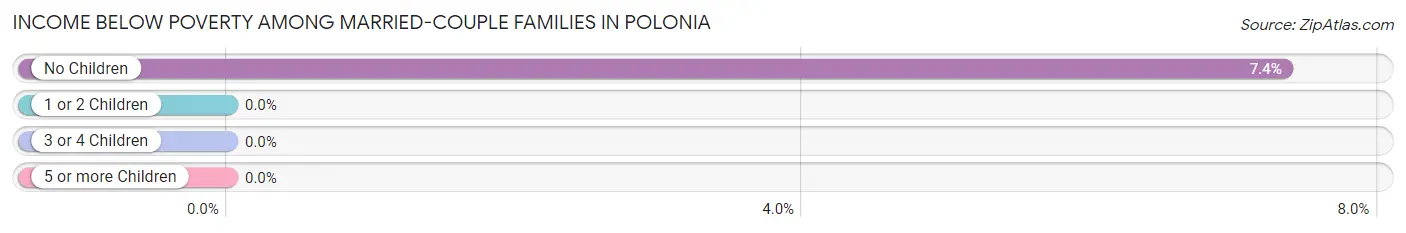
Income Below Poverty Among Married-Couple Families in Polonia
The poverty statistics for married-couple families in Polonia show that 5.6% or 10 of the total 180 families live below the poverty line. Families with no children have the highest poverty rate of 7.3%, comprising of 10 families. On the other hand, families with 1 or 2 children have the lowest poverty rate of 0.0%, which includes 0 families.
| Children | Above Poverty | Below Poverty |
| No Children | 126 (92.6%) | 10 (7.3%) |
| 1 or 2 Children | 32 (100.0%) | 0 (0.0%) |
| 3 or 4 Children | 6 (100.0%) | 0 (0.0%) |
| 5 or more Children | 6 (100.0%) | 0 (0.0%) |
| Total | 170 (94.4%) | 10 (5.6%) |
Income Below Poverty Among Single-Parent Households in Polonia
| Children | Single Father | Single Mother |
| No Children | 0 (0.0%) | 0 (0.0%) |
| 1 or 2 Children | 0 (0.0%) | 0 (0.0%) |
| 3 or 4 Children | 0 (0.0%) | 0 (0.0%) |
| 5 or more Children | 0 (0.0%) | 0 (0.0%) |
| Total | 0 (0.0%) | 0 (0.0%) |
Income Below Poverty Among Married-Couple vs Single-Parent Households in Polonia
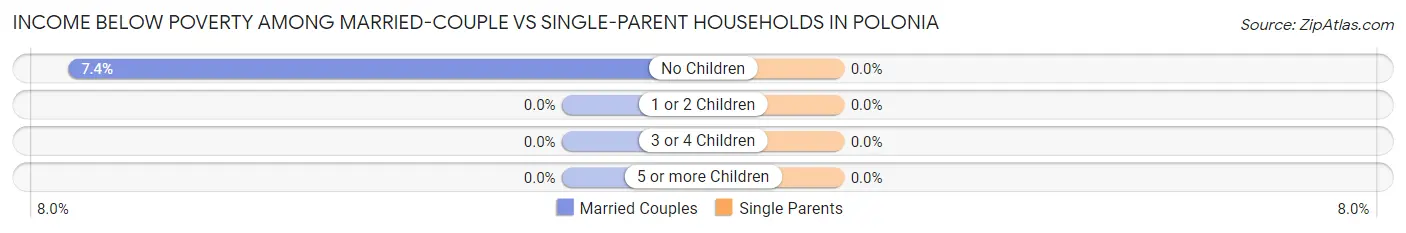
| Children | Married-Couple Families | Single-Parent Households |
| No Children | 10 (7.3%) | 0 (0.0%) |
| 1 or 2 Children | 0 (0.0%) | 0 (0.0%) |
| 3 or 4 Children | 0 (0.0%) | 0 (0.0%) |
| 5 or more Children | 0 (0.0%) | 0 (0.0%) |
| Total | 10 (5.6%) | 0 (0.0%) |
Race in Polonia
The most populous races in Polonia are , and White / Caucasian (665 | 100.0%).
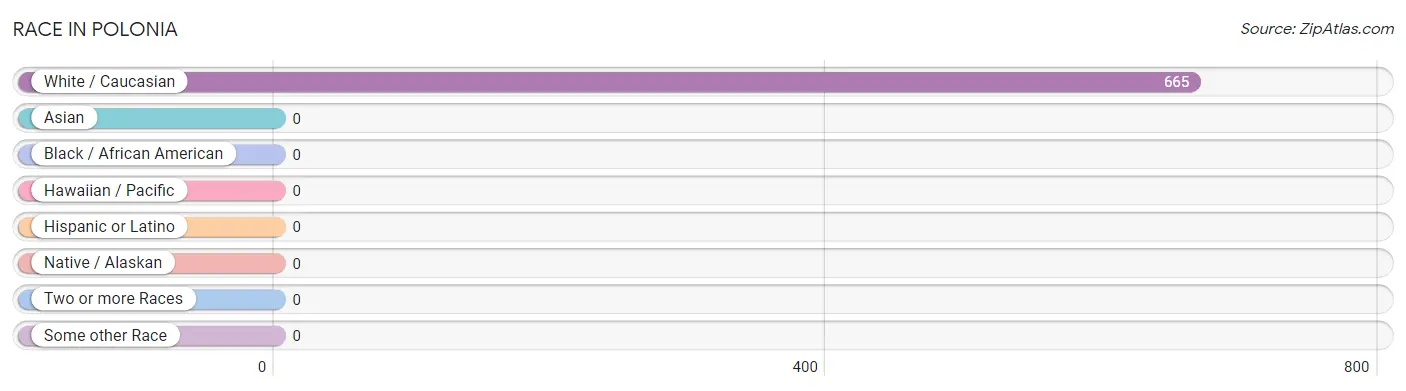
| Race | # Population | % Population |
| Asian | 0 | 0.0% |
| Black / African American | 0 | 0.0% |
| Hawaiian / Pacific | 0 | 0.0% |
| Hispanic or Latino | 0 | 0.0% |
| Native / Alaskan | 0 | 0.0% |
| White / Caucasian | 665 | 100.0% |
| Two or more Races | 0 | 0.0% |
| Some other Race | 0 | 0.0% |
| Total | 665 | 100.0% |
Ancestry in Polonia
The most populous ancestries reported in Polonia are Polish (289 | 43.5%), German (230 | 34.6%), Dutch (70 | 10.5%), French (30 | 4.5%), and Norwegian (25 | 3.8%), together accounting for 96.8% of all Polonia residents.
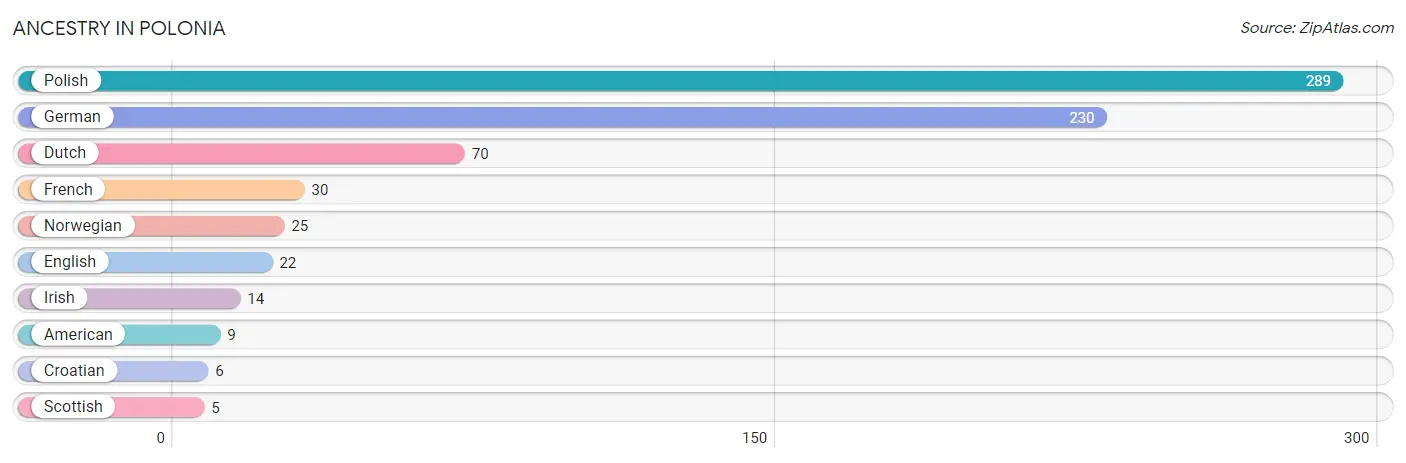
| Ancestry | # Population | % Population |
| American | 9 | 1.3% |
| Croatian | 6 | 0.9% |
| Dutch | 70 | 10.5% |
| English | 22 | 3.3% |
| French | 30 | 4.5% |
| German | 230 | 34.6% |
| Irish | 14 | 2.1% |
| Norwegian | 25 | 3.8% |
| Polish | 289 | 43.5% |
| Scottish | 5 | 0.7% | View All 10 Rows |
Immigrants in Polonia

| Immigration Origin | # Population | % Population | View All 0 Rows |
Sex and Age in Polonia
Sex and Age in Polonia
The most populous age groups in Polonia are 55 to 59 Years (82 | 23.3%) for men and 55 to 59 Years (91 | 29.1%) for women.
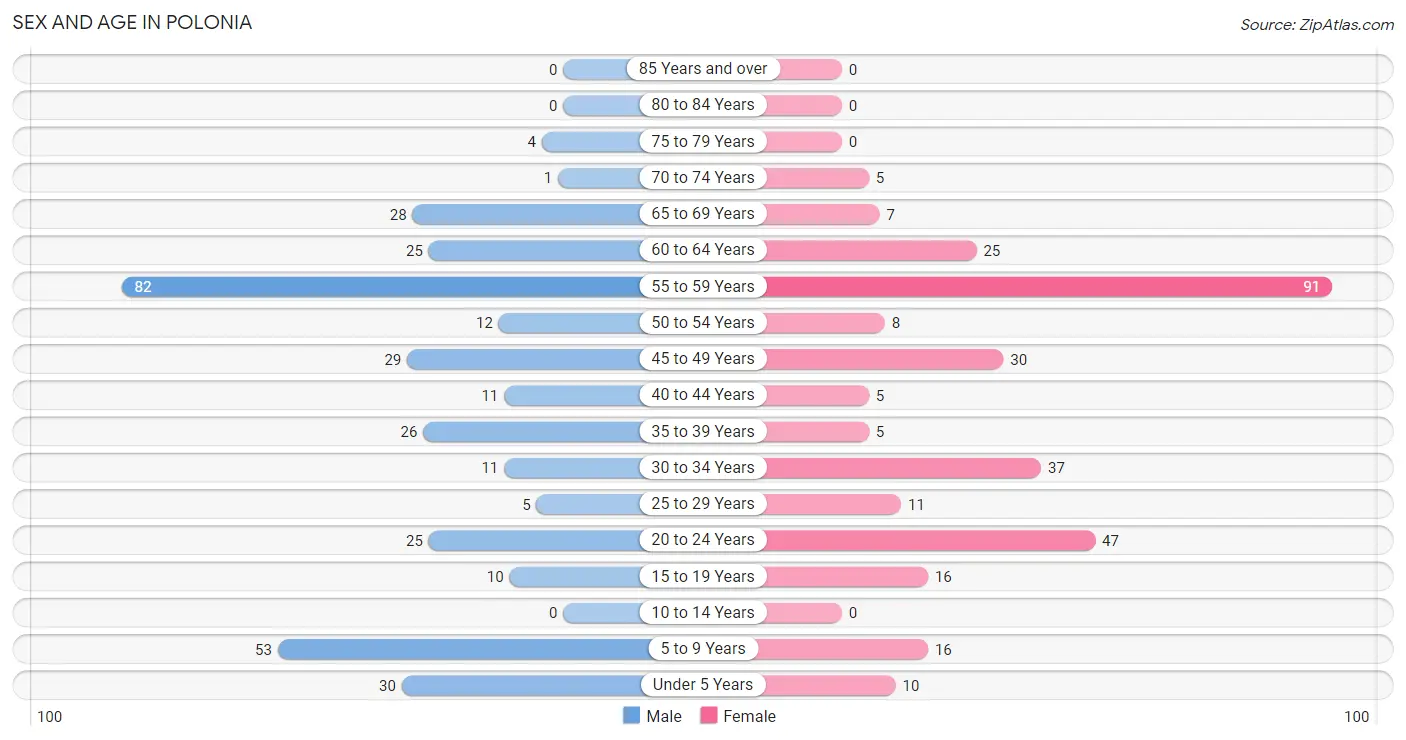
| Age Bracket | Male | Female |
| Under 5 Years | 30 (8.5%) | 10 (3.2%) |
| 5 to 9 Years | 53 (15.1%) | 16 (5.1%) |
| 10 to 14 Years | 0 (0.0%) | 0 (0.0%) |
| 15 to 19 Years | 10 (2.8%) | 16 (5.1%) |
| 20 to 24 Years | 25 (7.1%) | 47 (15.0%) |
| 25 to 29 Years | 5 (1.4%) | 11 (3.5%) |
| 30 to 34 Years | 11 (3.1%) | 37 (11.8%) |
| 35 to 39 Years | 26 (7.4%) | 5 (1.6%) |
| 40 to 44 Years | 11 (3.1%) | 5 (1.6%) |
| 45 to 49 Years | 29 (8.2%) | 30 (9.6%) |
| 50 to 54 Years | 12 (3.4%) | 8 (2.6%) |
| 55 to 59 Years | 82 (23.3%) | 91 (29.1%) |
| 60 to 64 Years | 25 (7.1%) | 25 (8.0%) |
| 65 to 69 Years | 28 (8.0%) | 7 (2.2%) |
| 70 to 74 Years | 1 (0.3%) | 5 (1.6%) |
| 75 to 79 Years | 4 (1.1%) | 0 (0.0%) |
| 80 to 84 Years | 0 (0.0%) | 0 (0.0%) |
| 85 Years and over | 0 (0.0%) | 0 (0.0%) |
| Total | 352 (100.0%) | 313 (100.0%) |
Families and Households in Polonia
Median Family Size in Polonia
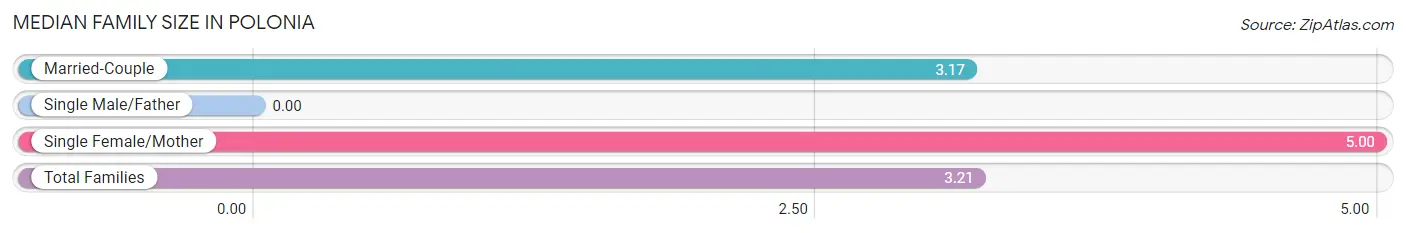
| Family Type | # Families | Family Size |
| Married-Couple | 180 (97.8%) | 3.17 |
| Single Male/Father | 0 (0.0%) | - |
| Single Female/Mother | 4 (2.2%) | 5.00 |
| Total Families | 184 (100.0%) | 3.21 |
Median Household Size in Polonia
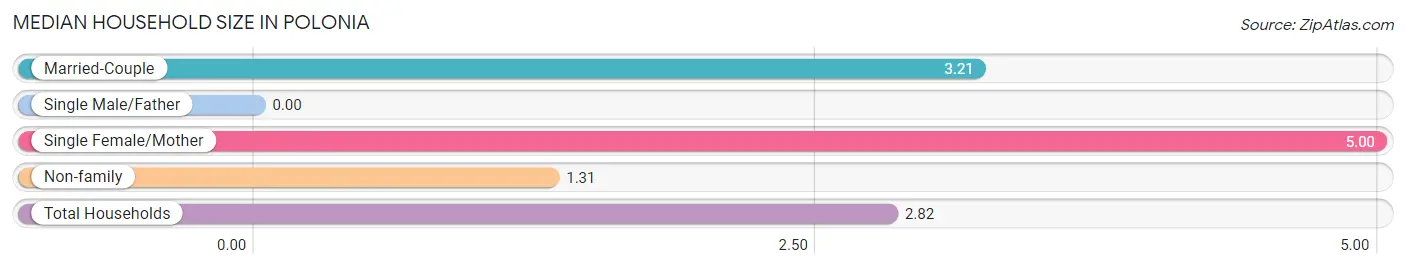
| Household Type | # Households | Household Size |
| Married-Couple | 180 (76.3%) | 3.21 |
| Single Male/Father | 0 (0.0%) | - |
| Single Female/Mother | 4 (1.7%) | 5.00 |
| Non-family | 52 (22.0%) | 1.31 |
| Total Households | 236 (100.0%) | 2.82 |
Household Size by Marriage Status in Polonia
Out of a total of 236 households in Polonia, 184 (78.0%) are family households, while 52 (22.0%) are nonfamily households. The most numerous type of family households are 2-person households, comprising 107, and the most common type of nonfamily households are 1-person households, comprising 37.
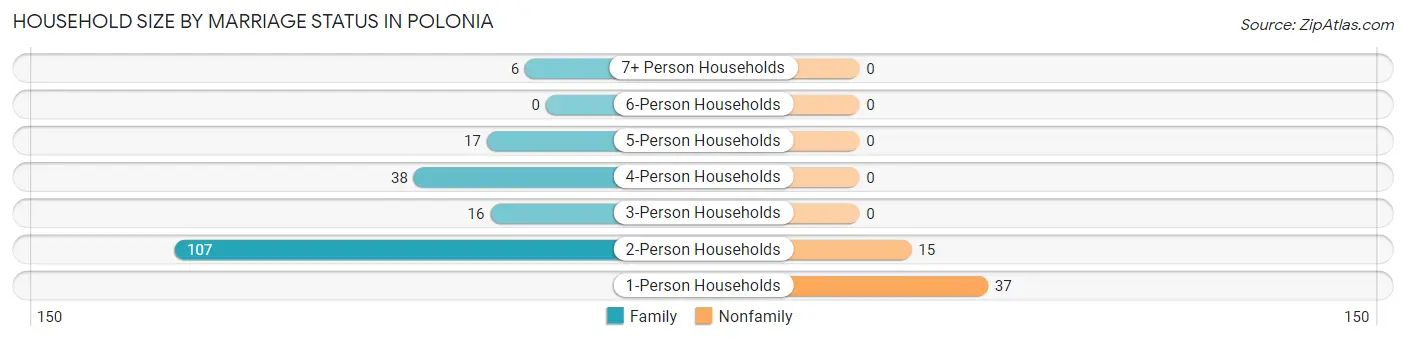
| Household Size | Family Households | Nonfamily Households |
| 1-Person Households | - | 37 (15.7%) |
| 2-Person Households | 107 (45.3%) | 15 (6.4%) |
| 3-Person Households | 16 (6.8%) | 0 (0.0%) |
| 4-Person Households | 38 (16.1%) | 0 (0.0%) |
| 5-Person Households | 17 (7.2%) | 0 (0.0%) |
| 6-Person Households | 0 (0.0%) | 0 (0.0%) |
| 7+ Person Households | 6 (2.5%) | 0 (0.0%) |
| Total | 184 (78.0%) | 52 (22.0%) |
Female Fertility in Polonia
Fertility by Age in Polonia
| Age Bracket | Women with Births | Births / 1,000 Women |
| 15 to 19 years | 0 (0.0%) | 0.0 |
| 20 to 34 years | 0 (0.0%) | 0.0 |
| 35 to 50 years | 0 (0.0%) | 0.0 |
| Total | 0 (0.0%) | 0.0 |
Fertility by Age by Marriage Status in Polonia
| Age Bracket | Married | Unmarried |
| 15 to 19 years | 0 (0.0%) | 0 (0.0%) |
| 20 to 34 years | 0 (0.0%) | 0 (0.0%) |
| 35 to 50 years | 0 (0.0%) | 0 (0.0%) |
| Total | 0 (0.0%) | 0 (0.0%) |
Fertility by Education in Polonia
| Educational Attainment | Women with Births | Births / 1,000 Women |
| Less than High School | 0 (0.0%) | 0.0 |
| High School Diploma | 0 (0.0%) | 0.0 |
| College or Associate's Degree | 0 (0.0%) | 0.0 |
| Bachelor's Degree | 0 (0.0%) | 0.0 |
| Graduate Degree | 0 (0.0%) | 0.0 |
| Total | 0 (0.0%) | 0.0 |
Fertility by Education by Marriage Status in Polonia
| Educational Attainment | Married | Unmarried |
| Less than High School | 0 (0.0%) | 0 (0.0%) |
| High School Diploma | 0 (0.0%) | 0 (0.0%) |
| College or Associate's Degree | 0 (0.0%) | 0 (0.0%) |
| Bachelor's Degree | 0 (0.0%) | 0 (0.0%) |
| Graduate Degree | 0 (0.0%) | 0 (0.0%) |
| Total | 0 (0.0%) | 0 (0.0%) |
Employment Characteristics in Polonia
Employment by Class of Employer in Polonia
Among the 432 employed individuals in Polonia, private company employees (356 | 82.4%), local government employees (41 | 9.5%), and not-for-profit organizations (19 | 4.4%) make up the most common classes of employment.
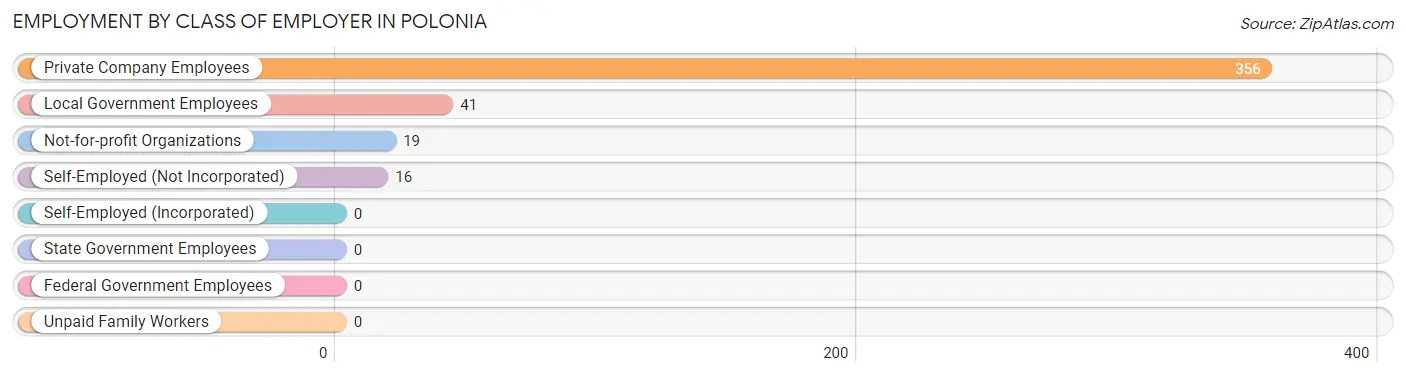
| Employer Class | # Employees | % Employees |
| Private Company Employees | 356 | 82.4% |
| Self-Employed (Incorporated) | 0 | 0.0% |
| Self-Employed (Not Incorporated) | 16 | 3.7% |
| Not-for-profit Organizations | 19 | 4.4% |
| Local Government Employees | 41 | 9.5% |
| State Government Employees | 0 | 0.0% |
| Federal Government Employees | 0 | 0.0% |
| Unpaid Family Workers | 0 | 0.0% |
| Total | 432 | 100.0% |
Employment Status by Age in Polonia
According to the labor force statistics for Polonia, out of the total population over 16 years of age (546), 82.1% or 448 individuals are in the labor force, with 2.5% or 11 of them unemployed. The age group with the highest labor force participation rate is 16 to 19 years, with 100.0% or 16 individuals in the labor force. Within the labor force, the 30 to 34 years age range has the highest percentage of unemployed individuals, with 12.9% or 4 of them being unemployed.
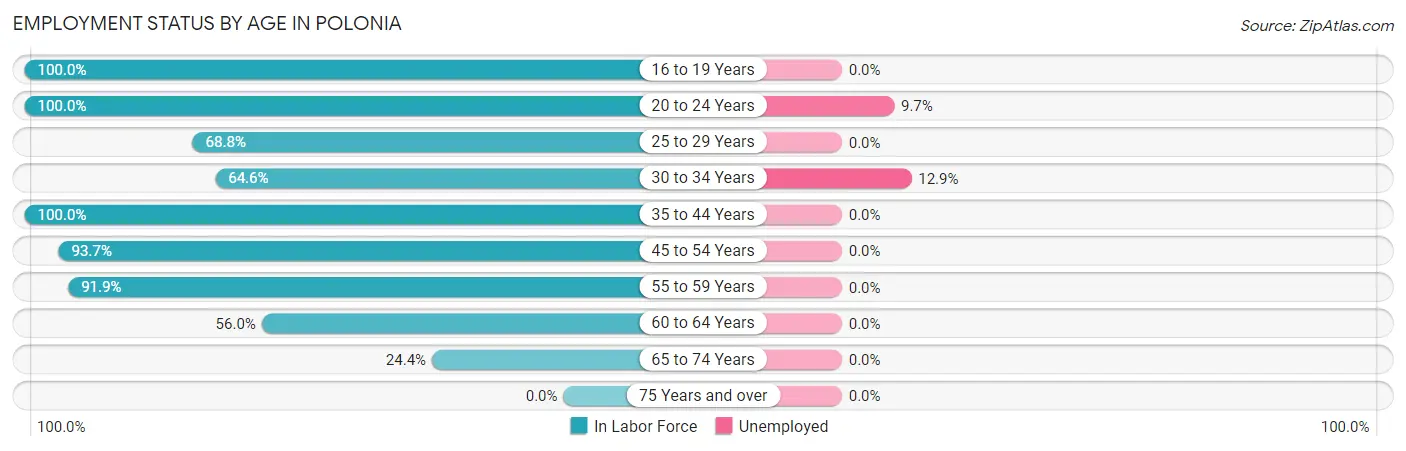
| Age Bracket | In Labor Force | Unemployed |
| 16 to 19 Years | 16 (100.0%) | 0 (0.0%) |
| 20 to 24 Years | 72 (100.0%) | 7 (9.7%) |
| 25 to 29 Years | 11 (68.8%) | 0 (0.0%) |
| 30 to 34 Years | 31 (64.6%) | 4 (12.9%) |
| 35 to 44 Years | 47 (100.0%) | 0 (0.0%) |
| 45 to 54 Years | 74 (93.7%) | 0 (0.0%) |
| 55 to 59 Years | 159 (91.9%) | 0 (0.0%) |
| 60 to 64 Years | 28 (56.0%) | 0 (0.0%) |
| 65 to 74 Years | 10 (24.4%) | 0 (0.0%) |
| 75 Years and over | 0 (0.0%) | 0 (0.0%) |
| Total | 448 (82.1%) | 11 (2.5%) |
Employment Status by Educational Attainment in Polonia
According to labor force statistics for Polonia, 84.7% of individuals (350) out of the total population between 25 and 64 years of age (413) are in the labor force, with 1.1% or 4 of them being unemployed. The group with the highest labor force participation rate are those with the educational attainment of college / associate degree, with 91.8% or 101 individuals in the labor force. Within the labor force, individuals with high school diploma education have the highest percentage of unemployment, with 3.8% or 4 of them being unemployed.
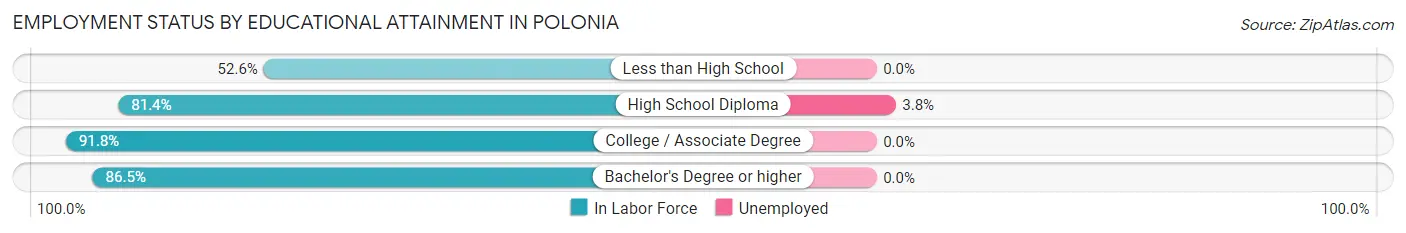
| Educational Attainment | In Labor Force | Unemployed |
| Less than High School | 10 (52.6%) | 0 (0.0%) |
| High School Diploma | 105 (81.4%) | 5 (3.8%) |
| College / Associate Degree | 101 (91.8%) | 0 (0.0%) |
| Bachelor's Degree or higher | 134 (86.5%) | 0 (0.0%) |
| Total | 350 (84.7%) | 5 (1.1%) |
Employment Occupations by Sex in Polonia
Management, Business, Science and Arts Occupations
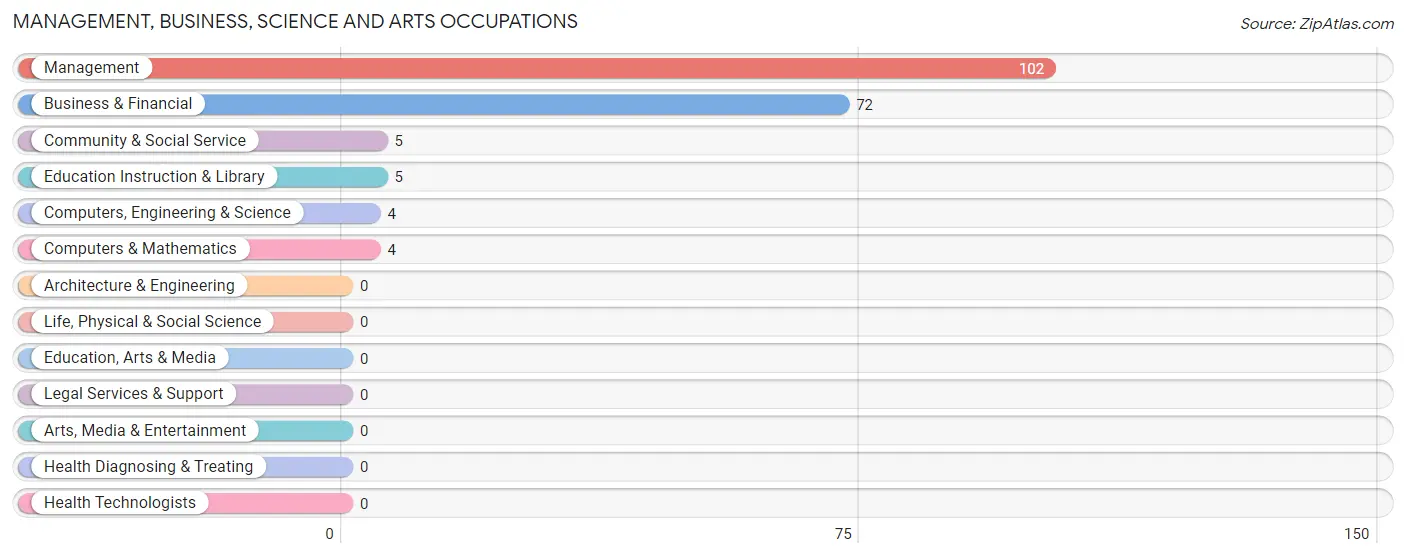
The most common Management, Business, Science and Arts occupations in Polonia are Management (102 | 23.3%), Business & Financial (72 | 16.5%), Community & Social Service (5 | 1.1%), Education Instruction & Library (5 | 1.1%), and Computers, Engineering & Science (4 | 0.9%).
Management, Business, Science and Arts Occupations by Sex
Within the Management, Business, Science and Arts occupations in Polonia, the most male-oriented occupations are Community & Social Service (100.0%), Education Instruction & Library (100.0%), and Management (68.6%), while the most female-oriented occupations are Business & Financial (100.0%), Computers, Engineering & Science (100.0%), and Computers & Mathematics (100.0%).
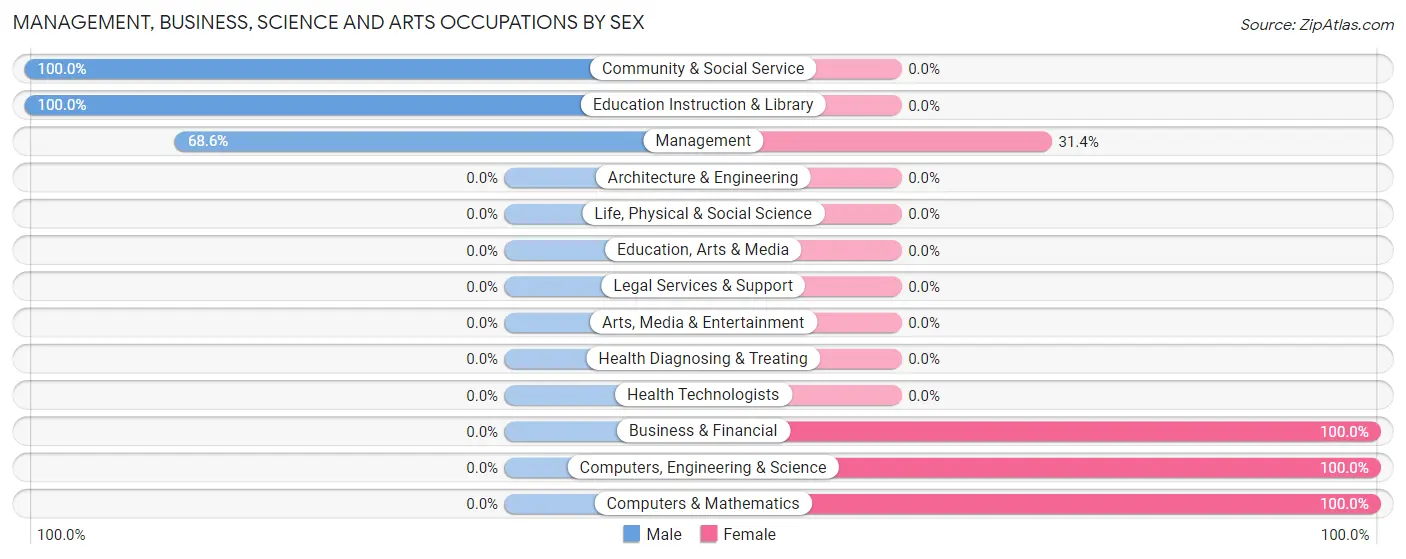
| Occupation | Male | Female |
| Management | 70 (68.6%) | 32 (31.4%) |
| Business & Financial | 0 (0.0%) | 72 (100.0%) |
| Computers, Engineering & Science | 0 (0.0%) | 4 (100.0%) |
| Computers & Mathematics | 0 (0.0%) | 4 (100.0%) |
| Architecture & Engineering | 0 (0.0%) | 0 (0.0%) |
| Life, Physical & Social Science | 0 (0.0%) | 0 (0.0%) |
| Community & Social Service | 5 (100.0%) | 0 (0.0%) |
| Education, Arts & Media | 0 (0.0%) | 0 (0.0%) |
| Legal Services & Support | 0 (0.0%) | 0 (0.0%) |
| Education Instruction & Library | 5 (100.0%) | 0 (0.0%) |
| Arts, Media & Entertainment | 0 (0.0%) | 0 (0.0%) |
| Health Diagnosing & Treating | 0 (0.0%) | 0 (0.0%) |
| Health Technologists | 0 (0.0%) | 0 (0.0%) |
| Total (Category) | 75 (41.0%) | 108 (59.0%) |
| Total (Overall) | 213 (48.7%) | 224 (51.3%) |
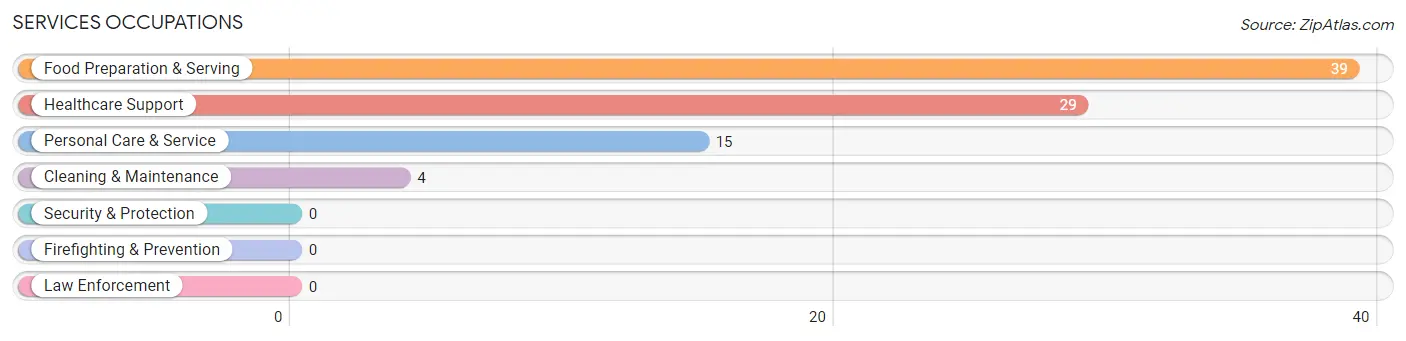
Services Occupations
The most common Services occupations in Polonia are Food Preparation & Serving (39 | 8.9%), Healthcare Support (29 | 6.6%), Personal Care & Service (15 | 3.4%), and Cleaning & Maintenance (4 | 0.9%).
Services Occupations by Sex
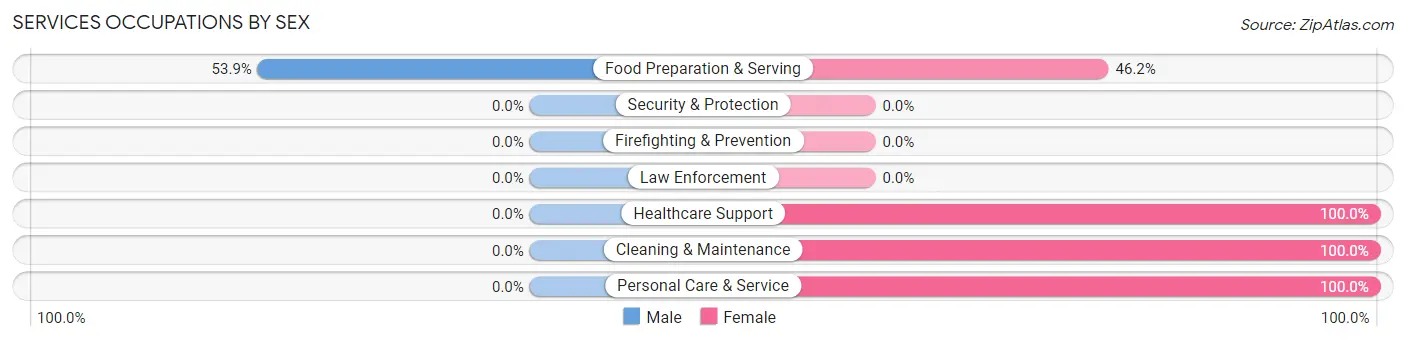
| Occupation | Male | Female |
| Healthcare Support | 0 (0.0%) | 29 (100.0%) |
| Security & Protection | 0 (0.0%) | 0 (0.0%) |
| Firefighting & Prevention | 0 (0.0%) | 0 (0.0%) |
| Law Enforcement | 0 (0.0%) | 0 (0.0%) |
| Food Preparation & Serving | 21 (53.8%) | 18 (46.2%) |
| Cleaning & Maintenance | 0 (0.0%) | 4 (100.0%) |
| Personal Care & Service | 0 (0.0%) | 15 (100.0%) |
| Total (Category) | 21 (24.1%) | 66 (75.9%) |
| Total (Overall) | 213 (48.7%) | 224 (51.3%) |
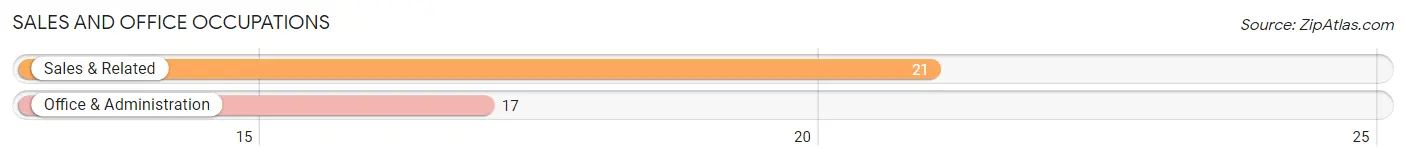
Sales and Office Occupations
The most common Sales and Office occupations in Polonia are Sales & Related (21 | 4.8%), and Office & Administration (17 | 3.9%).
Sales and Office Occupations by Sex

| Occupation | Male | Female |
| Sales & Related | 11 (52.4%) | 10 (47.6%) |
| Office & Administration | 0 (0.0%) | 17 (100.0%) |
| Total (Category) | 11 (28.9%) | 27 (71.1%) |
| Total (Overall) | 213 (48.7%) | 224 (51.3%) |
Natural Resources, Construction and Maintenance Occupations
The most common Natural Resources, Construction and Maintenance occupations in Polonia are Installation, Maintenance & Repair (29 | 6.6%), Farming, Fishing & Forestry (7 | 1.6%), and Construction & Extraction (7 | 1.6%).
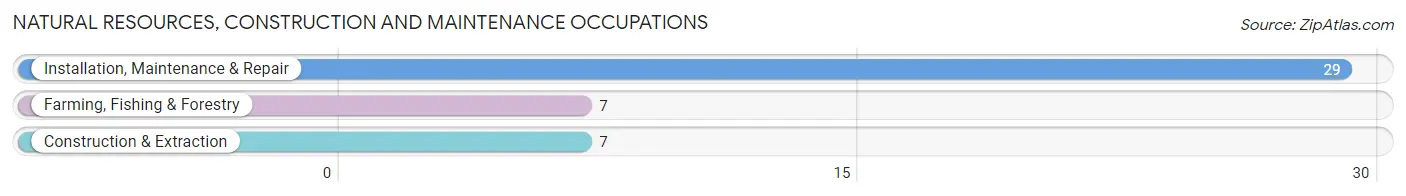
Natural Resources, Construction and Maintenance Occupations by Sex
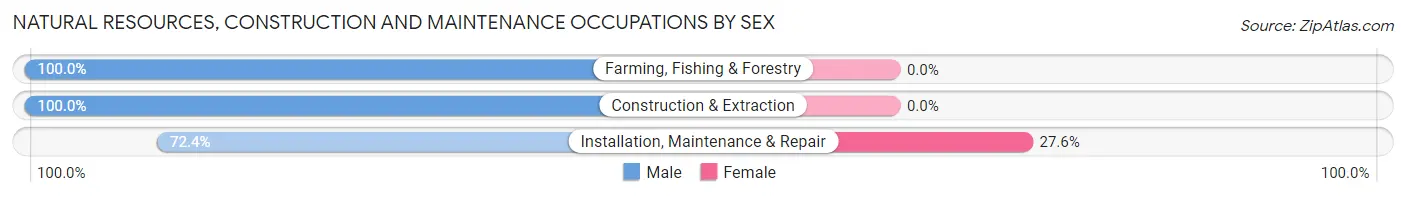
| Occupation | Male | Female |
| Farming, Fishing & Forestry | 7 (100.0%) | 0 (0.0%) |
| Construction & Extraction | 7 (100.0%) | 0 (0.0%) |
| Installation, Maintenance & Repair | 21 (72.4%) | 8 (27.6%) |
| Total (Category) | 35 (81.4%) | 8 (18.6%) |
| Total (Overall) | 213 (48.7%) | 224 (51.3%) |
Production, Transportation and Moving Occupations
The most common Production, Transportation and Moving occupations in Polonia are Transportation (33 | 7.5%), Production (29 | 6.6%), and Material Moving (24 | 5.5%).
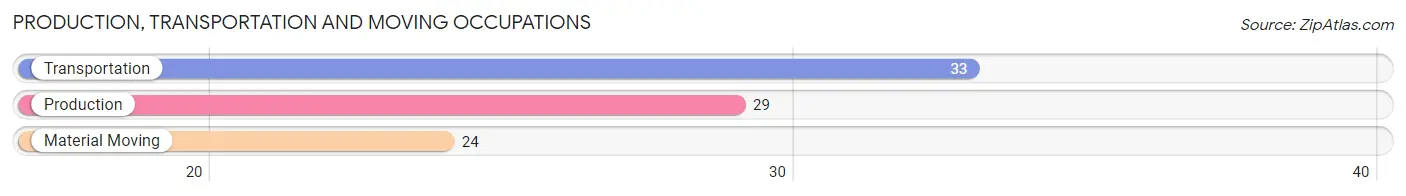
Production, Transportation and Moving Occupations by Sex
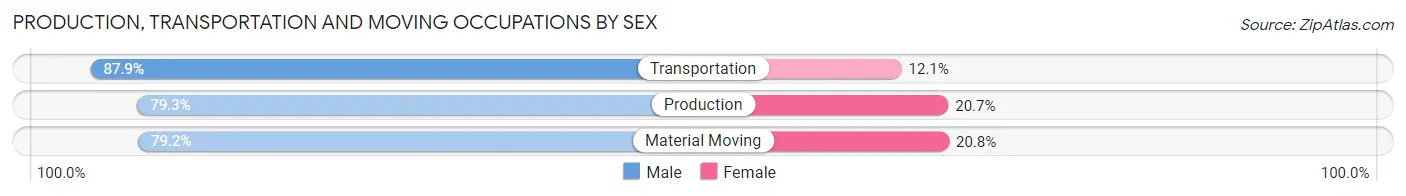
| Occupation | Male | Female |
| Production | 23 (79.3%) | 6 (20.7%) |
| Transportation | 29 (87.9%) | 4 (12.1%) |
| Material Moving | 19 (79.2%) | 5 (20.8%) |
| Total (Category) | 71 (82.6%) | 15 (17.4%) |
| Total (Overall) | 213 (48.7%) | 224 (51.3%) |
Employment Industries by Sex in Polonia
Employment Industries in Polonia
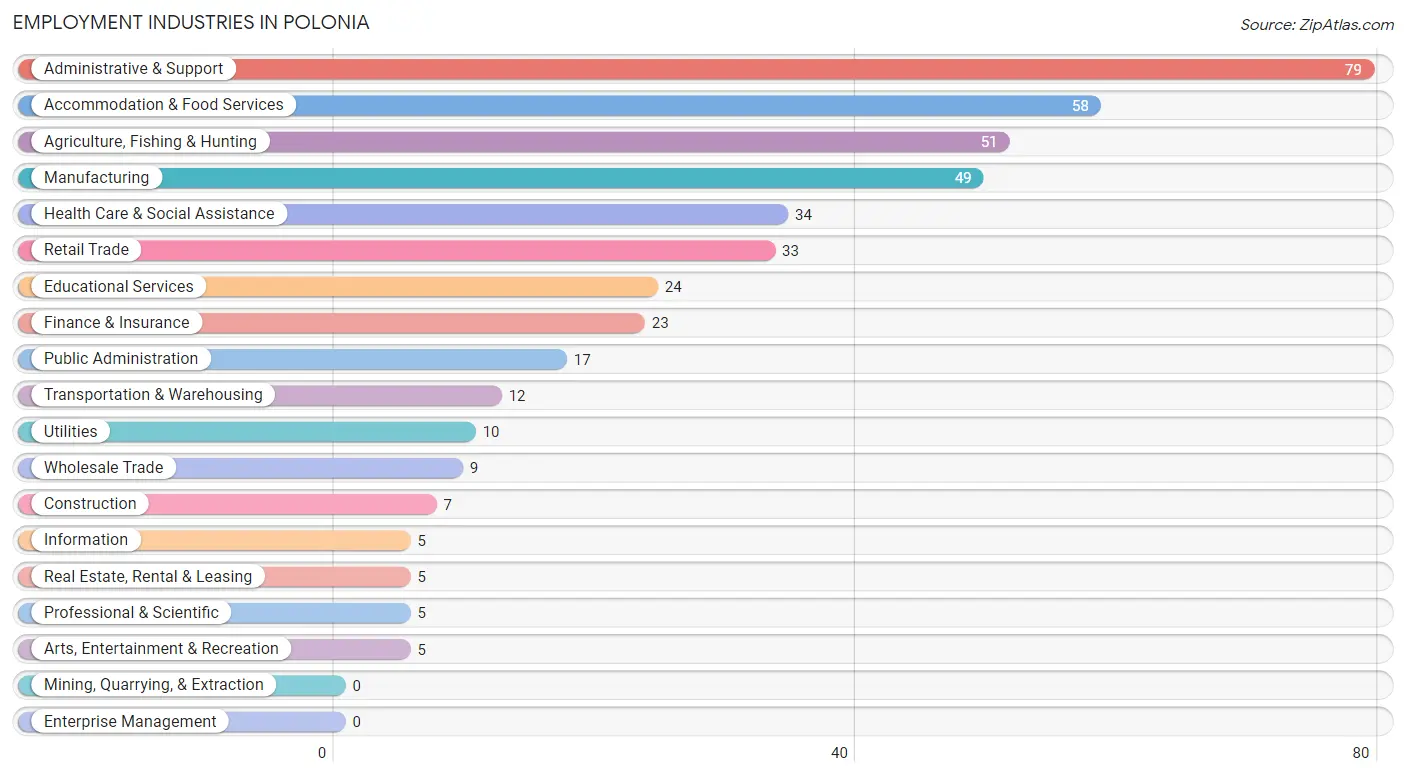
The major employment industries in Polonia include Administrative & Support (79 | 18.1%), Accommodation & Food Services (58 | 13.3%), Agriculture, Fishing & Hunting (51 | 11.7%), Manufacturing (49 | 11.2%), and Health Care & Social Assistance (34 | 7.8%).
Employment Industries by Sex in Polonia
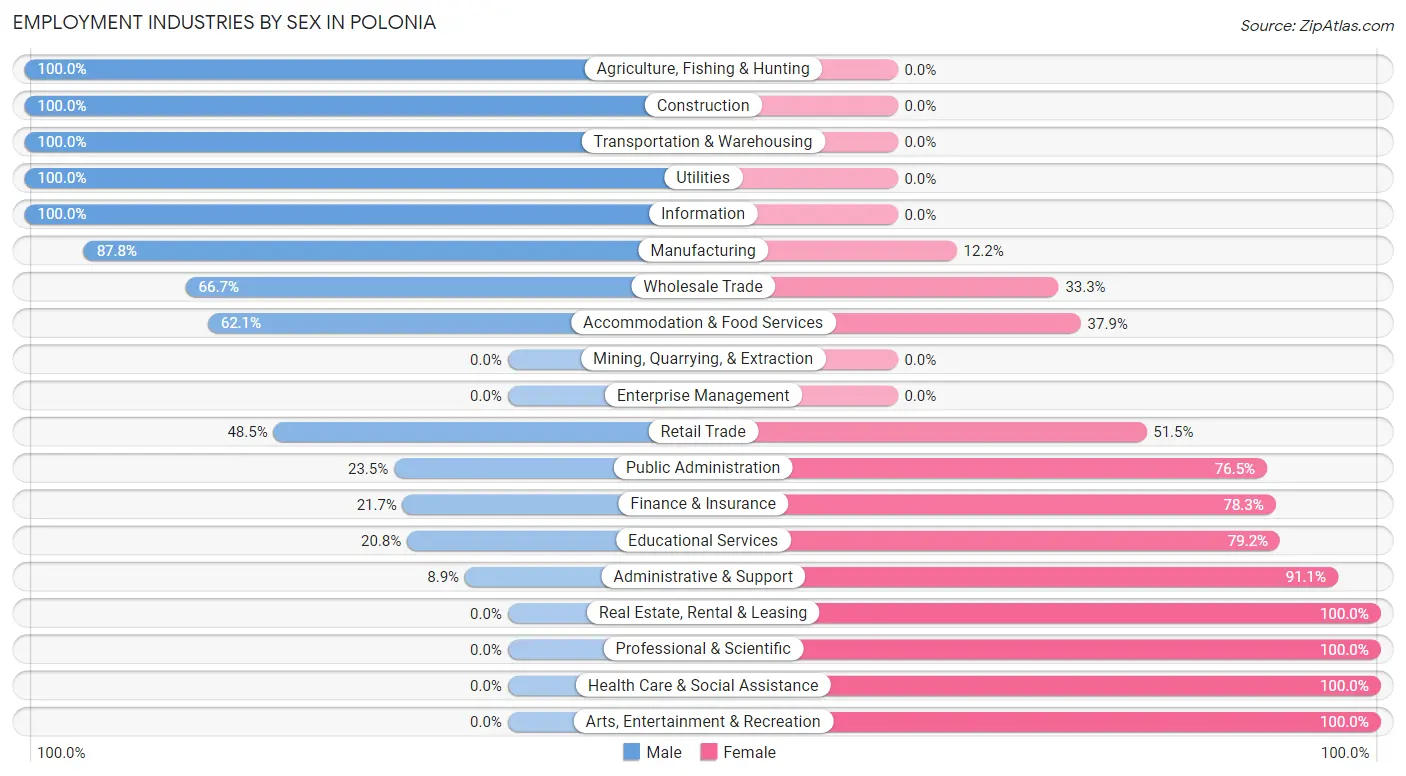
The Polonia industries that see more men than women are Agriculture, Fishing & Hunting (100.0%), Construction (100.0%), and Transportation & Warehousing (100.0%), whereas the industries that tend to have a higher number of women are Real Estate, Rental & Leasing (100.0%), Professional & Scientific (100.0%), and Health Care & Social Assistance (100.0%).
| Industry | Male | Female |
| Agriculture, Fishing & Hunting | 51 (100.0%) | 0 (0.0%) |
| Mining, Quarrying, & Extraction | 0 (0.0%) | 0 (0.0%) |
| Construction | 7 (100.0%) | 0 (0.0%) |
| Manufacturing | 43 (87.8%) | 6 (12.2%) |
| Wholesale Trade | 6 (66.7%) | 3 (33.3%) |
| Retail Trade | 16 (48.5%) | 17 (51.5%) |
| Transportation & Warehousing | 12 (100.0%) | 0 (0.0%) |
| Utilities | 10 (100.0%) | 0 (0.0%) |
| Information | 5 (100.0%) | 0 (0.0%) |
| Finance & Insurance | 5 (21.7%) | 18 (78.3%) |
| Real Estate, Rental & Leasing | 0 (0.0%) | 5 (100.0%) |
| Professional & Scientific | 0 (0.0%) | 5 (100.0%) |
| Enterprise Management | 0 (0.0%) | 0 (0.0%) |
| Administrative & Support | 7 (8.9%) | 72 (91.1%) |
| Educational Services | 5 (20.8%) | 19 (79.2%) |
| Health Care & Social Assistance | 0 (0.0%) | 34 (100.0%) |
| Arts, Entertainment & Recreation | 0 (0.0%) | 5 (100.0%) |
| Accommodation & Food Services | 36 (62.1%) | 22 (37.9%) |
| Public Administration | 4 (23.5%) | 13 (76.5%) |
| Total | 213 (48.7%) | 224 (51.3%) |
Education in Polonia
School Enrollment in Polonia
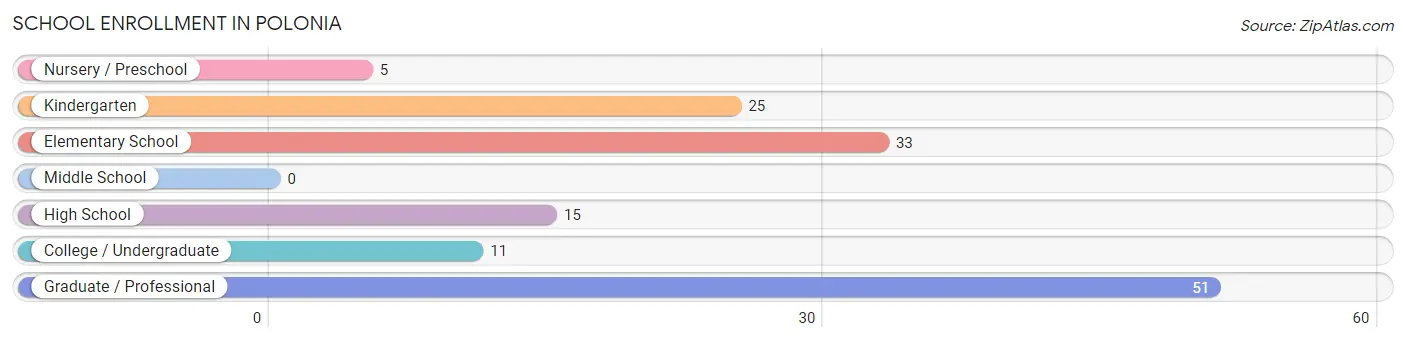
The most common levels of schooling among the 140 students in Polonia are graduate / professional (51 | 36.4%), elementary school (33 | 23.6%), and kindergarten (25 | 17.9%).
| School Level | # Students | % Students |
| Nursery / Preschool | 5 | 3.6% |
| Kindergarten | 25 | 17.9% |
| Elementary School | 33 | 23.6% |
| Middle School | 0 | 0.0% |
| High School | 15 | 10.7% |
| College / Undergraduate | 11 | 7.9% |
| Graduate / Professional | 51 | 36.4% |
| Total | 140 | 100.0% |
School Enrollment by Age by Funding Source in Polonia
| Age Bracket | Public School | Private School |
| 3 to 4 Year Olds | 0 (0.0%) | 0 (0.0%) |
| 5 to 9 Year Old | 63 (100.0%) | 0 (0.0%) |
| 10 to 14 Year Olds | 0 (0.0%) | 0 (0.0%) |
| 15 to 17 Year Olds | 15 (100.0%) | 0 (0.0%) |
| 18 to 19 Year Olds | 6 (100.0%) | 0 (0.0%) |
| 20 to 24 Year Olds | 0 (0.0%) | 0 (0.0%) |
| 25 to 34 Year Olds | 5 (100.0%) | 0 (0.0%) |
| 35 Years and over | 51 (100.0%) | 0 (0.0%) |
| Total | 140 (100.0%) | 0 (0.0%) |
Educational Attainment by Field of Study in Polonia
Education (70 | 39.1%), bio, nature & agricultural (57 | 31.8%), social sciences (21 | 11.7%), business (14 | 7.8%), and engineering (5 | 2.8%) are the most common fields of study among 179 individuals in Polonia who have obtained a bachelor's degree or higher.
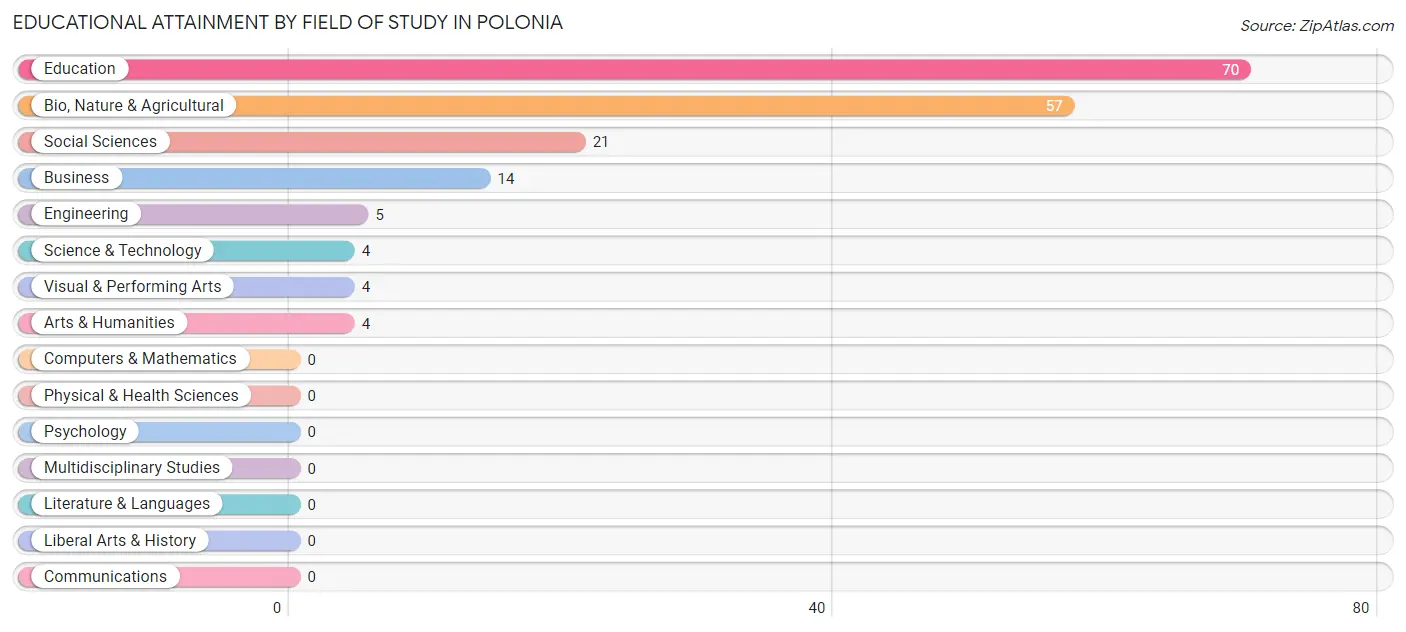
| Field of Study | # Graduates | % Graduates |
| Computers & Mathematics | 0 | 0.0% |
| Bio, Nature & Agricultural | 57 | 31.8% |
| Physical & Health Sciences | 0 | 0.0% |
| Psychology | 0 | 0.0% |
| Social Sciences | 21 | 11.7% |
| Engineering | 5 | 2.8% |
| Multidisciplinary Studies | 0 | 0.0% |
| Science & Technology | 4 | 2.2% |
| Business | 14 | 7.8% |
| Education | 70 | 39.1% |
| Literature & Languages | 0 | 0.0% |
| Liberal Arts & History | 0 | 0.0% |
| Visual & Performing Arts | 4 | 2.2% |
| Communications | 0 | 0.0% |
| Arts & Humanities | 4 | 2.2% |
| Total | 179 | 100.0% |
Transportation & Commute in Polonia
Vehicle Availability by Sex in Polonia
The most prevalent vehicle ownership categories in Polonia are males with 3 vehicles (72, accounting for 34.6%) and females with 3 vehicles (95, making up 32.1%).
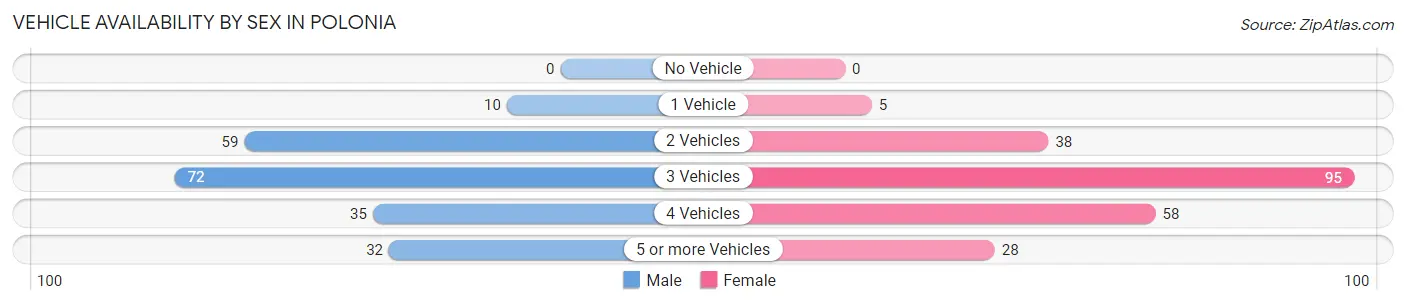
| Vehicles Available | Male | Female |
| No Vehicle | 0 (0.0%) | 0 (0.0%) |
| 1 Vehicle | 10 (4.8%) | 5 (2.2%) |
| 2 Vehicles | 59 (28.4%) | 38 (17.0%) |
| 3 Vehicles | 72 (34.6%) | 95 (42.4%) |
| 4 Vehicles | 35 (16.8%) | 58 (25.9%) |
| 5 or more Vehicles | 32 (15.4%) | 28 (12.5%) |
| Total | 208 (100.0%) | 224 (100.0%) |
Commute Time in Polonia
The most frequently occuring commute durations in Polonia are 20 to 24 minutes (99 commuters, 28.4%), 15 to 19 minutes (98 commuters, 28.2%), and 30 to 34 minutes (68 commuters, 19.5%).
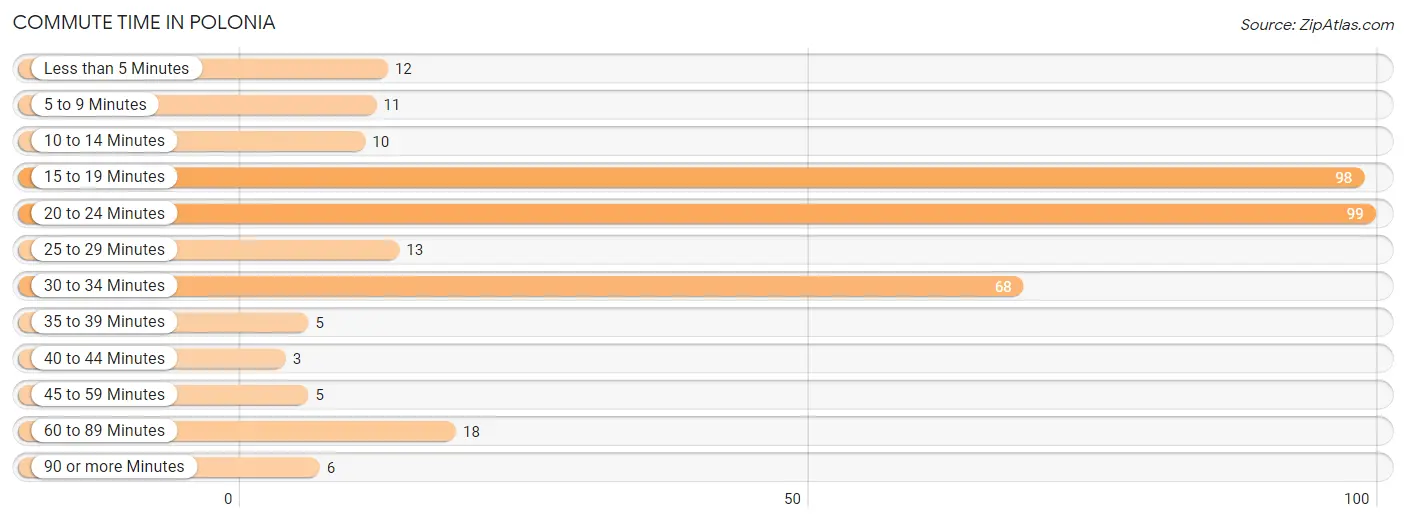
| Commute Time | # Commuters | % Commuters |
| Less than 5 Minutes | 12 | 3.5% |
| 5 to 9 Minutes | 11 | 3.2% |
| 10 to 14 Minutes | 10 | 2.9% |
| 15 to 19 Minutes | 98 | 28.2% |
| 20 to 24 Minutes | 99 | 28.4% |
| 25 to 29 Minutes | 13 | 3.7% |
| 30 to 34 Minutes | 68 | 19.5% |
| 35 to 39 Minutes | 5 | 1.4% |
| 40 to 44 Minutes | 3 | 0.9% |
| 45 to 59 Minutes | 5 | 1.4% |
| 60 to 89 Minutes | 18 | 5.2% |
| 90 or more Minutes | 6 | 1.7% |
Commute Time by Sex in Polonia
The most common commute times in Polonia are 30 to 34 minutes (68 commuters, 34.5%) for males and 15 to 19 minutes (93 commuters, 61.6%) for females.
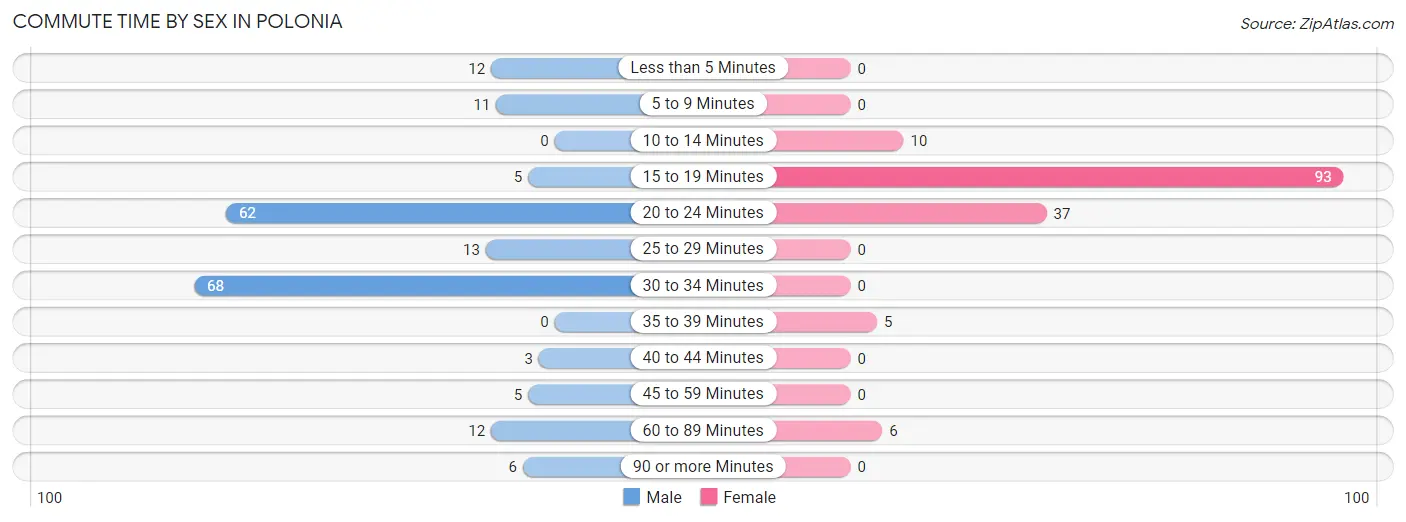
| Commute Time | Male | Female |
| Less than 5 Minutes | 12 (6.1%) | 0 (0.0%) |
| 5 to 9 Minutes | 11 (5.6%) | 0 (0.0%) |
| 10 to 14 Minutes | 0 (0.0%) | 10 (6.6%) |
| 15 to 19 Minutes | 5 (2.5%) | 93 (61.6%) |
| 20 to 24 Minutes | 62 (31.5%) | 37 (24.5%) |
| 25 to 29 Minutes | 13 (6.6%) | 0 (0.0%) |
| 30 to 34 Minutes | 68 (34.5%) | 0 (0.0%) |
| 35 to 39 Minutes | 0 (0.0%) | 5 (3.3%) |
| 40 to 44 Minutes | 3 (1.5%) | 0 (0.0%) |
| 45 to 59 Minutes | 5 (2.5%) | 0 (0.0%) |
| 60 to 89 Minutes | 12 (6.1%) | 6 (4.0%) |
| 90 or more Minutes | 6 (3.0%) | 0 (0.0%) |
Time of Departure to Work by Sex in Polonia
The most frequent times of departure to work in Polonia are 5:30 AM to 5:59 AM (56, 28.4%) for males and 8:00 AM to 8:29 AM (39, 25.8%) for females.
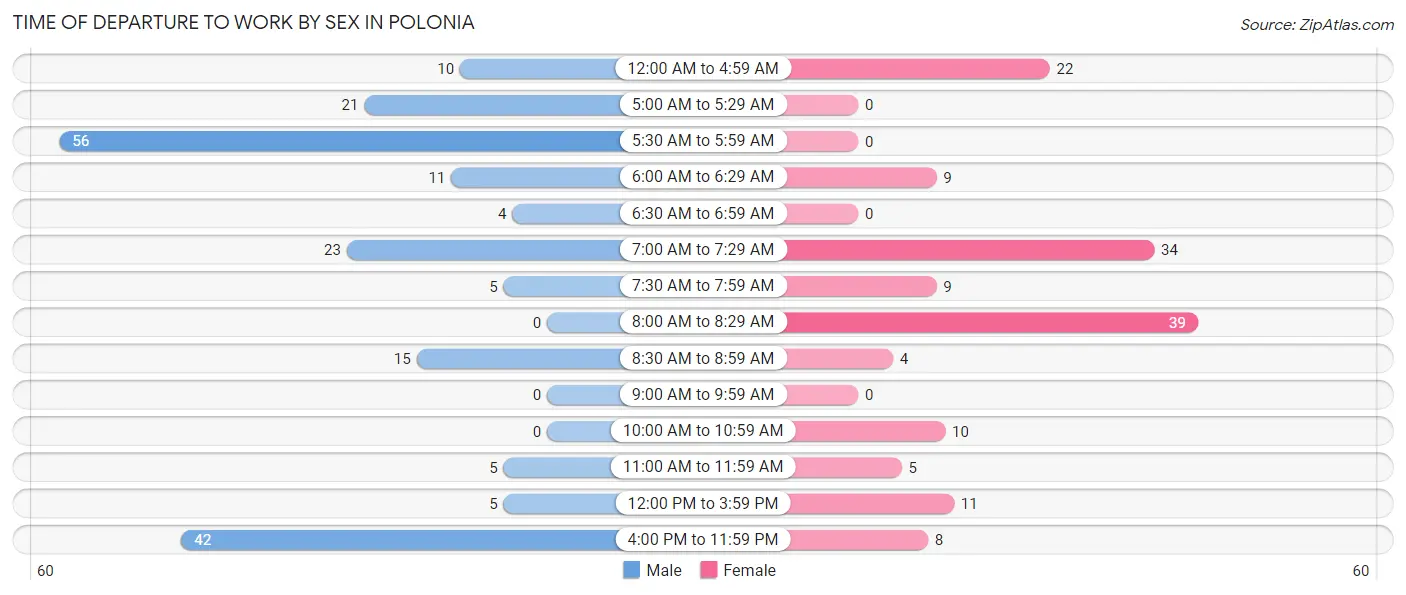
| Time of Departure | Male | Female |
| 12:00 AM to 4:59 AM | 10 (5.1%) | 22 (14.6%) |
| 5:00 AM to 5:29 AM | 21 (10.7%) | 0 (0.0%) |
| 5:30 AM to 5:59 AM | 56 (28.4%) | 0 (0.0%) |
| 6:00 AM to 6:29 AM | 11 (5.6%) | 9 (6.0%) |
| 6:30 AM to 6:59 AM | 4 (2.0%) | 0 (0.0%) |
| 7:00 AM to 7:29 AM | 23 (11.7%) | 34 (22.5%) |
| 7:30 AM to 7:59 AM | 5 (2.5%) | 9 (6.0%) |
| 8:00 AM to 8:29 AM | 0 (0.0%) | 39 (25.8%) |
| 8:30 AM to 8:59 AM | 15 (7.6%) | 4 (2.6%) |
| 9:00 AM to 9:59 AM | 0 (0.0%) | 0 (0.0%) |
| 10:00 AM to 10:59 AM | 0 (0.0%) | 10 (6.6%) |
| 11:00 AM to 11:59 AM | 5 (2.5%) | 5 (3.3%) |
| 12:00 PM to 3:59 PM | 5 (2.5%) | 11 (7.3%) |
| 4:00 PM to 11:59 PM | 42 (21.3%) | 8 (5.3%) |
| Total | 197 (100.0%) | 151 (100.0%) |
Housing Occupancy in Polonia
Occupancy by Ownership in Polonia
Of the total 236 dwellings in Polonia, owner-occupied units account for 211 (89.4%), while renter-occupied units make up 25 (10.6%).
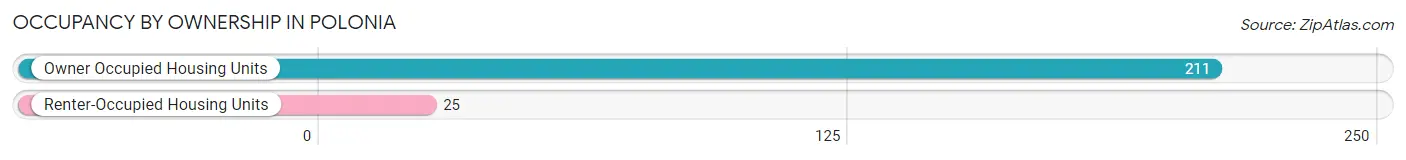
| Occupancy | # Housing Units | % Housing Units |
| Owner Occupied Housing Units | 211 | 89.4% |
| Renter-Occupied Housing Units | 25 | 10.6% |
| Total Occupied Housing Units | 236 | 100.0% |
Occupancy by Household Size in Polonia
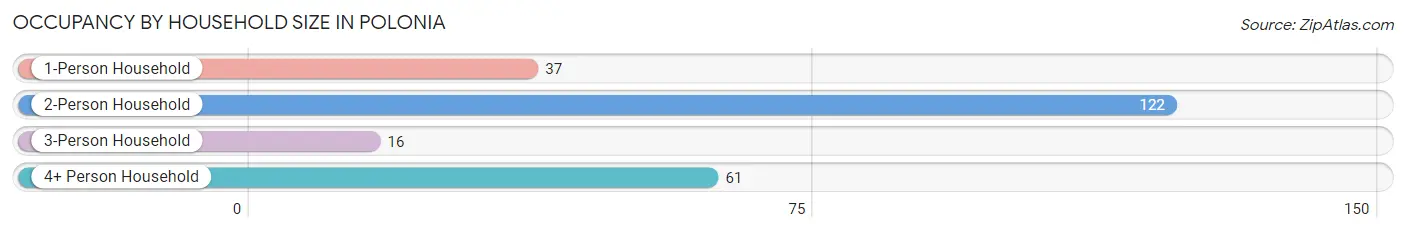
| Household Size | # Housing Units | % Housing Units |
| 1-Person Household | 37 | 15.7% |
| 2-Person Household | 122 | 51.7% |
| 3-Person Household | 16 | 6.8% |
| 4+ Person Household | 61 | 25.9% |
| Total Housing Units | 236 | 100.0% |
Occupancy by Ownership by Household Size in Polonia
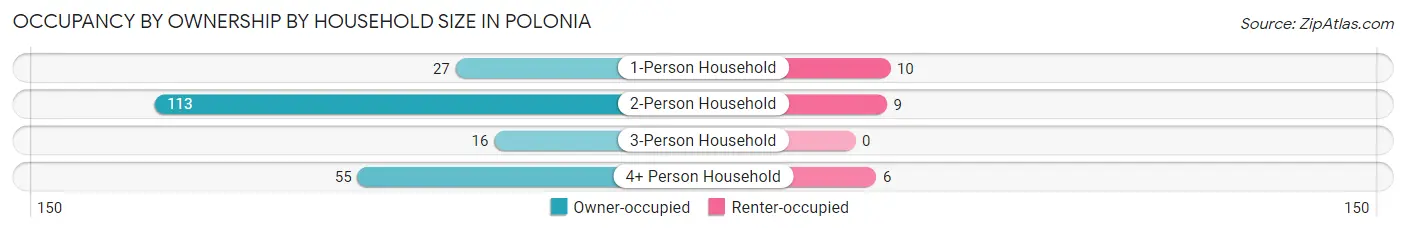
| Household Size | Owner-occupied | Renter-occupied |
| 1-Person Household | 27 (73.0%) | 10 (27.0%) |
| 2-Person Household | 113 (92.6%) | 9 (7.4%) |
| 3-Person Household | 16 (100.0%) | 0 (0.0%) |
| 4+ Person Household | 55 (90.2%) | 6 (9.8%) |
| Total Housing Units | 211 (89.4%) | 25 (10.6%) |
Occupancy by Educational Attainment in Polonia
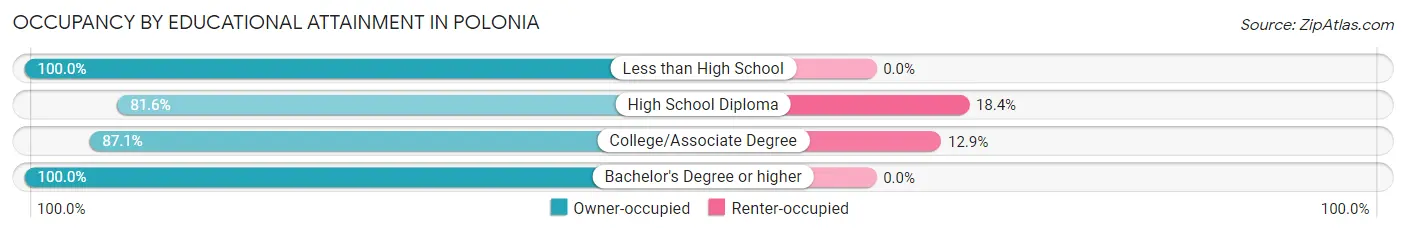
| Household Size | Owner-occupied | Renter-occupied |
| Less than High School | 8 (100.0%) | 0 (0.0%) |
| High School Diploma | 71 (81.6%) | 16 (18.4%) |
| College/Associate Degree | 61 (87.1%) | 9 (12.9%) |
| Bachelor's Degree or higher | 71 (100.0%) | 0 (0.0%) |
Occupancy by Age of Householder in Polonia
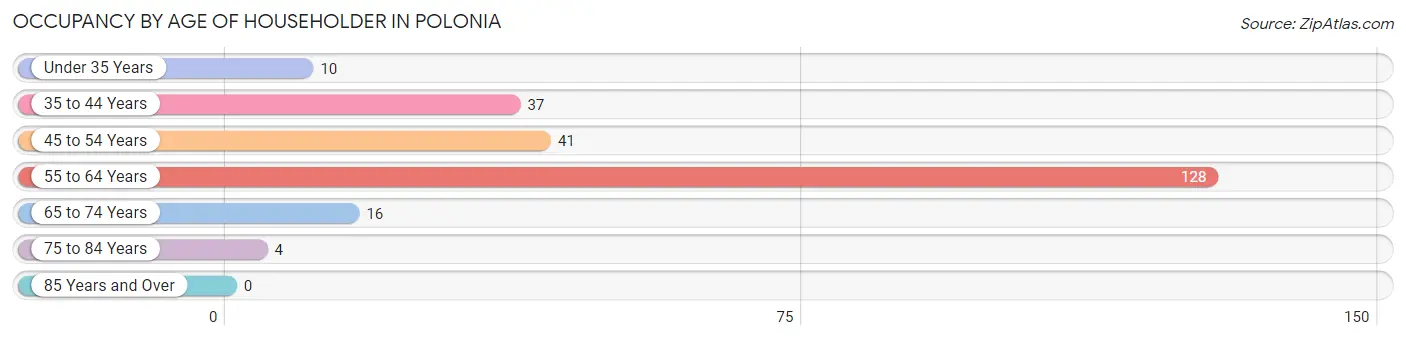
| Age Bracket | # Households | % Households |
| Under 35 Years | 10 | 4.2% |
| 35 to 44 Years | 37 | 15.7% |
| 45 to 54 Years | 41 | 17.4% |
| 55 to 64 Years | 128 | 54.2% |
| 65 to 74 Years | 16 | 6.8% |
| 75 to 84 Years | 4 | 1.7% |
| 85 Years and Over | 0 | 0.0% |
| Total | 236 | 100.0% |
Housing Finances in Polonia
Median Income by Occupancy in Polonia
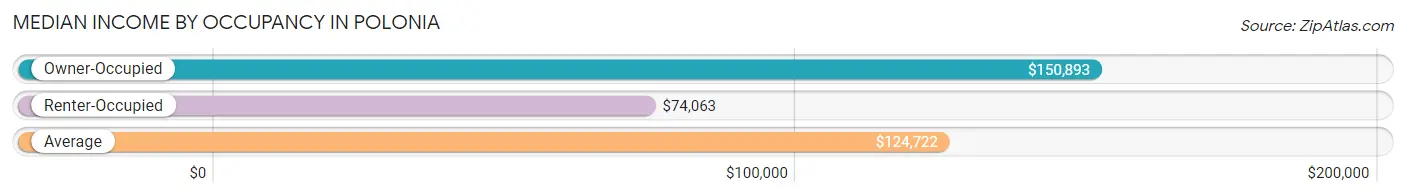
| Occupancy Type | # Households | Median Income |
| Owner-Occupied | 211 (89.4%) | $150,893 |
| Renter-Occupied | 25 (10.6%) | $74,063 |
| Average | 236 (100.0%) | $124,722 |
Occupancy by Householder Income Bracket in Polonia
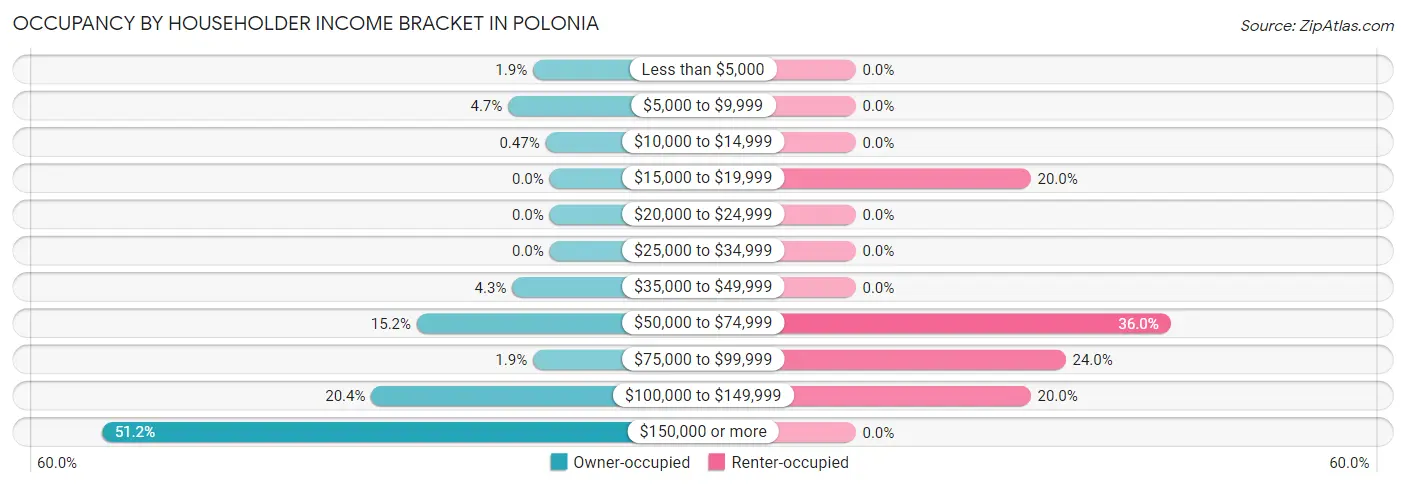
| Income Bracket | Owner-occupied | Renter-occupied |
| Less than $5,000 | 4 (1.9%) | 0 (0.0%) |
| $5,000 to $9,999 | 10 (4.7%) | 0 (0.0%) |
| $10,000 to $14,999 | 1 (0.5%) | 0 (0.0%) |
| $15,000 to $19,999 | 0 (0.0%) | 5 (20.0%) |
| $20,000 to $24,999 | 0 (0.0%) | 0 (0.0%) |
| $25,000 to $34,999 | 0 (0.0%) | 0 (0.0%) |
| $35,000 to $49,999 | 9 (4.3%) | 0 (0.0%) |
| $50,000 to $74,999 | 32 (15.2%) | 9 (36.0%) |
| $75,000 to $99,999 | 4 (1.9%) | 6 (24.0%) |
| $100,000 to $149,999 | 43 (20.4%) | 5 (20.0%) |
| $150,000 or more | 108 (51.2%) | 0 (0.0%) |
| Total | 211 (100.0%) | 25 (100.0%) |
Monthly Housing Cost Tiers in Polonia
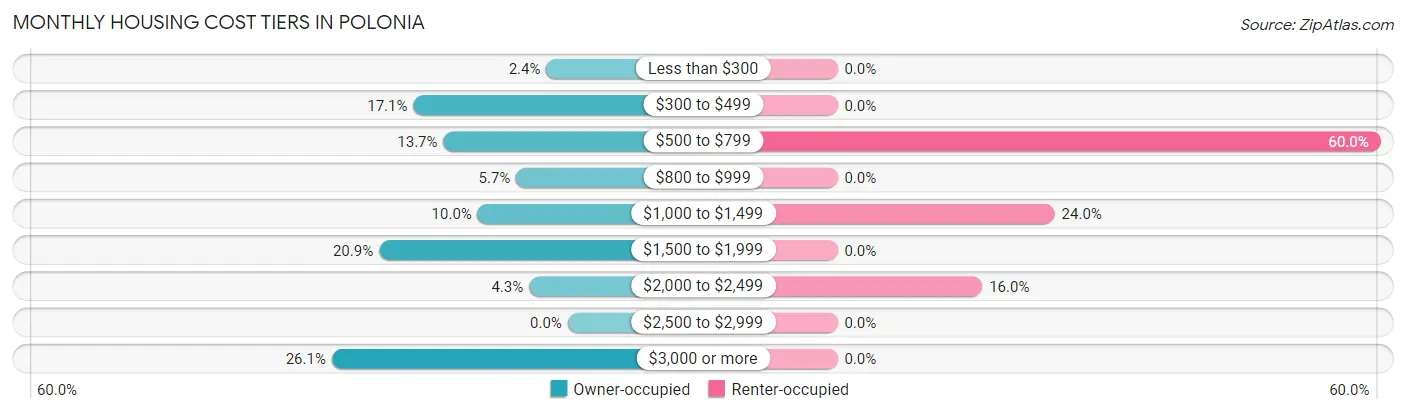
| Monthly Cost | Owner-occupied | Renter-occupied |
| Less than $300 | 5 (2.4%) | 0 (0.0%) |
| $300 to $499 | 36 (17.1%) | 0 (0.0%) |
| $500 to $799 | 29 (13.7%) | 15 (60.0%) |
| $800 to $999 | 12 (5.7%) | 0 (0.0%) |
| $1,000 to $1,499 | 21 (10.0%) | 6 (24.0%) |
| $1,500 to $1,999 | 44 (20.8%) | 0 (0.0%) |
| $2,000 to $2,499 | 9 (4.3%) | 4 (16.0%) |
| $2,500 to $2,999 | 0 (0.0%) | 0 (0.0%) |
| $3,000 or more | 55 (26.1%) | 0 (0.0%) |
| Total | 211 (100.0%) | 25 (100.0%) |
Physical Housing Characteristics in Polonia
Housing Structures in Polonia
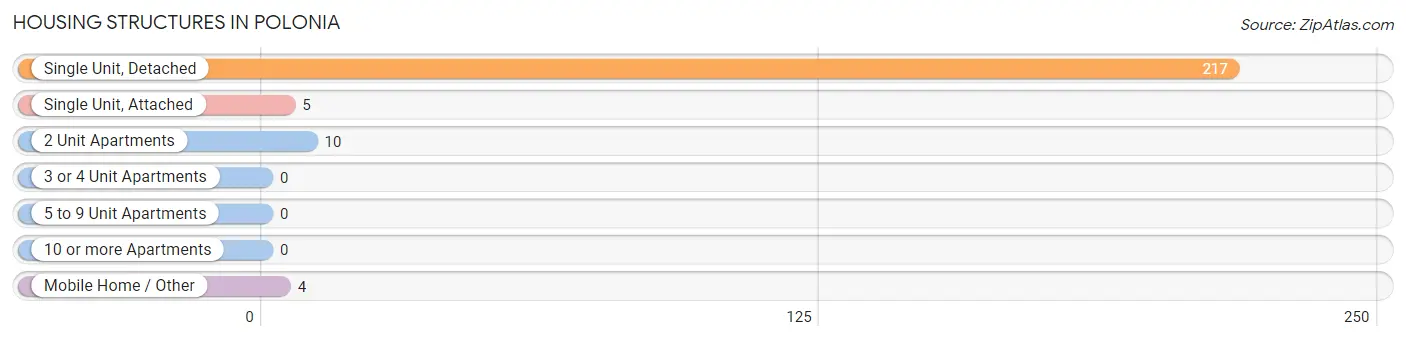
| Structure Type | # Housing Units | % Housing Units |
| Single Unit, Detached | 217 | 91.9% |
| Single Unit, Attached | 5 | 2.1% |
| 2 Unit Apartments | 10 | 4.2% |
| 3 or 4 Unit Apartments | 0 | 0.0% |
| 5 to 9 Unit Apartments | 0 | 0.0% |
| 10 or more Apartments | 0 | 0.0% |
| Mobile Home / Other | 4 | 1.7% |
| Total | 236 | 100.0% |
Housing Structures by Occupancy in Polonia
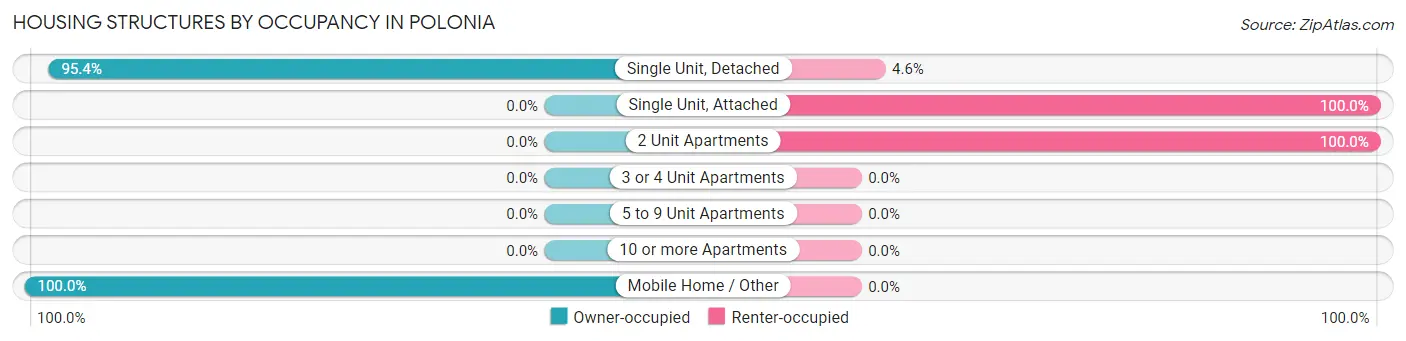
| Structure Type | Owner-occupied | Renter-occupied |
| Single Unit, Detached | 207 (95.4%) | 10 (4.6%) |
| Single Unit, Attached | 0 (0.0%) | 5 (100.0%) |
| 2 Unit Apartments | 0 (0.0%) | 10 (100.0%) |
| 3 or 4 Unit Apartments | 0 (0.0%) | 0 (0.0%) |
| 5 to 9 Unit Apartments | 0 (0.0%) | 0 (0.0%) |
| 10 or more Apartments | 0 (0.0%) | 0 (0.0%) |
| Mobile Home / Other | 4 (100.0%) | 0 (0.0%) |
| Total | 211 (89.4%) | 25 (10.6%) |
Housing Structures by Number of Rooms in Polonia
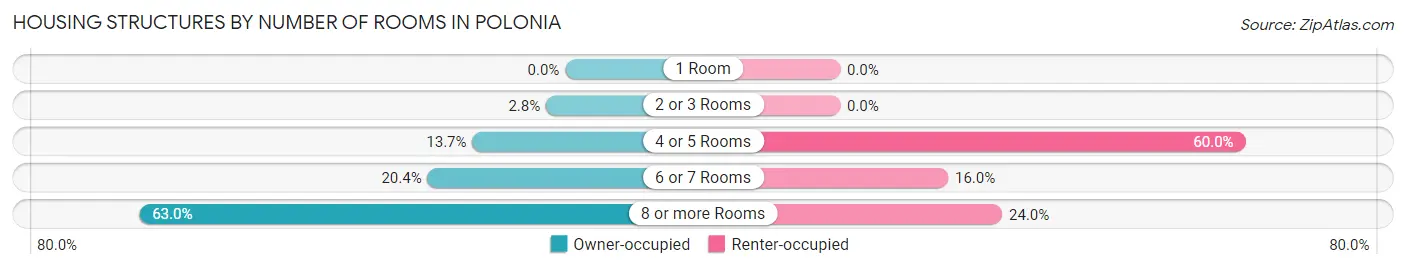
| Number of Rooms | Owner-occupied | Renter-occupied |
| 1 Room | 0 (0.0%) | 0 (0.0%) |
| 2 or 3 Rooms | 6 (2.8%) | 0 (0.0%) |
| 4 or 5 Rooms | 29 (13.7%) | 15 (60.0%) |
| 6 or 7 Rooms | 43 (20.4%) | 4 (16.0%) |
| 8 or more Rooms | 133 (63.0%) | 6 (24.0%) |
| Total | 211 (100.0%) | 25 (100.0%) |
Housing Structure by Heating Type in Polonia
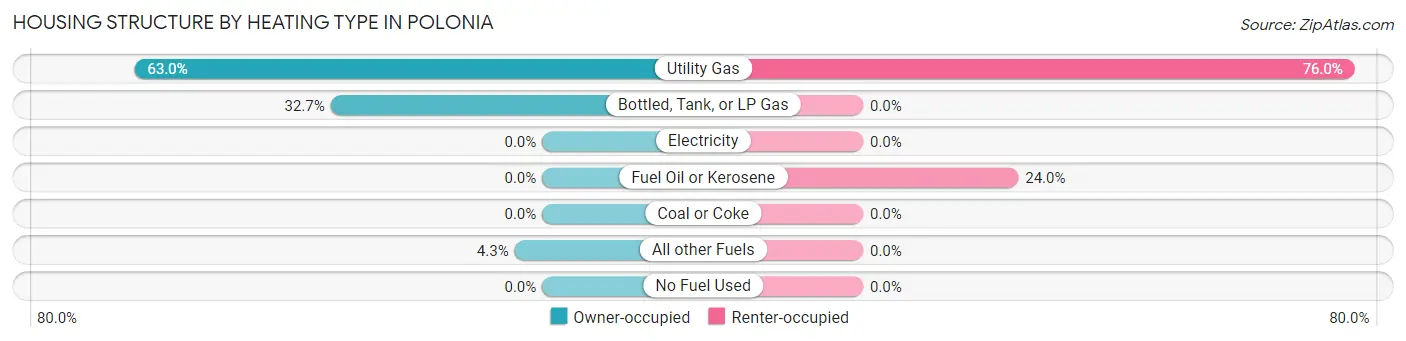
| Heating Type | Owner-occupied | Renter-occupied |
| Utility Gas | 133 (63.0%) | 19 (76.0%) |
| Bottled, Tank, or LP Gas | 69 (32.7%) | 0 (0.0%) |
| Electricity | 0 (0.0%) | 0 (0.0%) |
| Fuel Oil or Kerosene | 0 (0.0%) | 6 (24.0%) |
| Coal or Coke | 0 (0.0%) | 0 (0.0%) |
| All other Fuels | 9 (4.3%) | 0 (0.0%) |
| No Fuel Used | 0 (0.0%) | 0 (0.0%) |
| Total | 211 (100.0%) | 25 (100.0%) |
Household Vehicle Usage in Polonia
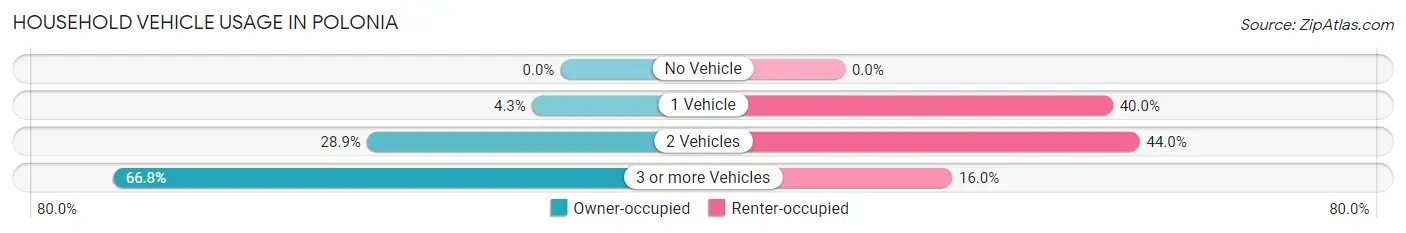
| Vehicles per Household | Owner-occupied | Renter-occupied |
| No Vehicle | 0 (0.0%) | 0 (0.0%) |
| 1 Vehicle | 9 (4.3%) | 10 (40.0%) |
| 2 Vehicles | 61 (28.9%) | 11 (44.0%) |
| 3 or more Vehicles | 141 (66.8%) | 4 (16.0%) |
| Total | 211 (100.0%) | 25 (100.0%) |
Real Estate & Mortgages in Polonia
Real Estate and Mortgage Overview in Polonia
| Characteristic | Without Mortgage | With Mortgage |
| Housing Units | 59 | 152 |
| Median Property Value | $247,500 | $270,900 |
| Median Household Income | $101,250 | $97 |
| Monthly Housing Costs | $468 | $55 |
| Real Estate Taxes | $2,536 | $0 |
Property Value by Mortgage Status in Polonia
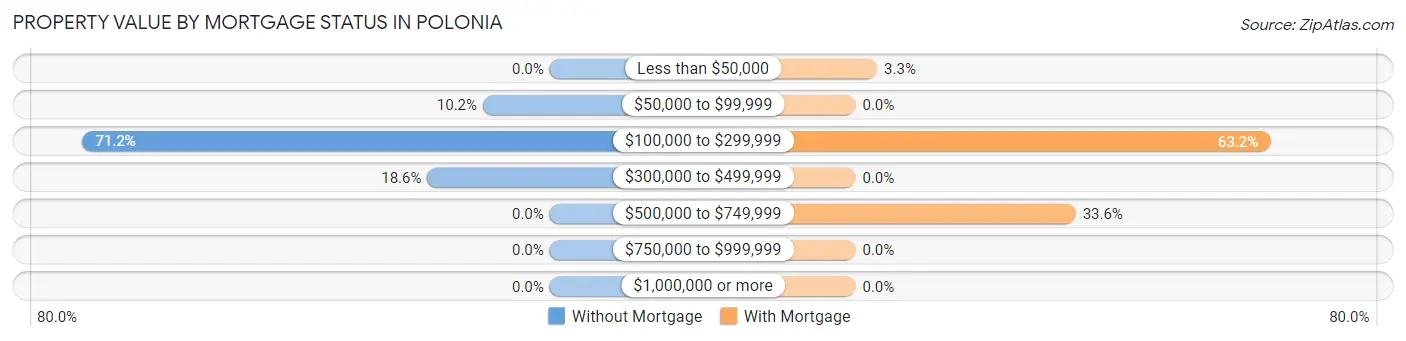
| Property Value | Without Mortgage | With Mortgage |
| Less than $50,000 | 0 (0.0%) | 5 (3.3%) |
| $50,000 to $99,999 | 6 (10.2%) | 0 (0.0%) |
| $100,000 to $299,999 | 42 (71.2%) | 96 (63.2%) |
| $300,000 to $499,999 | 11 (18.6%) | 0 (0.0%) |
| $500,000 to $749,999 | 0 (0.0%) | 51 (33.6%) |
| $750,000 to $999,999 | 0 (0.0%) | 0 (0.0%) |
| $1,000,000 or more | 0 (0.0%) | 0 (0.0%) |
| Total | 59 (100.0%) | 152 (100.0%) |
Household Income by Mortgage Status in Polonia
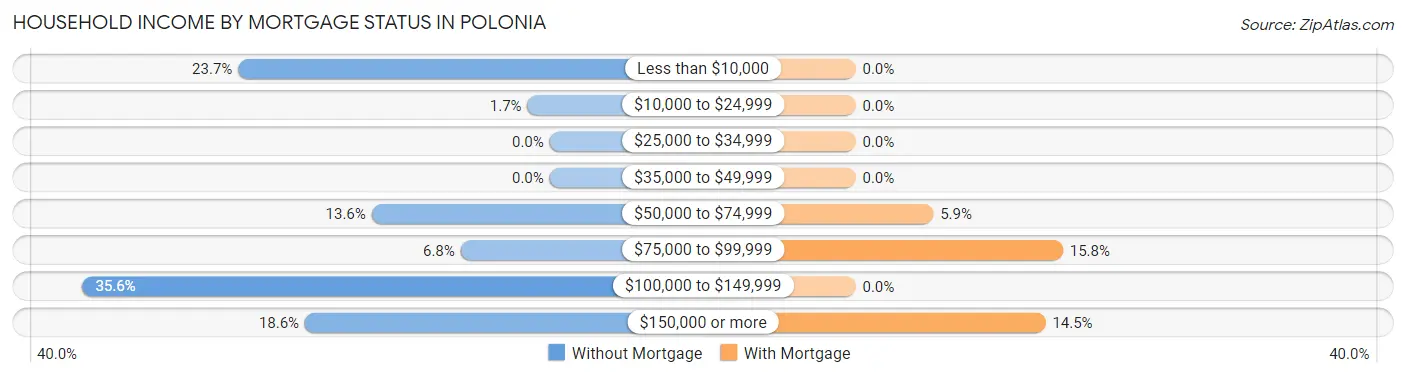
| Household Income | Without Mortgage | With Mortgage |
| Less than $10,000 | 14 (23.7%) | 0 (0.0%) |
| $10,000 to $24,999 | 1 (1.7%) | 0 (0.0%) |
| $25,000 to $34,999 | 0 (0.0%) | 0 (0.0%) |
| $35,000 to $49,999 | 0 (0.0%) | 0 (0.0%) |
| $50,000 to $74,999 | 8 (13.6%) | 9 (5.9%) |
| $75,000 to $99,999 | 4 (6.8%) | 24 (15.8%) |
| $100,000 to $149,999 | 21 (35.6%) | 0 (0.0%) |
| $150,000 or more | 11 (18.6%) | 22 (14.5%) |
| Total | 59 (100.0%) | 152 (100.0%) |
Property Value to Household Income Ratio in Polonia
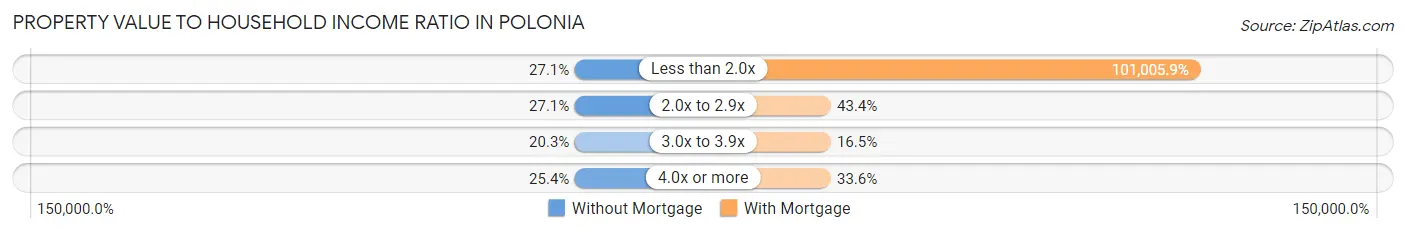
| Value-to-Income Ratio | Without Mortgage | With Mortgage |
| Less than 2.0x | 16 (27.1%) | 153,529 (101,005.9%) |
| 2.0x to 2.9x | 16 (27.1%) | 66 (43.4%) |
| 3.0x to 3.9x | 12 (20.3%) | 25 (16.5%) |
| 4.0x or more | 15 (25.4%) | 51 (33.6%) |
| Total | 59 (100.0%) | 152 (100.0%) |
Real Estate Taxes by Mortgage Status in Polonia
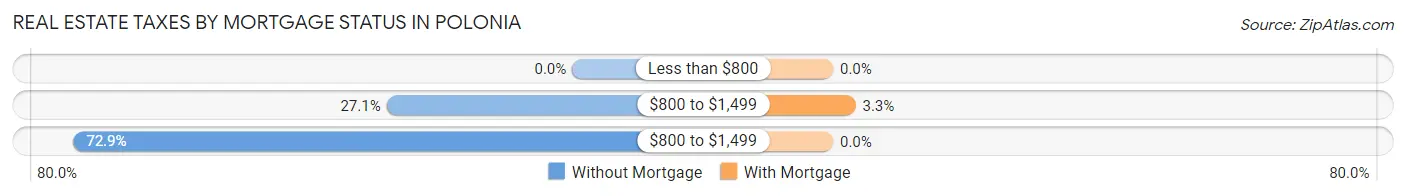
| Property Taxes | Without Mortgage | With Mortgage |
| Less than $800 | 0 (0.0%) | 0 (0.0%) |
| $800 to $1,499 | 16 (27.1%) | 5 (3.3%) |
| $800 to $1,499 | 43 (72.9%) | 0 (0.0%) |
| Total | 59 (100.0%) | 152 (100.0%) |
Health & Disability in Polonia
Health Insurance Coverage by Age in Polonia
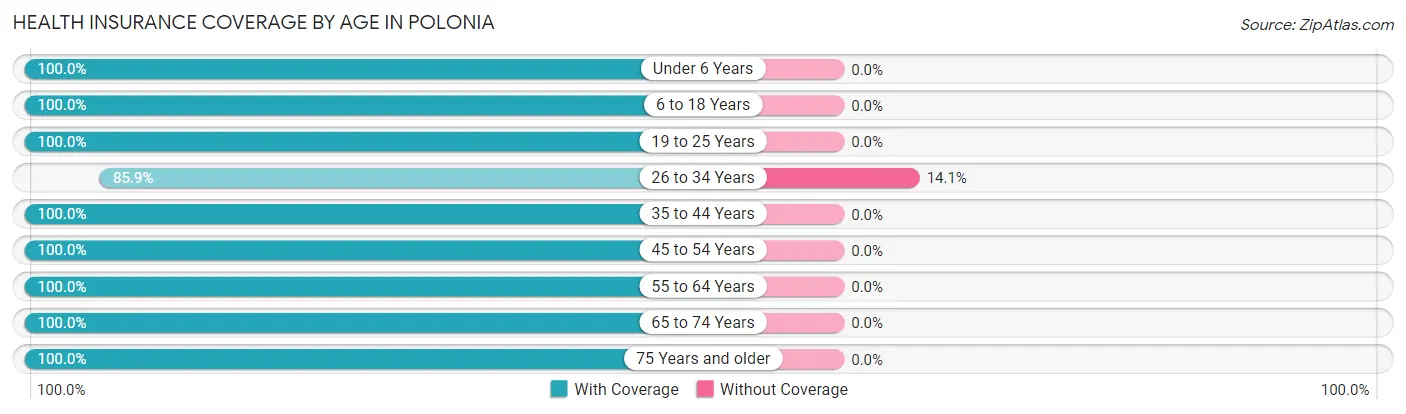
| Age Bracket | With Coverage | Without Coverage |
| Under 6 Years | 70 (100.0%) | 0 (0.0%) |
| 6 to 18 Years | 54 (100.0%) | 0 (0.0%) |
| 19 to 25 Years | 83 (100.0%) | 0 (0.0%) |
| 26 to 34 Years | 55 (85.9%) | 9 (14.1%) |
| 35 to 44 Years | 47 (100.0%) | 0 (0.0%) |
| 45 to 54 Years | 79 (100.0%) | 0 (0.0%) |
| 55 to 64 Years | 223 (100.0%) | 0 (0.0%) |
| 65 to 74 Years | 41 (100.0%) | 0 (0.0%) |
| 75 Years and older | 4 (100.0%) | 0 (0.0%) |
| Total | 656 (98.7%) | 9 (1.3%) |
Health Insurance Coverage by Citizenship Status in Polonia
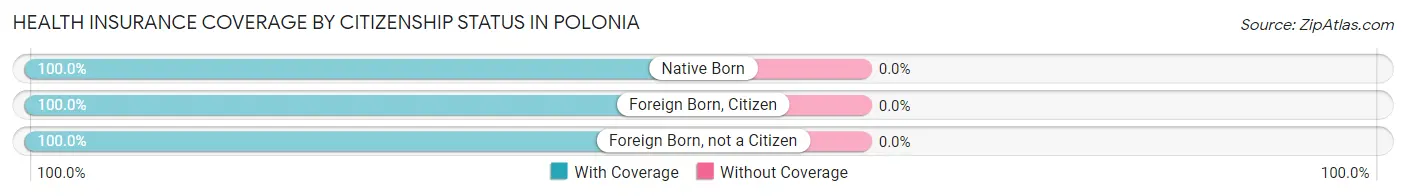
| Citizenship Status | With Coverage | Without Coverage |
| Native Born | 70 (100.0%) | 0 (0.0%) |
| Foreign Born, Citizen | 54 (100.0%) | 0 (0.0%) |
| Foreign Born, not a Citizen | 83 (100.0%) | 0 (0.0%) |
Health Insurance Coverage by Household Income in Polonia
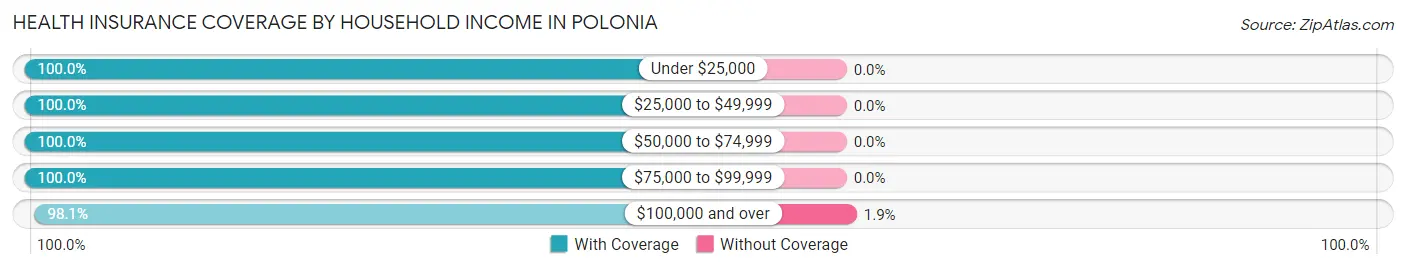
| Household Income | With Coverage | Without Coverage |
| Under $25,000 | 31 (100.0%) | 0 (0.0%) |
| $25,000 to $49,999 | 13 (100.0%) | 0 (0.0%) |
| $50,000 to $74,999 | 96 (100.0%) | 0 (0.0%) |
| $75,000 to $99,999 | 45 (100.0%) | 0 (0.0%) |
| $100,000 and over | 471 (98.1%) | 9 (1.9%) |
Public vs Private Health Insurance Coverage by Age in Polonia
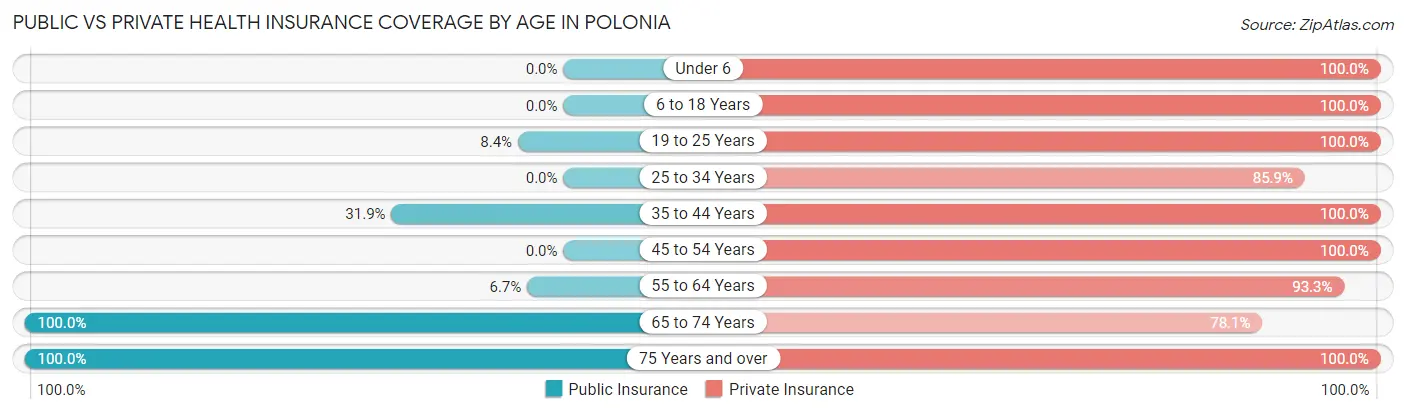
| Age Bracket | Public Insurance | Private Insurance |
| Under 6 | 0 (0.0%) | 70 (100.0%) |
| 6 to 18 Years | 0 (0.0%) | 54 (100.0%) |
| 19 to 25 Years | 7 (8.4%) | 83 (100.0%) |
| 25 to 34 Years | 0 (0.0%) | 55 (85.9%) |
| 35 to 44 Years | 15 (31.9%) | 47 (100.0%) |
| 45 to 54 Years | 0 (0.0%) | 79 (100.0%) |
| 55 to 64 Years | 15 (6.7%) | 208 (93.3%) |
| 65 to 74 Years | 41 (100.0%) | 32 (78.0%) |
| 75 Years and over | 4 (100.0%) | 4 (100.0%) |
| Total | 82 (12.3%) | 632 (95.0%) |
Disability Status by Sex by Age in Polonia
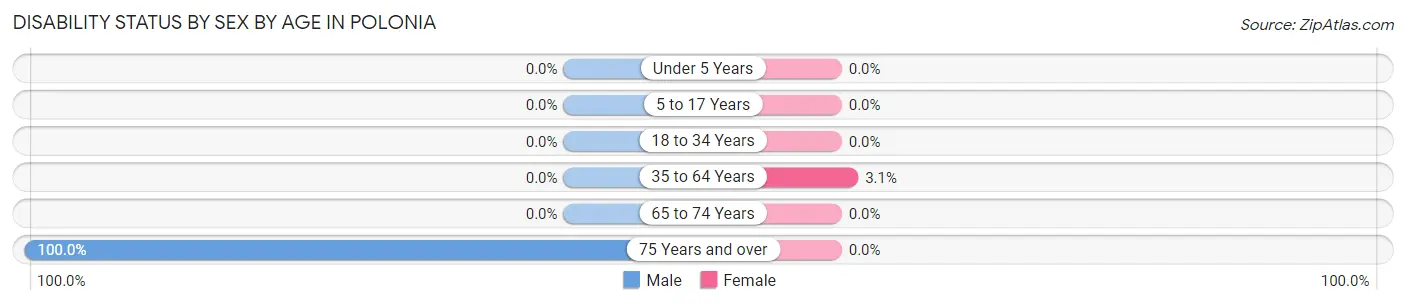
| Age Bracket | Male | Female |
| Under 5 Years | 0 (0.0%) | 0 (0.0%) |
| 5 to 17 Years | 0 (0.0%) | 0 (0.0%) |
| 18 to 34 Years | 0 (0.0%) | 0 (0.0%) |
| 35 to 64 Years | 0 (0.0%) | 5 (3.0%) |
| 65 to 74 Years | 0 (0.0%) | 0 (0.0%) |
| 75 Years and over | 4 (100.0%) | 0 (0.0%) |
Disability Class by Sex by Age in Polonia
Disability Class: Hearing Difficulty
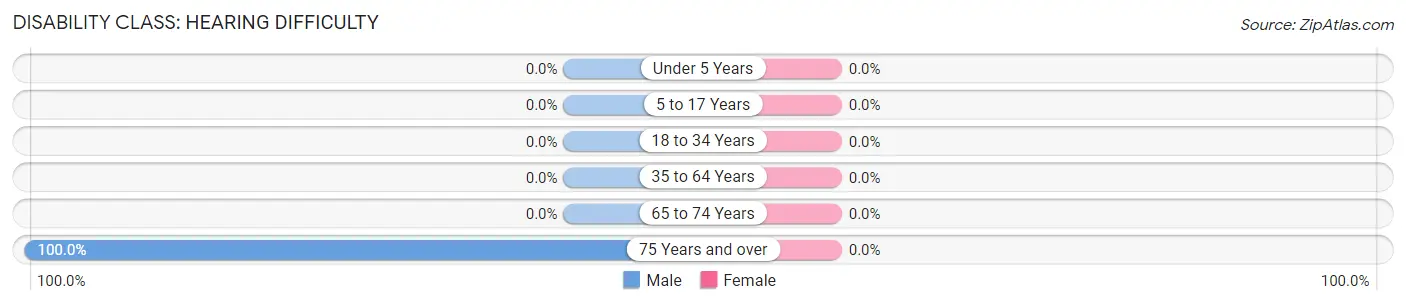
| Age Bracket | Male | Female |
| Under 5 Years | 0 (0.0%) | 0 (0.0%) |
| 5 to 17 Years | 0 (0.0%) | 0 (0.0%) |
| 18 to 34 Years | 0 (0.0%) | 0 (0.0%) |
| 35 to 64 Years | 0 (0.0%) | 0 (0.0%) |
| 65 to 74 Years | 0 (0.0%) | 0 (0.0%) |
| 75 Years and over | 4 (100.0%) | 0 (0.0%) |
Disability Class: Vision Difficulty
| Age Bracket | Male | Female |
| Under 5 Years | 0 (0.0%) | 0 (0.0%) |
| 5 to 17 Years | 0 (0.0%) | 0 (0.0%) |
| 18 to 34 Years | 0 (0.0%) | 0 (0.0%) |
| 35 to 64 Years | 0 (0.0%) | 0 (0.0%) |
| 65 to 74 Years | 0 (0.0%) | 0 (0.0%) |
| 75 Years and over | 0 (0.0%) | 0 (0.0%) |
Disability Class: Cognitive Difficulty
| Age Bracket | Male | Female |
| 5 to 17 Years | 0 (0.0%) | 0 (0.0%) |
| 18 to 34 Years | 0 (0.0%) | 0 (0.0%) |
| 35 to 64 Years | 0 (0.0%) | 0 (0.0%) |
| 65 to 74 Years | 0 (0.0%) | 0 (0.0%) |
| 75 Years and over | 0 (0.0%) | 0 (0.0%) |
Disability Class: Ambulatory Difficulty
| Age Bracket | Male | Female |
| 5 to 17 Years | 0 (0.0%) | 0 (0.0%) |
| 18 to 34 Years | 0 (0.0%) | 0 (0.0%) |
| 35 to 64 Years | 0 (0.0%) | 0 (0.0%) |
| 65 to 74 Years | 0 (0.0%) | 0 (0.0%) |
| 75 Years and over | 0 (0.0%) | 0 (0.0%) |
Disability Class: Self-Care Difficulty
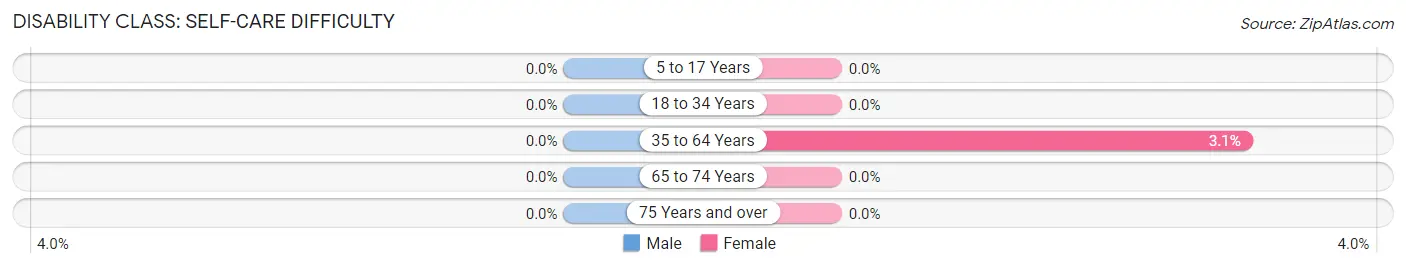
| Age Bracket | Male | Female |
| 5 to 17 Years | 0 (0.0%) | 0 (0.0%) |
| 18 to 34 Years | 0 (0.0%) | 0 (0.0%) |
| 35 to 64 Years | 0 (0.0%) | 5 (3.0%) |
| 65 to 74 Years | 0 (0.0%) | 0 (0.0%) |
| 75 Years and over | 0 (0.0%) | 0 (0.0%) |
Technology Access in Polonia
Computing Device Access in Polonia
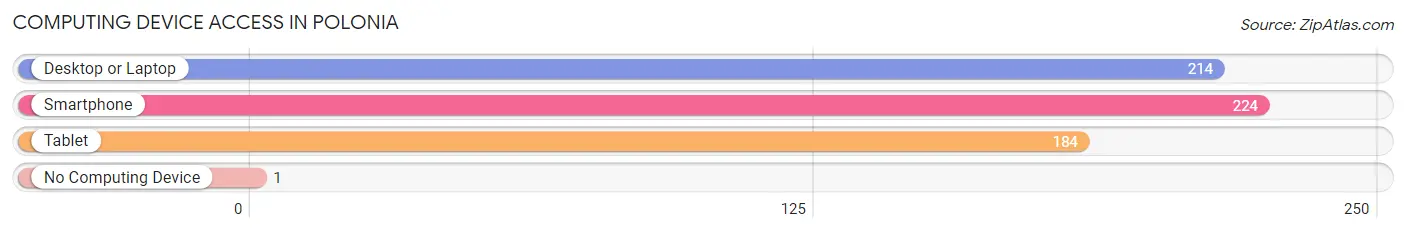
| Device Type | # Households | % Households |
| Desktop or Laptop | 214 | 90.7% |
| Smartphone | 224 | 94.9% |
| Tablet | 184 | 78.0% |
| No Computing Device | 1 | 0.4% |
| Total | 236 | 100.0% |
Internet Access in Polonia
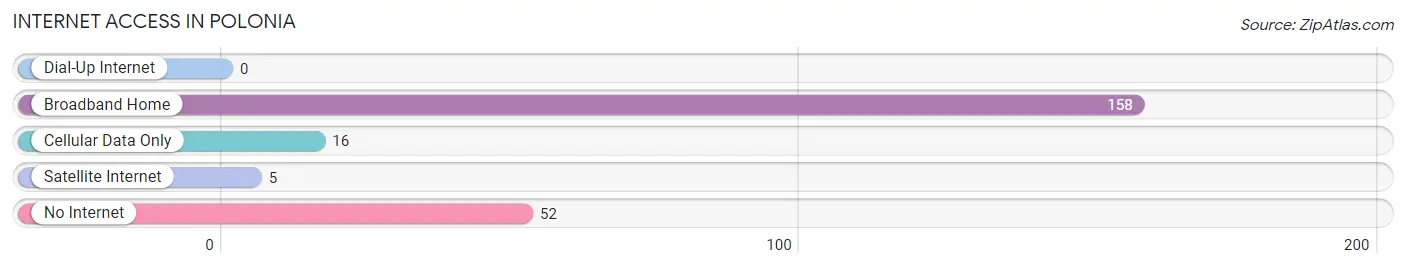
| Internet Type | # Households | % Households |
| Dial-Up Internet | 0 | 0.0% |
| Broadband Home | 158 | 66.9% |
| Cellular Data Only | 16 | 6.8% |
| Satellite Internet | 5 | 2.1% |
| No Internet | 52 | 22.0% |
| Total | 236 | 100.0% |
Polonia Summary
Polonia, Wisconsin is a small unincorporated community located in the town of Buena Vista in Portage County. It is situated on the banks of the Little Plover River, about 10 miles south of Stevens Point. The population of Polonia was estimated to be around 200 people in 2000.
History
Polonia was founded in 1854 by Polish immigrants who had come to the area to work in the lumber industry. The town was named after the Polish word for Poland, and the settlers built a church and a school. The first post office was established in 1871.
In the late 19th century, Polonia was a thriving community with a variety of businesses, including a general store, a blacksmith shop, a saloon, and a hotel. The town also had a sawmill, a grist mill, and a cheese factory.
Geography
Polonia is located in the town of Buena Vista in Portage County, Wisconsin. It is situated on the banks of the Little Plover River, about 10 miles south of Stevens Point. The town is surrounded by rolling hills and farmland.
Economy
The economy of Polonia is largely based on agriculture. The town is home to several dairy farms, as well as a few small businesses. The town also has a few restaurants and bars.
Demographics
As of the 2000 census, the population of Polonia was estimated to be around 200 people. The racial makeup of the town was 97.5% White, 0.5% African American, 0.5% Native American, and 1.5% from two or more races. The median household income was $37,500, and the median family income was $41,250.
Conclusion
Polonia, Wisconsin is a small unincorporated community located in the town of Buena Vista in Portage County. It was founded in 1854 by Polish immigrants and has a population of around 200 people. The economy of Polonia is largely based on agriculture, and the town is home to several dairy farms, as well as a few small businesses. The racial makeup of the town is predominantly White, with a small percentage of African American, Native American, and other races.
Common Questions
What is Per Capita Income in Polonia?
Per Capita income in Polonia is $44,274.
What is the Median Family Income in Polonia?
Median Family Income in Polonia is $152,696.
What is the Median Household income in Polonia?
Median Household Income in Polonia is $124,722.
What is Income or Wage Gap in Polonia?
Income or Wage Gap in Polonia is 38.1%.
Women in Polonia earn 61.9 cents for every dollar earned by a man.
What is Family Income Deficit in Polonia?
Family Income Deficit in Polonia is $11,910.
Families that are below poverty line in Polonia earn $11,910 less on average than the poverty threshold level.
What is Inequality or Gini Index in Polonia?
Inequality or Gini Index in Polonia is 0.27.
What is the Total Population of Polonia?
Total Population of Polonia is 665.
What is the Total Male Population of Polonia?
Total Male Population of Polonia is 352.
What is the Total Female Population of Polonia?
Total Female Population of Polonia is 313.
What is the Ratio of Males per 100 Females in Polonia?
There are 112.46 Males per 100 Females in Polonia.
What is the Ratio of Females per 100 Males in Polonia?
There are 88.92 Females per 100 Males in Polonia.
What is the Median Population Age in Polonia?
Median Population Age in Polonia is 47.2 Years.
What is the Average Family Size in Polonia
Average Family Size in Polonia is 3.2 People.
What is the Average Household Size in Polonia
Average Household Size in Polonia is 2.8 People.
How Large is the Labor Force in Polonia?
There are 448 People in the Labor Forcein in Polonia.
What is the Percentage of People in the Labor Force in Polonia?
82.1% of People are in the Labor Force in Polonia.
What is the Unemployment Rate in Polonia?
Unemployment Rate in Polonia is 2.5%.