Wheeler, WI Map & Demographics
Wheeler Map
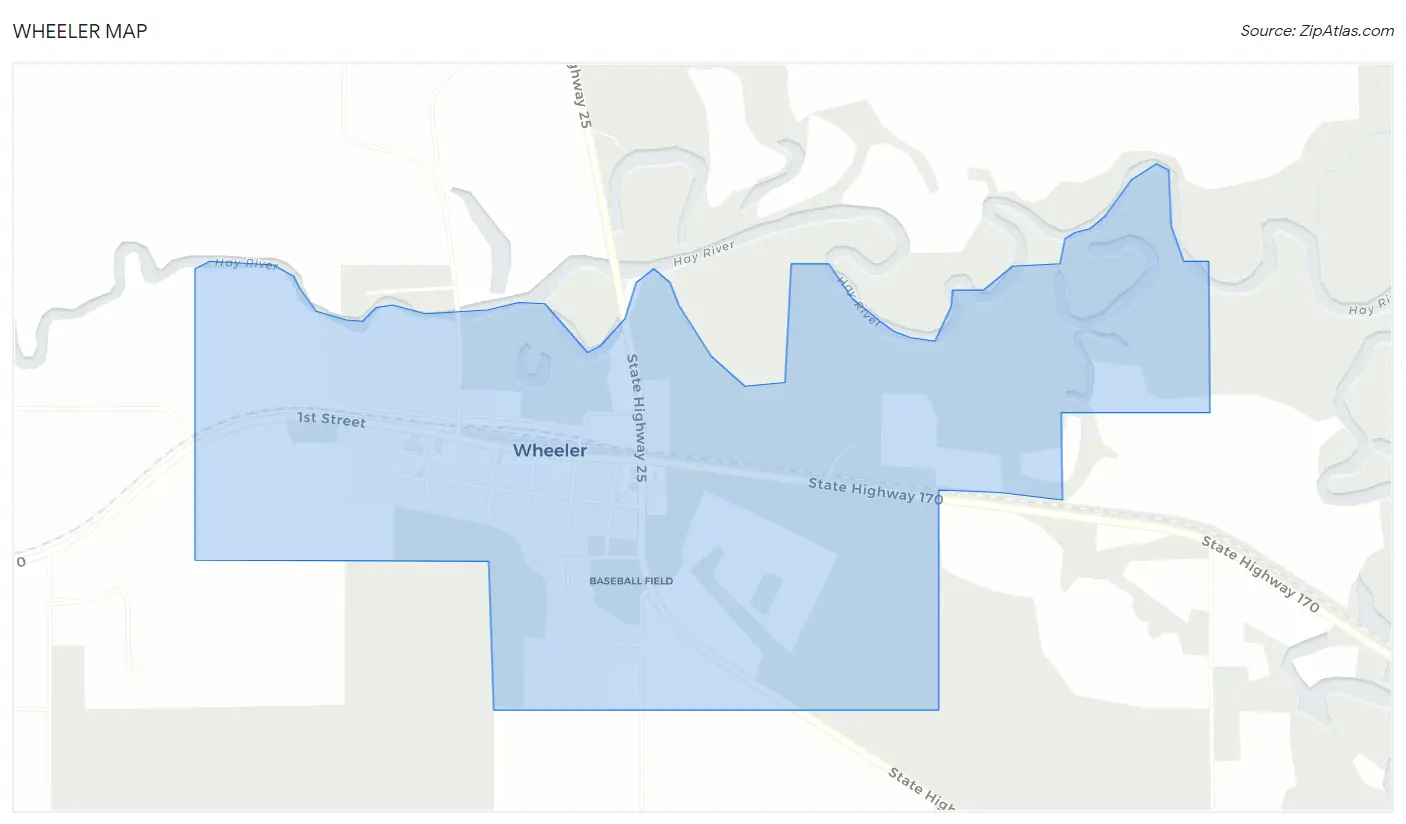
Wheeler Overview
$28,065
PER CAPITA INCOME
$87,813
AVG FAMILY INCOME
$54,167
AVG HOUSEHOLD INCOME
44.2%
WAGE / INCOME GAP [ % ]
55.8¢/ $1
WAGE / INCOME GAP [ $ ]
0.43
INEQUALITY / GINI INDEX
229
TOTAL POPULATION
115
MALE POPULATION
114
FEMALE POPULATION
100.88
MALES / 100 FEMALES
99.13
FEMALES / 100 MALES
42.6
MEDIAN AGE
3.0
AVG FAMILY SIZE
2.3
AVG HOUSEHOLD SIZE
127
LABOR FORCE [ PEOPLE ]
66.8%
PERCENT IN LABOR FORCE
1.6%
UNEMPLOYMENT RATE
Wheeler Zip Codes
Wheeler Area Codes
Income in Wheeler
Income Overview in Wheeler
Per Capita Income in Wheeler is $28,065, while median incomes of families and households are $87,813 and $54,167 respectively.
| Characteristic | Number | Measure |
| Per Capita Income | 229 | $28,065 |
| Median Family Income | 57 | $87,813 |
| Mean Family Income | 57 | $88,988 |
| Median Household Income | 100 | $54,167 |
| Mean Household Income | 100 | $63,724 |
| Income Deficit | 57 | $0 |
| Wage / Income Gap (%) | 229 | 44.19% |
| Wage / Income Gap ($) | 229 | 55.81¢ per $1 |
| Gini / Inequality Index | 229 | 0.43 |
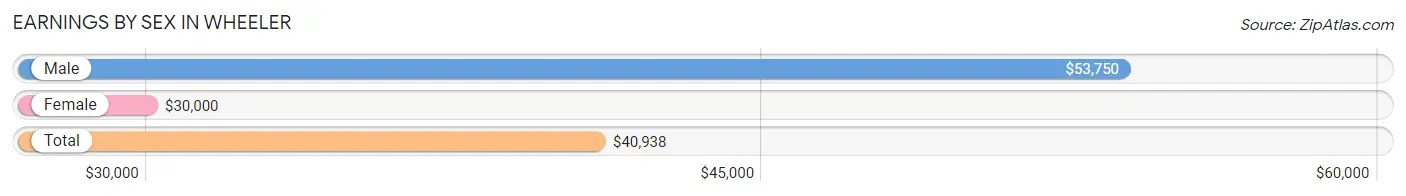
Earnings by Sex in Wheeler
Average Earnings in Wheeler are $40,938, $53,750 for men and $30,000 for women, a difference of 44.2%.
| Sex | Number | Average Earnings |
| Male | 67 (52.8%) | $53,750 |
| Female | 60 (47.2%) | $30,000 |
| Total | 127 (100.0%) | $40,938 |
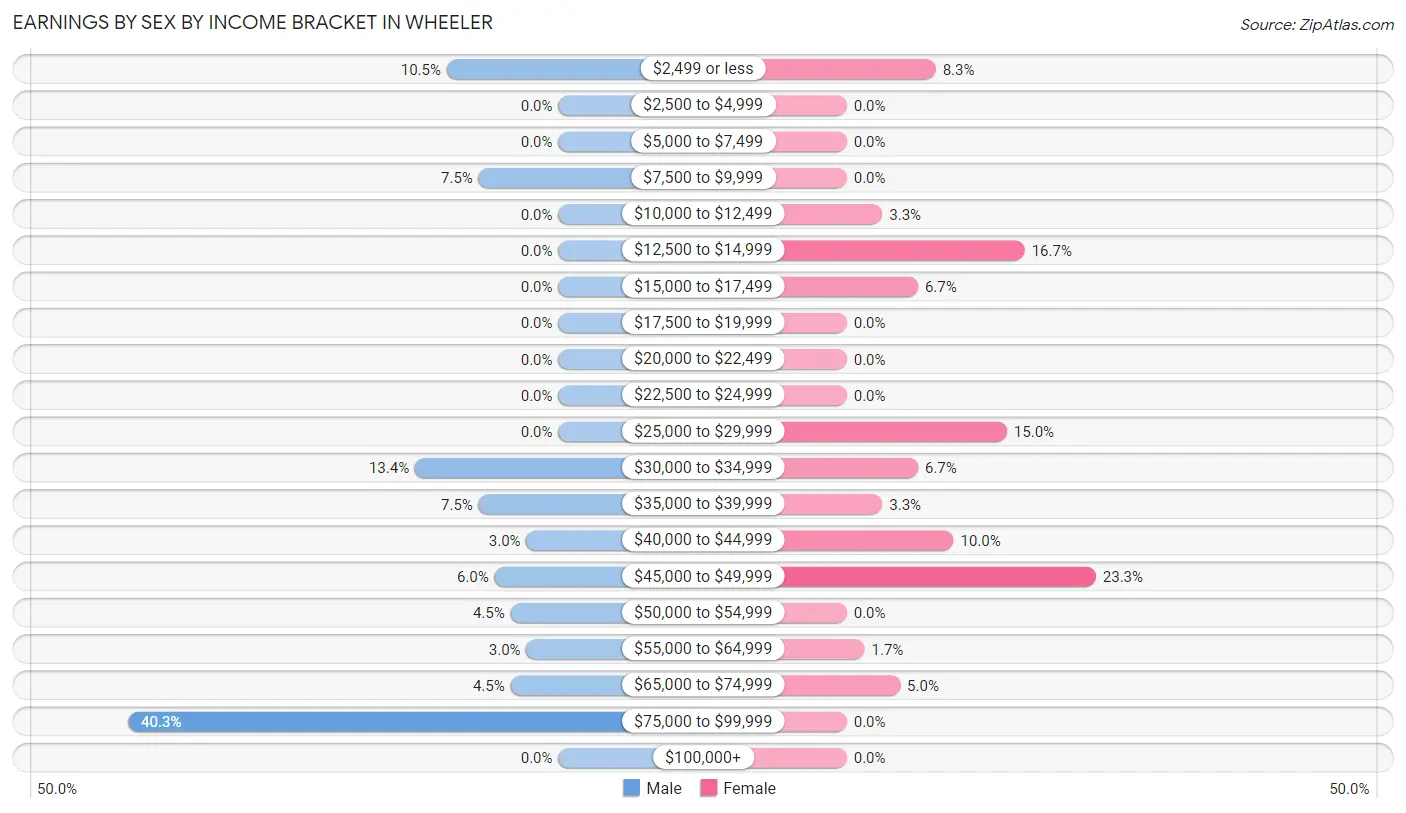
Earnings by Sex by Income Bracket in Wheeler
The most common earnings brackets in Wheeler are $75,000 to $99,999 for men (27 | 40.3%) and $45,000 to $49,999 for women (14 | 23.3%).
| Income | Male | Female |
| $2,499 or less | 7 (10.4%) | 5 (8.3%) |
| $2,500 to $4,999 | 0 (0.0%) | 0 (0.0%) |
| $5,000 to $7,499 | 0 (0.0%) | 0 (0.0%) |
| $7,500 to $9,999 | 5 (7.5%) | 0 (0.0%) |
| $10,000 to $12,499 | 0 (0.0%) | 2 (3.3%) |
| $12,500 to $14,999 | 0 (0.0%) | 10 (16.7%) |
| $15,000 to $17,499 | 0 (0.0%) | 4 (6.7%) |
| $17,500 to $19,999 | 0 (0.0%) | 0 (0.0%) |
| $20,000 to $22,499 | 0 (0.0%) | 0 (0.0%) |
| $22,500 to $24,999 | 0 (0.0%) | 0 (0.0%) |
| $25,000 to $29,999 | 0 (0.0%) | 9 (15.0%) |
| $30,000 to $34,999 | 9 (13.4%) | 4 (6.7%) |
| $35,000 to $39,999 | 5 (7.5%) | 2 (3.3%) |
| $40,000 to $44,999 | 2 (3.0%) | 6 (10.0%) |
| $45,000 to $49,999 | 4 (6.0%) | 14 (23.3%) |
| $50,000 to $54,999 | 3 (4.5%) | 0 (0.0%) |
| $55,000 to $64,999 | 2 (3.0%) | 1 (1.7%) |
| $65,000 to $74,999 | 3 (4.5%) | 3 (5.0%) |
| $75,000 to $99,999 | 27 (40.3%) | 0 (0.0%) |
| $100,000+ | 0 (0.0%) | 0 (0.0%) |
| Total | 67 (100.0%) | 60 (100.0%) |
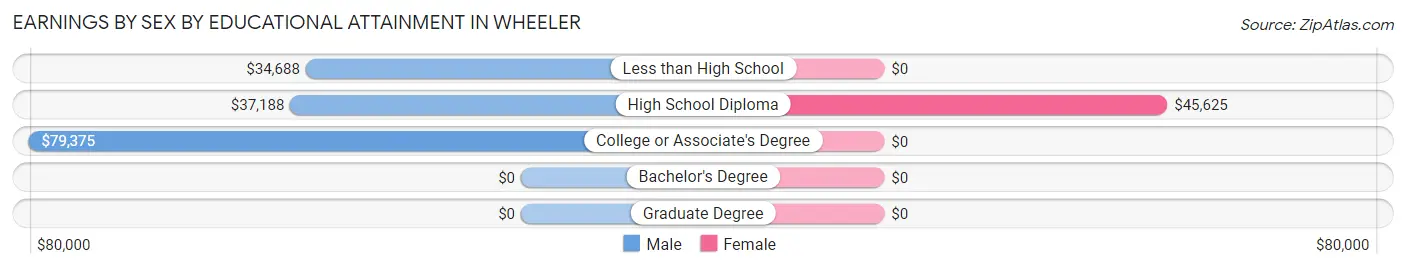
Earnings by Sex by Educational Attainment in Wheeler
Average earnings in Wheeler are $54,167 for men and $42,917 for women, a difference of 20.8%. Men with an educational attainment of college or associate's degree enjoy the highest average annual earnings of $79,375, while those with less than high school education earn the least with $34,688. Women with an educational attainment of high school diploma earn the most with the average annual earnings of $45,625, while those with high school diploma education have the smallest earnings of $45,625.
| Educational Attainment | Male Income | Female Income |
| Less than High School | $34,688 | $0 |
| High School Diploma | $37,188 | $45,625 |
| College or Associate's Degree | $79,375 | $0 |
| Bachelor's Degree | - | - |
| Graduate Degree | - | - |
| Total | $54,167 | $42,917 |
Family Income in Wheeler
Family Income Brackets in Wheeler
According to the Wheeler family income data, there are 19 families falling into the $100,000 to $149,999 income range, which is the most common income bracket and makes up 33.3% of all families.
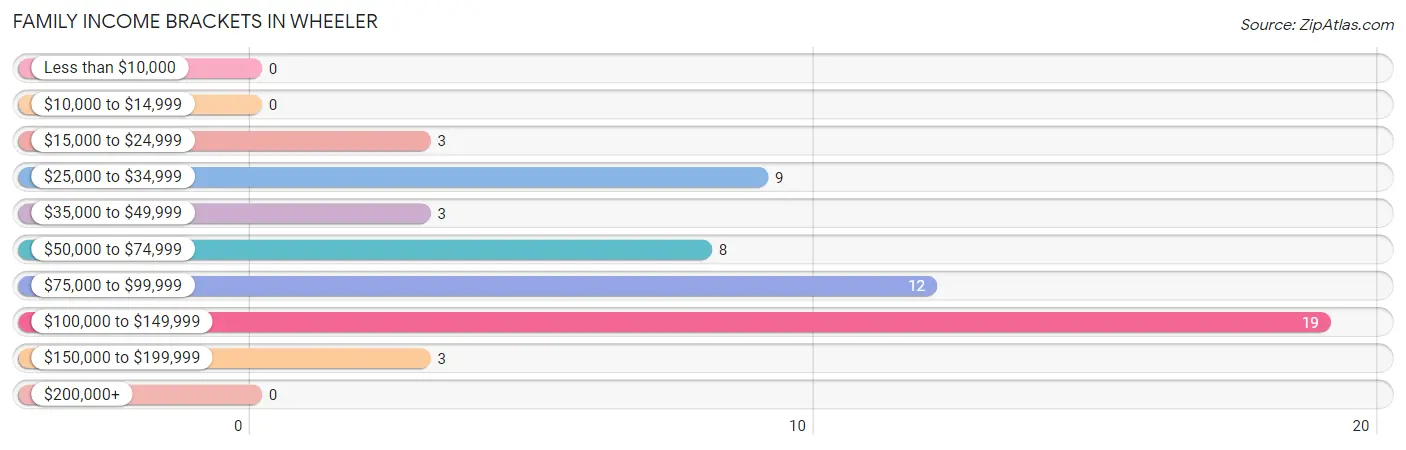
| Income Bracket | # Families | % Families |
| Less than $10,000 | 0 | 0.0% |
| $10,000 to $14,999 | 0 | 0.0% |
| $15,000 to $24,999 | 3 | 5.3% |
| $25,000 to $34,999 | 9 | 15.8% |
| $35,000 to $49,999 | 3 | 5.3% |
| $50,000 to $74,999 | 8 | 14.0% |
| $75,000 to $99,999 | 12 | 21.1% |
| $100,000 to $149,999 | 19 | 33.3% |
| $150,000 to $199,999 | 3 | 5.3% |
| $200,000+ | 0 | 0.0% |
Family Income by Famaliy Size in Wheeler
2-person families (30 | 52.6%) account for the highest median family income in Wheeler with $135,179 per family, while 2-person families (30 | 52.6%) have the highest median income of $67,590 per family member.
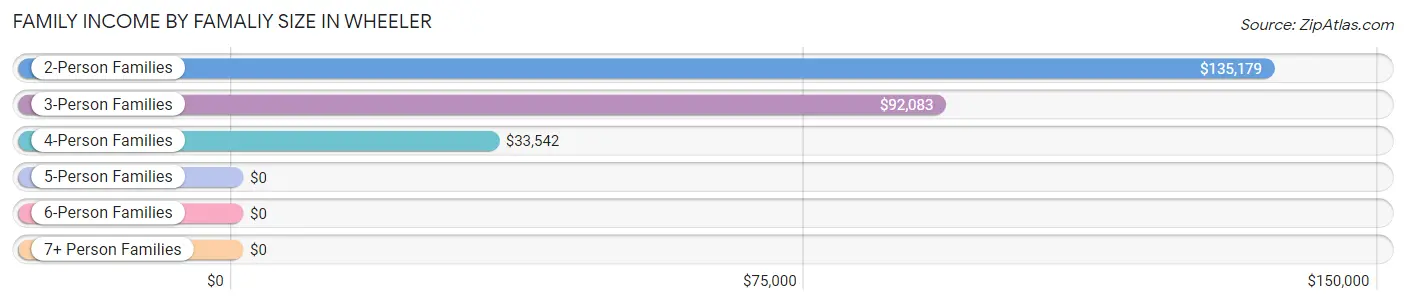
| Income Bracket | # Families | Median Income |
| 2-Person Families | 30 (52.6%) | $135,179 |
| 3-Person Families | 7 (12.3%) | $92,083 |
| 4-Person Families | 11 (19.3%) | $33,542 |
| 5-Person Families | 3 (5.3%) | $0 |
| 6-Person Families | 6 (10.5%) | $0 |
| 7+ Person Families | 0 (0.0%) | $0 |
| Total | 57 (100.0%) | $87,813 |
Family Income by Number of Earners in Wheeler
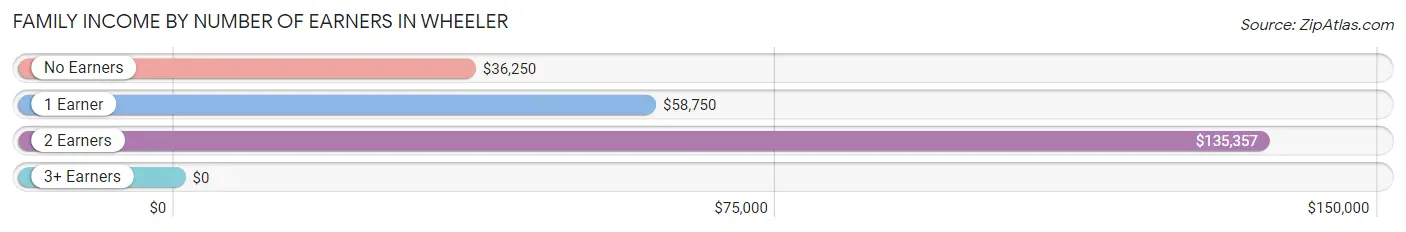
| Number of Earners | # Families | Median Income |
| No Earners | 9 (15.8%) | $36,250 |
| 1 Earner | 14 (24.6%) | $58,750 |
| 2 Earners | 28 (49.1%) | $135,357 |
| 3+ Earners | 6 (10.5%) | $0 |
| Total | 57 (100.0%) | $87,813 |
Household Income in Wheeler
Household Income Brackets in Wheeler
With 21 households falling in the category, the $100,000 to $149,999 income range is the most frequent in Wheeler, accounting for 21.0% of all households.
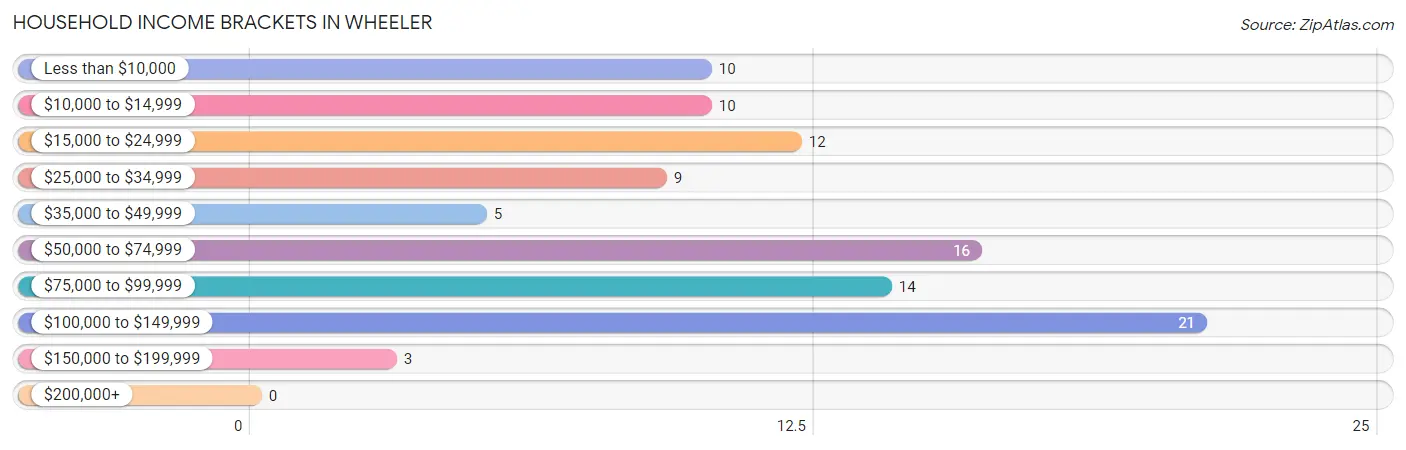
| Income Bracket | # Households | % Households |
| Less than $10,000 | 10 | 10.0% |
| $10,000 to $14,999 | 10 | 10.0% |
| $15,000 to $24,999 | 12 | 12.0% |
| $25,000 to $34,999 | 9 | 9.0% |
| $35,000 to $49,999 | 5 | 5.0% |
| $50,000 to $74,999 | 16 | 16.0% |
| $75,000 to $99,999 | 14 | 14.0% |
| $100,000 to $149,999 | 21 | 21.0% |
| $150,000 to $199,999 | 3 | 3.0% |
| $200,000+ | 0 | 0.0% |
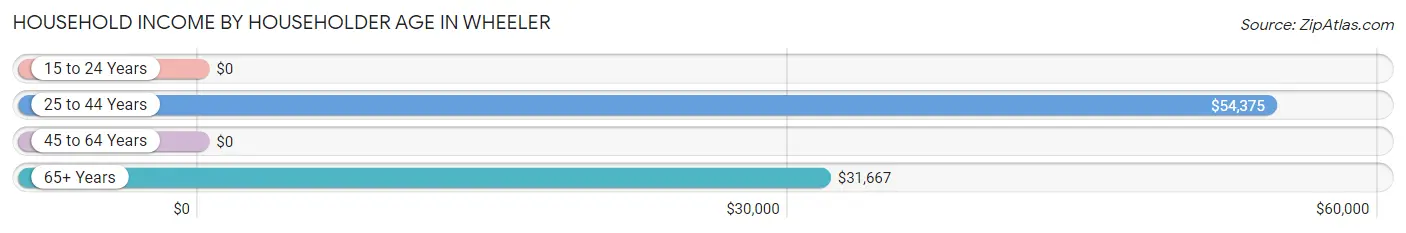
Household Income by Householder Age in Wheeler
The median household income in Wheeler is $54,167, with the highest median household income of $54,375 found in the 25 to 44 years age bracket for the primary householder. A total of 24 households (24.0%) fall into this category. Meanwhile, the 15 to 24 years age bracket for the primary householder has the lowest median household income of $0, with 4 households (4.0%) in this group.
| Income Bracket | # Households | Median Income |
| 15 to 24 Years | 4 (4.0%) | $0 |
| 25 to 44 Years | 24 (24.0%) | $54,375 |
| 45 to 64 Years | 52 (52.0%) | $0 |
| 65+ Years | 20 (20.0%) | $31,667 |
| Total | 100 (100.0%) | $54,167 |
Poverty in Wheeler
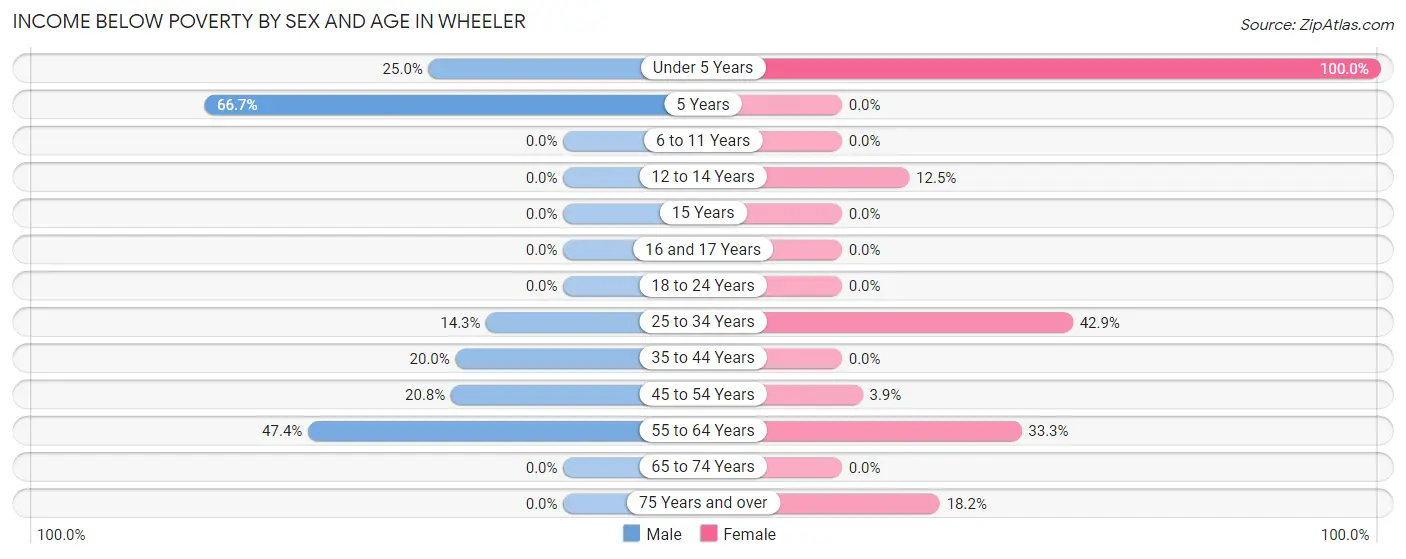
Income Below Poverty by Sex and Age in Wheeler
With 20.9% poverty level for males and 9.7% for females among the residents of Wheeler, 5 year old males and under 5 year old females are the most vulnerable to poverty, with 2 males (66.7%) and 1 females (100.0%) in their respective age groups living below the poverty level.
| Age Bracket | Male | Female |
| Under 5 Years | 2 (25.0%) | 1 (100.0%) |
| 5 Years | 2 (66.7%) | 0 (0.0%) |
| 6 to 11 Years | 0 (0.0%) | 0 (0.0%) |
| 12 to 14 Years | 0 (0.0%) | 1 (12.5%) |
| 15 Years | 0 (0.0%) | 0 (0.0%) |
| 16 and 17 Years | 0 (0.0%) | 0 (0.0%) |
| 18 to 24 Years | 0 (0.0%) | 0 (0.0%) |
| 25 to 34 Years | 1 (14.3%) | 3 (42.9%) |
| 35 to 44 Years | 5 (20.0%) | 0 (0.0%) |
| 45 to 54 Years | 5 (20.8%) | 1 (3.8%) |
| 55 to 64 Years | 9 (47.4%) | 3 (33.3%) |
| 65 to 74 Years | 0 (0.0%) | 0 (0.0%) |
| 75 Years and over | 0 (0.0%) | 2 (18.2%) |
| Total | 24 (20.9%) | 11 (9.7%) |
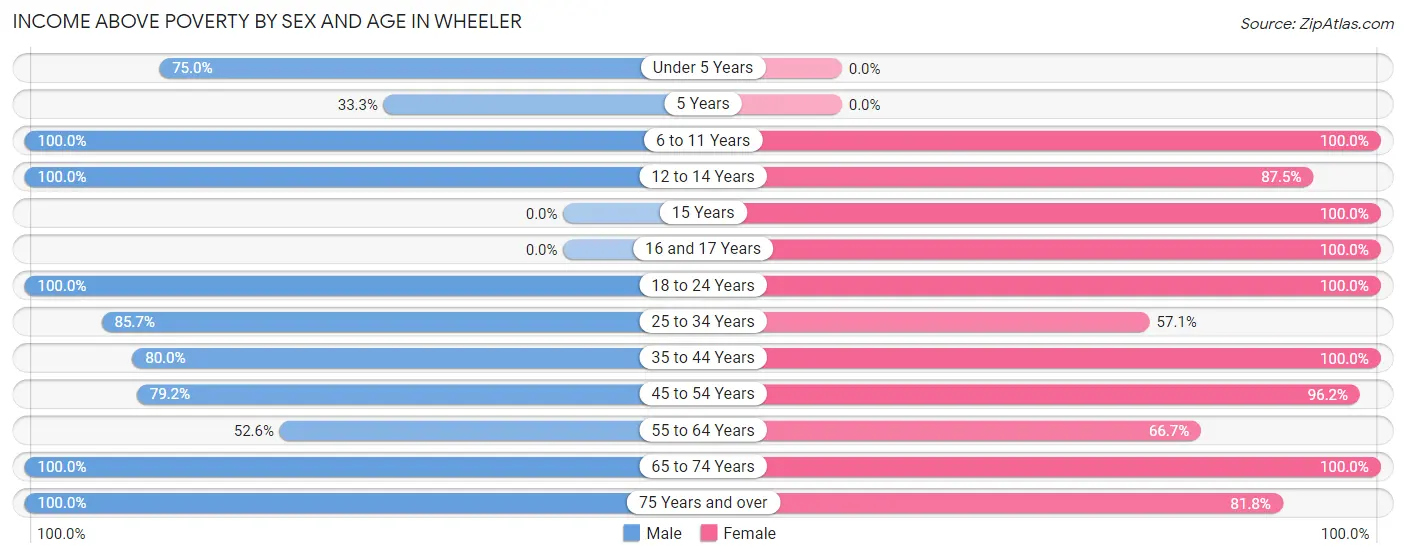
Income Above Poverty by Sex and Age in Wheeler
According to the poverty statistics in Wheeler, males aged 6 to 11 years and females aged 6 to 11 years are the age groups that are most secure financially, with 100.0% of males and 100.0% of females in these age groups living above the poverty line.
| Age Bracket | Male | Female |
| Under 5 Years | 6 (75.0%) | 0 (0.0%) |
| 5 Years | 1 (33.3%) | 0 (0.0%) |
| 6 to 11 Years | 6 (100.0%) | 6 (100.0%) |
| 12 to 14 Years | 5 (100.0%) | 7 (87.5%) |
| 15 Years | 0 (0.0%) | 2 (100.0%) |
| 16 and 17 Years | 0 (0.0%) | 8 (100.0%) |
| 18 to 24 Years | 1 (100.0%) | 19 (100.0%) |
| 25 to 34 Years | 6 (85.7%) | 4 (57.1%) |
| 35 to 44 Years | 20 (80.0%) | 15 (100.0%) |
| 45 to 54 Years | 19 (79.2%) | 25 (96.2%) |
| 55 to 64 Years | 10 (52.6%) | 6 (66.7%) |
| 65 to 74 Years | 10 (100.0%) | 2 (100.0%) |
| 75 Years and over | 7 (100.0%) | 9 (81.8%) |
| Total | 91 (79.1%) | 103 (90.3%) |
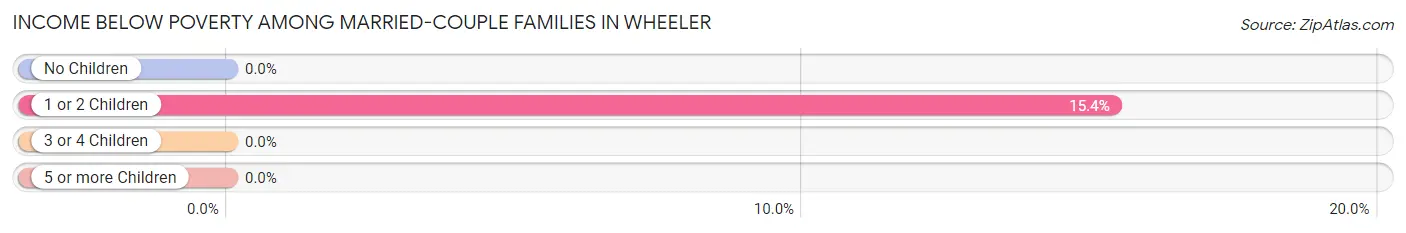
Income Below Poverty Among Married-Couple Families in Wheeler
The poverty statistics for married-couple families in Wheeler show that 3.6% or 2 of the total 55 families live below the poverty line. Families with 1 or 2 children have the highest poverty rate of 15.4%, comprising of 2 families. On the other hand, families with no children have the lowest poverty rate of 0.0%, which includes 0 families.
| Children | Above Poverty | Below Poverty |
| No Children | 33 (100.0%) | 0 (0.0%) |
| 1 or 2 Children | 11 (84.6%) | 2 (15.4%) |
| 3 or 4 Children | 9 (100.0%) | 0 (0.0%) |
| 5 or more Children | 0 (0.0%) | 0 (0.0%) |
| Total | 53 (96.4%) | 2 (3.6%) |
Income Below Poverty Among Single-Parent Households in Wheeler
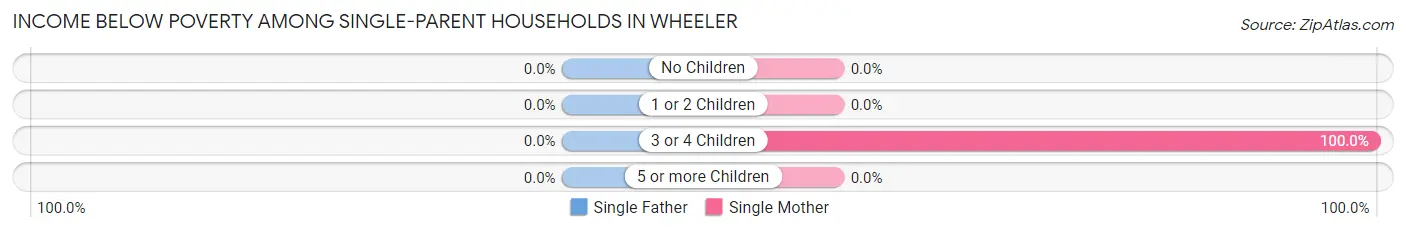
| Children | Single Father | Single Mother |
| No Children | 0 (0.0%) | 0 (0.0%) |
| 1 or 2 Children | 0 (0.0%) | 0 (0.0%) |
| 3 or 4 Children | 0 (0.0%) | 1 (100.0%) |
| 5 or more Children | 0 (0.0%) | 0 (0.0%) |
| Total | 0 (0.0%) | 1 (50.0%) |
Income Below Poverty Among Married-Couple vs Single-Parent Households in Wheeler
The poverty data for Wheeler shows that 2 of the married-couple family households (3.6%) and 1 of the single-parent households (50.0%) are living below the poverty level. Within the married-couple family households, those with 1 or 2 children have the highest poverty rate, with 2 households (15.4%) falling below the poverty line. Among the single-parent households, those with 3 or 4 children have the highest poverty rate, with 1 household (100.0%) living below poverty.
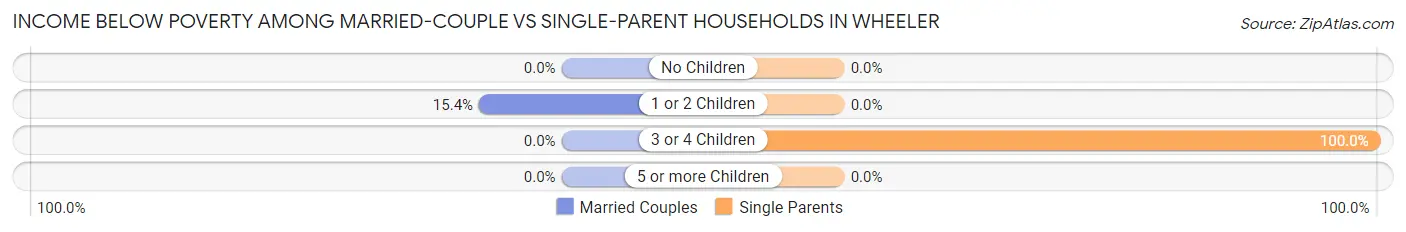
| Children | Married-Couple Families | Single-Parent Households |
| No Children | 0 (0.0%) | 0 (0.0%) |
| 1 or 2 Children | 2 (15.4%) | 0 (0.0%) |
| 3 or 4 Children | 0 (0.0%) | 1 (100.0%) |
| 5 or more Children | 0 (0.0%) | 0 (0.0%) |
| Total | 2 (3.6%) | 1 (50.0%) |
Race in Wheeler
The most populous races in Wheeler are White / Caucasian (222 | 96.9%), Hispanic or Latino (13 | 5.7%), and Two or more Races (6 | 2.6%).
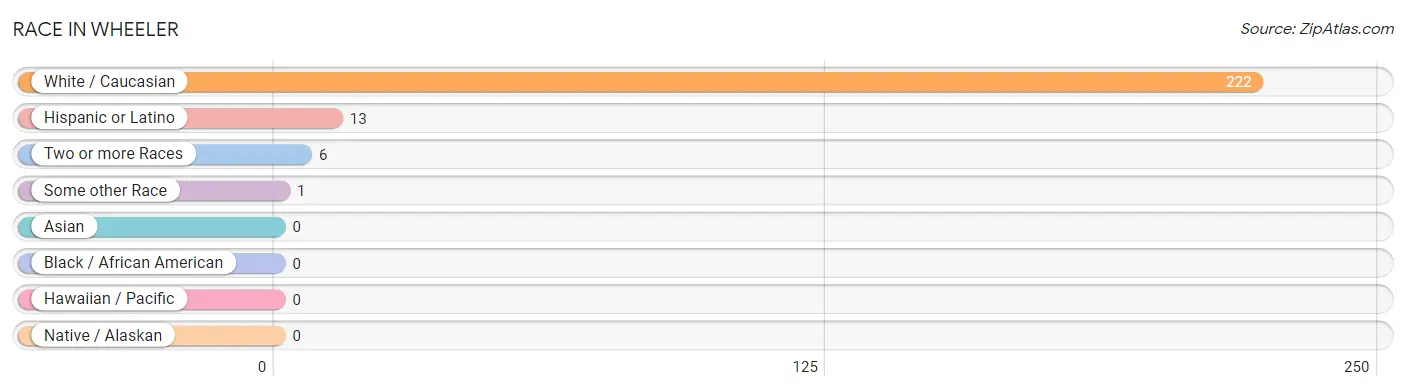
| Race | # Population | % Population |
| Asian | 0 | 0.0% |
| Black / African American | 0 | 0.0% |
| Hawaiian / Pacific | 0 | 0.0% |
| Hispanic or Latino | 13 | 5.7% |
| Native / Alaskan | 0 | 0.0% |
| White / Caucasian | 222 | 96.9% |
| Two or more Races | 6 | 2.6% |
| Some other Race | 1 | 0.4% |
| Total | 229 | 100.0% |
Ancestry in Wheeler
The most populous ancestries reported in Wheeler are German (64 | 28.0%), Irish (39 | 17.0%), Norwegian (34 | 14.8%), English (19 | 8.3%), and Danish (13 | 5.7%), together accounting for 73.8% of all Wheeler residents.
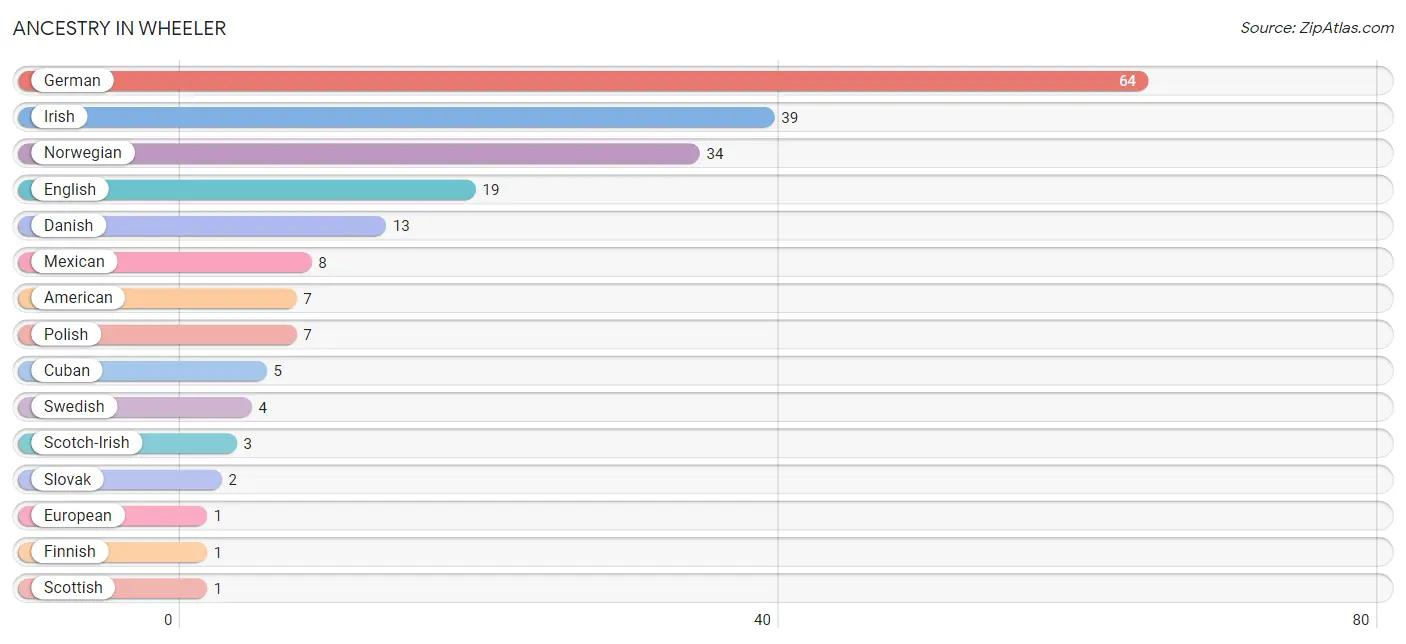
| Ancestry | # Population | % Population |
| American | 7 | 3.1% |
| Cuban | 5 | 2.2% |
| Danish | 13 | 5.7% |
| English | 19 | 8.3% |
| European | 1 | 0.4% |
| Finnish | 1 | 0.4% |
| German | 64 | 28.0% |
| Irish | 39 | 17.0% |
| Mexican | 8 | 3.5% |
| Norwegian | 34 | 14.8% |
| Polish | 7 | 3.1% |
| Scotch-Irish | 3 | 1.3% |
| Scottish | 1 | 0.4% |
| Slovak | 2 | 0.9% |
| Swedish | 4 | 1.8% | View All 15 Rows |
Immigrants in Wheeler

| Immigration Origin | # Population | % Population | View All 0 Rows |
Sex and Age in Wheeler
Sex and Age in Wheeler
The most populous age groups in Wheeler are 50 to 54 Years (24 | 20.9%) for men and 50 to 54 Years (17 | 14.9%) for women.
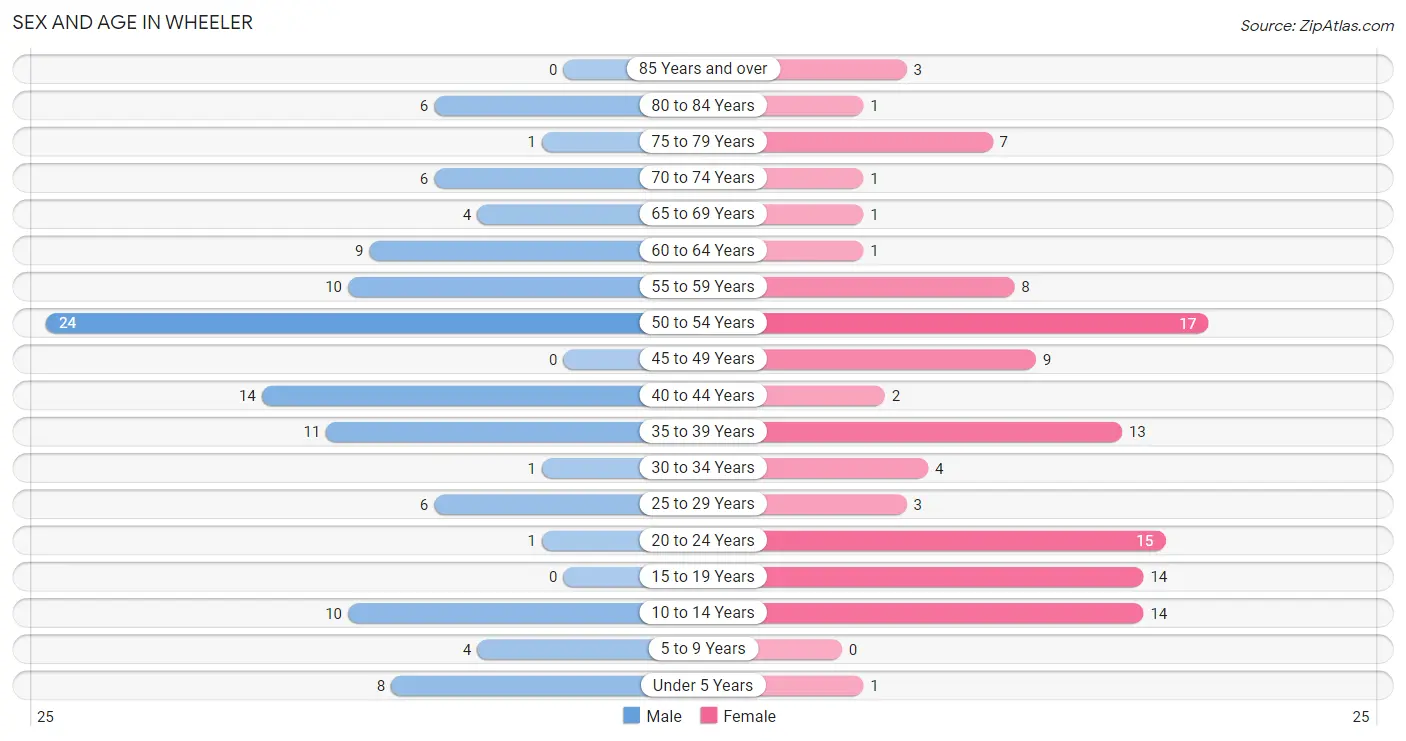
| Age Bracket | Male | Female |
| Under 5 Years | 8 (7.0%) | 1 (0.9%) |
| 5 to 9 Years | 4 (3.5%) | 0 (0.0%) |
| 10 to 14 Years | 10 (8.7%) | 14 (12.3%) |
| 15 to 19 Years | 0 (0.0%) | 14 (12.3%) |
| 20 to 24 Years | 1 (0.9%) | 15 (13.2%) |
| 25 to 29 Years | 6 (5.2%) | 3 (2.6%) |
| 30 to 34 Years | 1 (0.9%) | 4 (3.5%) |
| 35 to 39 Years | 11 (9.6%) | 13 (11.4%) |
| 40 to 44 Years | 14 (12.2%) | 2 (1.8%) |
| 45 to 49 Years | 0 (0.0%) | 9 (7.9%) |
| 50 to 54 Years | 24 (20.9%) | 17 (14.9%) |
| 55 to 59 Years | 10 (8.7%) | 8 (7.0%) |
| 60 to 64 Years | 9 (7.8%) | 1 (0.9%) |
| 65 to 69 Years | 4 (3.5%) | 1 (0.9%) |
| 70 to 74 Years | 6 (5.2%) | 1 (0.9%) |
| 75 to 79 Years | 1 (0.9%) | 7 (6.1%) |
| 80 to 84 Years | 6 (5.2%) | 1 (0.9%) |
| 85 Years and over | 0 (0.0%) | 3 (2.6%) |
| Total | 115 (100.0%) | 114 (100.0%) |
Families and Households in Wheeler
Median Family Size in Wheeler
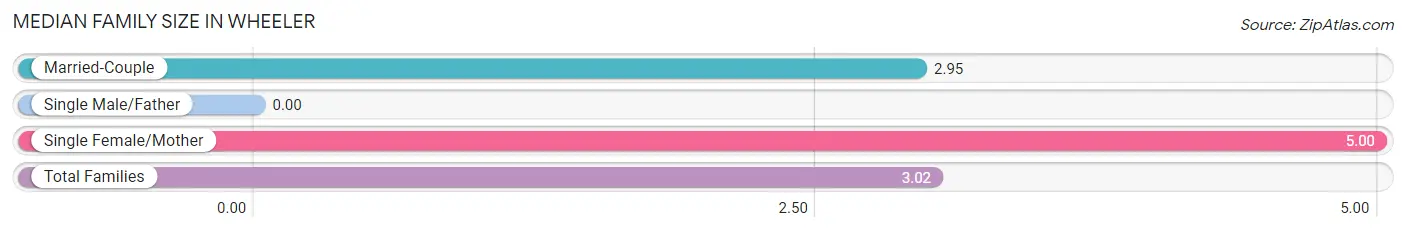
| Family Type | # Families | Family Size |
| Married-Couple | 55 (96.5%) | 2.95 |
| Single Male/Father | 0 (0.0%) | - |
| Single Female/Mother | 2 (3.5%) | 5.00 |
| Total Families | 57 (100.0%) | 3.02 |
Median Household Size in Wheeler
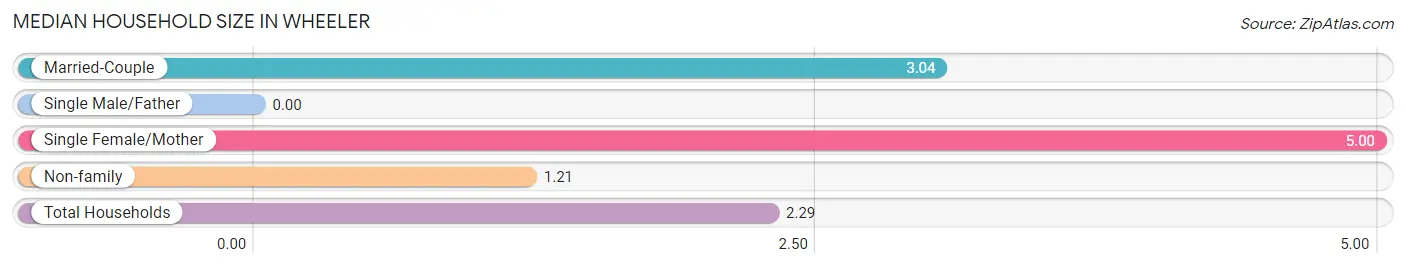
| Household Type | # Households | Household Size |
| Married-Couple | 55 (55.0%) | 3.04 |
| Single Male/Father | 0 (0.0%) | - |
| Single Female/Mother | 2 (2.0%) | 5.00 |
| Non-family | 43 (43.0%) | 1.21 |
| Total Households | 100 (100.0%) | 2.29 |
Household Size by Marriage Status in Wheeler
Out of a total of 100 households in Wheeler, 57 (57.0%) are family households, while 43 (43.0%) are nonfamily households. The most numerous type of family households are 2-person households, comprising 30, and the most common type of nonfamily households are 1-person households, comprising 36.
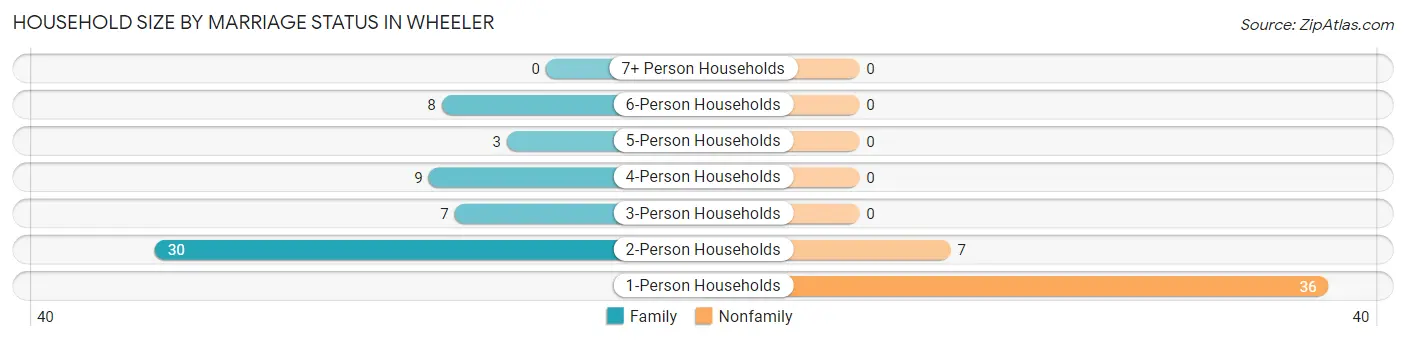
| Household Size | Family Households | Nonfamily Households |
| 1-Person Households | - | 36 (36.0%) |
| 2-Person Households | 30 (30.0%) | 7 (7.0%) |
| 3-Person Households | 7 (7.0%) | 0 (0.0%) |
| 4-Person Households | 9 (9.0%) | 0 (0.0%) |
| 5-Person Households | 3 (3.0%) | 0 (0.0%) |
| 6-Person Households | 8 (8.0%) | 0 (0.0%) |
| 7+ Person Households | 0 (0.0%) | 0 (0.0%) |
| Total | 57 (57.0%) | 43 (43.0%) |
Female Fertility in Wheeler
Fertility by Age in Wheeler
Average fertility rate in Wheeler is 68.0 births per 1,000 women. Women in the age bracket of 20 to 34 years have the highest fertility rate with 91.0 births per 1,000 women. Women in the age bracket of 35 to 50 years acount for 60.0% of all women with births.
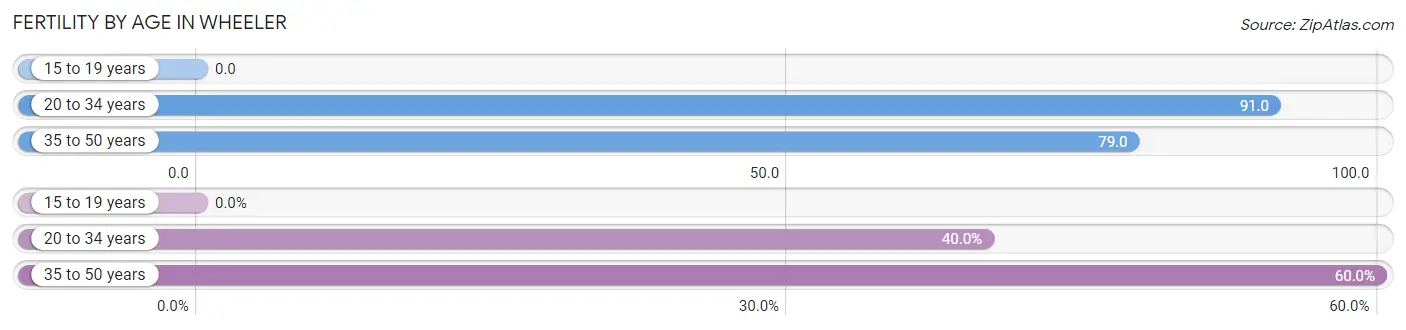
| Age Bracket | Women with Births | Births / 1,000 Women |
| 15 to 19 years | 0 (0.0%) | 0.0 |
| 20 to 34 years | 2 (40.0%) | 91.0 |
| 35 to 50 years | 3 (60.0%) | 79.0 |
| Total | 5 (100.0%) | 68.0 |
Fertility by Age by Marriage Status in Wheeler
60.0% of women with births (5) in Wheeler are married. The highest percentage of unmarried women with births falls into 20 to 34 years age bracket with 100.0% of them unmarried at the time of birth, while the lowest percentage of unmarried women with births belong to 35 to 50 years age bracket with 0.0% of them unmarried.
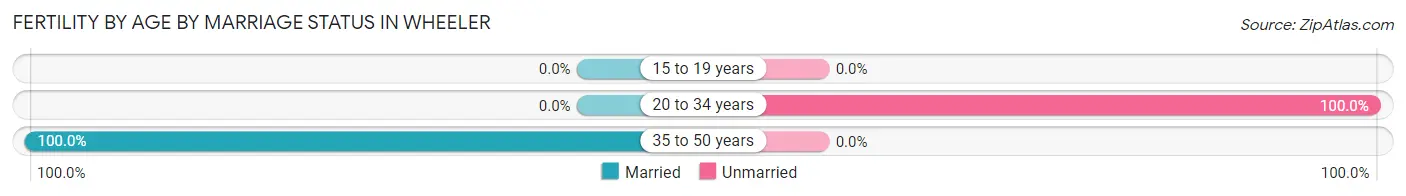
| Age Bracket | Married | Unmarried |
| 15 to 19 years | 0 (0.0%) | 0 (0.0%) |
| 20 to 34 years | 0 (0.0%) | 2 (100.0%) |
| 35 to 50 years | 3 (100.0%) | 0 (0.0%) |
| Total | 3 (60.0%) | 2 (40.0%) |
Fertility by Education in Wheeler
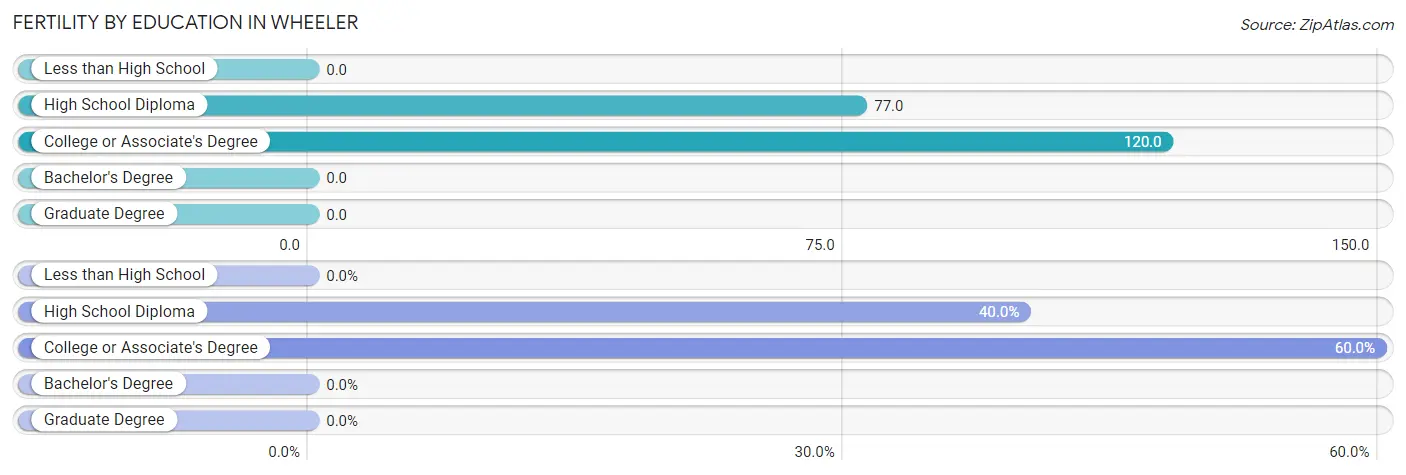
| Educational Attainment | Women with Births | Births / 1,000 Women |
| Less than High School | 0 (0.0%) | 0.0 |
| High School Diploma | 2 (40.0%) | 77.0 |
| College or Associate's Degree | 3 (60.0%) | 120.0 |
| Bachelor's Degree | 0 (0.0%) | 0.0 |
| Graduate Degree | 0 (0.0%) | 0.0 |
| Total | 5 (100.0%) | 68.0 |
Fertility by Education by Marriage Status in Wheeler
40.0% of women with births in Wheeler are unmarried. Women with the educational attainment of college or associate's degree are most likely to be married with 100.0% of them married at childbirth, while women with the educational attainment of high school diploma are least likely to be married with 100.0% of them unmarried at childbirth.
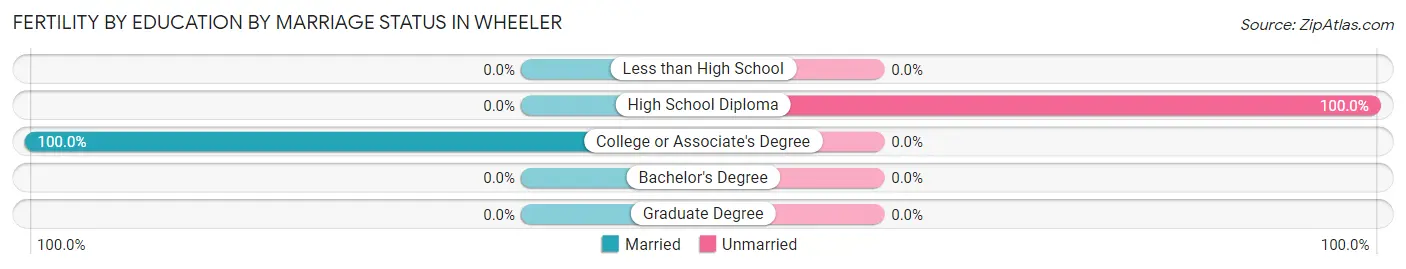
| Educational Attainment | Married | Unmarried |
| Less than High School | 0 (0.0%) | 0 (0.0%) |
| High School Diploma | 0 (0.0%) | 2 (100.0%) |
| College or Associate's Degree | 3 (100.0%) | 0 (0.0%) |
| Bachelor's Degree | 0 (0.0%) | 0 (0.0%) |
| Graduate Degree | 0 (0.0%) | 0 (0.0%) |
| Total | 3 (60.0%) | 2 (40.0%) |
Employment Characteristics in Wheeler
Employment by Class of Employer in Wheeler
Among the 123 employed individuals in Wheeler, private company employees (108 | 87.8%), self-employed (not incorporated) (12 | 9.8%), and state government employees (2 | 1.6%) make up the most common classes of employment.
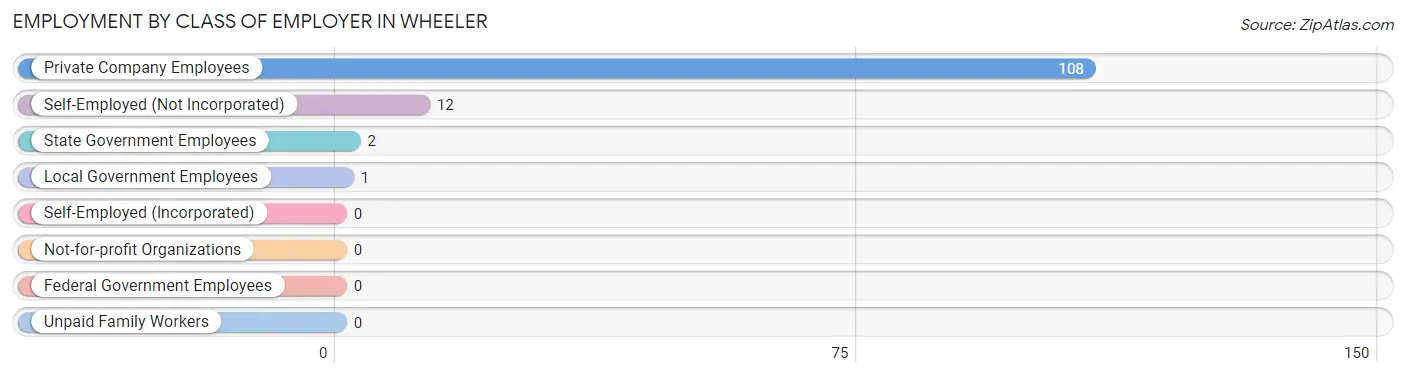
| Employer Class | # Employees | % Employees |
| Private Company Employees | 108 | 87.8% |
| Self-Employed (Incorporated) | 0 | 0.0% |
| Self-Employed (Not Incorporated) | 12 | 9.8% |
| Not-for-profit Organizations | 0 | 0.0% |
| Local Government Employees | 1 | 0.8% |
| State Government Employees | 2 | 1.6% |
| Federal Government Employees | 0 | 0.0% |
| Unpaid Family Workers | 0 | 0.0% |
| Total | 123 | 100.0% |
Employment Status by Age in Wheeler
According to the labor force statistics for Wheeler, out of the total population over 16 years of age (190), 66.8% or 127 individuals are in the labor force, with 1.6% or 2 of them unemployed. The age group with the highest labor force participation rate is 20 to 24 years, with 100.0% or 16 individuals in the labor force. Within the labor force, the 55 to 59 years age range has the highest percentage of unemployed individuals, with 18.2% or 2 of them being unemployed.
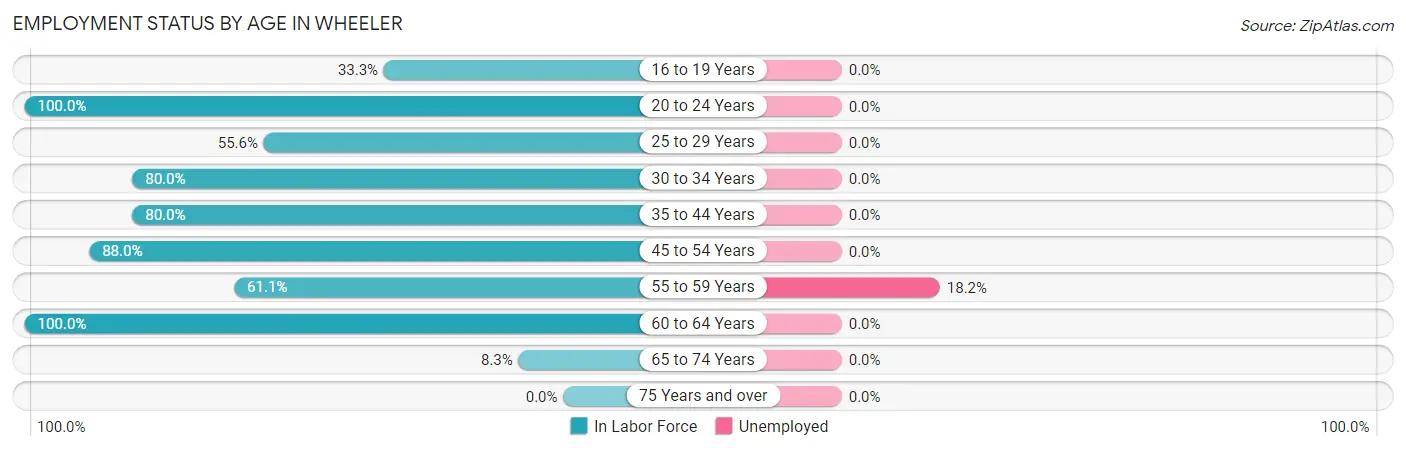
| Age Bracket | In Labor Force | Unemployed |
| 16 to 19 Years | 4 (33.3%) | 0 (0.0%) |
| 20 to 24 Years | 16 (100.0%) | 0 (0.0%) |
| 25 to 29 Years | 5 (55.6%) | 0 (0.0%) |
| 30 to 34 Years | 4 (80.0%) | 0 (0.0%) |
| 35 to 44 Years | 32 (80.0%) | 0 (0.0%) |
| 45 to 54 Years | 44 (88.0%) | 0 (0.0%) |
| 55 to 59 Years | 11 (61.1%) | 2 (18.2%) |
| 60 to 64 Years | 10 (100.0%) | 0 (0.0%) |
| 65 to 74 Years | 1 (8.3%) | 0 (0.0%) |
| 75 Years and over | 0 (0.0%) | 0 (0.0%) |
| Total | 127 (66.8%) | 2 (1.6%) |
Employment Status by Educational Attainment in Wheeler
According to labor force statistics for Wheeler, 80.3% of individuals (106) out of the total population between 25 and 64 years of age (132) are in the labor force, with 1.9% or 2 of them being unemployed. The group with the highest labor force participation rate are those with the educational attainment of high school diploma, with 88.0% or 44 individuals in the labor force. Within the labor force, individuals with college / associate degree education have the highest percentage of unemployment, with 4.7% or 2 of them being unemployed.
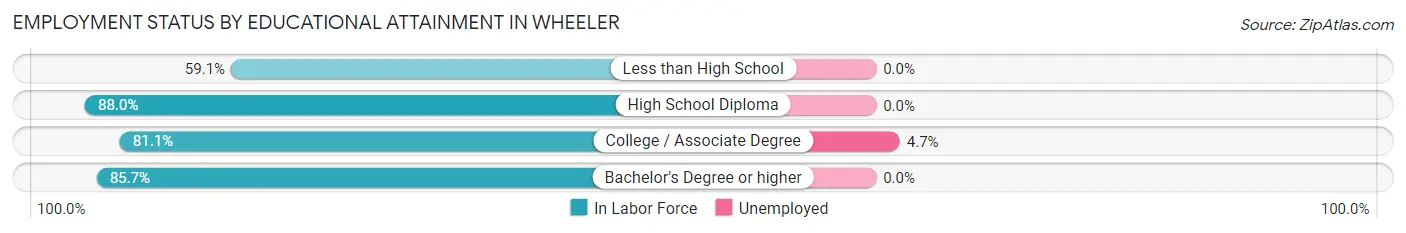
| Educational Attainment | In Labor Force | Unemployed |
| Less than High School | 13 (59.1%) | 0 (0.0%) |
| High School Diploma | 44 (88.0%) | 0 (0.0%) |
| College / Associate Degree | 43 (81.1%) | 2 (4.7%) |
| Bachelor's Degree or higher | 6 (85.7%) | 0 (0.0%) |
| Total | 106 (80.3%) | 3 (1.9%) |
Employment Occupations by Sex in Wheeler
Management, Business, Science and Arts Occupations
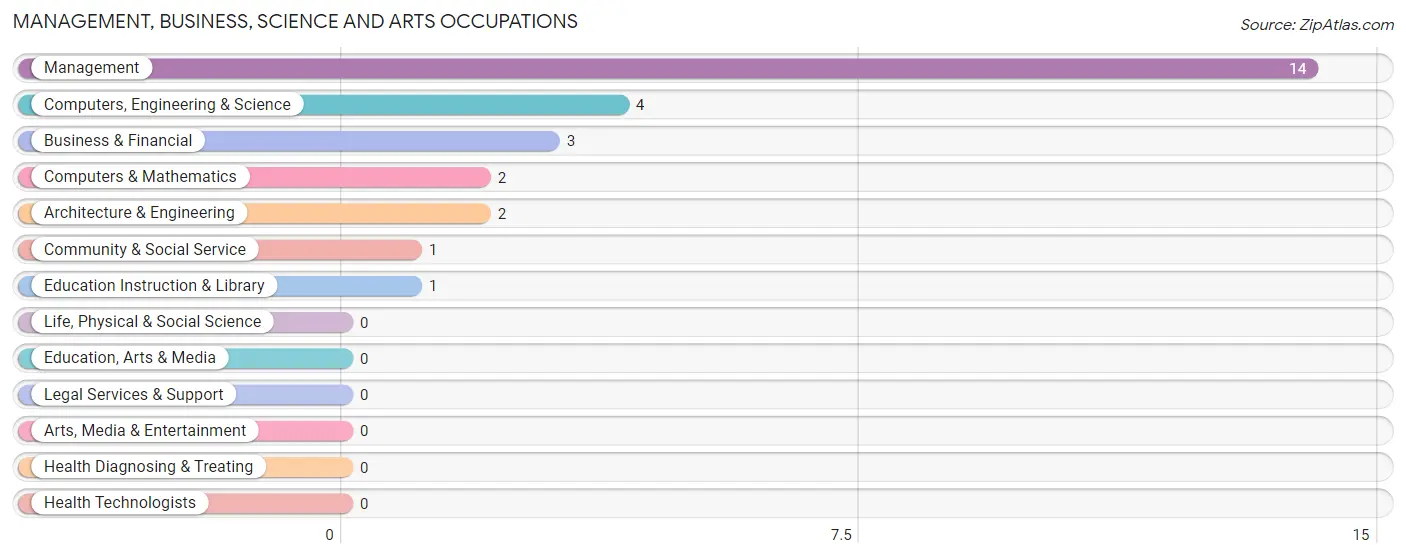
The most common Management, Business, Science and Arts occupations in Wheeler are Management (14 | 11.2%), Computers, Engineering & Science (4 | 3.2%), Business & Financial (3 | 2.4%), Computers & Mathematics (2 | 1.6%), and Architecture & Engineering (2 | 1.6%).
Management, Business, Science and Arts Occupations by Sex
Within the Management, Business, Science and Arts occupations in Wheeler, the most male-oriented occupations are Computers, Engineering & Science (100.0%), Computers & Mathematics (100.0%), and Architecture & Engineering (100.0%), while the most female-oriented occupations are Community & Social Service (100.0%), Education Instruction & Library (100.0%), and Management (42.9%).
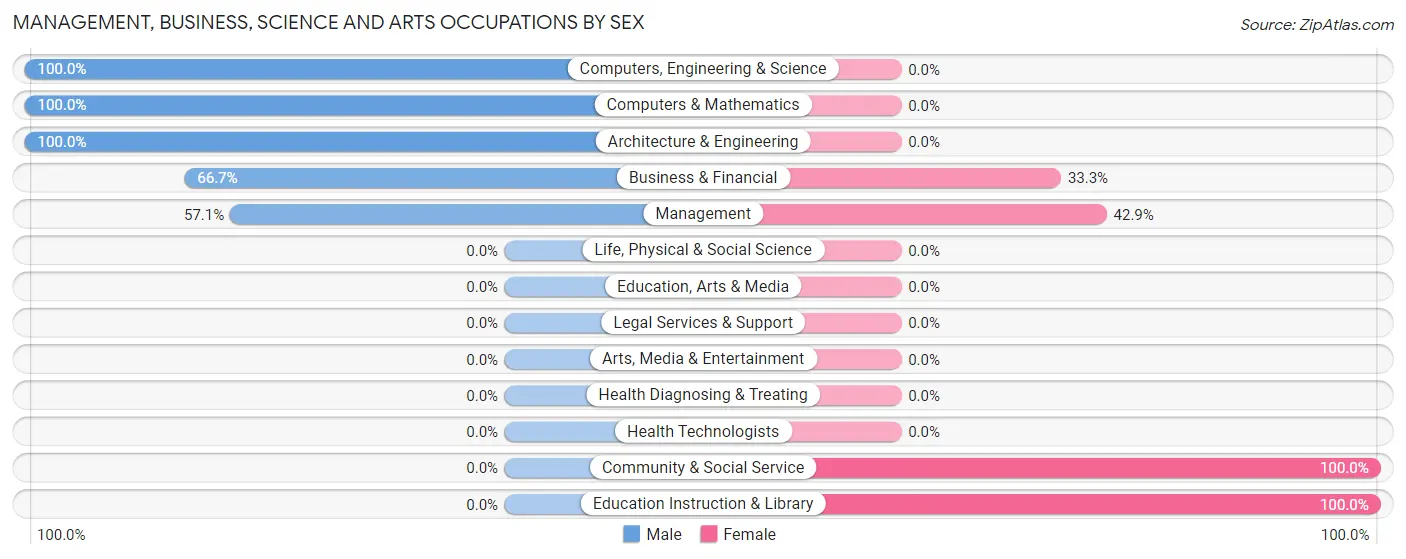
| Occupation | Male | Female |
| Management | 8 (57.1%) | 6 (42.9%) |
| Business & Financial | 2 (66.7%) | 1 (33.3%) |
| Computers, Engineering & Science | 4 (100.0%) | 0 (0.0%) |
| Computers & Mathematics | 2 (100.0%) | 0 (0.0%) |
| Architecture & Engineering | 2 (100.0%) | 0 (0.0%) |
| Life, Physical & Social Science | 0 (0.0%) | 0 (0.0%) |
| Community & Social Service | 0 (0.0%) | 1 (100.0%) |
| Education, Arts & Media | 0 (0.0%) | 0 (0.0%) |
| Legal Services & Support | 0 (0.0%) | 0 (0.0%) |
| Education Instruction & Library | 0 (0.0%) | 1 (100.0%) |
| Arts, Media & Entertainment | 0 (0.0%) | 0 (0.0%) |
| Health Diagnosing & Treating | 0 (0.0%) | 0 (0.0%) |
| Health Technologists | 0 (0.0%) | 0 (0.0%) |
| Total (Category) | 14 (63.6%) | 8 (36.4%) |
| Total (Overall) | 67 (53.6%) | 58 (46.4%) |
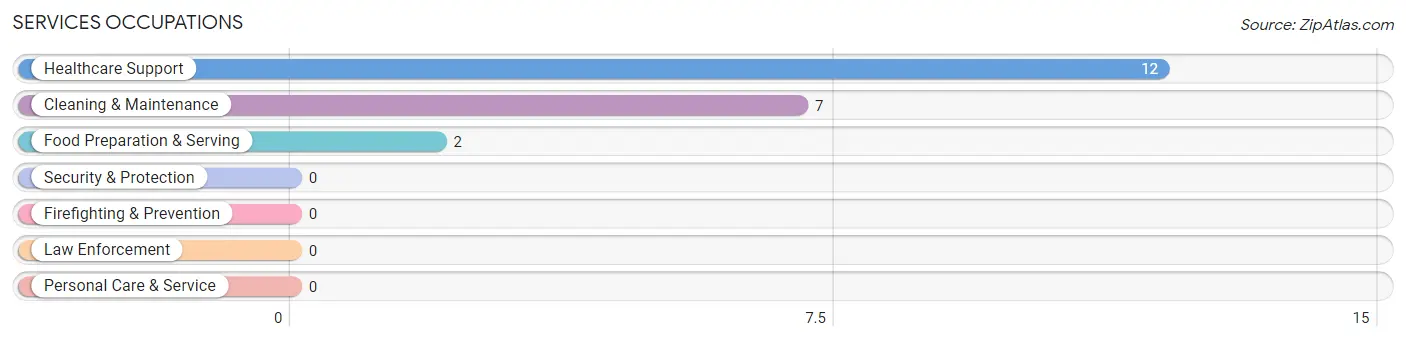
Services Occupations
The most common Services occupations in Wheeler are Healthcare Support (12 | 9.6%), Cleaning & Maintenance (7 | 5.6%), and Food Preparation & Serving (2 | 1.6%).
Services Occupations by Sex
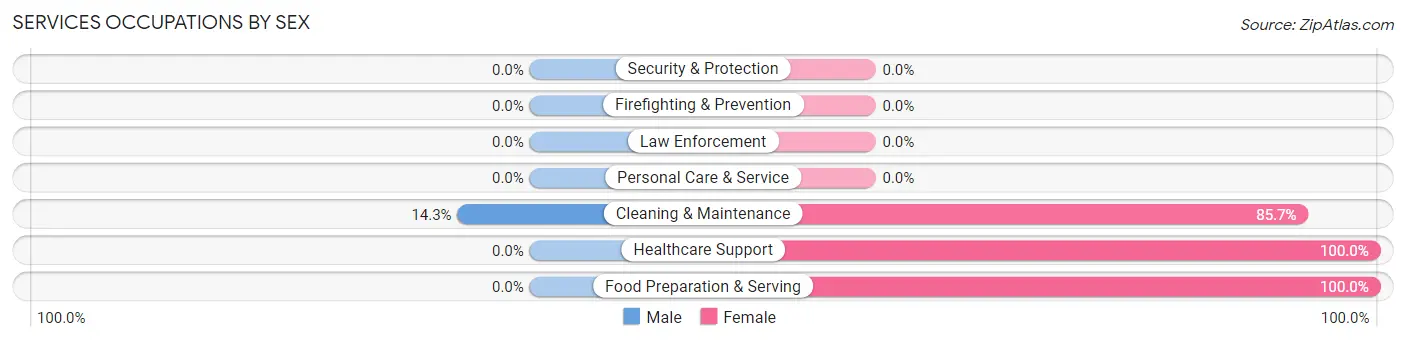
| Occupation | Male | Female |
| Healthcare Support | 0 (0.0%) | 12 (100.0%) |
| Security & Protection | 0 (0.0%) | 0 (0.0%) |
| Firefighting & Prevention | 0 (0.0%) | 0 (0.0%) |
| Law Enforcement | 0 (0.0%) | 0 (0.0%) |
| Food Preparation & Serving | 0 (0.0%) | 2 (100.0%) |
| Cleaning & Maintenance | 1 (14.3%) | 6 (85.7%) |
| Personal Care & Service | 0 (0.0%) | 0 (0.0%) |
| Total (Category) | 1 (4.8%) | 20 (95.2%) |
| Total (Overall) | 67 (53.6%) | 58 (46.4%) |
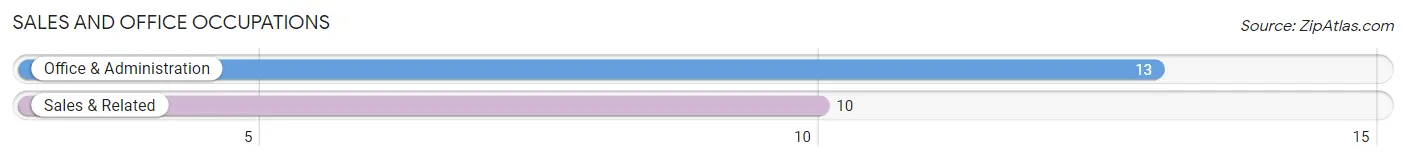
Sales and Office Occupations
The most common Sales and Office occupations in Wheeler are Office & Administration (13 | 10.4%), and Sales & Related (10 | 8.0%).
Sales and Office Occupations by Sex
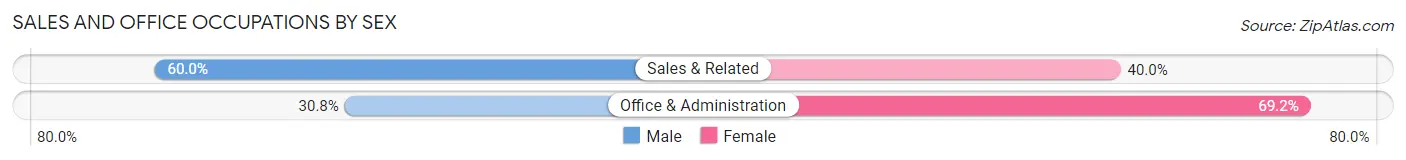
| Occupation | Male | Female |
| Sales & Related | 6 (60.0%) | 4 (40.0%) |
| Office & Administration | 4 (30.8%) | 9 (69.2%) |
| Total (Category) | 10 (43.5%) | 13 (56.5%) |
| Total (Overall) | 67 (53.6%) | 58 (46.4%) |
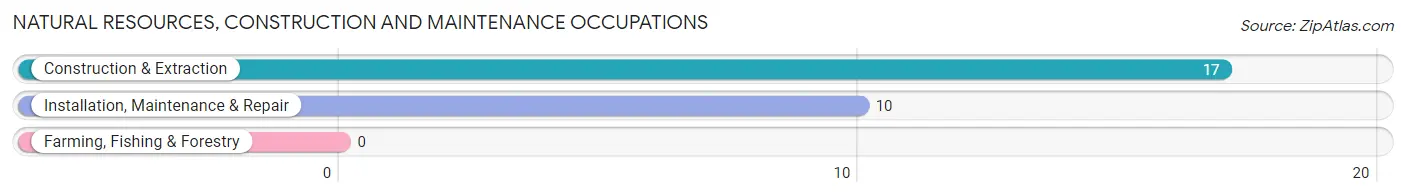
Natural Resources, Construction and Maintenance Occupations
The most common Natural Resources, Construction and Maintenance occupations in Wheeler are Construction & Extraction (17 | 13.6%), and Installation, Maintenance & Repair (10 | 8.0%).
Natural Resources, Construction and Maintenance Occupations by Sex
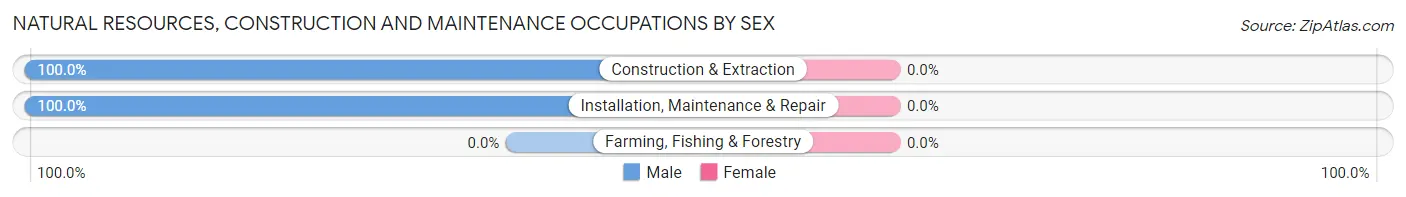
| Occupation | Male | Female |
| Farming, Fishing & Forestry | 0 (0.0%) | 0 (0.0%) |
| Construction & Extraction | 17 (100.0%) | 0 (0.0%) |
| Installation, Maintenance & Repair | 10 (100.0%) | 0 (0.0%) |
| Total (Category) | 27 (100.0%) | 0 (0.0%) |
| Total (Overall) | 67 (53.6%) | 58 (46.4%) |
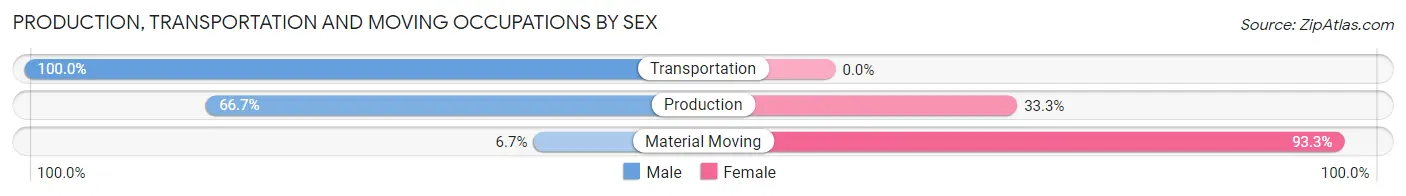
Production, Transportation and Moving Occupations
The most common Production, Transportation and Moving occupations in Wheeler are Material Moving (15 | 12.0%), Production (9 | 7.2%), and Transportation (8 | 6.4%).
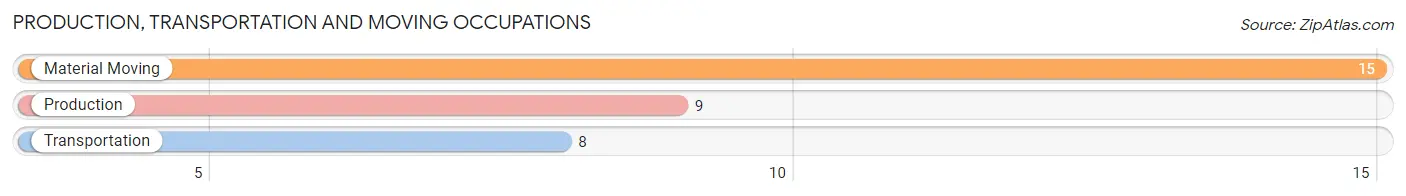
Production, Transportation and Moving Occupations by Sex
| Occupation | Male | Female |
| Production | 6 (66.7%) | 3 (33.3%) |
| Transportation | 8 (100.0%) | 0 (0.0%) |
| Material Moving | 1 (6.7%) | 14 (93.3%) |
| Total (Category) | 15 (46.9%) | 17 (53.1%) |
| Total (Overall) | 67 (53.6%) | 58 (46.4%) |
Employment Industries by Sex in Wheeler
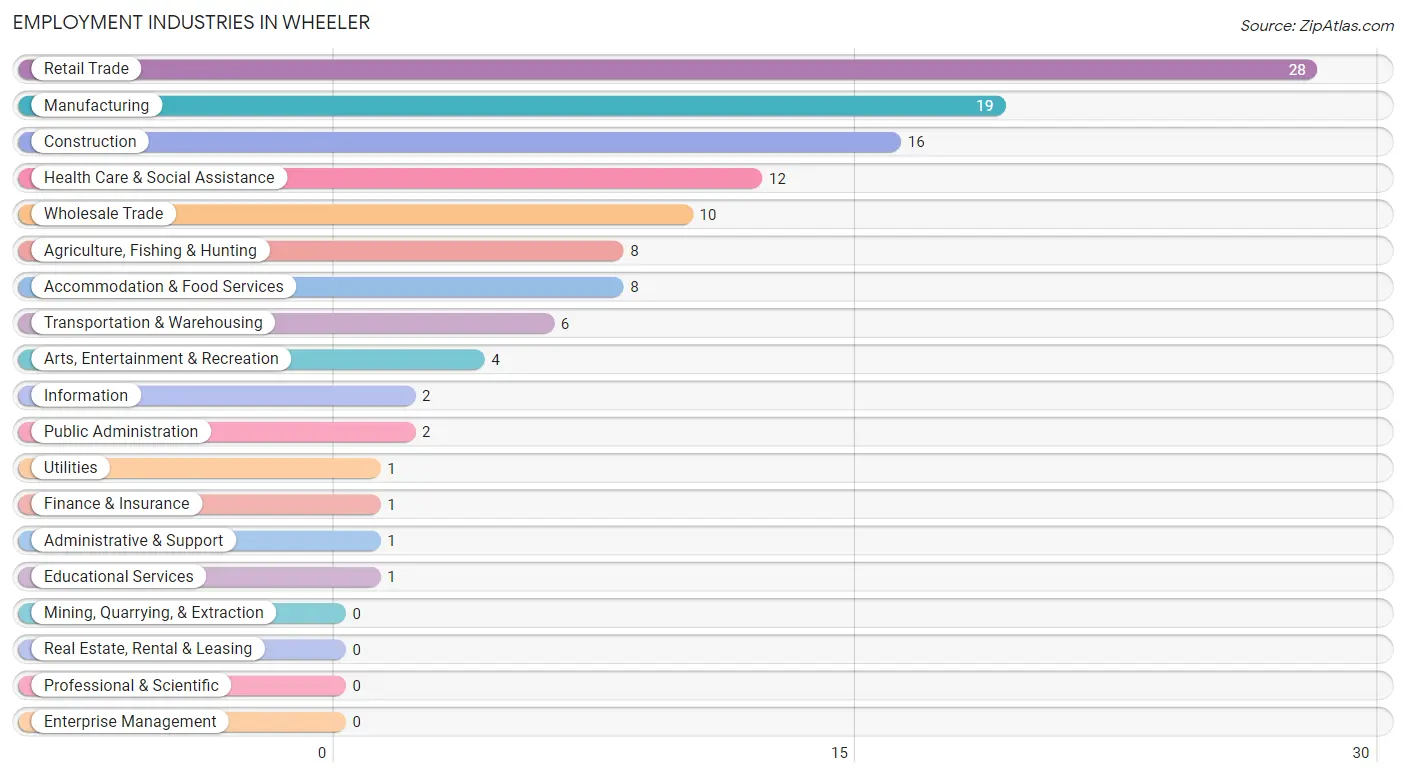
Employment Industries in Wheeler
The major employment industries in Wheeler include Retail Trade (28 | 22.4%), Manufacturing (19 | 15.2%), Construction (16 | 12.8%), Health Care & Social Assistance (12 | 9.6%), and Wholesale Trade (10 | 8.0%).
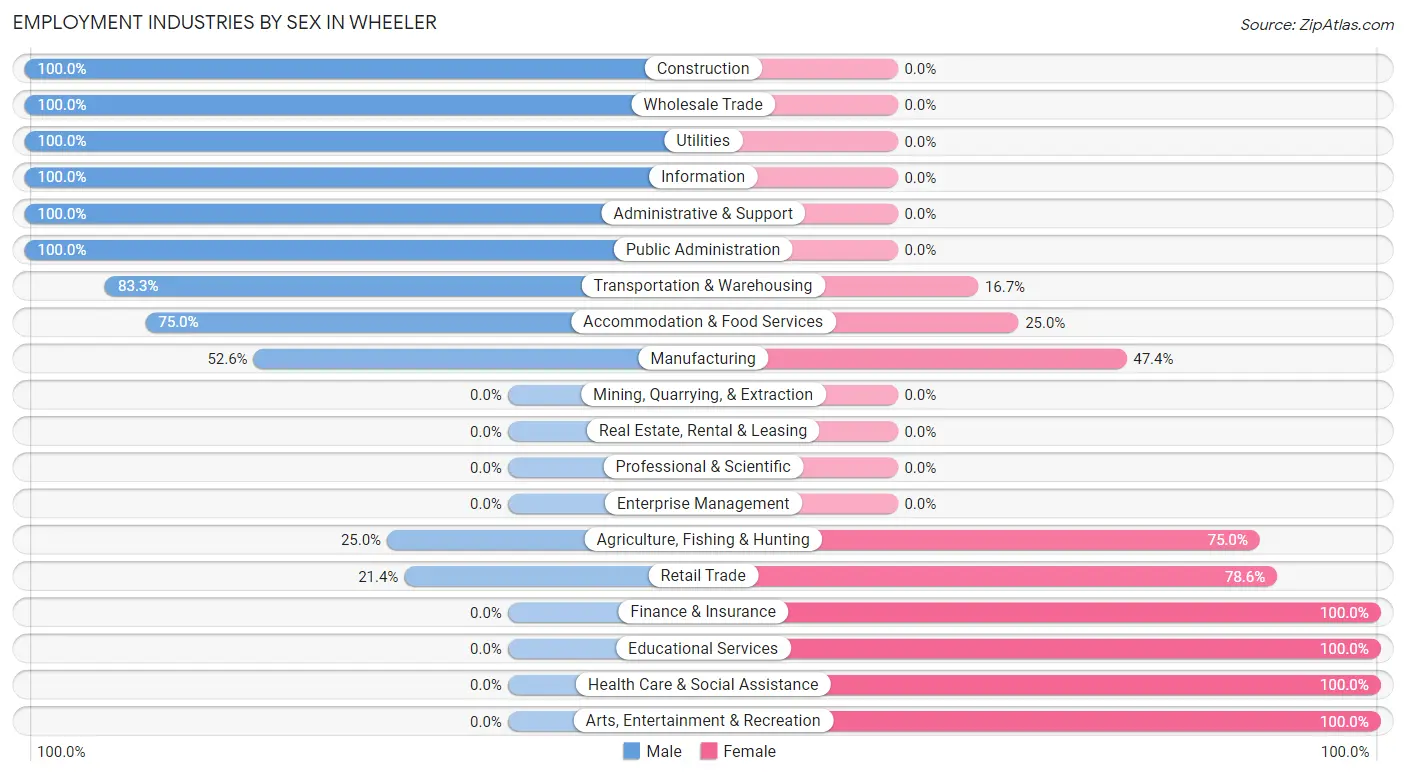
Employment Industries by Sex in Wheeler
The Wheeler industries that see more men than women are Construction (100.0%), Wholesale Trade (100.0%), and Utilities (100.0%), whereas the industries that tend to have a higher number of women are Finance & Insurance (100.0%), Educational Services (100.0%), and Health Care & Social Assistance (100.0%).
| Industry | Male | Female |
| Agriculture, Fishing & Hunting | 2 (25.0%) | 6 (75.0%) |
| Mining, Quarrying, & Extraction | 0 (0.0%) | 0 (0.0%) |
| Construction | 16 (100.0%) | 0 (0.0%) |
| Manufacturing | 10 (52.6%) | 9 (47.4%) |
| Wholesale Trade | 10 (100.0%) | 0 (0.0%) |
| Retail Trade | 6 (21.4%) | 22 (78.6%) |
| Transportation & Warehousing | 5 (83.3%) | 1 (16.7%) |
| Utilities | 1 (100.0%) | 0 (0.0%) |
| Information | 2 (100.0%) | 0 (0.0%) |
| Finance & Insurance | 0 (0.0%) | 1 (100.0%) |
| Real Estate, Rental & Leasing | 0 (0.0%) | 0 (0.0%) |
| Professional & Scientific | 0 (0.0%) | 0 (0.0%) |
| Enterprise Management | 0 (0.0%) | 0 (0.0%) |
| Administrative & Support | 1 (100.0%) | 0 (0.0%) |
| Educational Services | 0 (0.0%) | 1 (100.0%) |
| Health Care & Social Assistance | 0 (0.0%) | 12 (100.0%) |
| Arts, Entertainment & Recreation | 0 (0.0%) | 4 (100.0%) |
| Accommodation & Food Services | 6 (75.0%) | 2 (25.0%) |
| Public Administration | 2 (100.0%) | 0 (0.0%) |
| Total | 67 (53.6%) | 58 (46.4%) |
Education in Wheeler
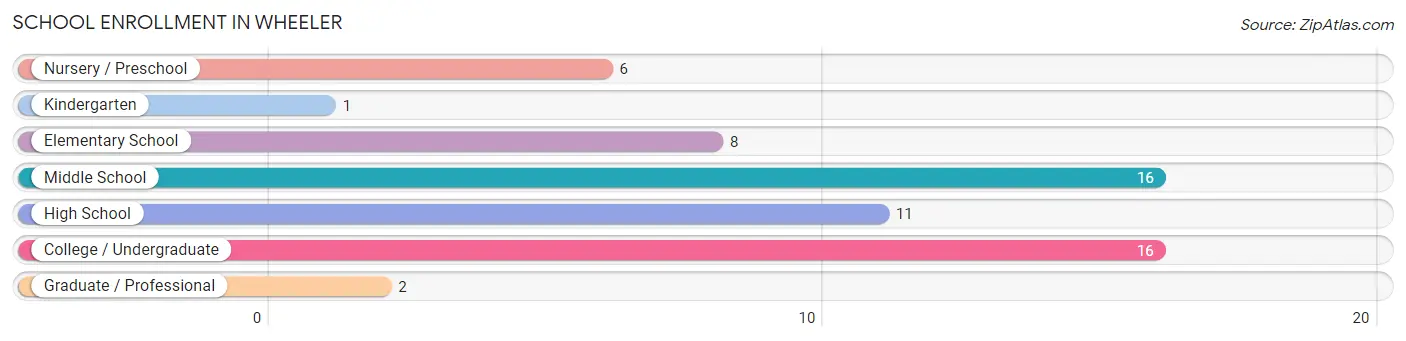
School Enrollment in Wheeler
The most common levels of schooling among the 60 students in Wheeler are middle school (16 | 26.7%), college / undergraduate (16 | 26.7%), and high school (11 | 18.3%).
| School Level | # Students | % Students |
| Nursery / Preschool | 6 | 10.0% |
| Kindergarten | 1 | 1.7% |
| Elementary School | 8 | 13.3% |
| Middle School | 16 | 26.7% |
| High School | 11 | 18.3% |
| College / Undergraduate | 16 | 26.7% |
| Graduate / Professional | 2 | 3.3% |
| Total | 60 | 100.0% |
School Enrollment by Age by Funding Source in Wheeler
Out of a total of 60 students who are enrolled in schools in Wheeler, 7 (11.7%) attend a private institution, while the remaining 53 (88.3%) are enrolled in public schools. The age group of 15 to 17 year olds has the highest likelihood of being enrolled in private schools, with 6 (60.0% in the age bracket) enrolled. Conversely, the age group of 3 to 4 year olds has the lowest likelihood of being enrolled in a private school, with 4 (100.0% in the age bracket) attending a public institution.
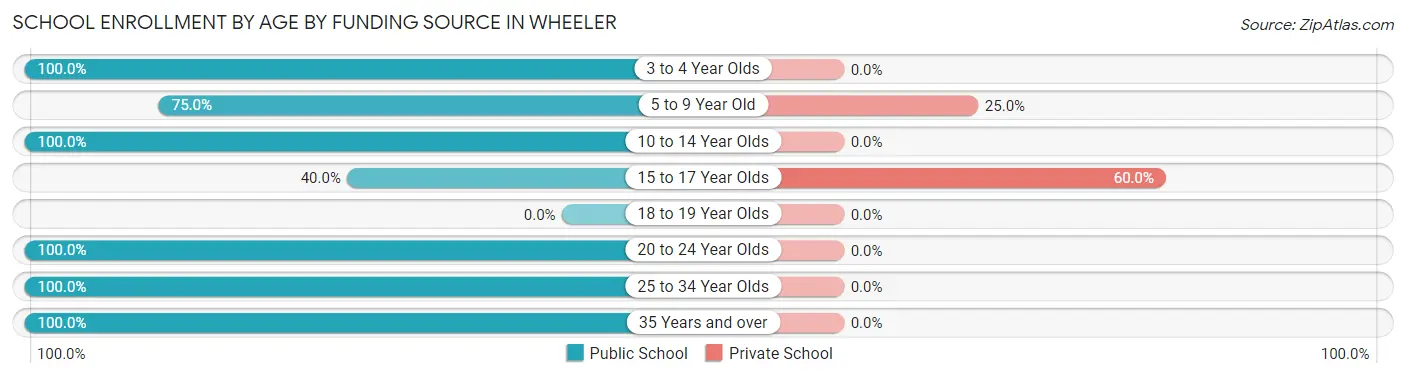
| Age Bracket | Public School | Private School |
| 3 to 4 Year Olds | 4 (100.0%) | 0 (0.0%) |
| 5 to 9 Year Old | 3 (75.0%) | 1 (25.0%) |
| 10 to 14 Year Olds | 24 (100.0%) | 0 (0.0%) |
| 15 to 17 Year Olds | 4 (40.0%) | 6 (60.0%) |
| 18 to 19 Year Olds | 0 (0.0%) | 0 (0.0%) |
| 20 to 24 Year Olds | 9 (100.0%) | 0 (0.0%) |
| 25 to 34 Year Olds | 4 (100.0%) | 0 (0.0%) |
| 35 Years and over | 5 (100.0%) | 0 (0.0%) |
| Total | 53 (88.3%) | 7 (11.7%) |
Educational Attainment by Field of Study in Wheeler
Science & technology (5 | 38.5%), education (4 | 30.8%), literature & languages (3 | 23.1%), and business (1 | 7.7%) are the most common fields of study among 13 individuals in Wheeler who have obtained a bachelor's degree or higher.
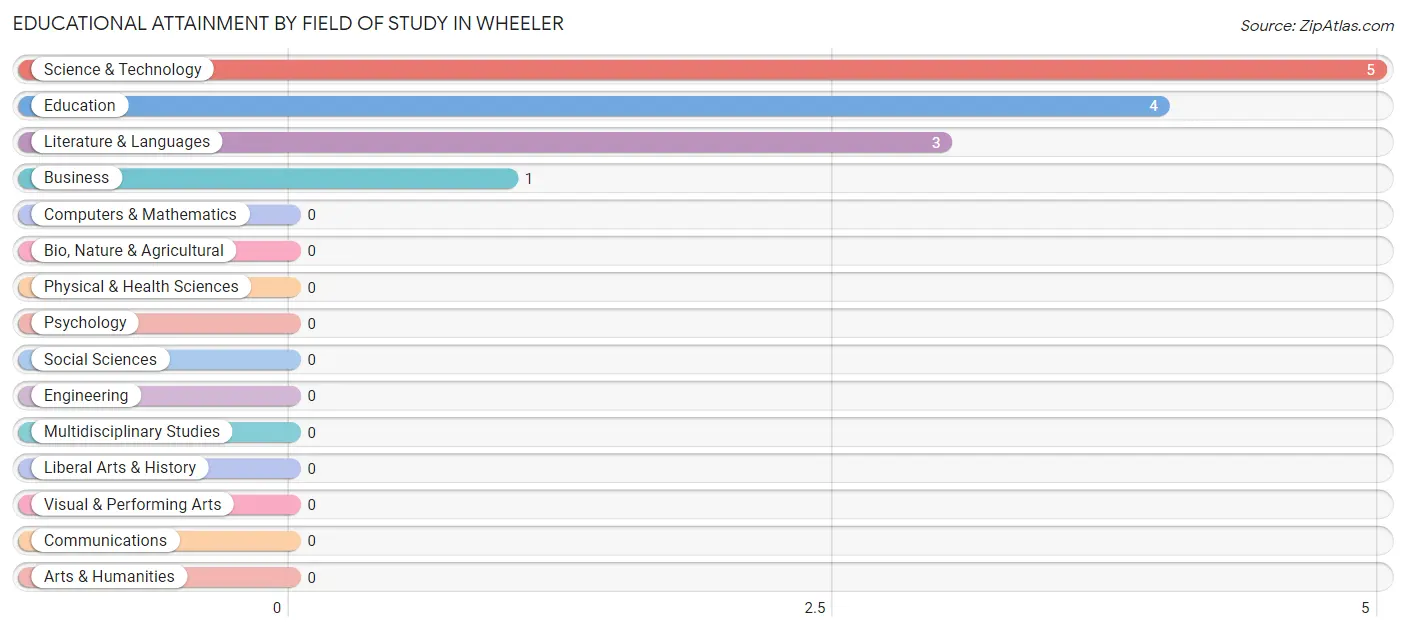
| Field of Study | # Graduates | % Graduates |
| Computers & Mathematics | 0 | 0.0% |
| Bio, Nature & Agricultural | 0 | 0.0% |
| Physical & Health Sciences | 0 | 0.0% |
| Psychology | 0 | 0.0% |
| Social Sciences | 0 | 0.0% |
| Engineering | 0 | 0.0% |
| Multidisciplinary Studies | 0 | 0.0% |
| Science & Technology | 5 | 38.5% |
| Business | 1 | 7.7% |
| Education | 4 | 30.8% |
| Literature & Languages | 3 | 23.1% |
| Liberal Arts & History | 0 | 0.0% |
| Visual & Performing Arts | 0 | 0.0% |
| Communications | 0 | 0.0% |
| Arts & Humanities | 0 | 0.0% |
| Total | 13 | 100.0% |
Transportation & Commute in Wheeler
Vehicle Availability by Sex in Wheeler
The most prevalent vehicle ownership categories in Wheeler are males with 2 vehicles (33, accounting for 50.8%) and females with 2 vehicles (15, making up 56.9%).
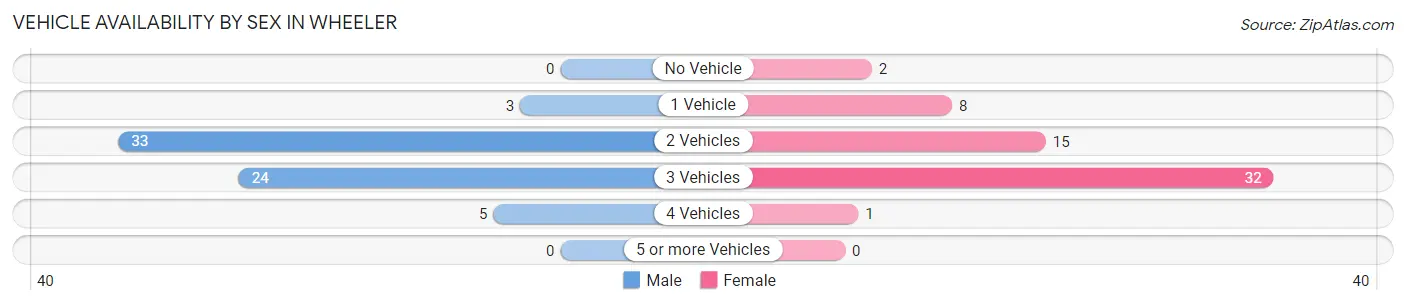
| Vehicles Available | Male | Female |
| No Vehicle | 0 (0.0%) | 2 (3.5%) |
| 1 Vehicle | 3 (4.6%) | 8 (13.8%) |
| 2 Vehicles | 33 (50.8%) | 15 (25.9%) |
| 3 Vehicles | 24 (36.9%) | 32 (55.2%) |
| 4 Vehicles | 5 (7.7%) | 1 (1.7%) |
| 5 or more Vehicles | 0 (0.0%) | 0 (0.0%) |
| Total | 65 (100.0%) | 58 (100.0%) |
Commute Time in Wheeler
The most frequently occuring commute durations in Wheeler are 10 to 14 minutes (23 commuters, 19.3%), 20 to 24 minutes (22 commuters, 18.5%), and 60 to 89 minutes (20 commuters, 16.8%).
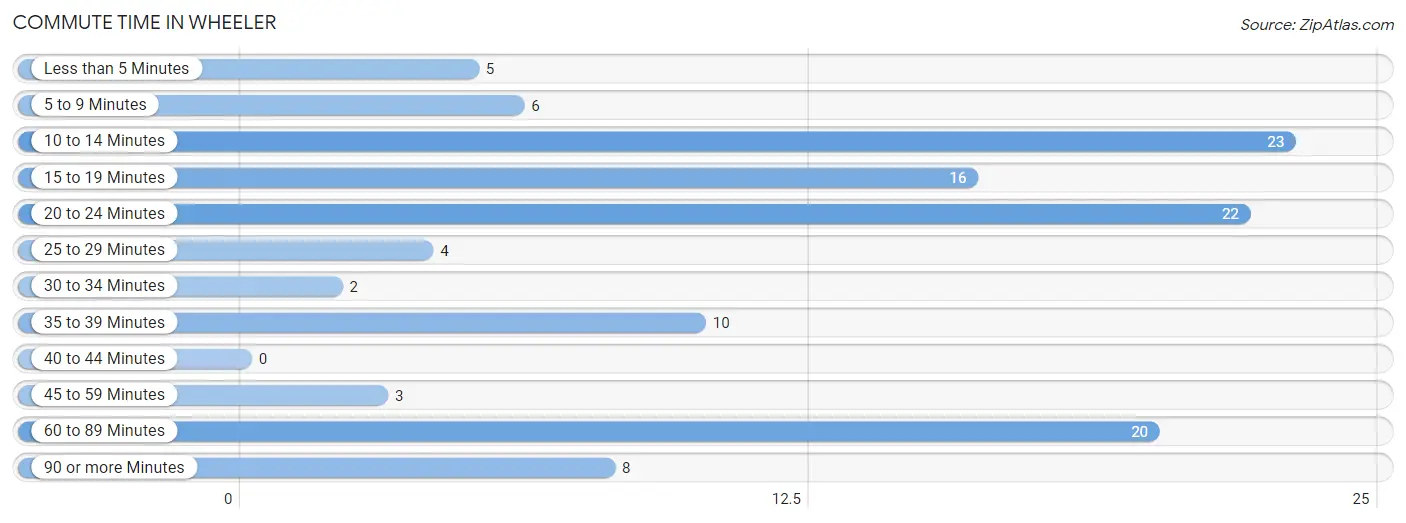
| Commute Time | # Commuters | % Commuters |
| Less than 5 Minutes | 5 | 4.2% |
| 5 to 9 Minutes | 6 | 5.0% |
| 10 to 14 Minutes | 23 | 19.3% |
| 15 to 19 Minutes | 16 | 13.5% |
| 20 to 24 Minutes | 22 | 18.5% |
| 25 to 29 Minutes | 4 | 3.4% |
| 30 to 34 Minutes | 2 | 1.7% |
| 35 to 39 Minutes | 10 | 8.4% |
| 40 to 44 Minutes | 0 | 0.0% |
| 45 to 59 Minutes | 3 | 2.5% |
| 60 to 89 Minutes | 20 | 16.8% |
| 90 or more Minutes | 8 | 6.7% |
Commute Time by Sex in Wheeler
The most common commute times in Wheeler are 15 to 19 minutes (14 commuters, 23.0%) for males and 10 to 14 minutes (16 commuters, 27.6%) for females.
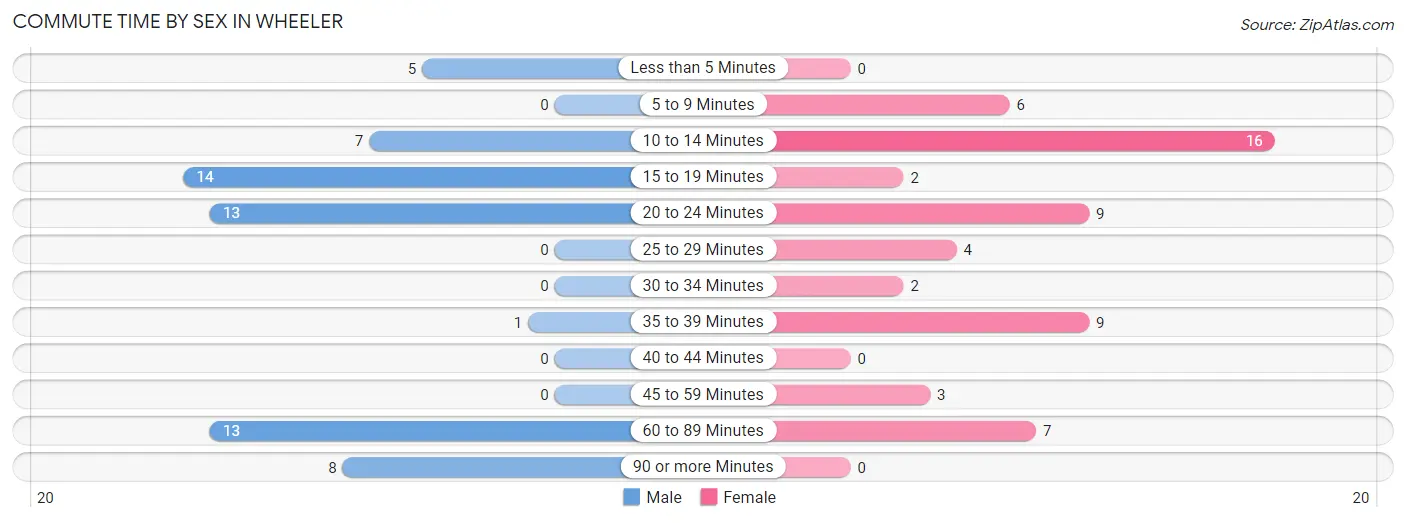
| Commute Time | Male | Female |
| Less than 5 Minutes | 5 (8.2%) | 0 (0.0%) |
| 5 to 9 Minutes | 0 (0.0%) | 6 (10.3%) |
| 10 to 14 Minutes | 7 (11.5%) | 16 (27.6%) |
| 15 to 19 Minutes | 14 (23.0%) | 2 (3.5%) |
| 20 to 24 Minutes | 13 (21.3%) | 9 (15.5%) |
| 25 to 29 Minutes | 0 (0.0%) | 4 (6.9%) |
| 30 to 34 Minutes | 0 (0.0%) | 2 (3.5%) |
| 35 to 39 Minutes | 1 (1.6%) | 9 (15.5%) |
| 40 to 44 Minutes | 0 (0.0%) | 0 (0.0%) |
| 45 to 59 Minutes | 0 (0.0%) | 3 (5.2%) |
| 60 to 89 Minutes | 13 (21.3%) | 7 (12.1%) |
| 90 or more Minutes | 8 (13.1%) | 0 (0.0%) |
Time of Departure to Work by Sex in Wheeler
The most frequent times of departure to work in Wheeler are 5:00 AM to 5:29 AM (12, 19.7%) for males and 12:00 AM to 4:59 AM (16, 27.6%) for females.
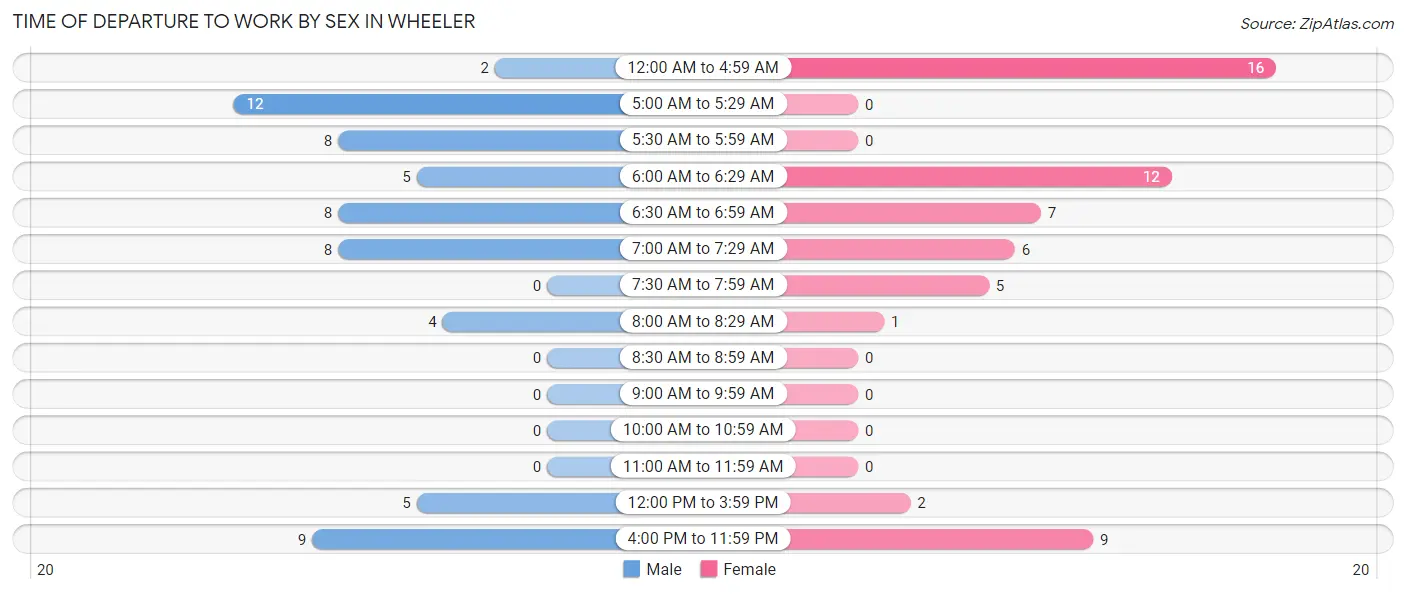
| Time of Departure | Male | Female |
| 12:00 AM to 4:59 AM | 2 (3.3%) | 16 (27.6%) |
| 5:00 AM to 5:29 AM | 12 (19.7%) | 0 (0.0%) |
| 5:30 AM to 5:59 AM | 8 (13.1%) | 0 (0.0%) |
| 6:00 AM to 6:29 AM | 5 (8.2%) | 12 (20.7%) |
| 6:30 AM to 6:59 AM | 8 (13.1%) | 7 (12.1%) |
| 7:00 AM to 7:29 AM | 8 (13.1%) | 6 (10.3%) |
| 7:30 AM to 7:59 AM | 0 (0.0%) | 5 (8.6%) |
| 8:00 AM to 8:29 AM | 4 (6.6%) | 1 (1.7%) |
| 8:30 AM to 8:59 AM | 0 (0.0%) | 0 (0.0%) |
| 9:00 AM to 9:59 AM | 0 (0.0%) | 0 (0.0%) |
| 10:00 AM to 10:59 AM | 0 (0.0%) | 0 (0.0%) |
| 11:00 AM to 11:59 AM | 0 (0.0%) | 0 (0.0%) |
| 12:00 PM to 3:59 PM | 5 (8.2%) | 2 (3.5%) |
| 4:00 PM to 11:59 PM | 9 (14.7%) | 9 (15.5%) |
| Total | 61 (100.0%) | 58 (100.0%) |
Housing Occupancy in Wheeler
Occupancy by Ownership in Wheeler
Of the total 100 dwellings in Wheeler, owner-occupied units account for 72 (72.0%), while renter-occupied units make up 28 (28.0%).
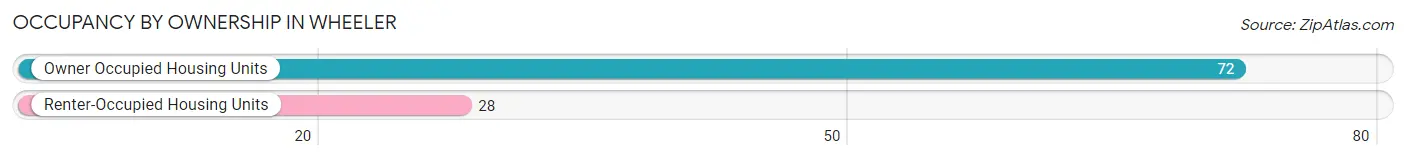
| Occupancy | # Housing Units | % Housing Units |
| Owner Occupied Housing Units | 72 | 72.0% |
| Renter-Occupied Housing Units | 28 | 28.0% |
| Total Occupied Housing Units | 100 | 100.0% |
Occupancy by Household Size in Wheeler
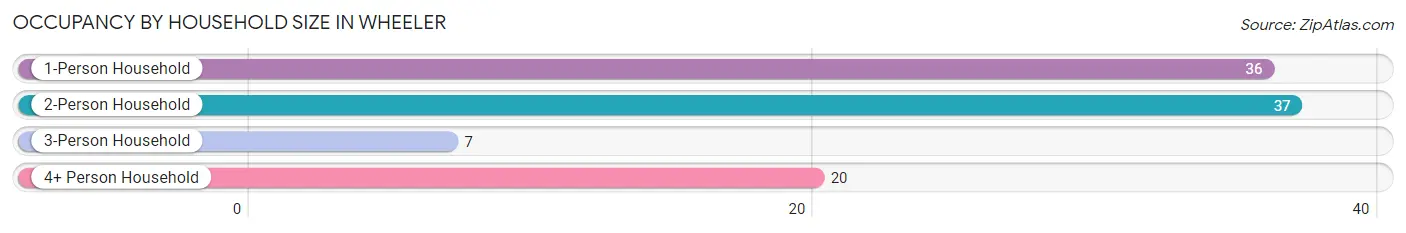
| Household Size | # Housing Units | % Housing Units |
| 1-Person Household | 36 | 36.0% |
| 2-Person Household | 37 | 37.0% |
| 3-Person Household | 7 | 7.0% |
| 4+ Person Household | 20 | 20.0% |
| Total Housing Units | 100 | 100.0% |
Occupancy by Ownership by Household Size in Wheeler
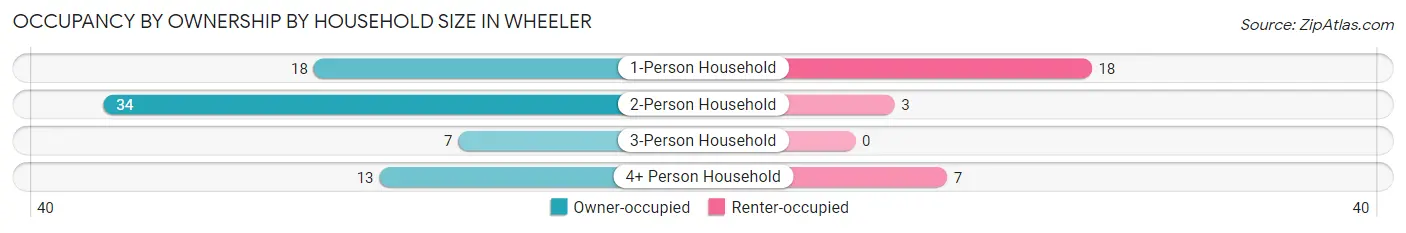
| Household Size | Owner-occupied | Renter-occupied |
| 1-Person Household | 18 (50.0%) | 18 (50.0%) |
| 2-Person Household | 34 (91.9%) | 3 (8.1%) |
| 3-Person Household | 7 (100.0%) | 0 (0.0%) |
| 4+ Person Household | 13 (65.0%) | 7 (35.0%) |
| Total Housing Units | 72 (72.0%) | 28 (28.0%) |
Occupancy by Educational Attainment in Wheeler
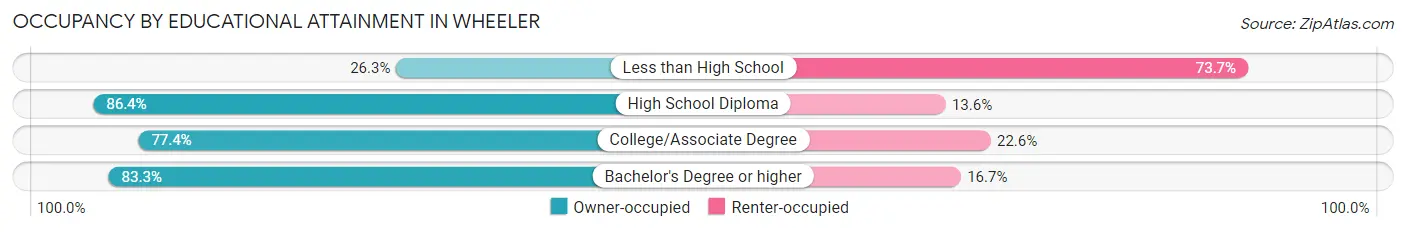
| Household Size | Owner-occupied | Renter-occupied |
| Less than High School | 5 (26.3%) | 14 (73.7%) |
| High School Diploma | 38 (86.4%) | 6 (13.6%) |
| College/Associate Degree | 24 (77.4%) | 7 (22.6%) |
| Bachelor's Degree or higher | 5 (83.3%) | 1 (16.7%) |
Occupancy by Age of Householder in Wheeler
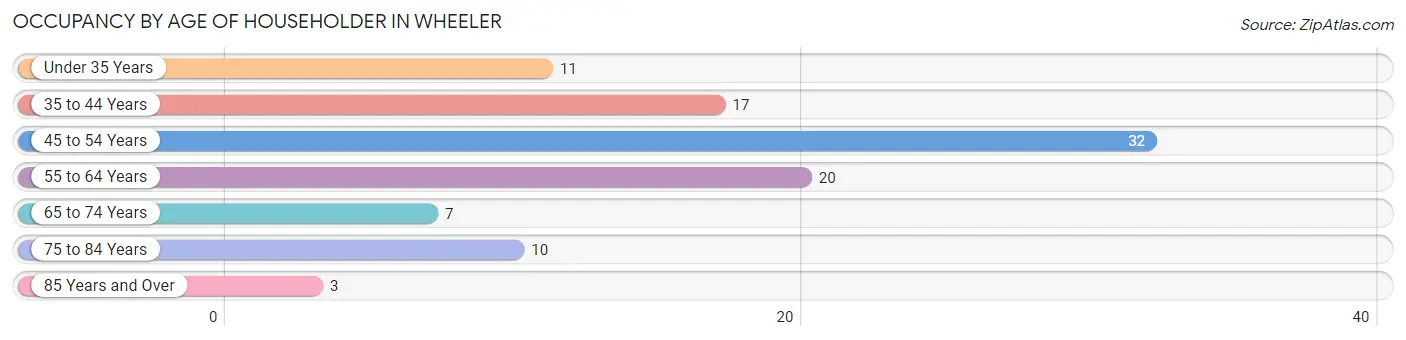
| Age Bracket | # Households | % Households |
| Under 35 Years | 11 | 11.0% |
| 35 to 44 Years | 17 | 17.0% |
| 45 to 54 Years | 32 | 32.0% |
| 55 to 64 Years | 20 | 20.0% |
| 65 to 74 Years | 7 | 7.0% |
| 75 to 84 Years | 10 | 10.0% |
| 85 Years and Over | 3 | 3.0% |
| Total | 100 | 100.0% |
Housing Finances in Wheeler
Median Income by Occupancy in Wheeler
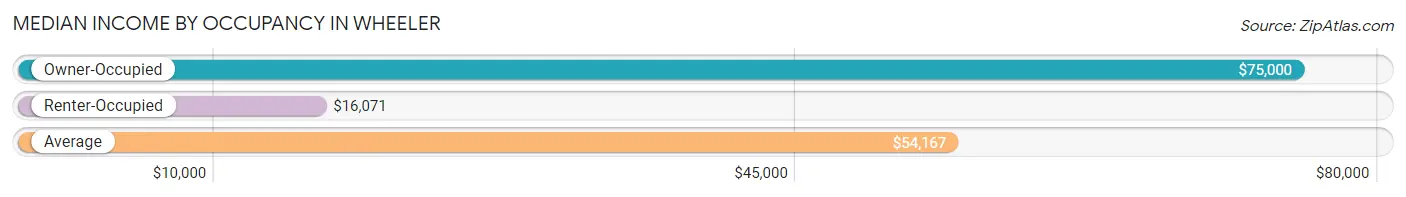
| Occupancy Type | # Households | Median Income |
| Owner-Occupied | 72 (72.0%) | $75,000 |
| Renter-Occupied | 28 (28.0%) | $16,071 |
| Average | 100 (100.0%) | $54,167 |
Occupancy by Householder Income Bracket in Wheeler
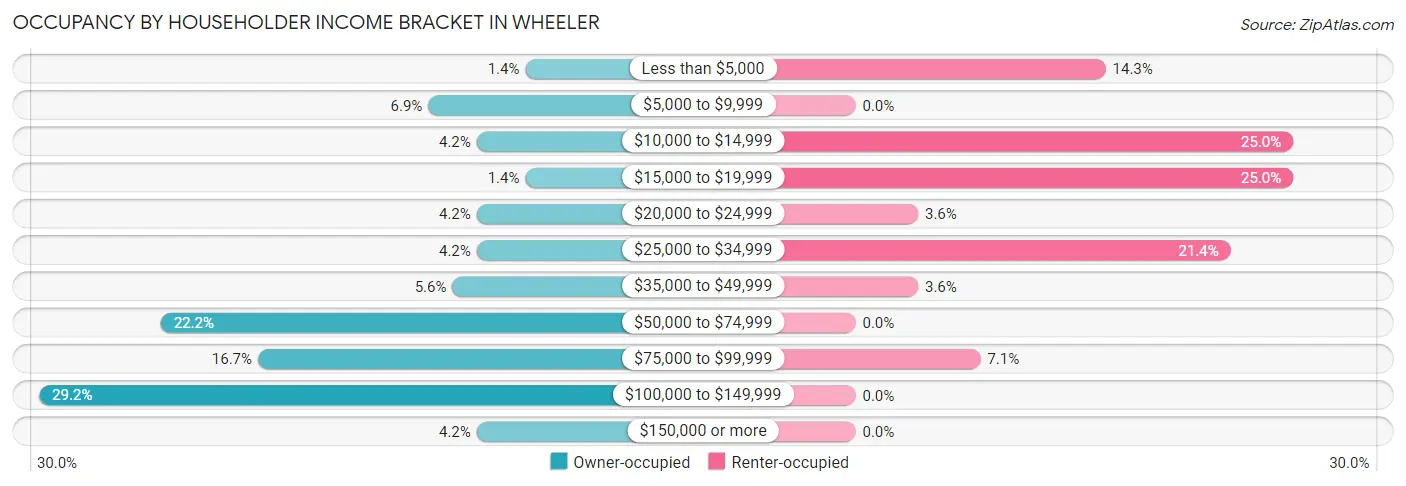
| Income Bracket | Owner-occupied | Renter-occupied |
| Less than $5,000 | 1 (1.4%) | 4 (14.3%) |
| $5,000 to $9,999 | 5 (6.9%) | 0 (0.0%) |
| $10,000 to $14,999 | 3 (4.2%) | 7 (25.0%) |
| $15,000 to $19,999 | 1 (1.4%) | 7 (25.0%) |
| $20,000 to $24,999 | 3 (4.2%) | 1 (3.6%) |
| $25,000 to $34,999 | 3 (4.2%) | 6 (21.4%) |
| $35,000 to $49,999 | 4 (5.6%) | 1 (3.6%) |
| $50,000 to $74,999 | 16 (22.2%) | 0 (0.0%) |
| $75,000 to $99,999 | 12 (16.7%) | 2 (7.1%) |
| $100,000 to $149,999 | 21 (29.2%) | 0 (0.0%) |
| $150,000 or more | 3 (4.2%) | 0 (0.0%) |
| Total | 72 (100.0%) | 28 (100.0%) |
Monthly Housing Cost Tiers in Wheeler
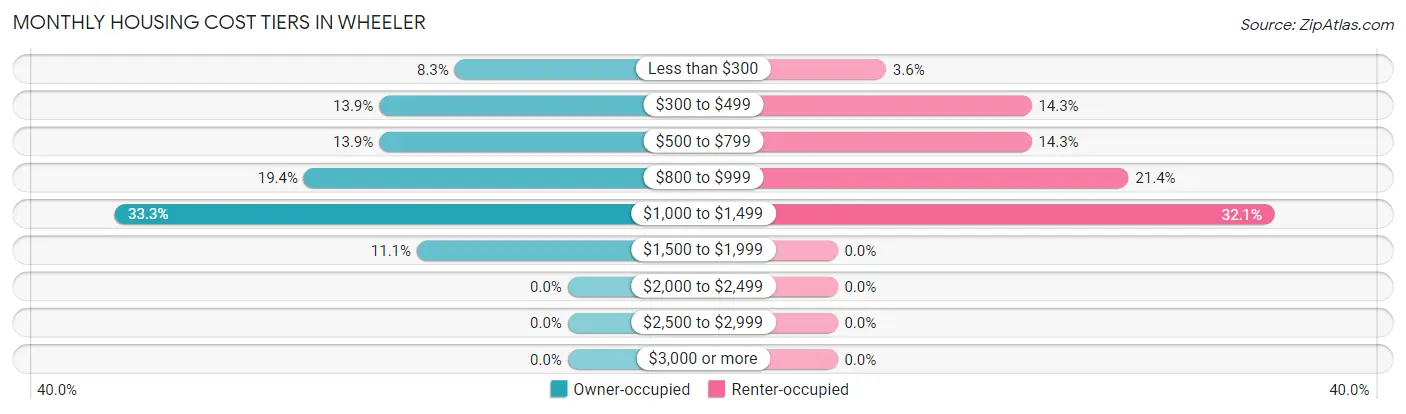
| Monthly Cost | Owner-occupied | Renter-occupied |
| Less than $300 | 6 (8.3%) | 1 (3.6%) |
| $300 to $499 | 10 (13.9%) | 4 (14.3%) |
| $500 to $799 | 10 (13.9%) | 4 (14.3%) |
| $800 to $999 | 14 (19.4%) | 6 (21.4%) |
| $1,000 to $1,499 | 24 (33.3%) | 9 (32.1%) |
| $1,500 to $1,999 | 8 (11.1%) | 0 (0.0%) |
| $2,000 to $2,499 | 0 (0.0%) | 0 (0.0%) |
| $2,500 to $2,999 | 0 (0.0%) | 0 (0.0%) |
| $3,000 or more | 0 (0.0%) | 0 (0.0%) |
| Total | 72 (100.0%) | 28 (100.0%) |
Physical Housing Characteristics in Wheeler
Housing Structures in Wheeler
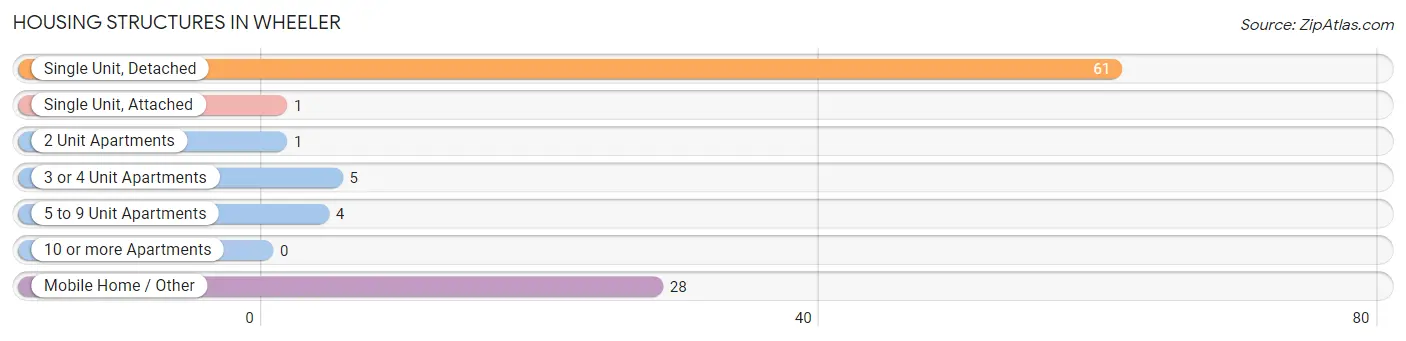
| Structure Type | # Housing Units | % Housing Units |
| Single Unit, Detached | 61 | 61.0% |
| Single Unit, Attached | 1 | 1.0% |
| 2 Unit Apartments | 1 | 1.0% |
| 3 or 4 Unit Apartments | 5 | 5.0% |
| 5 to 9 Unit Apartments | 4 | 4.0% |
| 10 or more Apartments | 0 | 0.0% |
| Mobile Home / Other | 28 | 28.0% |
| Total | 100 | 100.0% |
Housing Structures by Occupancy in Wheeler
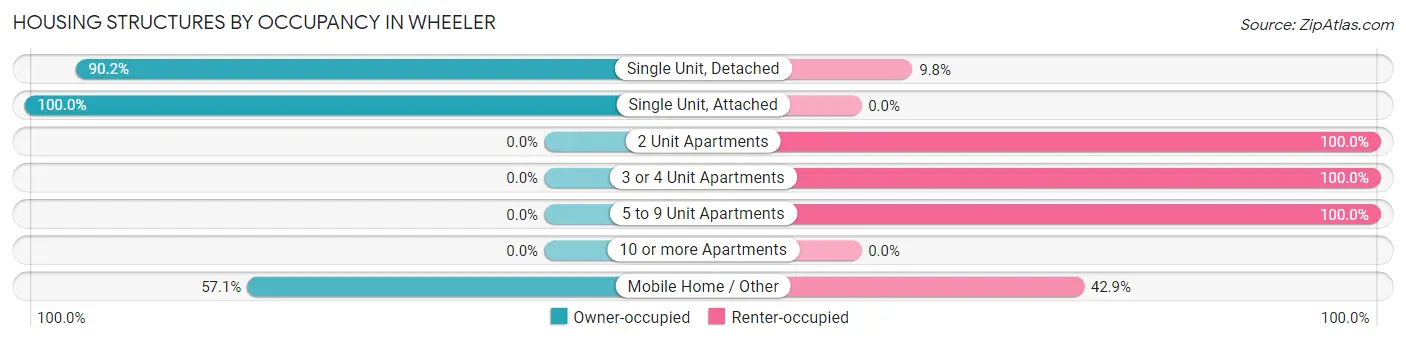
| Structure Type | Owner-occupied | Renter-occupied |
| Single Unit, Detached | 55 (90.2%) | 6 (9.8%) |
| Single Unit, Attached | 1 (100.0%) | 0 (0.0%) |
| 2 Unit Apartments | 0 (0.0%) | 1 (100.0%) |
| 3 or 4 Unit Apartments | 0 (0.0%) | 5 (100.0%) |
| 5 to 9 Unit Apartments | 0 (0.0%) | 4 (100.0%) |
| 10 or more Apartments | 0 (0.0%) | 0 (0.0%) |
| Mobile Home / Other | 16 (57.1%) | 12 (42.9%) |
| Total | 72 (72.0%) | 28 (28.0%) |
Housing Structures by Number of Rooms in Wheeler
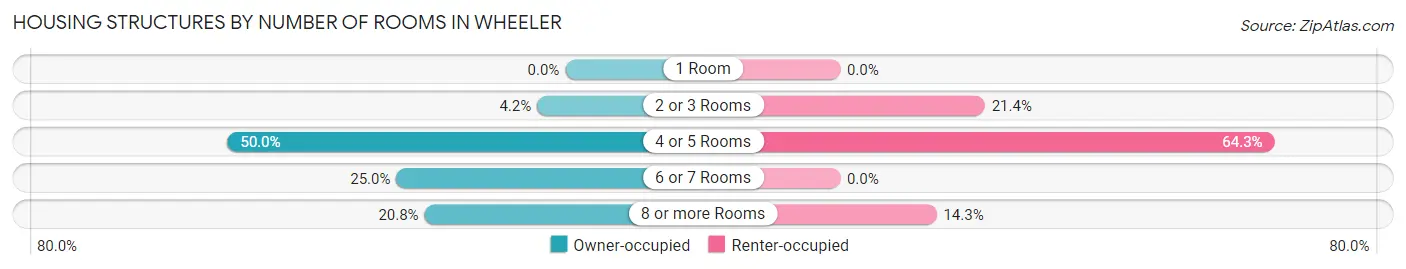
| Number of Rooms | Owner-occupied | Renter-occupied |
| 1 Room | 0 (0.0%) | 0 (0.0%) |
| 2 or 3 Rooms | 3 (4.2%) | 6 (21.4%) |
| 4 or 5 Rooms | 36 (50.0%) | 18 (64.3%) |
| 6 or 7 Rooms | 18 (25.0%) | 0 (0.0%) |
| 8 or more Rooms | 15 (20.8%) | 4 (14.3%) |
| Total | 72 (100.0%) | 28 (100.0%) |
Housing Structure by Heating Type in Wheeler
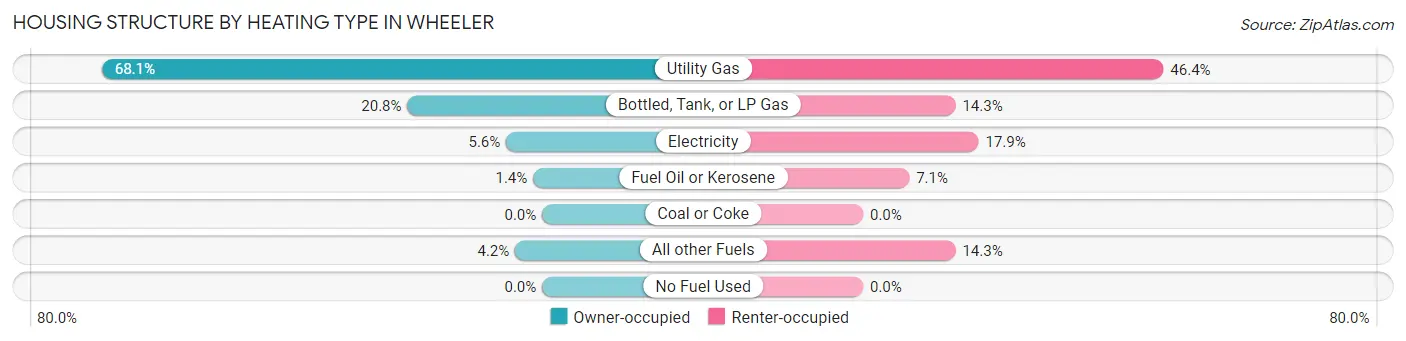
| Heating Type | Owner-occupied | Renter-occupied |
| Utility Gas | 49 (68.1%) | 13 (46.4%) |
| Bottled, Tank, or LP Gas | 15 (20.8%) | 4 (14.3%) |
| Electricity | 4 (5.6%) | 5 (17.9%) |
| Fuel Oil or Kerosene | 1 (1.4%) | 2 (7.1%) |
| Coal or Coke | 0 (0.0%) | 0 (0.0%) |
| All other Fuels | 3 (4.2%) | 4 (14.3%) |
| No Fuel Used | 0 (0.0%) | 0 (0.0%) |
| Total | 72 (100.0%) | 28 (100.0%) |
Household Vehicle Usage in Wheeler
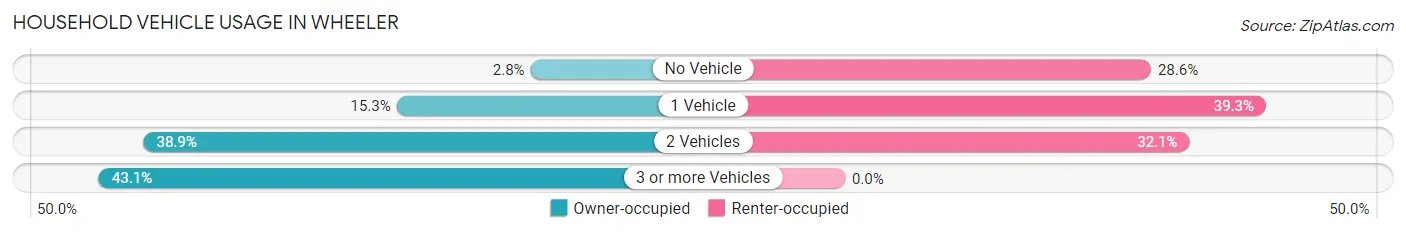
| Vehicles per Household | Owner-occupied | Renter-occupied |
| No Vehicle | 2 (2.8%) | 8 (28.6%) |
| 1 Vehicle | 11 (15.3%) | 11 (39.3%) |
| 2 Vehicles | 28 (38.9%) | 9 (32.1%) |
| 3 or more Vehicles | 31 (43.1%) | 0 (0.0%) |
| Total | 72 (100.0%) | 28 (100.0%) |
Real Estate & Mortgages in Wheeler
Real Estate and Mortgage Overview in Wheeler
| Characteristic | Without Mortgage | With Mortgage |
| Housing Units | 23 | 49 |
| Median Property Value | - | - |
| Median Household Income | - | - |
| Monthly Housing Costs | $425 | $0 |
| Real Estate Taxes | - | - |
Property Value by Mortgage Status in Wheeler
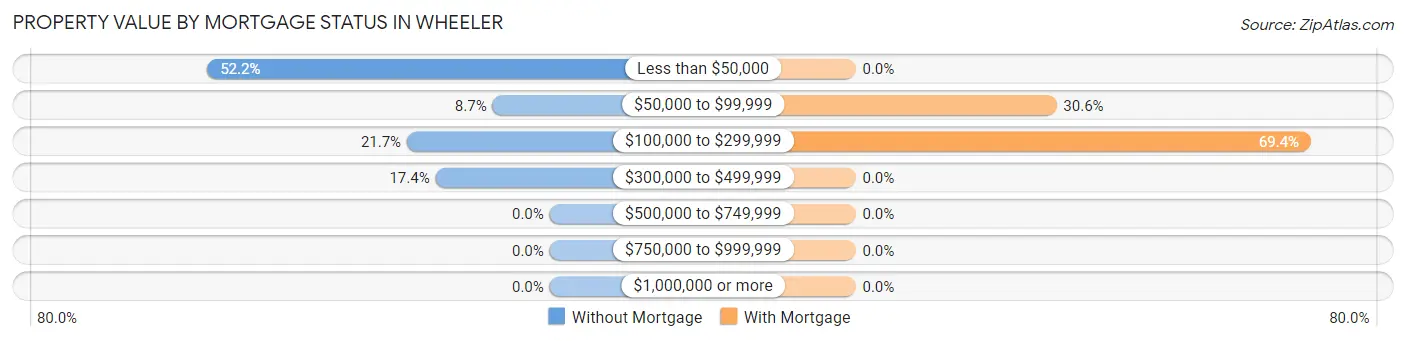
| Property Value | Without Mortgage | With Mortgage |
| Less than $50,000 | 12 (52.2%) | 0 (0.0%) |
| $50,000 to $99,999 | 2 (8.7%) | 15 (30.6%) |
| $100,000 to $299,999 | 5 (21.7%) | 34 (69.4%) |
| $300,000 to $499,999 | 4 (17.4%) | 0 (0.0%) |
| $500,000 to $749,999 | 0 (0.0%) | 0 (0.0%) |
| $750,000 to $999,999 | 0 (0.0%) | 0 (0.0%) |
| $1,000,000 or more | 0 (0.0%) | 0 (0.0%) |
| Total | 23 (100.0%) | 49 (100.0%) |
Household Income by Mortgage Status in Wheeler
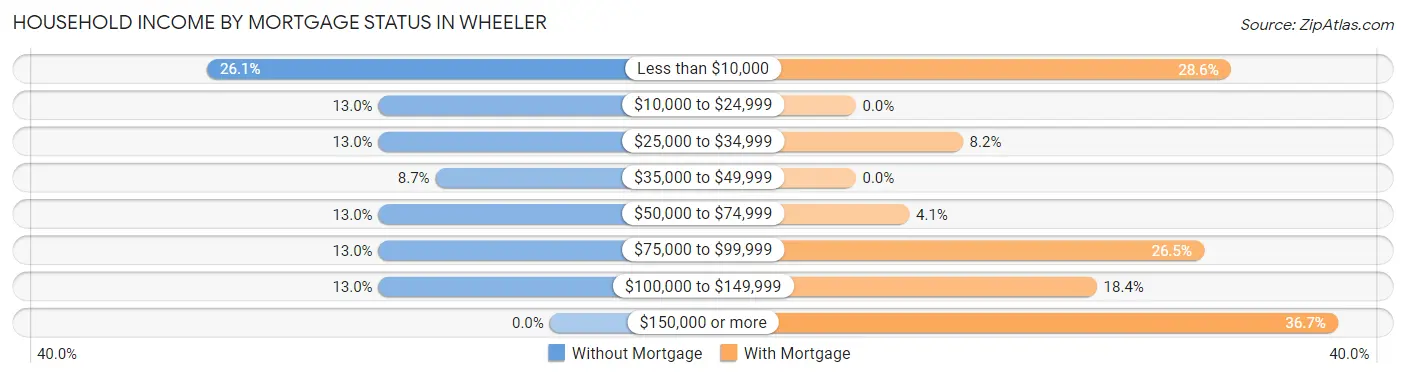
| Household Income | Without Mortgage | With Mortgage |
| Less than $10,000 | 6 (26.1%) | 14 (28.6%) |
| $10,000 to $24,999 | 3 (13.0%) | 0 (0.0%) |
| $25,000 to $34,999 | 3 (13.0%) | 4 (8.2%) |
| $35,000 to $49,999 | 2 (8.7%) | 0 (0.0%) |
| $50,000 to $74,999 | 3 (13.0%) | 2 (4.1%) |
| $75,000 to $99,999 | 3 (13.0%) | 13 (26.5%) |
| $100,000 to $149,999 | 3 (13.0%) | 9 (18.4%) |
| $150,000 or more | 0 (0.0%) | 18 (36.7%) |
| Total | 23 (100.0%) | 49 (100.0%) |
Property Value to Household Income Ratio in Wheeler
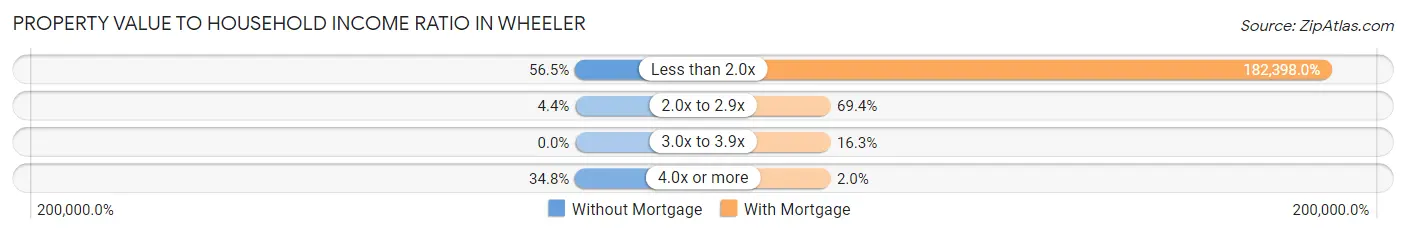
| Value-to-Income Ratio | Without Mortgage | With Mortgage |
| Less than 2.0x | 13 (56.5%) | 89,375 (182,398.0%) |
| 2.0x to 2.9x | 1 (4.3%) | 34 (69.4%) |
| 3.0x to 3.9x | 0 (0.0%) | 8 (16.3%) |
| 4.0x or more | 8 (34.8%) | 1 (2.0%) |
| Total | 23 (100.0%) | 49 (100.0%) |
Real Estate Taxes by Mortgage Status in Wheeler
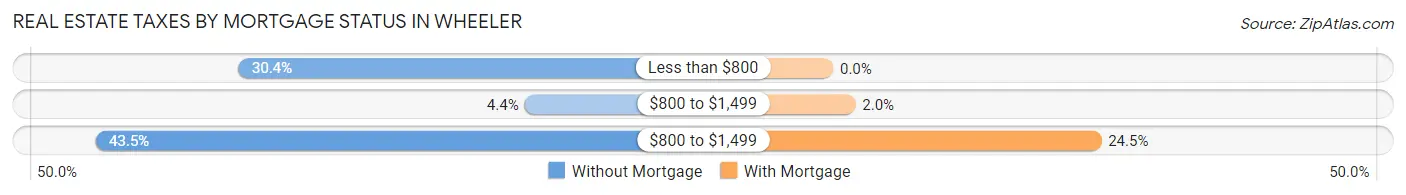
| Property Taxes | Without Mortgage | With Mortgage |
| Less than $800 | 7 (30.4%) | 0 (0.0%) |
| $800 to $1,499 | 1 (4.3%) | 1 (2.0%) |
| $800 to $1,499 | 10 (43.5%) | 12 (24.5%) |
| Total | 23 (100.0%) | 49 (100.0%) |
Health & Disability in Wheeler
Health Insurance Coverage by Age in Wheeler
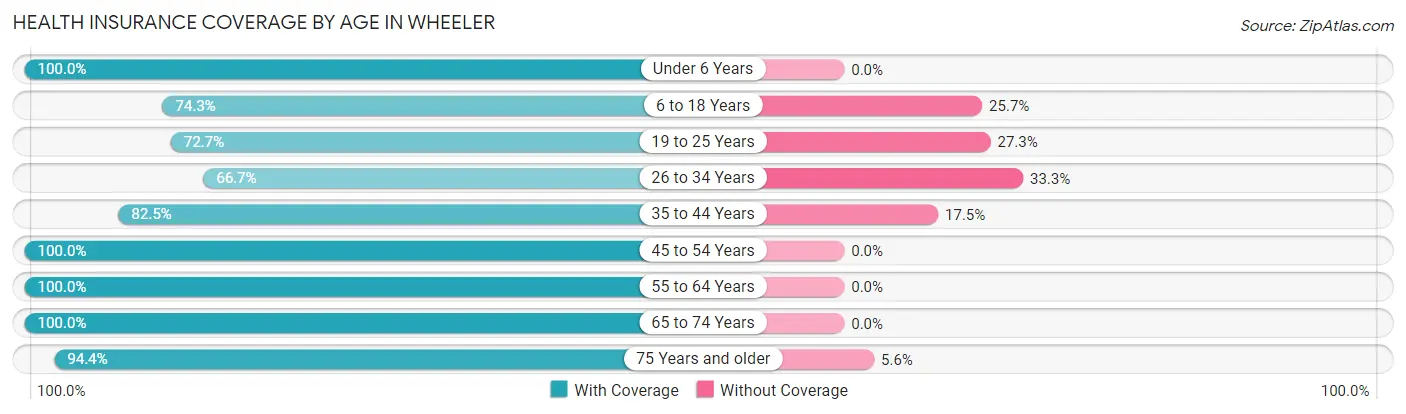
| Age Bracket | With Coverage | Without Coverage |
| Under 6 Years | 12 (100.0%) | 0 (0.0%) |
| 6 to 18 Years | 26 (74.3%) | 9 (25.7%) |
| 19 to 25 Years | 16 (72.7%) | 6 (27.3%) |
| 26 to 34 Years | 8 (66.7%) | 4 (33.3%) |
| 35 to 44 Years | 33 (82.5%) | 7 (17.5%) |
| 45 to 54 Years | 50 (100.0%) | 0 (0.0%) |
| 55 to 64 Years | 28 (100.0%) | 0 (0.0%) |
| 65 to 74 Years | 12 (100.0%) | 0 (0.0%) |
| 75 Years and older | 17 (94.4%) | 1 (5.6%) |
| Total | 202 (88.2%) | 27 (11.8%) |
Health Insurance Coverage by Citizenship Status in Wheeler
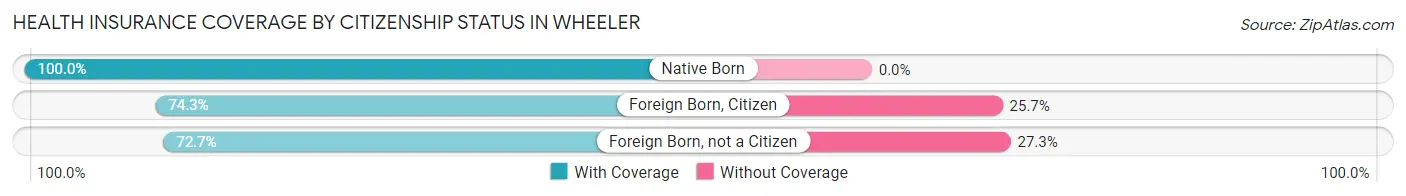
| Citizenship Status | With Coverage | Without Coverage |
| Native Born | 12 (100.0%) | 0 (0.0%) |
| Foreign Born, Citizen | 26 (74.3%) | 9 (25.7%) |
| Foreign Born, not a Citizen | 16 (72.7%) | 6 (27.3%) |
Health Insurance Coverage by Household Income in Wheeler
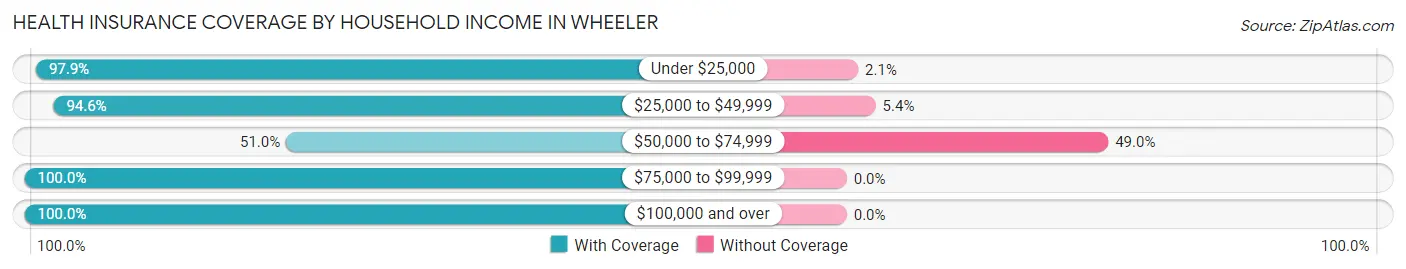
| Household Income | With Coverage | Without Coverage |
| Under $25,000 | 46 (97.9%) | 1 (2.1%) |
| $25,000 to $49,999 | 35 (94.6%) | 2 (5.4%) |
| $50,000 to $74,999 | 25 (51.0%) | 24 (49.0%) |
| $75,000 to $99,999 | 36 (100.0%) | 0 (0.0%) |
| $100,000 and over | 60 (100.0%) | 0 (0.0%) |
Public vs Private Health Insurance Coverage by Age in Wheeler
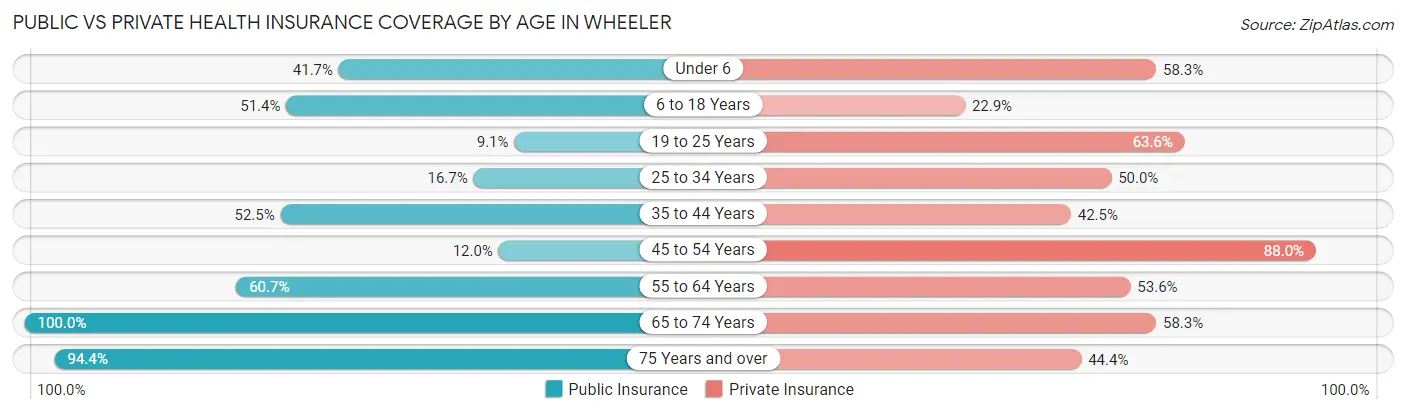
| Age Bracket | Public Insurance | Private Insurance |
| Under 6 | 5 (41.7%) | 7 (58.3%) |
| 6 to 18 Years | 18 (51.4%) | 8 (22.9%) |
| 19 to 25 Years | 2 (9.1%) | 14 (63.6%) |
| 25 to 34 Years | 2 (16.7%) | 6 (50.0%) |
| 35 to 44 Years | 21 (52.5%) | 17 (42.5%) |
| 45 to 54 Years | 6 (12.0%) | 44 (88.0%) |
| 55 to 64 Years | 17 (60.7%) | 15 (53.6%) |
| 65 to 74 Years | 12 (100.0%) | 7 (58.3%) |
| 75 Years and over | 17 (94.4%) | 8 (44.4%) |
| Total | 100 (43.7%) | 126 (55.0%) |
Disability Status by Sex by Age in Wheeler
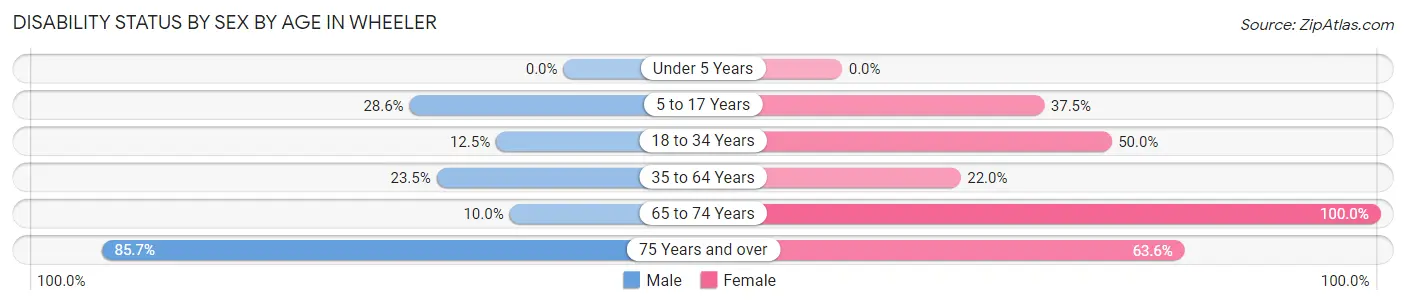
| Age Bracket | Male | Female |
| Under 5 Years | 0 (0.0%) | 0 (0.0%) |
| 5 to 17 Years | 4 (28.6%) | 9 (37.5%) |
| 18 to 34 Years | 1 (12.5%) | 13 (50.0%) |
| 35 to 64 Years | 16 (23.5%) | 11 (22.0%) |
| 65 to 74 Years | 1 (10.0%) | 2 (100.0%) |
| 75 Years and over | 6 (85.7%) | 7 (63.6%) |
Disability Class by Sex by Age in Wheeler
Disability Class: Hearing Difficulty
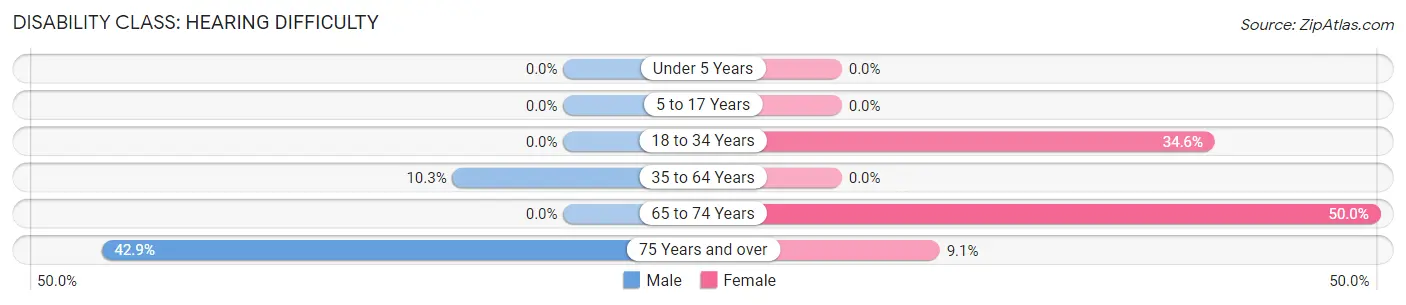
| Age Bracket | Male | Female |
| Under 5 Years | 0 (0.0%) | 0 (0.0%) |
| 5 to 17 Years | 0 (0.0%) | 0 (0.0%) |
| 18 to 34 Years | 0 (0.0%) | 9 (34.6%) |
| 35 to 64 Years | 7 (10.3%) | 0 (0.0%) |
| 65 to 74 Years | 0 (0.0%) | 1 (50.0%) |
| 75 Years and over | 3 (42.9%) | 1 (9.1%) |
Disability Class: Vision Difficulty
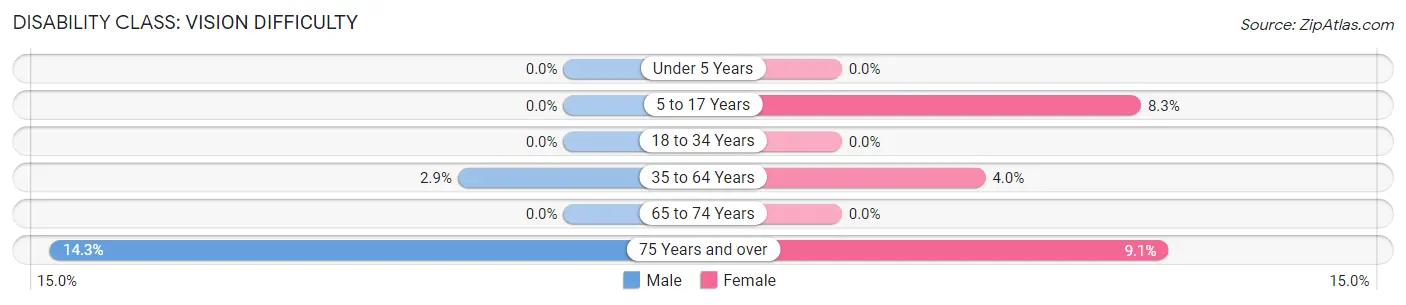
| Age Bracket | Male | Female |
| Under 5 Years | 0 (0.0%) | 0 (0.0%) |
| 5 to 17 Years | 0 (0.0%) | 2 (8.3%) |
| 18 to 34 Years | 0 (0.0%) | 0 (0.0%) |
| 35 to 64 Years | 2 (2.9%) | 2 (4.0%) |
| 65 to 74 Years | 0 (0.0%) | 0 (0.0%) |
| 75 Years and over | 1 (14.3%) | 1 (9.1%) |
Disability Class: Cognitive Difficulty
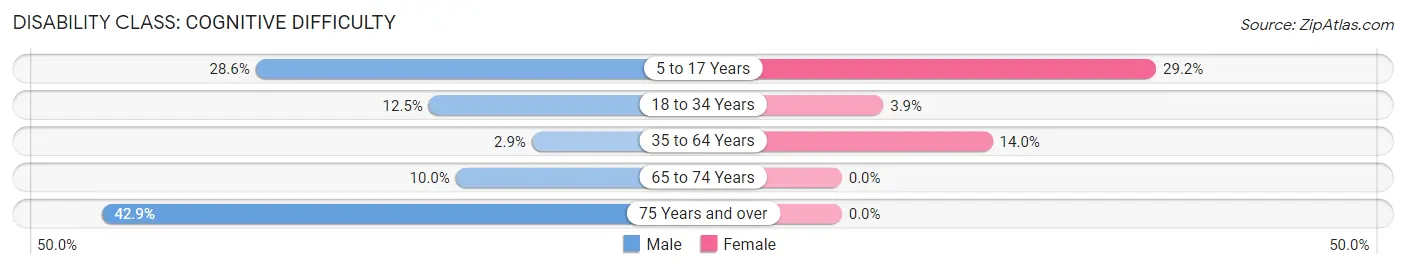
| Age Bracket | Male | Female |
| 5 to 17 Years | 4 (28.6%) | 7 (29.2%) |
| 18 to 34 Years | 1 (12.5%) | 1 (3.8%) |
| 35 to 64 Years | 2 (2.9%) | 7 (14.0%) |
| 65 to 74 Years | 1 (10.0%) | 0 (0.0%) |
| 75 Years and over | 3 (42.9%) | 0 (0.0%) |
Disability Class: Ambulatory Difficulty
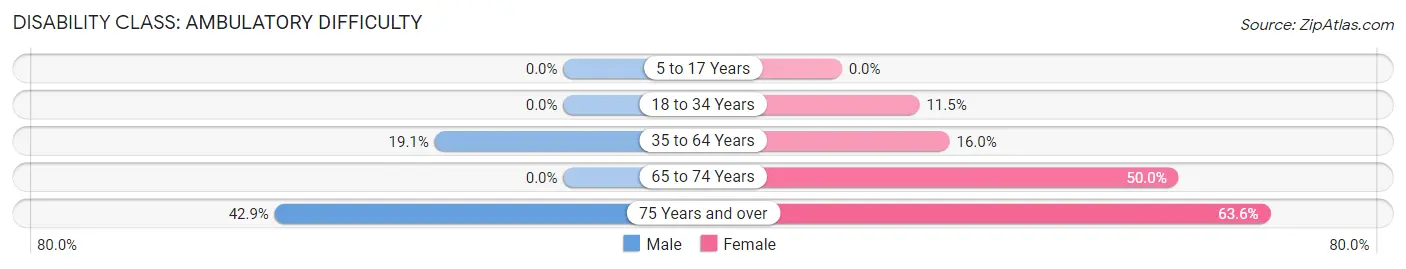
| Age Bracket | Male | Female |
| 5 to 17 Years | 0 (0.0%) | 0 (0.0%) |
| 18 to 34 Years | 0 (0.0%) | 3 (11.5%) |
| 35 to 64 Years | 13 (19.1%) | 8 (16.0%) |
| 65 to 74 Years | 0 (0.0%) | 1 (50.0%) |
| 75 Years and over | 3 (42.9%) | 7 (63.6%) |
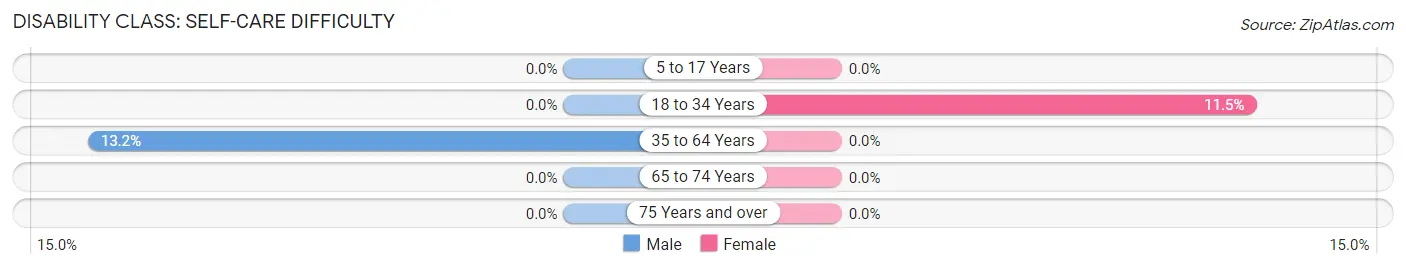
Disability Class: Self-Care Difficulty
| Age Bracket | Male | Female |
| 5 to 17 Years | 0 (0.0%) | 0 (0.0%) |
| 18 to 34 Years | 0 (0.0%) | 3 (11.5%) |
| 35 to 64 Years | 9 (13.2%) | 0 (0.0%) |
| 65 to 74 Years | 0 (0.0%) | 0 (0.0%) |
| 75 Years and over | 0 (0.0%) | 0 (0.0%) |
Technology Access in Wheeler
Computing Device Access in Wheeler
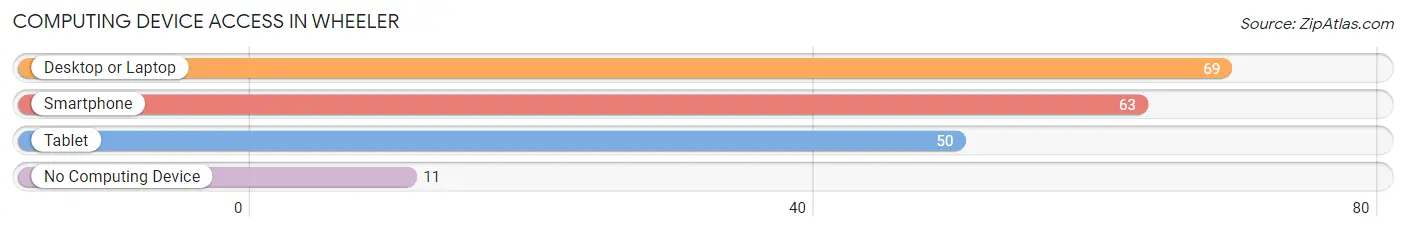
| Device Type | # Households | % Households |
| Desktop or Laptop | 69 | 69.0% |
| Smartphone | 63 | 63.0% |
| Tablet | 50 | 50.0% |
| No Computing Device | 11 | 11.0% |
| Total | 100 | 100.0% |
Internet Access in Wheeler
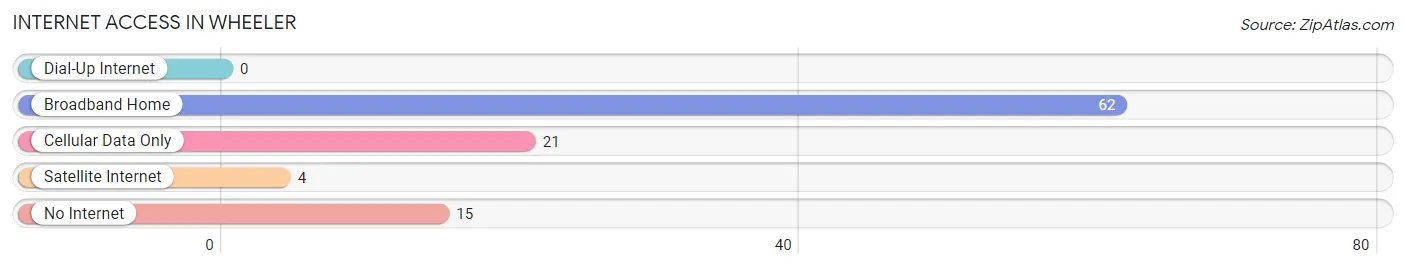
| Internet Type | # Households | % Households |
| Dial-Up Internet | 0 | 0.0% |
| Broadband Home | 62 | 62.0% |
| Cellular Data Only | 21 | 21.0% |
| Satellite Internet | 4 | 4.0% |
| No Internet | 15 | 15.0% |
| Total | 100 | 100.0% |
Wheeler Summary
Wheeler, Wisconsin is a small village located in the northern part of the state, in Marinette County. It is situated on the banks of the Menominee River, and is surrounded by the towns of Amberg, Athelstane, and Wausaukee. The population of Wheeler was estimated to be 545 in 2020.
History
Wheeler was first settled in 1854 by a group of lumberjacks from Maine. The village was named after the Wheeler family, who were among the first settlers. The first post office was established in 1856, and the village was incorporated in 1876.
In the late 19th century, Wheeler was a thriving lumber town. The village was home to several sawmills, a grist mill, and a shingle mill. The lumber industry was the main source of employment for the residents of Wheeler.
In the early 20th century, the lumber industry began to decline, and the village began to transition to a more agricultural-based economy. The village was home to several dairy farms, and the local farmers grew a variety of crops, including potatoes, corn, and hay.
Geography
Wheeler is located in the northern part of Wisconsin, in Marinette County. It is situated on the banks of the Menominee River, and is surrounded by the towns of Amberg, Athelstane, and Wausaukee. The village is located approximately 30 miles north of Green Bay, and is about a two-hour drive from Milwaukee.
The terrain around Wheeler is mostly flat, with some rolling hills. The village is located in a heavily forested area, and is home to a variety of wildlife, including deer, bear, and a variety of birds.
Economy
The economy of Wheeler is largely based on agriculture and tourism. The village is home to several dairy farms, and the local farmers grow a variety of crops, including potatoes, corn, and hay.
The village is also home to several tourist attractions, including the Menominee River State Park, the Marinette County Historical Museum, and the Wheeler Historical Society. The village also hosts several annual events, including the Wheeler Days Festival and the Wheeler County Fair.
Demographics
The population of Wheeler was estimated to be 545 in 2020. The racial makeup of the village was 97.3% White, 0.7% Native American, 0.2% Asian, 0.2% from other races, and 1.6% from two or more races. Hispanic or Latino of any race were 0.7% of the population.
The median household income in Wheeler was $41,250 in 2019. The median age of the village was 44.7 years. The gender makeup of the village was 49.2% male and 50.8% female.
Common Questions
What is Per Capita Income in Wheeler?
Per Capita income in Wheeler is $28,065.
What is the Median Family Income in Wheeler?
Median Family Income in Wheeler is $87,813.
What is the Median Household income in Wheeler?
Median Household Income in Wheeler is $54,167.
What is Income or Wage Gap in Wheeler?
Income or Wage Gap in Wheeler is 44.2%.
Women in Wheeler earn 55.8 cents for every dollar earned by a man.
What is Inequality or Gini Index in Wheeler?
Inequality or Gini Index in Wheeler is 0.43.
What is the Total Population of Wheeler?
Total Population of Wheeler is 229.
What is the Total Male Population of Wheeler?
Total Male Population of Wheeler is 115.
What is the Total Female Population of Wheeler?
Total Female Population of Wheeler is 114.
What is the Ratio of Males per 100 Females in Wheeler?
There are 100.88 Males per 100 Females in Wheeler.
What is the Ratio of Females per 100 Males in Wheeler?
There are 99.13 Females per 100 Males in Wheeler.
What is the Median Population Age in Wheeler?
Median Population Age in Wheeler is 42.6 Years.
What is the Average Family Size in Wheeler
Average Family Size in Wheeler is 3.0 People.
What is the Average Household Size in Wheeler
Average Household Size in Wheeler is 2.3 People.
How Large is the Labor Force in Wheeler?
There are 127 People in the Labor Forcein in Wheeler.
What is the Percentage of People in the Labor Force in Wheeler?
66.8% of People are in the Labor Force in Wheeler.
What is the Unemployment Rate in Wheeler?
Unemployment Rate in Wheeler is 1.6%.