Bloomfield, WI Map & Demographics
Bloomfield Map
Bloomfield Overview
$31,732
PER CAPITA INCOME
$95,869
AVG FAMILY INCOME
$95,166
AVG HOUSEHOLD INCOME
43.9%
WAGE / INCOME GAP [ % ]
56.1¢/ $1
WAGE / INCOME GAP [ $ ]
0.34
INEQUALITY / GINI INDEX
4,791
TOTAL POPULATION
2,520
MALE POPULATION
2,271
FEMALE POPULATION
110.96
MALES / 100 FEMALES
90.12
FEMALES / 100 MALES
35.3
MEDIAN AGE
3.3
AVG FAMILY SIZE
3.0
AVG HOUSEHOLD SIZE
2,583
LABOR FORCE [ PEOPLE ]
71.8%
PERCENT IN LABOR FORCE
7.2%
UNEMPLOYMENT RATE
Income in Bloomfield
Income Overview in Bloomfield
Per Capita Income in Bloomfield is $31,732, while median incomes of families and households are $95,869 and $95,166 respectively.
| Characteristic | Number | Measure |
| Per Capita Income | 4,791 | $31,732 |
| Median Family Income | 1,319 | $95,869 |
| Mean Family Income | 1,319 | $101,468 |
| Median Household Income | 1,583 | $95,166 |
| Mean Household Income | 1,583 | $96,033 |
| Income Deficit | 1,319 | $0 |
| Wage / Income Gap (%) | 4,791 | 43.88% |
| Wage / Income Gap ($) | 4,791 | 56.12¢ per $1 |
| Gini / Inequality Index | 4,791 | 0.34 |
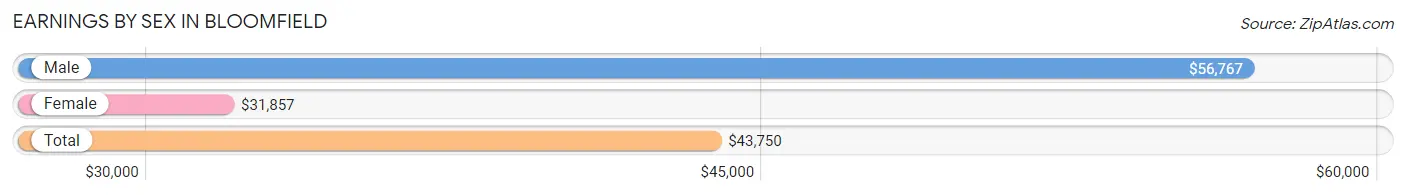
Earnings by Sex in Bloomfield
Average Earnings in Bloomfield are $43,750, $56,767 for men and $31,857 for women, a difference of 43.9%.
| Sex | Number | Average Earnings |
| Male | 1,431 (55.9%) | $56,767 |
| Female | 1,127 (44.1%) | $31,857 |
| Total | 2,558 (100.0%) | $43,750 |
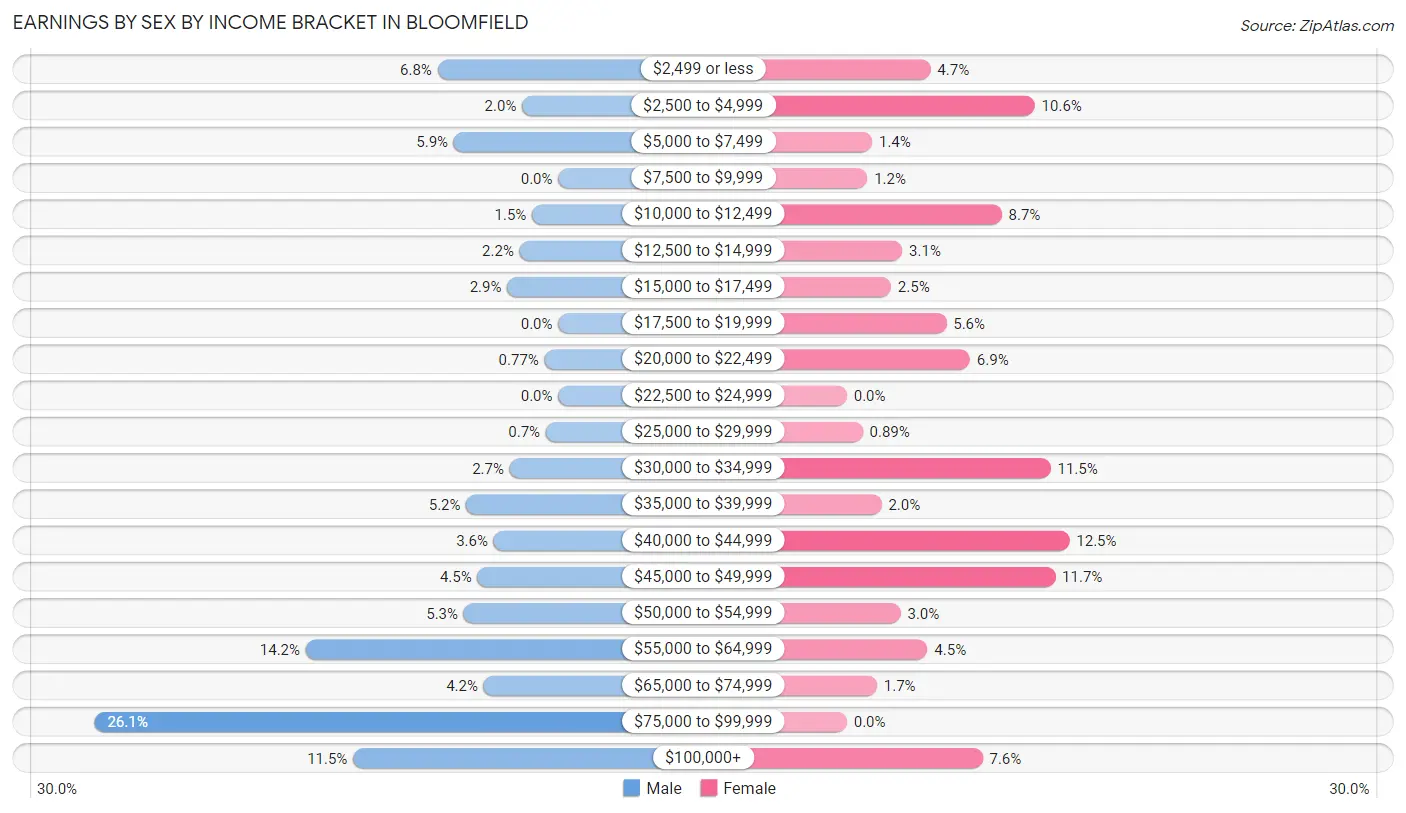
Earnings by Sex by Income Bracket in Bloomfield
The most common earnings brackets in Bloomfield are $75,000 to $99,999 for men (373 | 26.1%) and $40,000 to $44,999 for women (141 | 12.5%).
| Income | Male | Female |
| $2,499 or less | 97 (6.8%) | 53 (4.7%) |
| $2,500 to $4,999 | 29 (2.0%) | 119 (10.6%) |
| $5,000 to $7,499 | 84 (5.9%) | 16 (1.4%) |
| $7,500 to $9,999 | 0 (0.0%) | 13 (1.1%) |
| $10,000 to $12,499 | 21 (1.5%) | 98 (8.7%) |
| $12,500 to $14,999 | 31 (2.2%) | 35 (3.1%) |
| $15,000 to $17,499 | 41 (2.9%) | 28 (2.5%) |
| $17,500 to $19,999 | 0 (0.0%) | 63 (5.6%) |
| $20,000 to $22,499 | 11 (0.8%) | 78 (6.9%) |
| $22,500 to $24,999 | 0 (0.0%) | 0 (0.0%) |
| $25,000 to $29,999 | 10 (0.7%) | 10 (0.9%) |
| $30,000 to $34,999 | 39 (2.7%) | 129 (11.5%) |
| $35,000 to $39,999 | 74 (5.2%) | 22 (1.9%) |
| $40,000 to $44,999 | 52 (3.6%) | 141 (12.5%) |
| $45,000 to $49,999 | 65 (4.5%) | 132 (11.7%) |
| $50,000 to $54,999 | 76 (5.3%) | 34 (3.0%) |
| $55,000 to $64,999 | 203 (14.2%) | 51 (4.5%) |
| $65,000 to $74,999 | 60 (4.2%) | 19 (1.7%) |
| $75,000 to $99,999 | 373 (26.1%) | 0 (0.0%) |
| $100,000+ | 165 (11.5%) | 86 (7.6%) |
| Total | 1,431 (100.0%) | 1,127 (100.0%) |
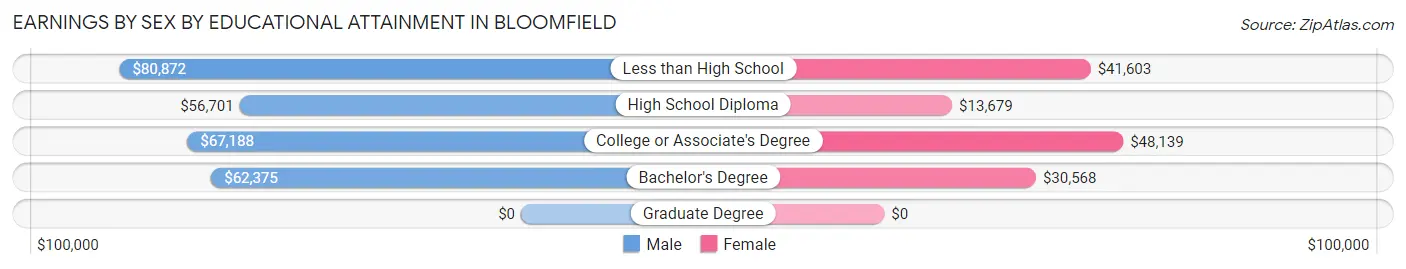
Earnings by Sex by Educational Attainment in Bloomfield
Average earnings in Bloomfield are $63,523 for men and $38,011 for women, a difference of 40.2%. Men with an educational attainment of less than high school enjoy the highest average annual earnings of $80,872, while those with high school diploma education earn the least with $56,701. Women with an educational attainment of college or associate's degree earn the most with the average annual earnings of $48,139, while those with high school diploma education have the smallest earnings of $13,679.
| Educational Attainment | Male Income | Female Income |
| Less than High School | $80,872 | $41,603 |
| High School Diploma | $56,701 | $13,679 |
| College or Associate's Degree | $67,188 | $48,139 |
| Bachelor's Degree | $62,375 | $30,568 |
| Graduate Degree | - | - |
| Total | $63,523 | $38,011 |
Family Income in Bloomfield
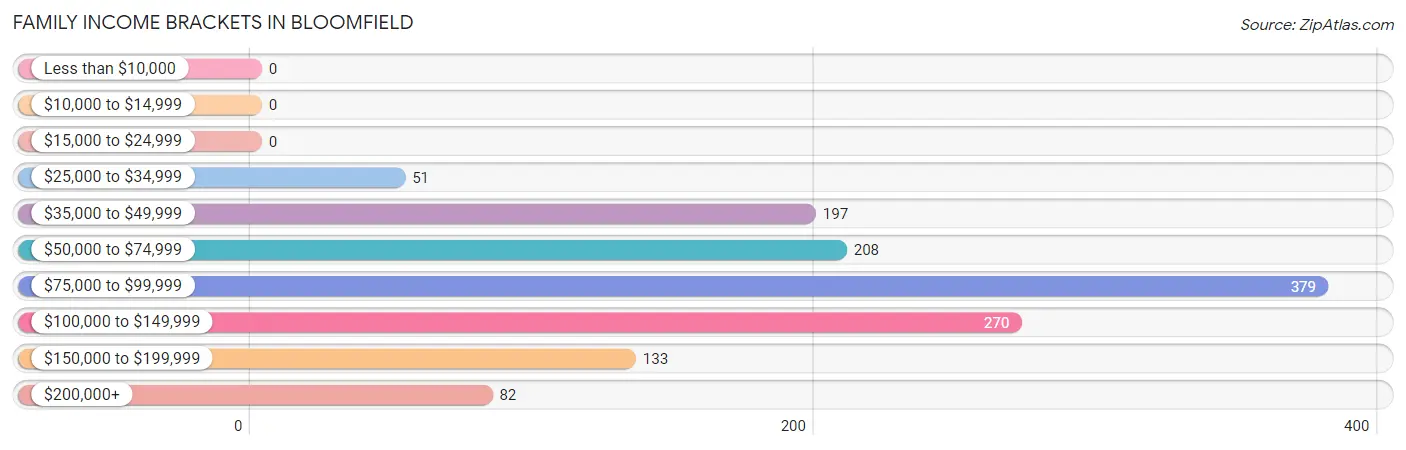
Family Income Brackets in Bloomfield
According to the Bloomfield family income data, there are 379 families falling into the $75,000 to $99,999 income range, which is the most common income bracket and makes up 28.7% of all families.
| Income Bracket | # Families | % Families |
| Less than $10,000 | 0 | 0.0% |
| $10,000 to $14,999 | 0 | 0.0% |
| $15,000 to $24,999 | 0 | 0.0% |
| $25,000 to $34,999 | 51 | 3.9% |
| $35,000 to $49,999 | 197 | 14.9% |
| $50,000 to $74,999 | 208 | 15.8% |
| $75,000 to $99,999 | 379 | 28.7% |
| $100,000 to $149,999 | 270 | 20.5% |
| $150,000 to $199,999 | 133 | 10.1% |
| $200,000+ | 82 | 6.2% |
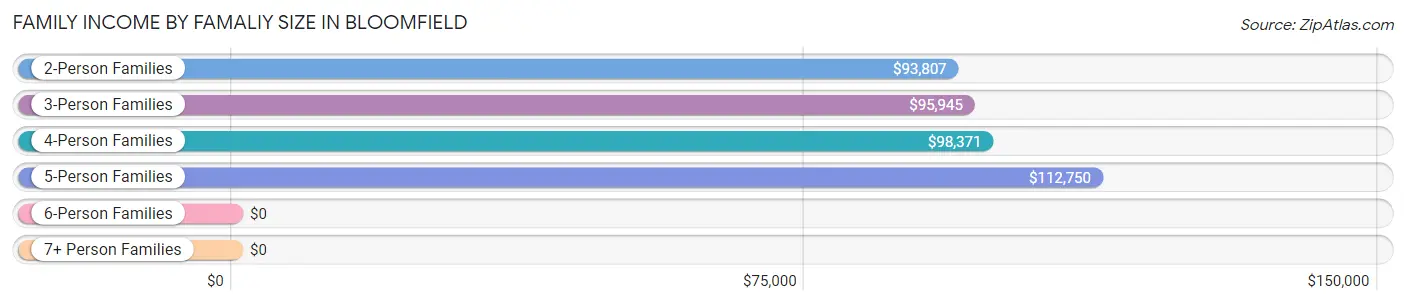
Family Income by Famaliy Size in Bloomfield
5-person families (215 | 16.3%) account for the highest median family income in Bloomfield with $112,750 per family, while 2-person families (483 | 36.6%) have the highest median income of $46,904 per family member.
| Income Bracket | # Families | Median Income |
| 2-Person Families | 483 (36.6%) | $93,807 |
| 3-Person Families | 315 (23.9%) | $95,945 |
| 4-Person Families | 285 (21.6%) | $98,371 |
| 5-Person Families | 215 (16.3%) | $112,750 |
| 6-Person Families | 0 (0.0%) | $0 |
| 7+ Person Families | 21 (1.6%) | $0 |
| Total | 1,319 (100.0%) | $95,869 |
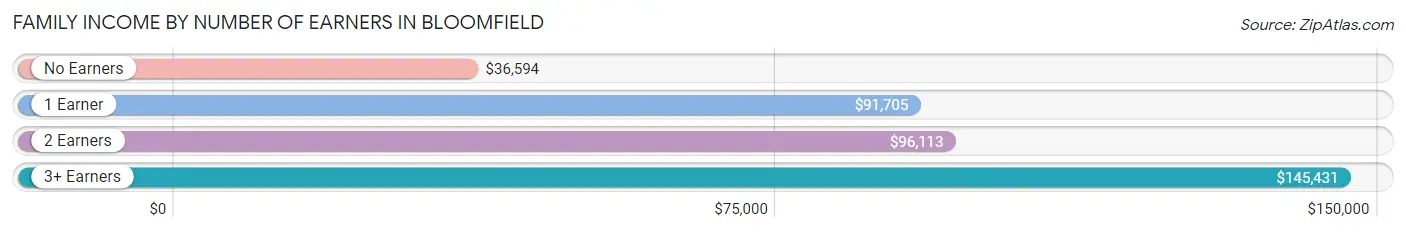
Family Income by Number of Earners in Bloomfield
The median family income in Bloomfield is $95,869, with families comprising 3+ earners (238) having the highest median family income of $145,431, while families with no earners (176) have the lowest median family income of $36,594, accounting for 18.0% and 13.3% of families, respectively.
| Number of Earners | # Families | Median Income |
| No Earners | 176 (13.3%) | $36,594 |
| 1 Earner | 271 (20.5%) | $91,705 |
| 2 Earners | 634 (48.1%) | $96,113 |
| 3+ Earners | 238 (18.0%) | $145,431 |
| Total | 1,319 (100.0%) | $95,869 |
Household Income in Bloomfield
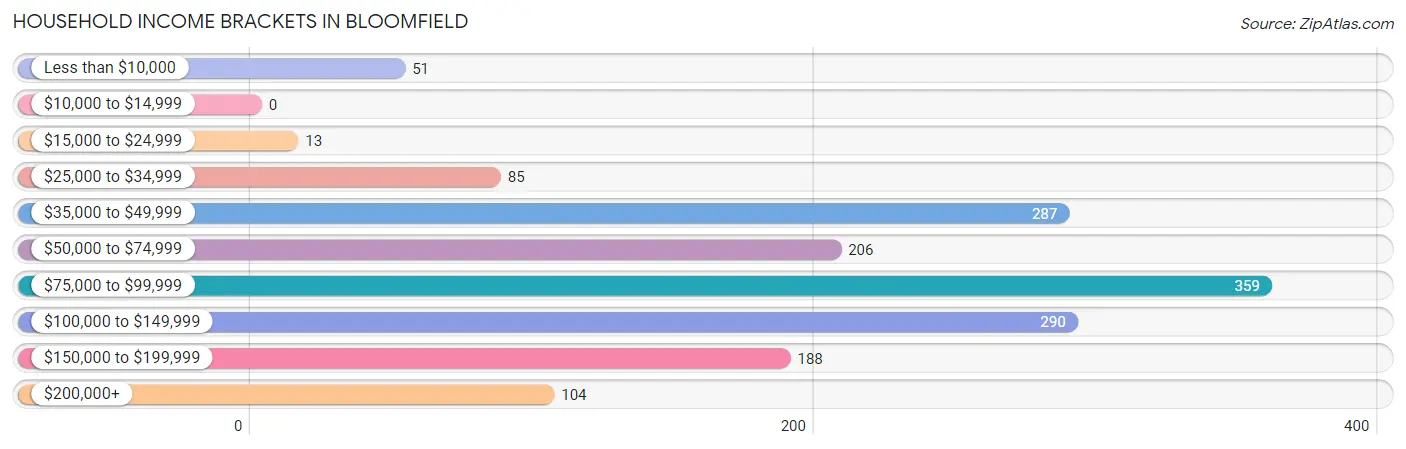
Household Income Brackets in Bloomfield
With 359 households falling in the category, the $75,000 to $99,999 income range is the most frequent in Bloomfield, accounting for 22.7% of all households.
| Income Bracket | # Households | % Households |
| Less than $10,000 | 51 | 3.2% |
| $10,000 to $14,999 | 0 | 0.0% |
| $15,000 to $24,999 | 13 | 0.8% |
| $25,000 to $34,999 | 85 | 5.4% |
| $35,000 to $49,999 | 287 | 18.1% |
| $50,000 to $74,999 | 206 | 13.0% |
| $75,000 to $99,999 | 359 | 22.7% |
| $100,000 to $149,999 | 290 | 18.3% |
| $150,000 to $199,999 | 188 | 11.9% |
| $200,000+ | 104 | 6.6% |
Household Income by Householder Age in Bloomfield
The median household income in Bloomfield is $95,166, with the highest median household income of $97,198 found in the 45 to 64 years age bracket for the primary householder. A total of 743 households (46.9%) fall into this category.
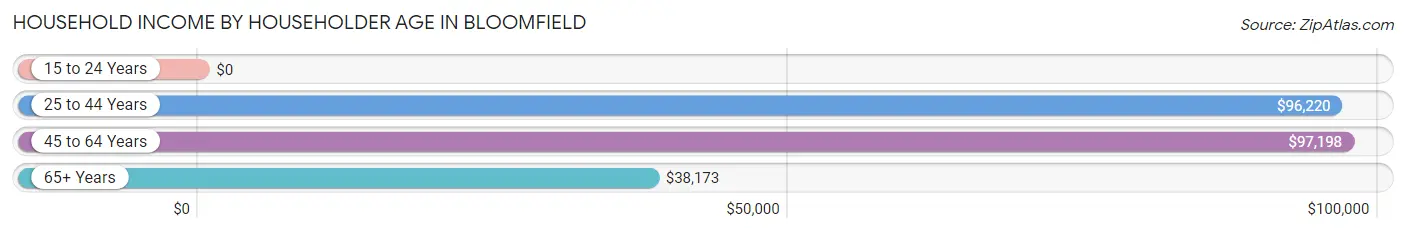
| Income Bracket | # Households | Median Income |
| 15 to 24 Years | 0 (0.0%) | $0 |
| 25 to 44 Years | 518 (32.7%) | $96,220 |
| 45 to 64 Years | 743 (46.9%) | $97,198 |
| 65+ Years | 322 (20.3%) | $38,173 |
| Total | 1,583 (100.0%) | $95,166 |
Poverty in Bloomfield
Income Below Poverty by Sex and Age in Bloomfield
With 4.1% poverty level for males and 9.3% for females among the residents of Bloomfield, 12 to 14 year old males and under 5 year old females are the most vulnerable to poverty, with 37 males (23.1%) and 41 females (52.6%) in their respective age groups living below the poverty level.
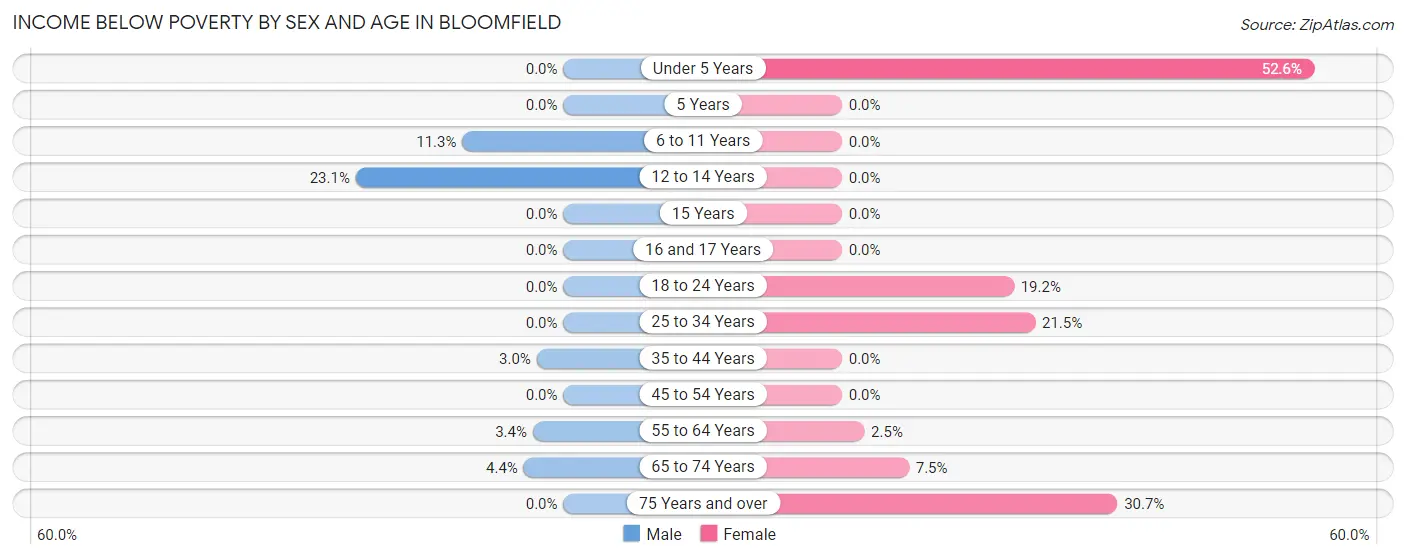
| Age Bracket | Male | Female |
| Under 5 Years | 0 (0.0%) | 41 (52.6%) |
| 5 Years | 0 (0.0%) | 0 (0.0%) |
| 6 to 11 Years | 37 (11.3%) | 0 (0.0%) |
| 12 to 14 Years | 37 (23.1%) | 0 (0.0%) |
| 15 Years | 0 (0.0%) | 0 (0.0%) |
| 16 and 17 Years | 0 (0.0%) | 0 (0.0%) |
| 18 to 24 Years | 0 (0.0%) | 54 (19.2%) |
| 25 to 34 Years | 0 (0.0%) | 68 (21.5%) |
| 35 to 44 Years | 11 (3.0%) | 0 (0.0%) |
| 45 to 54 Years | 0 (0.0%) | 0 (0.0%) |
| 55 to 64 Years | 12 (3.4%) | 10 (2.5%) |
| 65 to 74 Years | 5 (4.4%) | 15 (7.5%) |
| 75 Years and over | 0 (0.0%) | 23 (30.7%) |
| Total | 102 (4.1%) | 211 (9.3%) |
Income Above Poverty by Sex and Age in Bloomfield
According to the poverty statistics in Bloomfield, males aged under 5 years and females aged 6 to 11 years are the age groups that are most secure financially, with 100.0% of males and 100.0% of females in these age groups living above the poverty line.
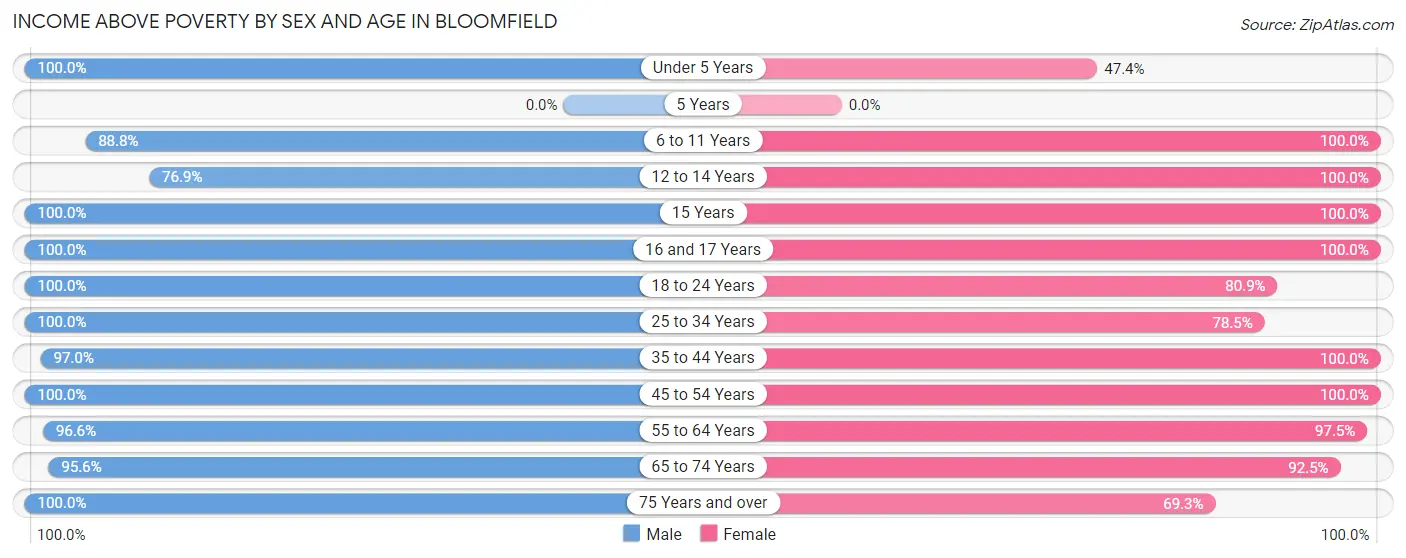
| Age Bracket | Male | Female |
| Under 5 Years | 194 (100.0%) | 37 (47.4%) |
| 5 Years | 0 (0.0%) | 0 (0.0%) |
| 6 to 11 Years | 292 (88.7%) | 180 (100.0%) |
| 12 to 14 Years | 123 (76.9%) | 137 (100.0%) |
| 15 Years | 42 (100.0%) | 73 (100.0%) |
| 16 and 17 Years | 109 (100.0%) | 2 (100.0%) |
| 18 to 24 Years | 156 (100.0%) | 228 (80.8%) |
| 25 to 34 Years | 296 (100.0%) | 248 (78.5%) |
| 35 to 44 Years | 359 (97.0%) | 226 (100.0%) |
| 45 to 54 Years | 294 (100.0%) | 299 (100.0%) |
| 55 to 64 Years | 341 (96.6%) | 392 (97.5%) |
| 65 to 74 Years | 108 (95.6%) | 186 (92.5%) |
| 75 Years and over | 104 (100.0%) | 52 (69.3%) |
| Total | 2,418 (96.0%) | 2,060 (90.7%) |
Income Below Poverty Among Married-Couple Families in Bloomfield
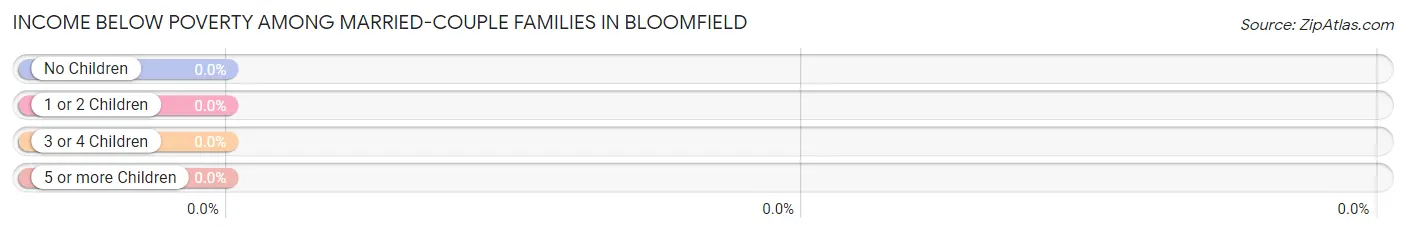
| Children | Above Poverty | Below Poverty |
| No Children | 626 (100.0%) | 0 (0.0%) |
| 1 or 2 Children | 287 (100.0%) | 0 (0.0%) |
| 3 or 4 Children | 91 (100.0%) | 0 (0.0%) |
| 5 or more Children | 0 (0.0%) | 0 (0.0%) |
| Total | 1,004 (100.0%) | 0 (0.0%) |
Income Below Poverty Among Single-Parent Households in Bloomfield
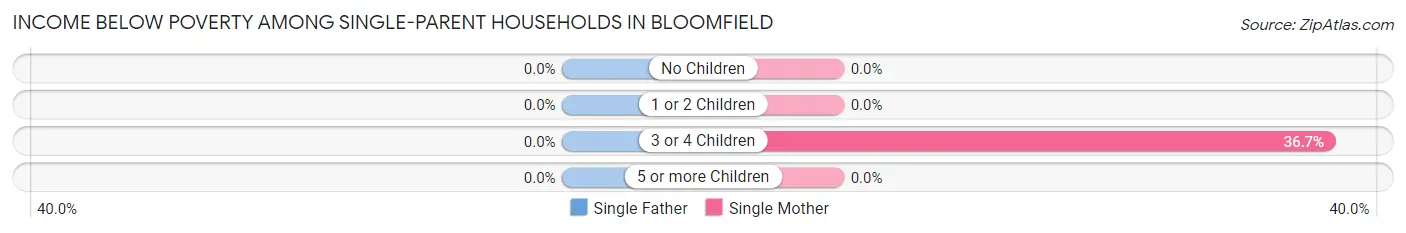
| Children | Single Father | Single Mother |
| No Children | 0 (0.0%) | 0 (0.0%) |
| 1 or 2 Children | 0 (0.0%) | 0 (0.0%) |
| 3 or 4 Children | 0 (0.0%) | 33 (36.7%) |
| 5 or more Children | 0 (0.0%) | 0 (0.0%) |
| Total | 0 (0.0%) | 33 (15.5%) |
Income Below Poverty Among Married-Couple vs Single-Parent Households in Bloomfield
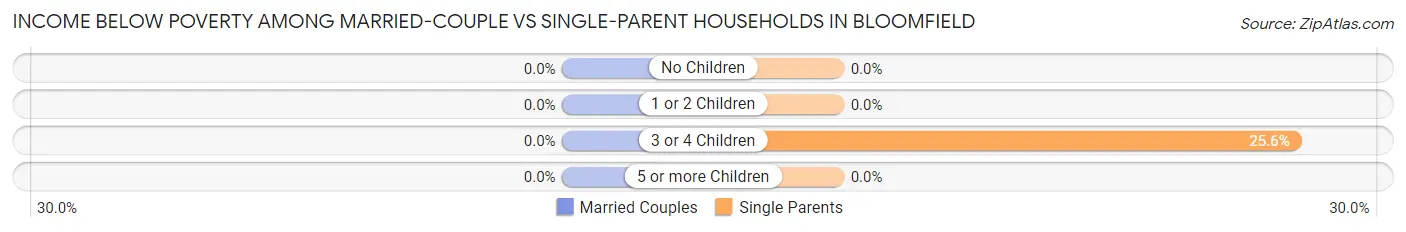
| Children | Married-Couple Families | Single-Parent Households |
| No Children | 0 (0.0%) | 0 (0.0%) |
| 1 or 2 Children | 0 (0.0%) | 0 (0.0%) |
| 3 or 4 Children | 0 (0.0%) | 33 (25.6%) |
| 5 or more Children | 0 (0.0%) | 0 (0.0%) |
| Total | 0 (0.0%) | 33 (10.5%) |
Race in Bloomfield
The most populous races in Bloomfield are White / Caucasian (4,123 | 86.1%), Hispanic or Latino (829 | 17.3%), and Some other Race (310 | 6.5%).
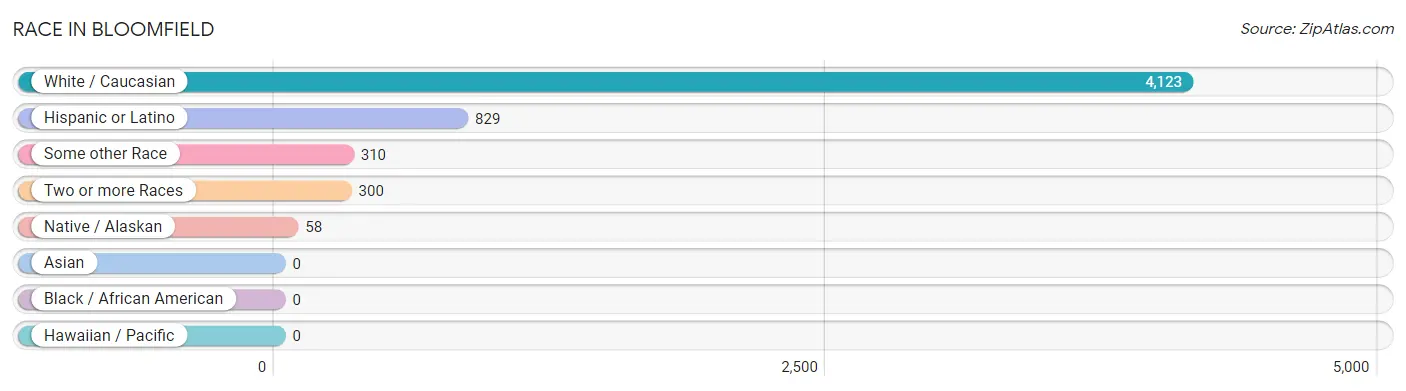
| Race | # Population | % Population |
| Asian | 0 | 0.0% |
| Black / African American | 0 | 0.0% |
| Hawaiian / Pacific | 0 | 0.0% |
| Hispanic or Latino | 829 | 17.3% |
| Native / Alaskan | 58 | 1.2% |
| White / Caucasian | 4,123 | 86.1% |
| Two or more Races | 300 | 6.3% |
| Some other Race | 310 | 6.5% |
| Total | 4,791 | 100.0% |
Ancestry in Bloomfield
The most populous ancestries reported in Bloomfield are German (1,518 | 31.7%), Irish (684 | 14.3%), Mexican (681 | 14.2%), Norwegian (386 | 8.1%), and Polish (359 | 7.5%), together accounting for 75.7% of all Bloomfield residents.
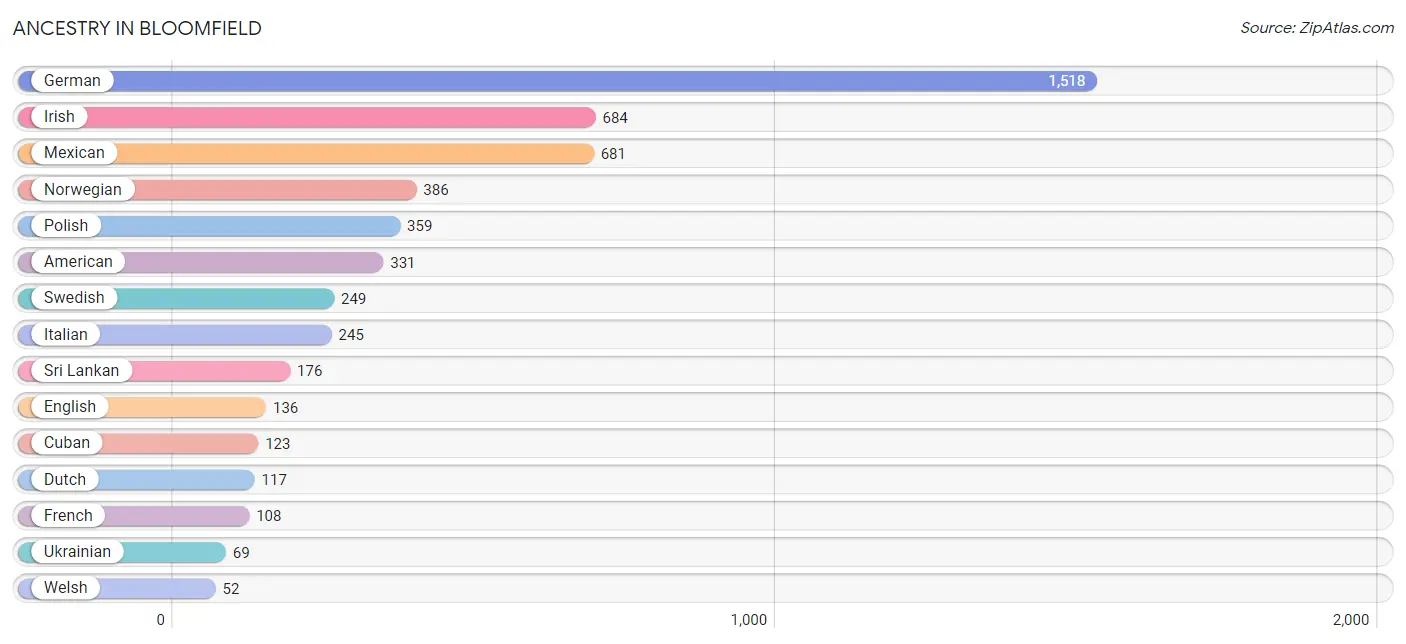
| Ancestry | # Population | % Population |
| American | 331 | 6.9% |
| British | 46 | 1.0% |
| Cuban | 123 | 2.6% |
| Czech | 7 | 0.2% |
| Czechoslovakian | 25 | 0.5% |
| Danish | 22 | 0.5% |
| Dutch | 117 | 2.4% |
| English | 136 | 2.8% |
| French | 108 | 2.2% |
| German | 1,518 | 31.7% |
| Hungarian | 6 | 0.1% |
| Irish | 684 | 14.3% |
| Italian | 245 | 5.1% |
| Mexican | 681 | 14.2% |
| Mexican American Indian | 34 | 0.7% |
| Norwegian | 386 | 8.1% |
| Polish | 359 | 7.5% |
| Puerto Rican | 25 | 0.5% |
| Russian | 15 | 0.3% |
| Scandinavian | 16 | 0.3% |
| Scotch-Irish | 16 | 0.3% |
| Sri Lankan | 176 | 3.7% |
| Swedish | 249 | 5.2% |
| Swiss | 34 | 0.7% |
| Ukrainian | 69 | 1.4% |
| Welsh | 52 | 1.1% |
| Yugoslavian | 6 | 0.1% | View All 27 Rows |
Immigrants in Bloomfield
The most numerous immigrant groups reported in Bloomfield came from Latin America (141 | 2.9%), Central America (105 | 2.2%), Mexico (105 | 2.2%), Eastern Europe (46 | 1.0%), and Europe (46 | 1.0%), together accounting for 9.2% of all Bloomfield residents.
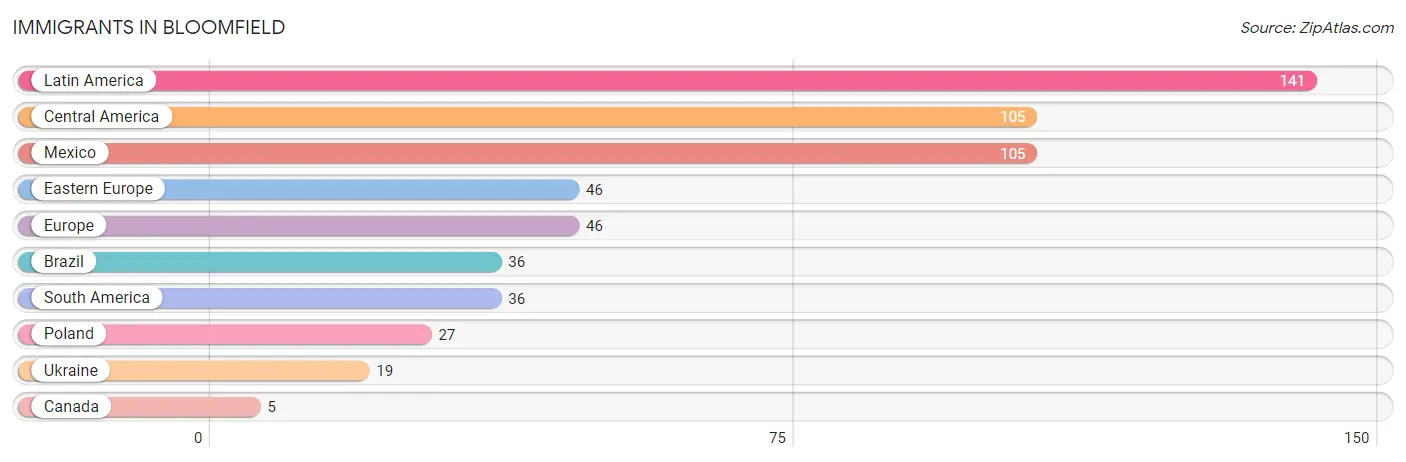
| Immigration Origin | # Population | % Population |
| Brazil | 36 | 0.7% |
| Canada | 5 | 0.1% |
| Central America | 105 | 2.2% |
| Eastern Europe | 46 | 1.0% |
| Europe | 46 | 1.0% |
| Latin America | 141 | 2.9% |
| Mexico | 105 | 2.2% |
| Poland | 27 | 0.6% |
| South America | 36 | 0.7% |
| Ukraine | 19 | 0.4% | View All 10 Rows |
Sex and Age in Bloomfield
Sex and Age in Bloomfield
The most populous age groups in Bloomfield are 35 to 39 Years (319 | 12.7%) for men and 15 to 19 Years (271 | 11.9%) for women.
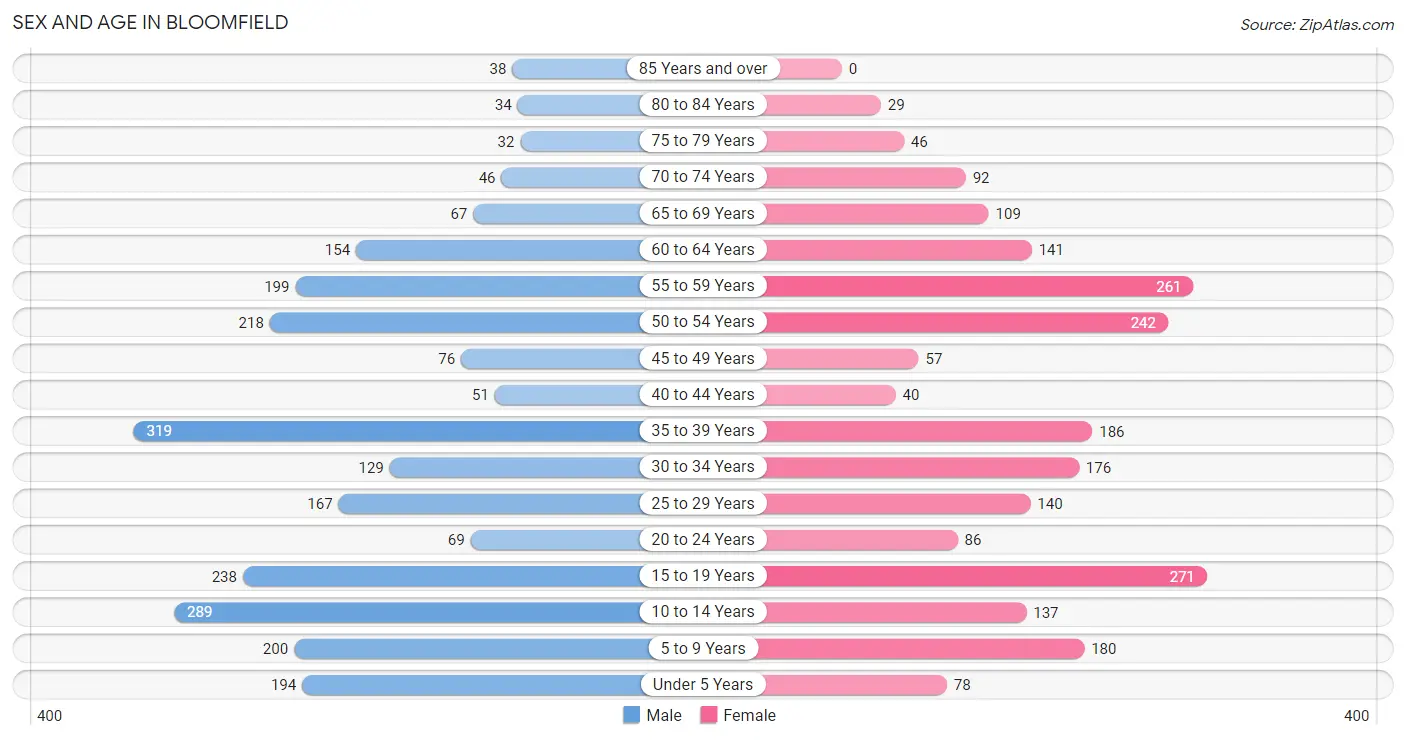
| Age Bracket | Male | Female |
| Under 5 Years | 194 (7.7%) | 78 (3.4%) |
| 5 to 9 Years | 200 (7.9%) | 180 (7.9%) |
| 10 to 14 Years | 289 (11.5%) | 137 (6.0%) |
| 15 to 19 Years | 238 (9.4%) | 271 (11.9%) |
| 20 to 24 Years | 69 (2.7%) | 86 (3.8%) |
| 25 to 29 Years | 167 (6.6%) | 140 (6.2%) |
| 30 to 34 Years | 129 (5.1%) | 176 (7.7%) |
| 35 to 39 Years | 319 (12.7%) | 186 (8.2%) |
| 40 to 44 Years | 51 (2.0%) | 40 (1.8%) |
| 45 to 49 Years | 76 (3.0%) | 57 (2.5%) |
| 50 to 54 Years | 218 (8.6%) | 242 (10.7%) |
| 55 to 59 Years | 199 (7.9%) | 261 (11.5%) |
| 60 to 64 Years | 154 (6.1%) | 141 (6.2%) |
| 65 to 69 Years | 67 (2.7%) | 109 (4.8%) |
| 70 to 74 Years | 46 (1.8%) | 92 (4.1%) |
| 75 to 79 Years | 32 (1.3%) | 46 (2.0%) |
| 80 to 84 Years | 34 (1.3%) | 29 (1.3%) |
| 85 Years and over | 38 (1.5%) | 0 (0.0%) |
| Total | 2,520 (100.0%) | 2,271 (100.0%) |
Families and Households in Bloomfield
Median Family Size in Bloomfield
The median family size in Bloomfield is 3.28 persons per family, with single male/father families (102 | 7.7%) accounting for the largest median family size of 3.82 persons per family. On the other hand, married-couple families (1,004 | 76.1%) represent the smallest median family size with 3.16 persons per family.
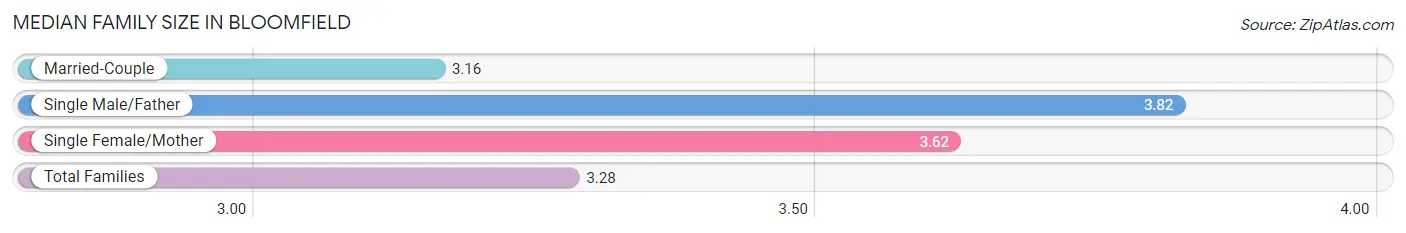
| Family Type | # Families | Family Size |
| Married-Couple | 1,004 (76.1%) | 3.16 |
| Single Male/Father | 102 (7.7%) | 3.82 |
| Single Female/Mother | 213 (16.2%) | 3.62 |
| Total Families | 1,319 (100.0%) | 3.28 |
Median Household Size in Bloomfield
The median household size in Bloomfield is 3.02 persons per household, with single male/father households (102 | 6.4%) accounting for the largest median household size of 4.36 persons per household. non-family households (264 | 16.7%) represent the smallest median household size with 1.17 persons per household.
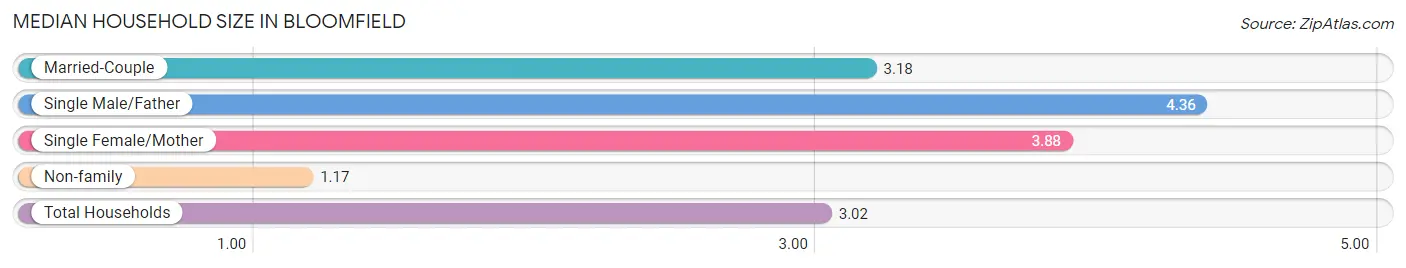
| Household Type | # Households | Household Size |
| Married-Couple | 1,004 (63.4%) | 3.18 |
| Single Male/Father | 102 (6.4%) | 4.36 |
| Single Female/Mother | 213 (13.5%) | 3.88 |
| Non-family | 264 (16.7%) | 1.17 |
| Total Households | 1,583 (100.0%) | 3.02 |
Household Size by Marriage Status in Bloomfield
Out of a total of 1,583 households in Bloomfield, 1,319 (83.3%) are family households, while 264 (16.7%) are nonfamily households. The most numerous type of family households are 2-person households, comprising 412, and the most common type of nonfamily households are 1-person households, comprising 220.
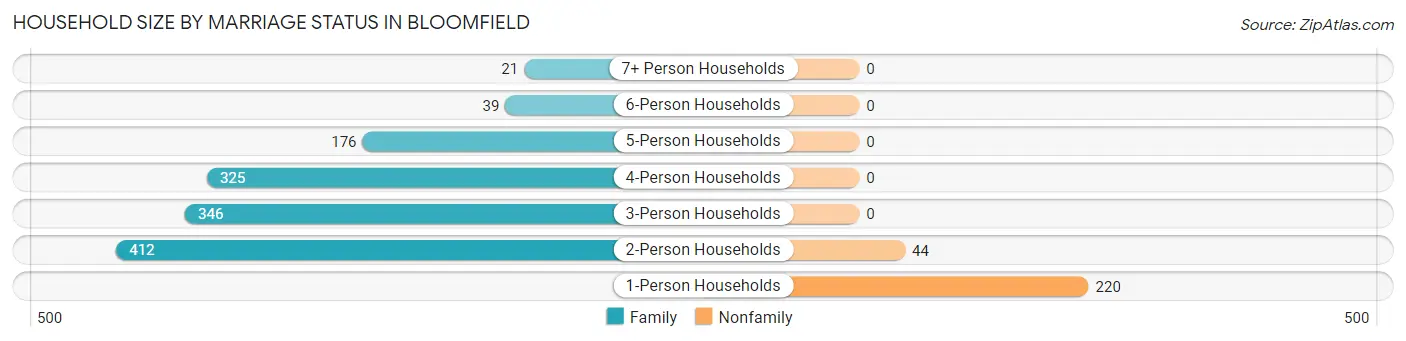
| Household Size | Family Households | Nonfamily Households |
| 1-Person Households | - | 220 (13.9%) |
| 2-Person Households | 412 (26.0%) | 44 (2.8%) |
| 3-Person Households | 346 (21.9%) | 0 (0.0%) |
| 4-Person Households | 325 (20.5%) | 0 (0.0%) |
| 5-Person Households | 176 (11.1%) | 0 (0.0%) |
| 6-Person Households | 39 (2.5%) | 0 (0.0%) |
| 7+ Person Households | 21 (1.3%) | 0 (0.0%) |
| Total | 1,319 (83.3%) | 264 (16.7%) |
Female Fertility in Bloomfield
Fertility by Age in Bloomfield
| Age Bracket | Women with Births | Births / 1,000 Women |
| 15 to 19 years | 0 (0.0%) | 0.0 |
| 20 to 34 years | 0 (0.0%) | 0.0 |
| 35 to 50 years | 0 (0.0%) | 0.0 |
| Total | 0 (0.0%) | 0.0 |
Fertility by Age by Marriage Status in Bloomfield
| Age Bracket | Married | Unmarried |
| 15 to 19 years | 0 (0.0%) | 0 (0.0%) |
| 20 to 34 years | 0 (0.0%) | 0 (0.0%) |
| 35 to 50 years | 0 (0.0%) | 0 (0.0%) |
| Total | 0 (0.0%) | 0 (0.0%) |
Fertility by Education in Bloomfield
| Educational Attainment | Women with Births | Births / 1,000 Women |
| Less than High School | 0 (0.0%) | 0.0 |
| High School Diploma | 0 (0.0%) | 0.0 |
| College or Associate's Degree | 0 (0.0%) | 0.0 |
| Bachelor's Degree | 0 (0.0%) | 0.0 |
| Graduate Degree | 0 (0.0%) | 0.0 |
| Total | 0 (0.0%) | 0.0 |
Fertility by Education by Marriage Status in Bloomfield
| Educational Attainment | Married | Unmarried |
| Less than High School | 0 (0.0%) | 0 (0.0%) |
| High School Diploma | 0 (0.0%) | 0 (0.0%) |
| College or Associate's Degree | 0 (0.0%) | 0 (0.0%) |
| Bachelor's Degree | 0 (0.0%) | 0 (0.0%) |
| Graduate Degree | 0 (0.0%) | 0 (0.0%) |
| Total | 0 (0.0%) | 0 (0.0%) |
Employment Characteristics in Bloomfield
Employment by Class of Employer in Bloomfield
Among the 2,319 employed individuals in Bloomfield, private company employees (1,659 | 71.5%), local government employees (273 | 11.8%), and self-employed (not incorporated) (134 | 5.8%) make up the most common classes of employment.
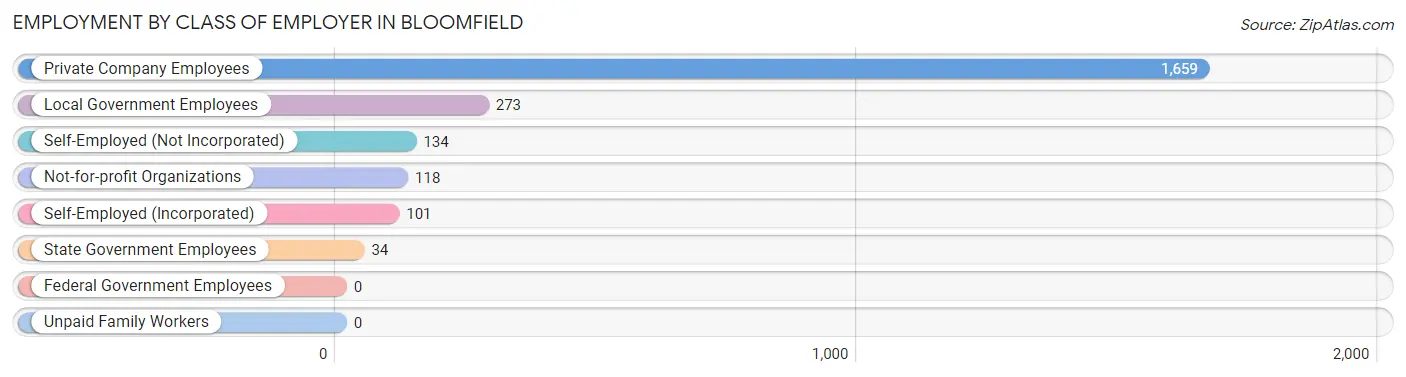
| Employer Class | # Employees | % Employees |
| Private Company Employees | 1,659 | 71.5% |
| Self-Employed (Incorporated) | 101 | 4.4% |
| Self-Employed (Not Incorporated) | 134 | 5.8% |
| Not-for-profit Organizations | 118 | 5.1% |
| Local Government Employees | 273 | 11.8% |
| State Government Employees | 34 | 1.5% |
| Federal Government Employees | 0 | 0.0% |
| Unpaid Family Workers | 0 | 0.0% |
| Total | 2,319 | 100.0% |
Employment Status by Age in Bloomfield
According to the labor force statistics for Bloomfield, out of the total population over 16 years of age (3,598), 71.8% or 2,583 individuals are in the labor force, with 7.2% or 186 of them unemployed. The age group with the highest labor force participation rate is 20 to 24 years, with 100.0% or 155 individuals in the labor force. Within the labor force, the 20 to 24 years age range has the highest percentage of unemployed individuals, with 31.6% or 49 of them being unemployed.
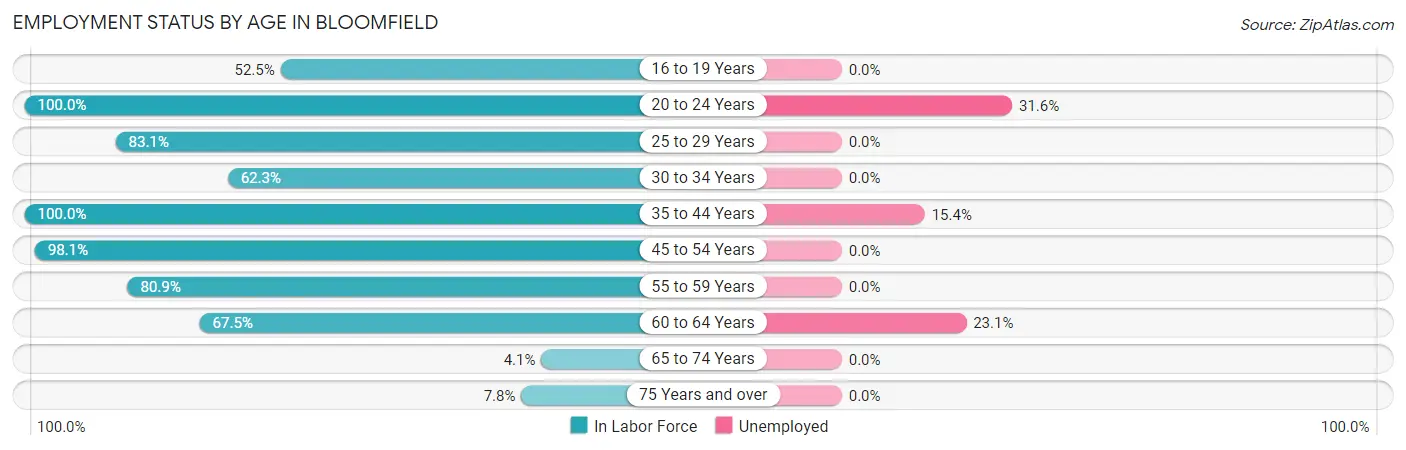
| Age Bracket | In Labor Force | Unemployed |
| 16 to 19 Years | 207 (52.5%) | 0 (0.0%) |
| 20 to 24 Years | 155 (100.0%) | 49 (31.6%) |
| 25 to 29 Years | 255 (83.1%) | 0 (0.0%) |
| 30 to 34 Years | 190 (62.3%) | 0 (0.0%) |
| 35 to 44 Years | 596 (100.0%) | 92 (15.4%) |
| 45 to 54 Years | 582 (98.1%) | 0 (0.0%) |
| 55 to 59 Years | 372 (80.9%) | 0 (0.0%) |
| 60 to 64 Years | 199 (67.5%) | 46 (23.1%) |
| 65 to 74 Years | 13 (4.1%) | 0 (0.0%) |
| 75 Years and over | 14 (7.8%) | 0 (0.0%) |
| Total | 2,583 (71.8%) | 186 (7.2%) |
Employment Status by Educational Attainment in Bloomfield
According to labor force statistics for Bloomfield, 85.8% of individuals (2,193) out of the total population between 25 and 64 years of age (2,556) are in the labor force, with 6.3% or 138 of them being unemployed. The group with the highest labor force participation rate are those with the educational attainment of bachelor's degree or higher, with 97.4% or 371 individuals in the labor force. Within the labor force, individuals with high school diploma education have the highest percentage of unemployment, with 17.7% or 125 of them being unemployed.
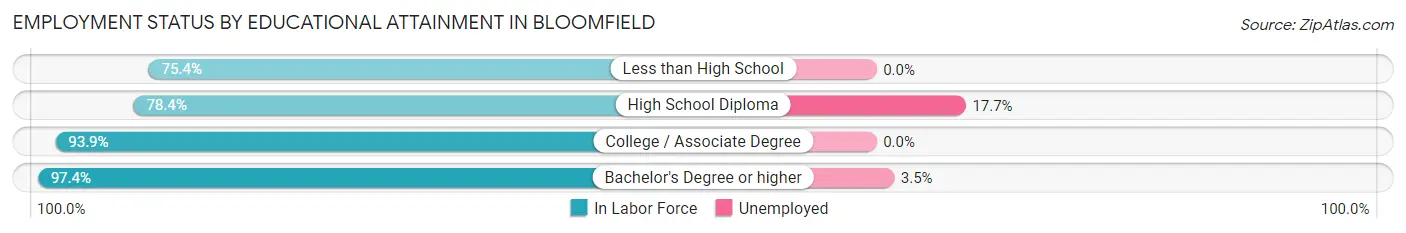
| Educational Attainment | In Labor Force | Unemployed |
| Less than High School | 321 (75.4%) | 0 (0.0%) |
| High School Diploma | 708 (78.4%) | 160 (17.7%) |
| College / Associate Degree | 794 (93.9%) | 0 (0.0%) |
| Bachelor's Degree or higher | 371 (97.4%) | 13 (3.5%) |
| Total | 2,193 (85.8%) | 161 (6.3%) |
Employment Occupations by Sex in Bloomfield
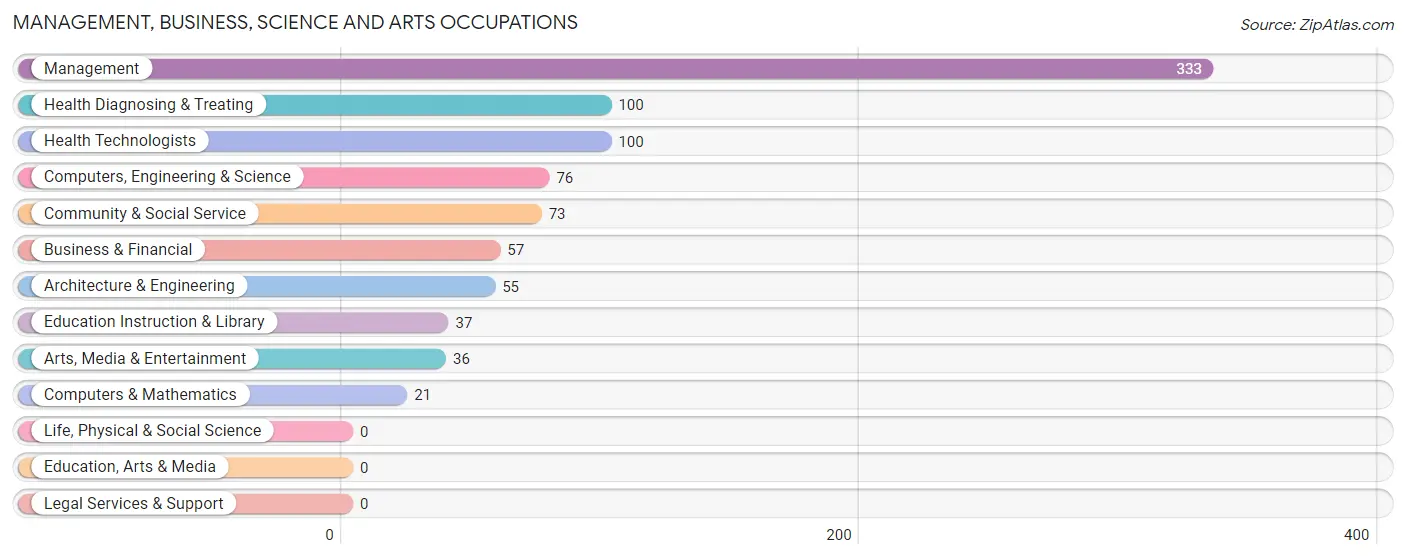
Management, Business, Science and Arts Occupations
The most common Management, Business, Science and Arts occupations in Bloomfield are Management (333 | 13.9%), Health Diagnosing & Treating (100 | 4.2%), Health Technologists (100 | 4.2%), Computers, Engineering & Science (76 | 3.2%), and Community & Social Service (73 | 3.0%).
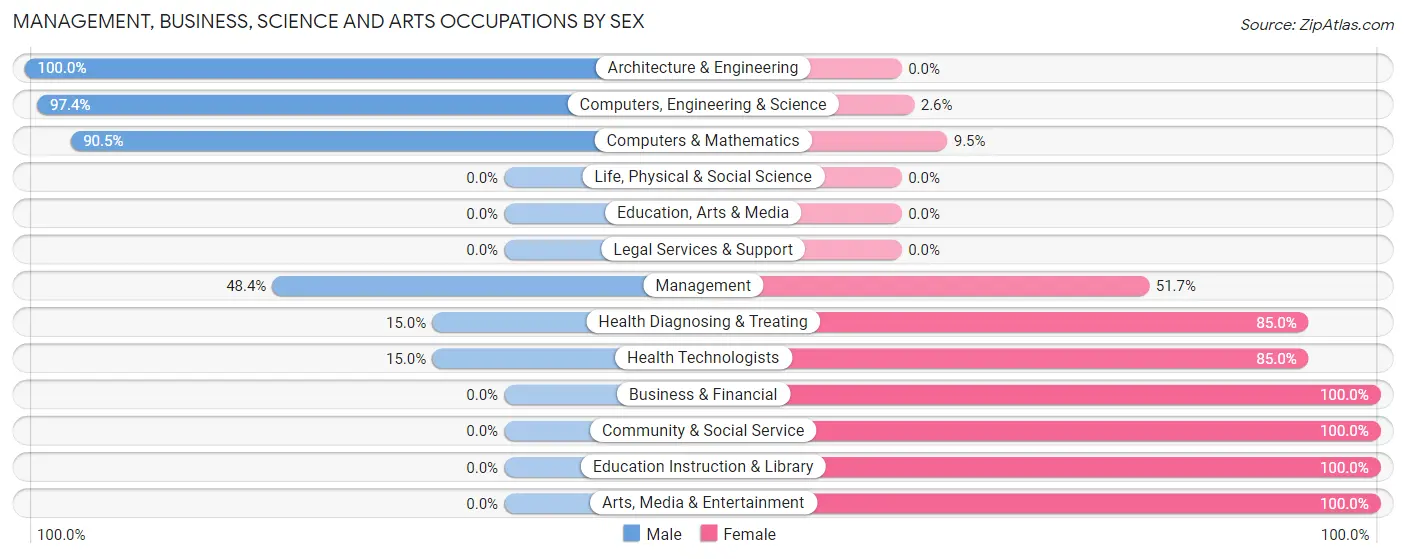
Management, Business, Science and Arts Occupations by Sex
Within the Management, Business, Science and Arts occupations in Bloomfield, the most male-oriented occupations are Architecture & Engineering (100.0%), Computers, Engineering & Science (97.4%), and Computers & Mathematics (90.5%), while the most female-oriented occupations are Business & Financial (100.0%), Community & Social Service (100.0%), and Education Instruction & Library (100.0%).
| Occupation | Male | Female |
| Management | 161 (48.3%) | 172 (51.6%) |
| Business & Financial | 0 (0.0%) | 57 (100.0%) |
| Computers, Engineering & Science | 74 (97.4%) | 2 (2.6%) |
| Computers & Mathematics | 19 (90.5%) | 2 (9.5%) |
| Architecture & Engineering | 55 (100.0%) | 0 (0.0%) |
| Life, Physical & Social Science | 0 (0.0%) | 0 (0.0%) |
| Community & Social Service | 0 (0.0%) | 73 (100.0%) |
| Education, Arts & Media | 0 (0.0%) | 0 (0.0%) |
| Legal Services & Support | 0 (0.0%) | 0 (0.0%) |
| Education Instruction & Library | 0 (0.0%) | 37 (100.0%) |
| Arts, Media & Entertainment | 0 (0.0%) | 36 (100.0%) |
| Health Diagnosing & Treating | 15 (15.0%) | 85 (85.0%) |
| Health Technologists | 15 (15.0%) | 85 (85.0%) |
| Total (Category) | 250 (39.1%) | 389 (60.9%) |
| Total (Overall) | 1,342 (56.0%) | 1,054 (44.0%) |
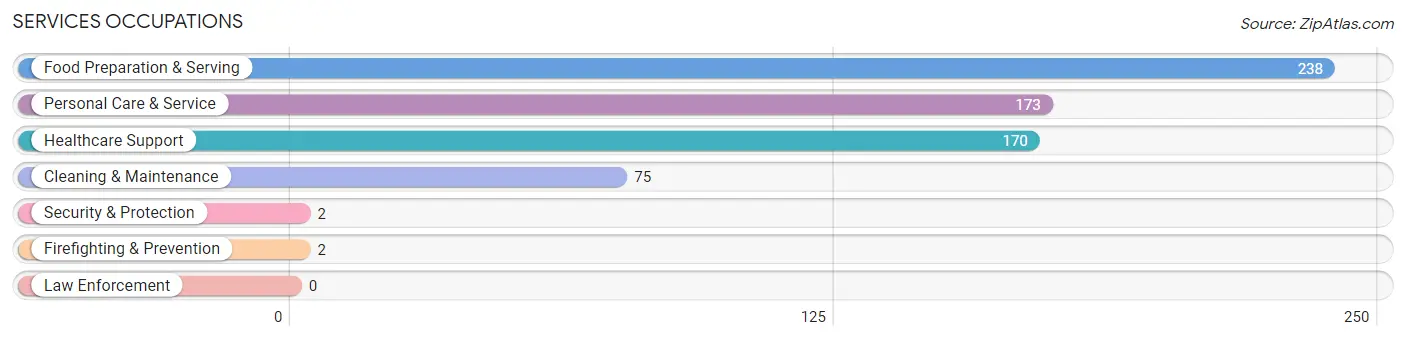
Services Occupations
The most common Services occupations in Bloomfield are Food Preparation & Serving (238 | 9.9%), Personal Care & Service (173 | 7.2%), Healthcare Support (170 | 7.1%), Cleaning & Maintenance (75 | 3.1%), and Security & Protection (2 | 0.1%).
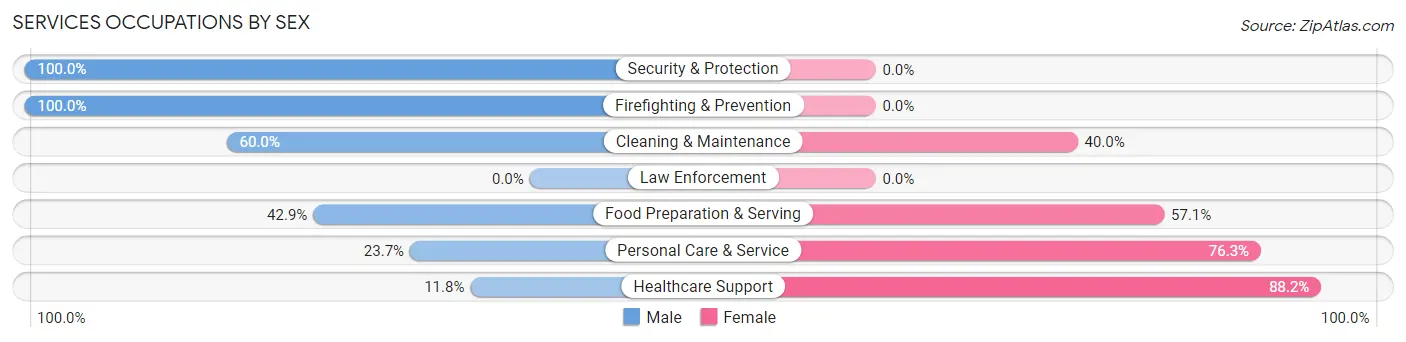
Services Occupations by Sex
Within the Services occupations in Bloomfield, the most male-oriented occupations are Security & Protection (100.0%), Firefighting & Prevention (100.0%), and Cleaning & Maintenance (60.0%), while the most female-oriented occupations are Healthcare Support (88.2%), Personal Care & Service (76.3%), and Food Preparation & Serving (57.1%).
| Occupation | Male | Female |
| Healthcare Support | 20 (11.8%) | 150 (88.2%) |
| Security & Protection | 2 (100.0%) | 0 (0.0%) |
| Firefighting & Prevention | 2 (100.0%) | 0 (0.0%) |
| Law Enforcement | 0 (0.0%) | 0 (0.0%) |
| Food Preparation & Serving | 102 (42.9%) | 136 (57.1%) |
| Cleaning & Maintenance | 45 (60.0%) | 30 (40.0%) |
| Personal Care & Service | 41 (23.7%) | 132 (76.3%) |
| Total (Category) | 210 (31.9%) | 448 (68.1%) |
| Total (Overall) | 1,342 (56.0%) | 1,054 (44.0%) |
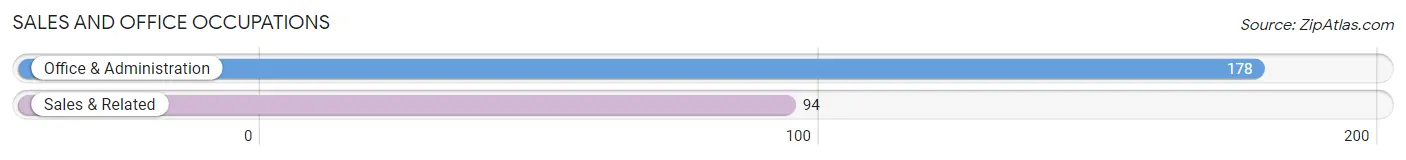
Sales and Office Occupations
The most common Sales and Office occupations in Bloomfield are Office & Administration (178 | 7.4%), and Sales & Related (94 | 3.9%).
Sales and Office Occupations by Sex
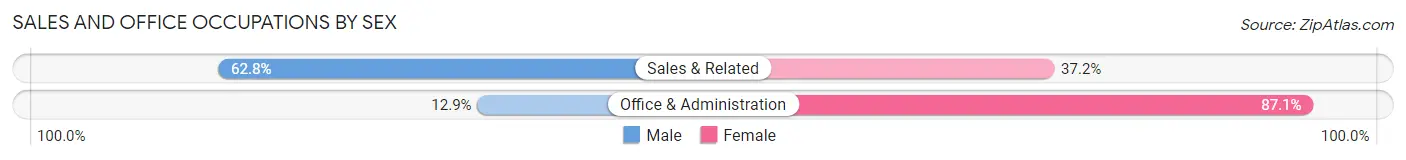
| Occupation | Male | Female |
| Sales & Related | 59 (62.8%) | 35 (37.2%) |
| Office & Administration | 23 (12.9%) | 155 (87.1%) |
| Total (Category) | 82 (30.1%) | 190 (69.9%) |
| Total (Overall) | 1,342 (56.0%) | 1,054 (44.0%) |
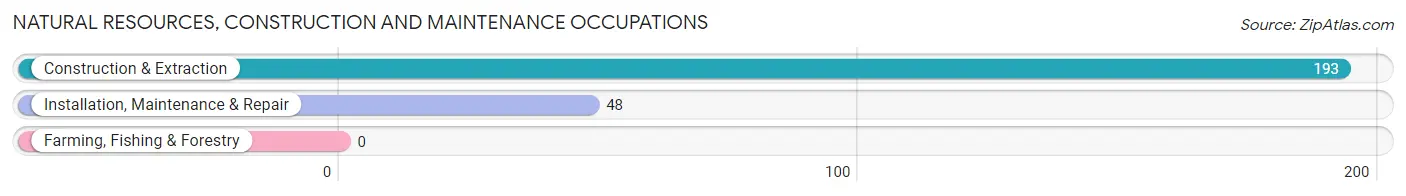
Natural Resources, Construction and Maintenance Occupations
The most common Natural Resources, Construction and Maintenance occupations in Bloomfield are Construction & Extraction (193 | 8.1%), and Installation, Maintenance & Repair (48 | 2.0%).
Natural Resources, Construction and Maintenance Occupations by Sex
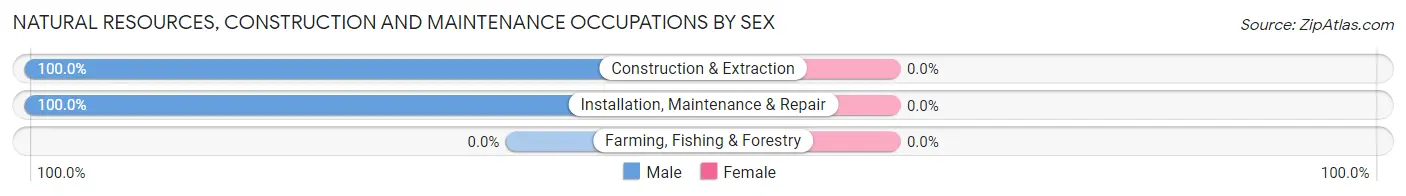
| Occupation | Male | Female |
| Farming, Fishing & Forestry | 0 (0.0%) | 0 (0.0%) |
| Construction & Extraction | 193 (100.0%) | 0 (0.0%) |
| Installation, Maintenance & Repair | 48 (100.0%) | 0 (0.0%) |
| Total (Category) | 241 (100.0%) | 0 (0.0%) |
| Total (Overall) | 1,342 (56.0%) | 1,054 (44.0%) |
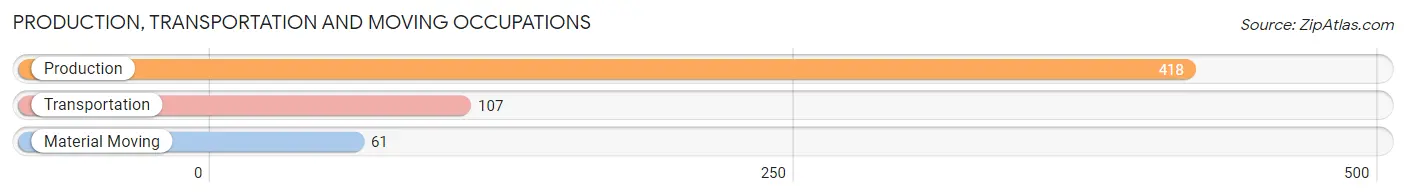
Production, Transportation and Moving Occupations
The most common Production, Transportation and Moving occupations in Bloomfield are Production (418 | 17.4%), Transportation (107 | 4.5%), and Material Moving (61 | 2.5%).
Production, Transportation and Moving Occupations by Sex
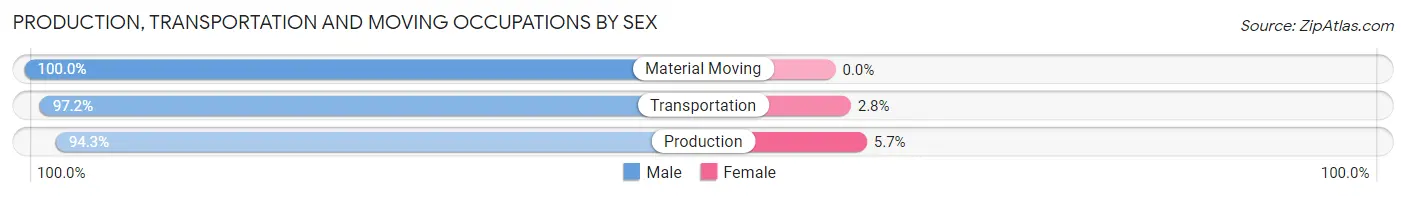
| Occupation | Male | Female |
| Production | 394 (94.3%) | 24 (5.7%) |
| Transportation | 104 (97.2%) | 3 (2.8%) |
| Material Moving | 61 (100.0%) | 0 (0.0%) |
| Total (Category) | 559 (95.4%) | 27 (4.6%) |
| Total (Overall) | 1,342 (56.0%) | 1,054 (44.0%) |
Employment Industries by Sex in Bloomfield
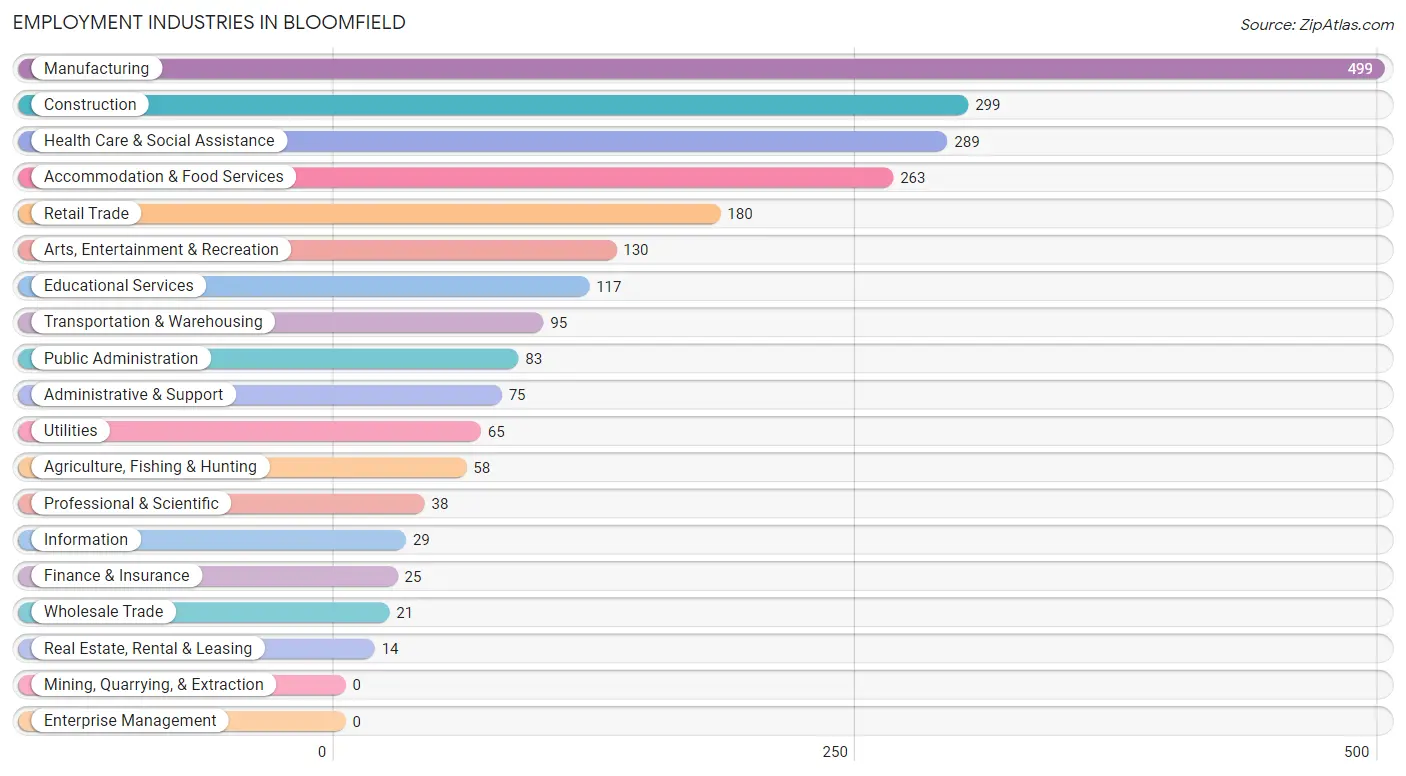
Employment Industries in Bloomfield
The major employment industries in Bloomfield include Manufacturing (499 | 20.8%), Construction (299 | 12.5%), Health Care & Social Assistance (289 | 12.1%), Accommodation & Food Services (263 | 11.0%), and Retail Trade (180 | 7.5%).
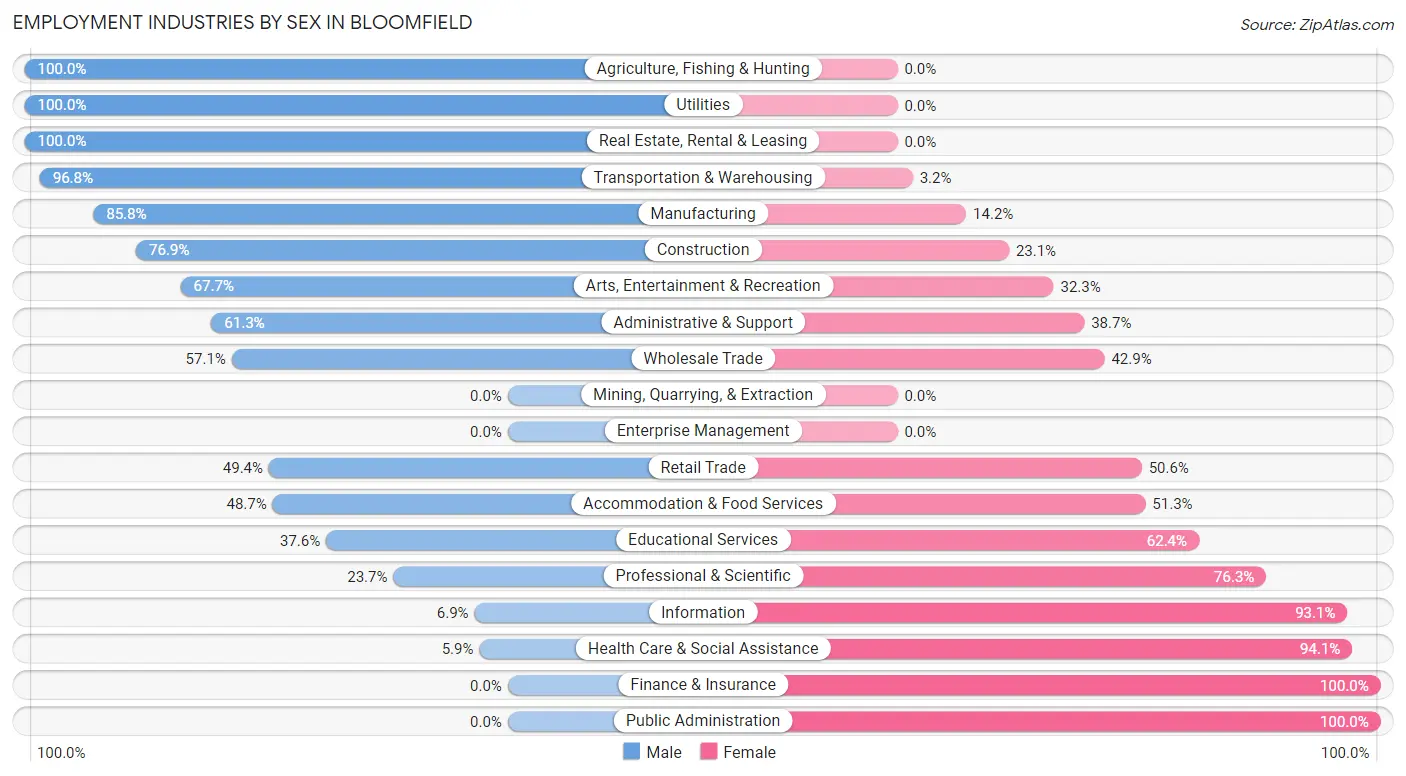
Employment Industries by Sex in Bloomfield
The Bloomfield industries that see more men than women are Agriculture, Fishing & Hunting (100.0%), Utilities (100.0%), and Real Estate, Rental & Leasing (100.0%), whereas the industries that tend to have a higher number of women are Finance & Insurance (100.0%), Public Administration (100.0%), and Health Care & Social Assistance (94.1%).
| Industry | Male | Female |
| Agriculture, Fishing & Hunting | 58 (100.0%) | 0 (0.0%) |
| Mining, Quarrying, & Extraction | 0 (0.0%) | 0 (0.0%) |
| Construction | 230 (76.9%) | 69 (23.1%) |
| Manufacturing | 428 (85.8%) | 71 (14.2%) |
| Wholesale Trade | 12 (57.1%) | 9 (42.9%) |
| Retail Trade | 89 (49.4%) | 91 (50.6%) |
| Transportation & Warehousing | 92 (96.8%) | 3 (3.2%) |
| Utilities | 65 (100.0%) | 0 (0.0%) |
| Information | 2 (6.9%) | 27 (93.1%) |
| Finance & Insurance | 0 (0.0%) | 25 (100.0%) |
| Real Estate, Rental & Leasing | 14 (100.0%) | 0 (0.0%) |
| Professional & Scientific | 9 (23.7%) | 29 (76.3%) |
| Enterprise Management | 0 (0.0%) | 0 (0.0%) |
| Administrative & Support | 46 (61.3%) | 29 (38.7%) |
| Educational Services | 44 (37.6%) | 73 (62.4%) |
| Health Care & Social Assistance | 17 (5.9%) | 272 (94.1%) |
| Arts, Entertainment & Recreation | 88 (67.7%) | 42 (32.3%) |
| Accommodation & Food Services | 128 (48.7%) | 135 (51.3%) |
| Public Administration | 0 (0.0%) | 83 (100.0%) |
| Total | 1,342 (56.0%) | 1,054 (44.0%) |
Education in Bloomfield
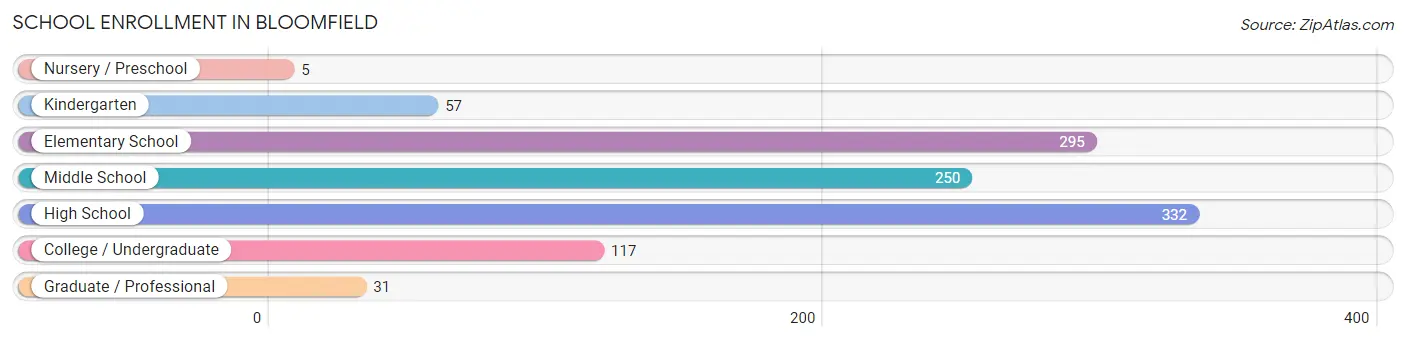
School Enrollment in Bloomfield
The most common levels of schooling among the 1,087 students in Bloomfield are high school (332 | 30.5%), elementary school (295 | 27.1%), and middle school (250 | 23.0%).
| School Level | # Students | % Students |
| Nursery / Preschool | 5 | 0.5% |
| Kindergarten | 57 | 5.2% |
| Elementary School | 295 | 27.1% |
| Middle School | 250 | 23.0% |
| High School | 332 | 30.5% |
| College / Undergraduate | 117 | 10.8% |
| Graduate / Professional | 31 | 2.9% |
| Total | 1,087 | 100.0% |
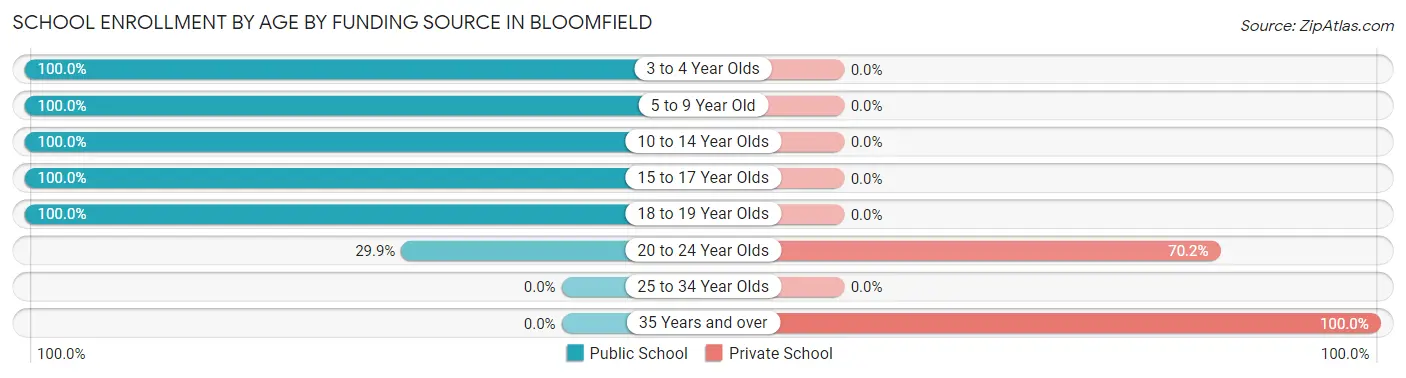
School Enrollment by Age by Funding Source in Bloomfield
Out of a total of 1,087 students who are enrolled in schools in Bloomfield, 93 (8.6%) attend a private institution, while the remaining 994 (91.4%) are enrolled in public schools. The age group of 35 years and over has the highest likelihood of being enrolled in private schools, with 46 (100.0% in the age bracket) enrolled. Conversely, the age group of 3 to 4 year olds has the lowest likelihood of being enrolled in a private school, with 46 (100.0% in the age bracket) attending a public institution.
| Age Bracket | Public School | Private School |
| 3 to 4 Year Olds | 46 (100.0%) | 0 (0.0%) |
| 5 to 9 Year Old | 254 (100.0%) | 0 (0.0%) |
| 10 to 14 Year Olds | 362 (100.0%) | 0 (0.0%) |
| 15 to 17 Year Olds | 202 (100.0%) | 0 (0.0%) |
| 18 to 19 Year Olds | 110 (100.0%) | 0 (0.0%) |
| 20 to 24 Year Olds | 20 (29.8%) | 47 (70.2%) |
| 25 to 34 Year Olds | 0 (0.0%) | 0 (0.0%) |
| 35 Years and over | 0 (0.0%) | 46 (100.0%) |
| Total | 994 (91.4%) | 93 (8.6%) |
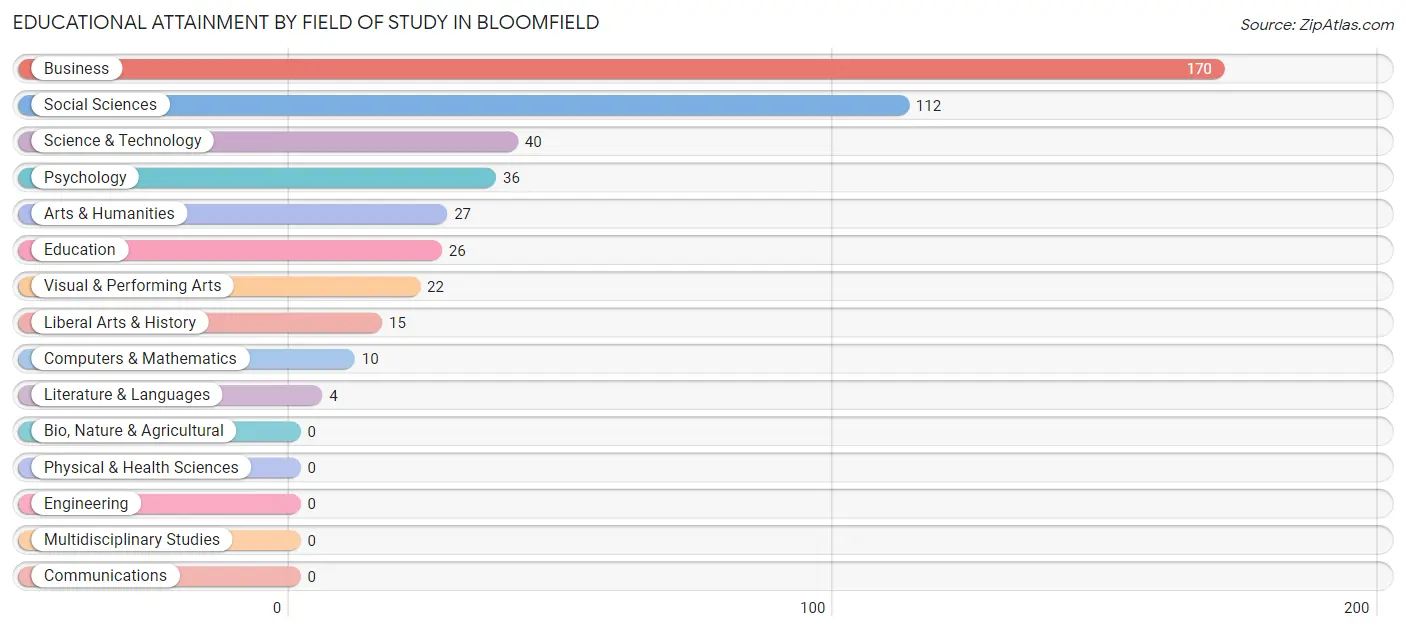
Educational Attainment by Field of Study in Bloomfield
Business (170 | 36.8%), social sciences (112 | 24.2%), science & technology (40 | 8.7%), psychology (36 | 7.8%), and arts & humanities (27 | 5.8%) are the most common fields of study among 462 individuals in Bloomfield who have obtained a bachelor's degree or higher.
| Field of Study | # Graduates | % Graduates |
| Computers & Mathematics | 10 | 2.2% |
| Bio, Nature & Agricultural | 0 | 0.0% |
| Physical & Health Sciences | 0 | 0.0% |
| Psychology | 36 | 7.8% |
| Social Sciences | 112 | 24.2% |
| Engineering | 0 | 0.0% |
| Multidisciplinary Studies | 0 | 0.0% |
| Science & Technology | 40 | 8.7% |
| Business | 170 | 36.8% |
| Education | 26 | 5.6% |
| Literature & Languages | 4 | 0.9% |
| Liberal Arts & History | 15 | 3.3% |
| Visual & Performing Arts | 22 | 4.8% |
| Communications | 0 | 0.0% |
| Arts & Humanities | 27 | 5.8% |
| Total | 462 | 100.0% |
Transportation & Commute in Bloomfield
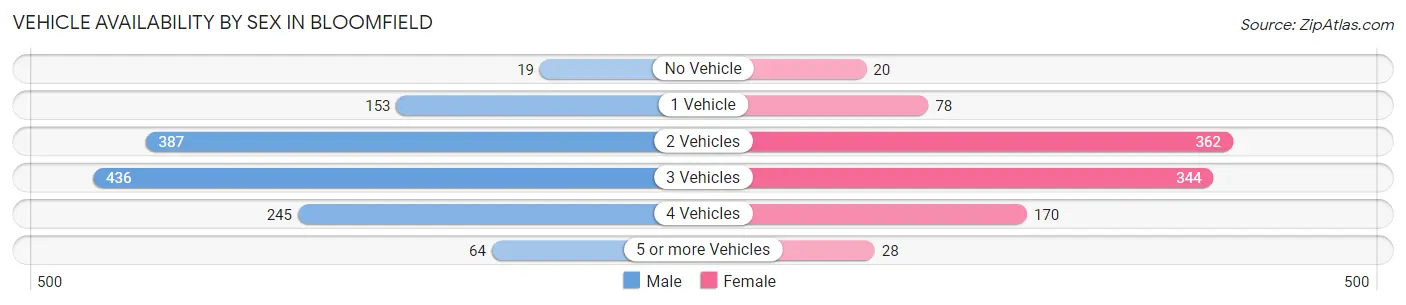
Vehicle Availability by Sex in Bloomfield
The most prevalent vehicle ownership categories in Bloomfield are males with 3 vehicles (436, accounting for 33.4%) and females with 3 vehicles (344, making up 43.5%).
| Vehicles Available | Male | Female |
| No Vehicle | 19 (1.5%) | 20 (2.0%) |
| 1 Vehicle | 153 (11.7%) | 78 (7.8%) |
| 2 Vehicles | 387 (29.7%) | 362 (36.1%) |
| 3 Vehicles | 436 (33.4%) | 344 (34.3%) |
| 4 Vehicles | 245 (18.8%) | 170 (17.0%) |
| 5 or more Vehicles | 64 (4.9%) | 28 (2.8%) |
| Total | 1,304 (100.0%) | 1,002 (100.0%) |
Commute Time in Bloomfield
The most frequently occuring commute durations in Bloomfield are 15 to 19 minutes (301 commuters, 14.1%), 30 to 34 minutes (288 commuters, 13.5%), and 90 or more minutes (274 commuters, 12.9%).
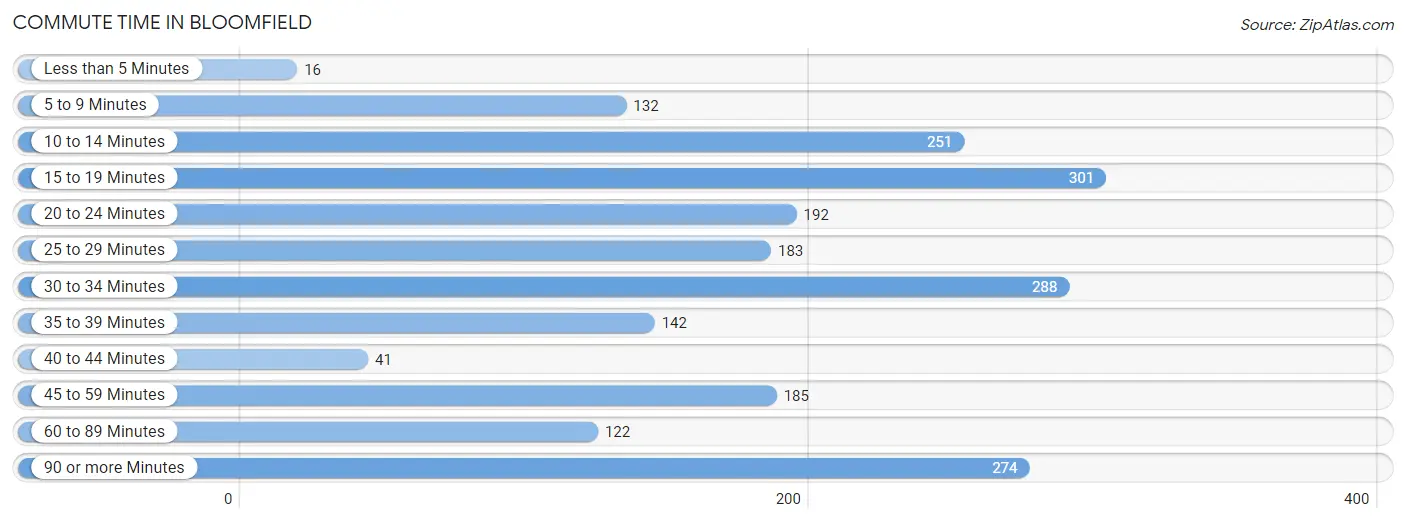
| Commute Time | # Commuters | % Commuters |
| Less than 5 Minutes | 16 | 0.7% |
| 5 to 9 Minutes | 132 | 6.2% |
| 10 to 14 Minutes | 251 | 11.8% |
| 15 to 19 Minutes | 301 | 14.1% |
| 20 to 24 Minutes | 192 | 9.0% |
| 25 to 29 Minutes | 183 | 8.6% |
| 30 to 34 Minutes | 288 | 13.5% |
| 35 to 39 Minutes | 142 | 6.7% |
| 40 to 44 Minutes | 41 | 1.9% |
| 45 to 59 Minutes | 185 | 8.7% |
| 60 to 89 Minutes | 122 | 5.7% |
| 90 or more Minutes | 274 | 12.9% |
Commute Time by Sex in Bloomfield
The most common commute times in Bloomfield are 30 to 34 minutes (194 commuters, 16.1%) for males and 15 to 19 minutes (166 commuters, 18.1%) for females.
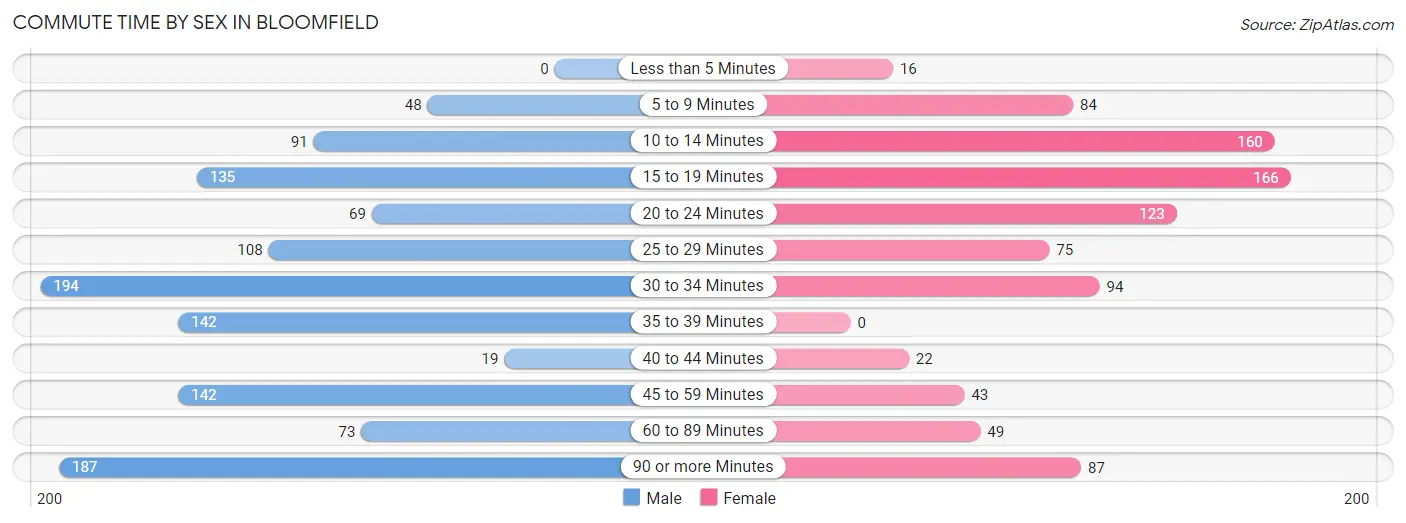
| Commute Time | Male | Female |
| Less than 5 Minutes | 0 (0.0%) | 16 (1.7%) |
| 5 to 9 Minutes | 48 (4.0%) | 84 (9.1%) |
| 10 to 14 Minutes | 91 (7.5%) | 160 (17.4%) |
| 15 to 19 Minutes | 135 (11.2%) | 166 (18.1%) |
| 20 to 24 Minutes | 69 (5.7%) | 123 (13.4%) |
| 25 to 29 Minutes | 108 (8.9%) | 75 (8.2%) |
| 30 to 34 Minutes | 194 (16.1%) | 94 (10.2%) |
| 35 to 39 Minutes | 142 (11.7%) | 0 (0.0%) |
| 40 to 44 Minutes | 19 (1.6%) | 22 (2.4%) |
| 45 to 59 Minutes | 142 (11.7%) | 43 (4.7%) |
| 60 to 89 Minutes | 73 (6.0%) | 49 (5.3%) |
| 90 or more Minutes | 187 (15.5%) | 87 (9.5%) |
Time of Departure to Work by Sex in Bloomfield
The most frequent times of departure to work in Bloomfield are 5:00 AM to 5:29 AM (273, 22.6%) for males and 7:00 AM to 7:29 AM (285, 31.0%) for females.
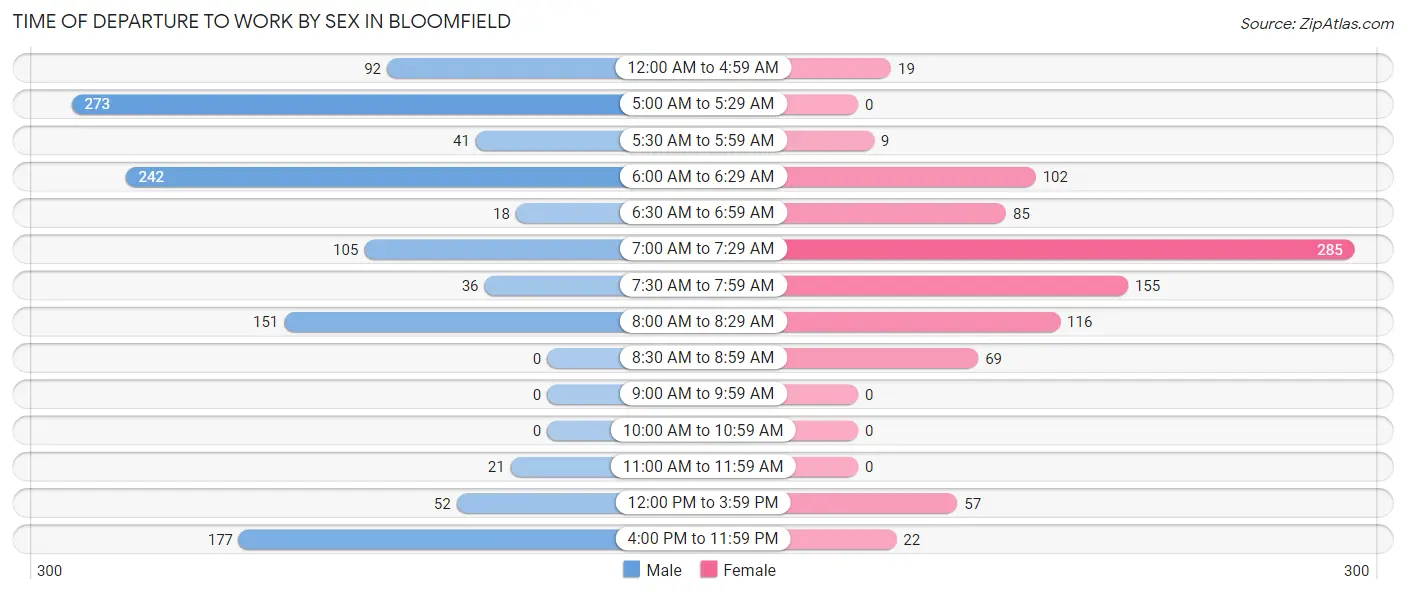
| Time of Departure | Male | Female |
| 12:00 AM to 4:59 AM | 92 (7.6%) | 19 (2.1%) |
| 5:00 AM to 5:29 AM | 273 (22.6%) | 0 (0.0%) |
| 5:30 AM to 5:59 AM | 41 (3.4%) | 9 (1.0%) |
| 6:00 AM to 6:29 AM | 242 (20.0%) | 102 (11.1%) |
| 6:30 AM to 6:59 AM | 18 (1.5%) | 85 (9.2%) |
| 7:00 AM to 7:29 AM | 105 (8.7%) | 285 (31.0%) |
| 7:30 AM to 7:59 AM | 36 (3.0%) | 155 (16.9%) |
| 8:00 AM to 8:29 AM | 151 (12.5%) | 116 (12.6%) |
| 8:30 AM to 8:59 AM | 0 (0.0%) | 69 (7.5%) |
| 9:00 AM to 9:59 AM | 0 (0.0%) | 0 (0.0%) |
| 10:00 AM to 10:59 AM | 0 (0.0%) | 0 (0.0%) |
| 11:00 AM to 11:59 AM | 21 (1.7%) | 0 (0.0%) |
| 12:00 PM to 3:59 PM | 52 (4.3%) | 57 (6.2%) |
| 4:00 PM to 11:59 PM | 177 (14.6%) | 22 (2.4%) |
| Total | 1,208 (100.0%) | 919 (100.0%) |
Housing Occupancy in Bloomfield
Occupancy by Ownership in Bloomfield
Of the total 1,583 dwellings in Bloomfield, owner-occupied units account for 1,254 (79.2%), while renter-occupied units make up 329 (20.8%).
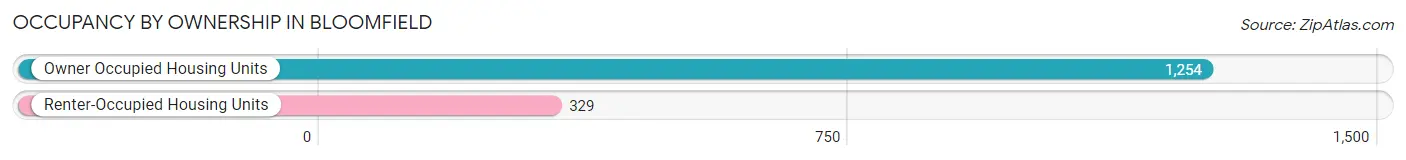
| Occupancy | # Housing Units | % Housing Units |
| Owner Occupied Housing Units | 1,254 | 79.2% |
| Renter-Occupied Housing Units | 329 | 20.8% |
| Total Occupied Housing Units | 1,583 | 100.0% |
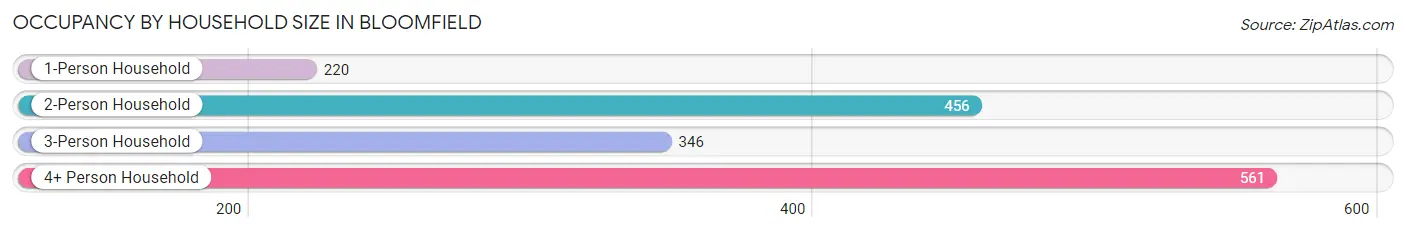
Occupancy by Household Size in Bloomfield
| Household Size | # Housing Units | % Housing Units |
| 1-Person Household | 220 | 13.9% |
| 2-Person Household | 456 | 28.8% |
| 3-Person Household | 346 | 21.9% |
| 4+ Person Household | 561 | 35.4% |
| Total Housing Units | 1,583 | 100.0% |
Occupancy by Ownership by Household Size in Bloomfield
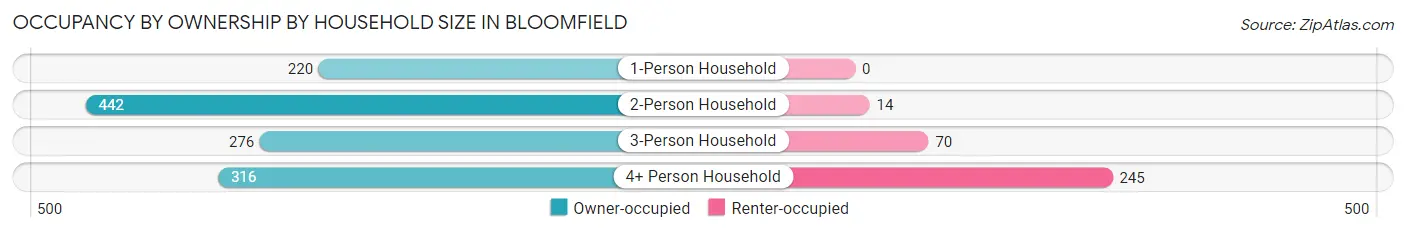
| Household Size | Owner-occupied | Renter-occupied |
| 1-Person Household | 220 (100.0%) | 0 (0.0%) |
| 2-Person Household | 442 (96.9%) | 14 (3.1%) |
| 3-Person Household | 276 (79.8%) | 70 (20.2%) |
| 4+ Person Household | 316 (56.3%) | 245 (43.7%) |
| Total Housing Units | 1,254 (79.2%) | 329 (20.8%) |
Occupancy by Educational Attainment in Bloomfield
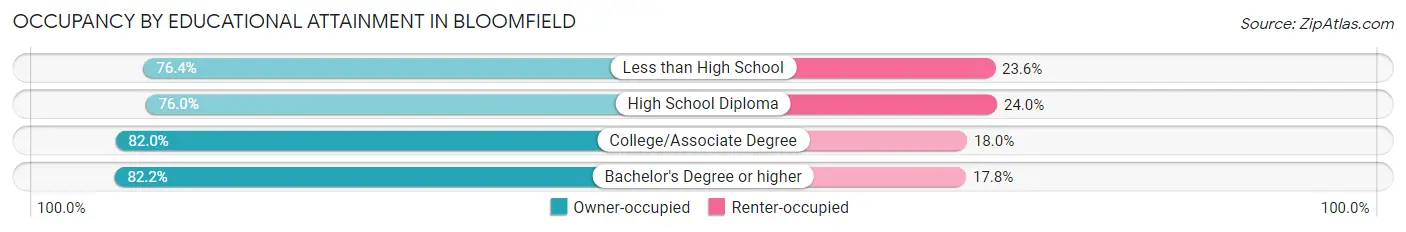
| Household Size | Owner-occupied | Renter-occupied |
| Less than High School | 172 (76.4%) | 53 (23.6%) |
| High School Diploma | 406 (76.0%) | 128 (24.0%) |
| College/Associate Degree | 510 (82.0%) | 112 (18.0%) |
| Bachelor's Degree or higher | 166 (82.2%) | 36 (17.8%) |
Occupancy by Age of Householder in Bloomfield
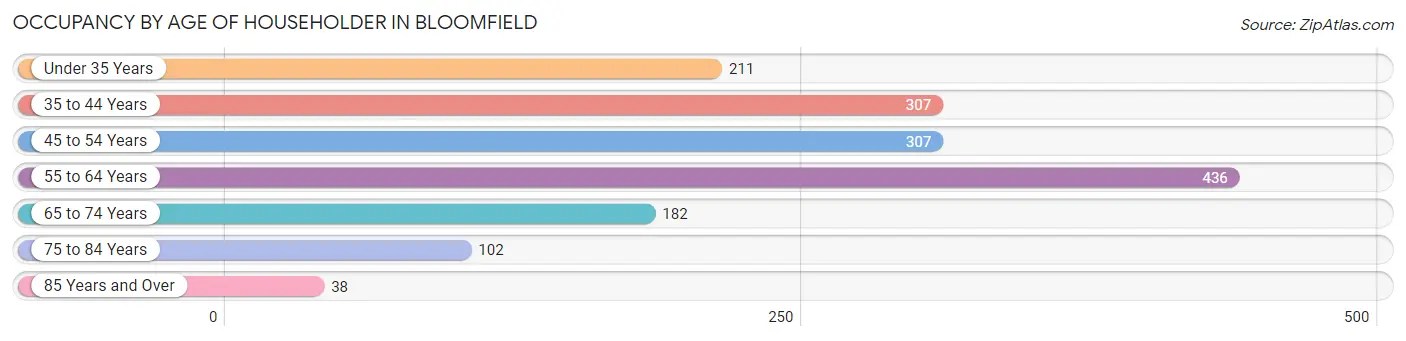
| Age Bracket | # Households | % Households |
| Under 35 Years | 211 | 13.3% |
| 35 to 44 Years | 307 | 19.4% |
| 45 to 54 Years | 307 | 19.4% |
| 55 to 64 Years | 436 | 27.5% |
| 65 to 74 Years | 182 | 11.5% |
| 75 to 84 Years | 102 | 6.4% |
| 85 Years and Over | 38 | 2.4% |
| Total | 1,583 | 100.0% |
Housing Finances in Bloomfield
Median Income by Occupancy in Bloomfield
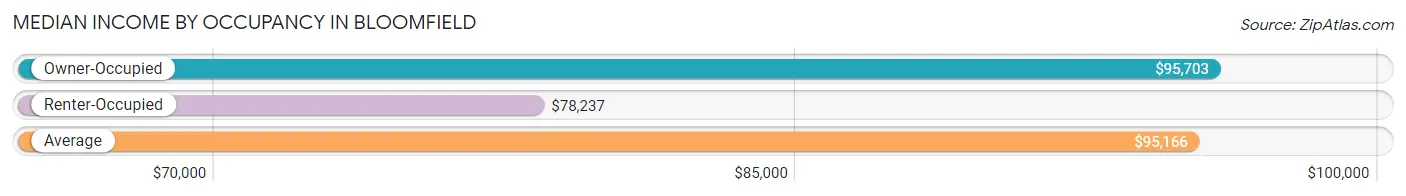
| Occupancy Type | # Households | Median Income |
| Owner-Occupied | 1,254 (79.2%) | $95,703 |
| Renter-Occupied | 329 (20.8%) | $78,237 |
| Average | 1,583 (100.0%) | $95,166 |
Occupancy by Householder Income Bracket in Bloomfield
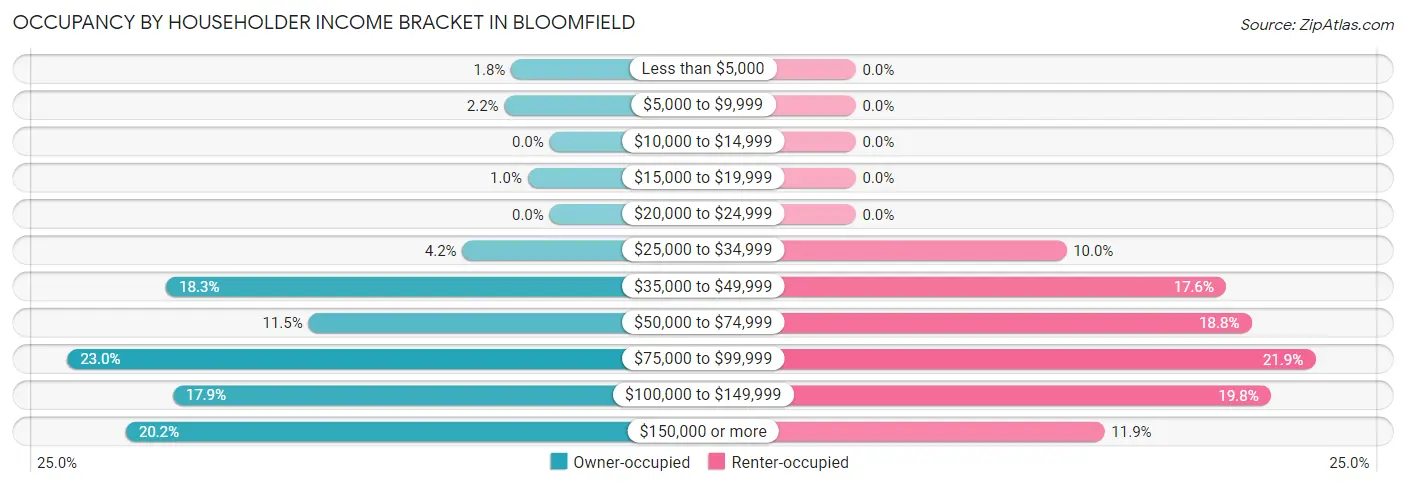
| Income Bracket | Owner-occupied | Renter-occupied |
| Less than $5,000 | 23 (1.8%) | 0 (0.0%) |
| $5,000 to $9,999 | 27 (2.1%) | 0 (0.0%) |
| $10,000 to $14,999 | 0 (0.0%) | 0 (0.0%) |
| $15,000 to $19,999 | 13 (1.0%) | 0 (0.0%) |
| $20,000 to $24,999 | 0 (0.0%) | 0 (0.0%) |
| $25,000 to $34,999 | 52 (4.2%) | 33 (10.0%) |
| $35,000 to $49,999 | 229 (18.3%) | 58 (17.6%) |
| $50,000 to $74,999 | 144 (11.5%) | 62 (18.8%) |
| $75,000 to $99,999 | 288 (23.0%) | 72 (21.9%) |
| $100,000 to $149,999 | 225 (17.9%) | 65 (19.8%) |
| $150,000 or more | 253 (20.2%) | 39 (11.8%) |
| Total | 1,254 (100.0%) | 329 (100.0%) |
Monthly Housing Cost Tiers in Bloomfield
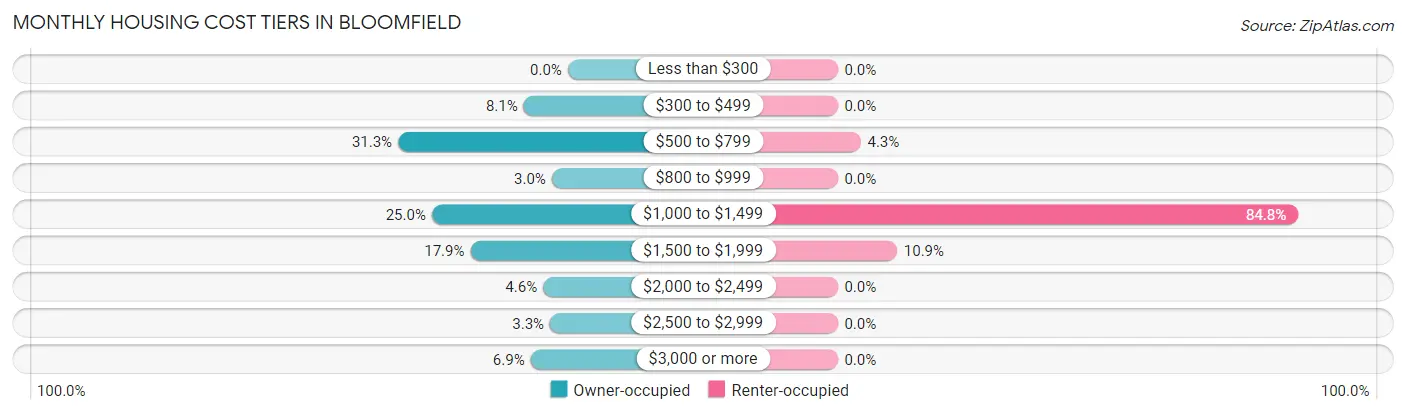
| Monthly Cost | Owner-occupied | Renter-occupied |
| Less than $300 | 0 (0.0%) | 0 (0.0%) |
| $300 to $499 | 102 (8.1%) | 0 (0.0%) |
| $500 to $799 | 392 (31.3%) | 14 (4.3%) |
| $800 to $999 | 37 (2.9%) | 0 (0.0%) |
| $1,000 to $1,499 | 314 (25.0%) | 279 (84.8%) |
| $1,500 to $1,999 | 225 (17.9%) | 36 (10.9%) |
| $2,000 to $2,499 | 57 (4.5%) | 0 (0.0%) |
| $2,500 to $2,999 | 41 (3.3%) | 0 (0.0%) |
| $3,000 or more | 86 (6.9%) | 0 (0.0%) |
| Total | 1,254 (100.0%) | 329 (100.0%) |
Physical Housing Characteristics in Bloomfield
Housing Structures in Bloomfield
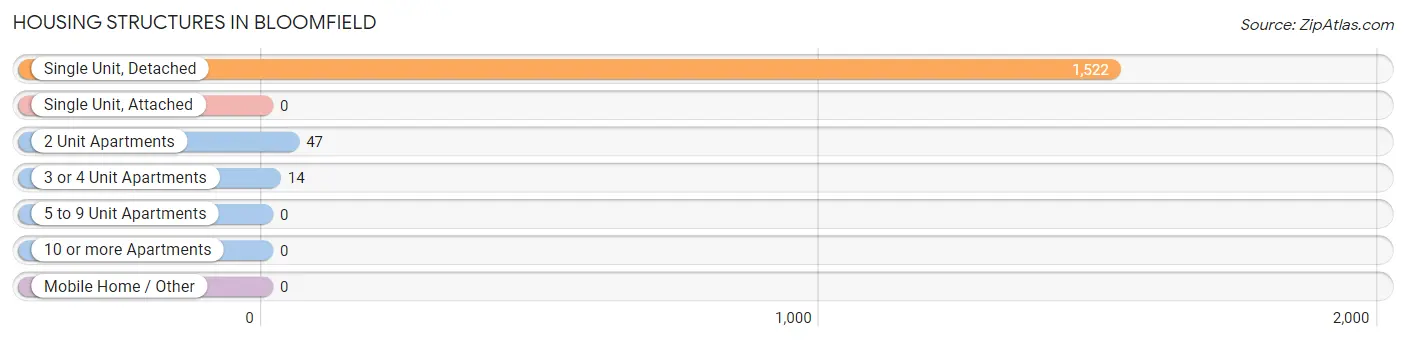
| Structure Type | # Housing Units | % Housing Units |
| Single Unit, Detached | 1,522 | 96.2% |
| Single Unit, Attached | 0 | 0.0% |
| 2 Unit Apartments | 47 | 3.0% |
| 3 or 4 Unit Apartments | 14 | 0.9% |
| 5 to 9 Unit Apartments | 0 | 0.0% |
| 10 or more Apartments | 0 | 0.0% |
| Mobile Home / Other | 0 | 0.0% |
| Total | 1,583 | 100.0% |
Housing Structures by Occupancy in Bloomfield
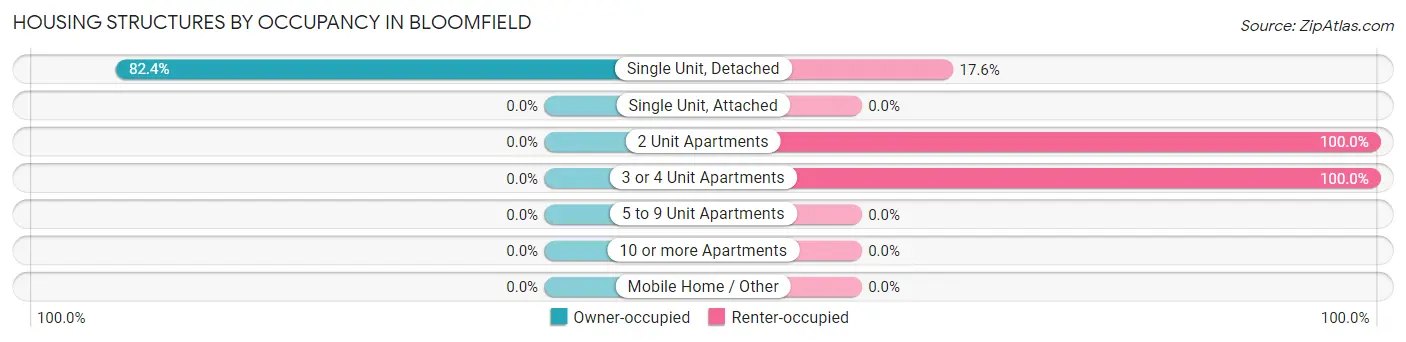
| Structure Type | Owner-occupied | Renter-occupied |
| Single Unit, Detached | 1,254 (82.4%) | 268 (17.6%) |
| Single Unit, Attached | 0 (0.0%) | 0 (0.0%) |
| 2 Unit Apartments | 0 (0.0%) | 47 (100.0%) |
| 3 or 4 Unit Apartments | 0 (0.0%) | 14 (100.0%) |
| 5 to 9 Unit Apartments | 0 (0.0%) | 0 (0.0%) |
| 10 or more Apartments | 0 (0.0%) | 0 (0.0%) |
| Mobile Home / Other | 0 (0.0%) | 0 (0.0%) |
| Total | 1,254 (79.2%) | 329 (20.8%) |
Housing Structures by Number of Rooms in Bloomfield
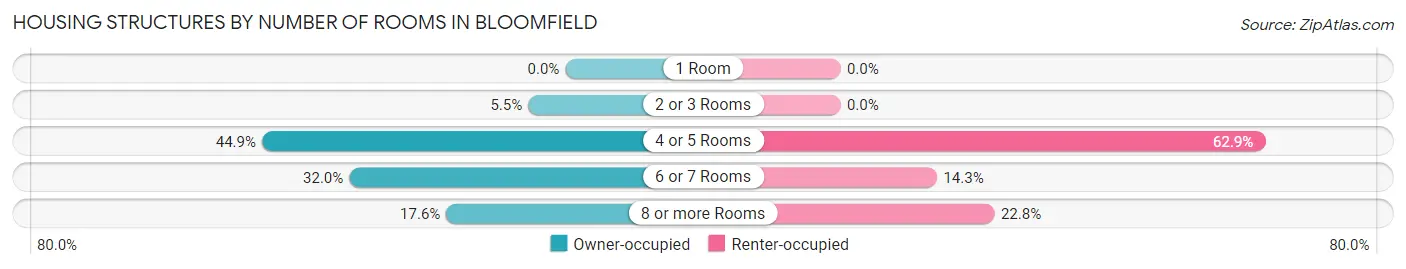
| Number of Rooms | Owner-occupied | Renter-occupied |
| 1 Room | 0 (0.0%) | 0 (0.0%) |
| 2 or 3 Rooms | 69 (5.5%) | 0 (0.0%) |
| 4 or 5 Rooms | 563 (44.9%) | 207 (62.9%) |
| 6 or 7 Rooms | 401 (32.0%) | 47 (14.3%) |
| 8 or more Rooms | 221 (17.6%) | 75 (22.8%) |
| Total | 1,254 (100.0%) | 329 (100.0%) |
Housing Structure by Heating Type in Bloomfield
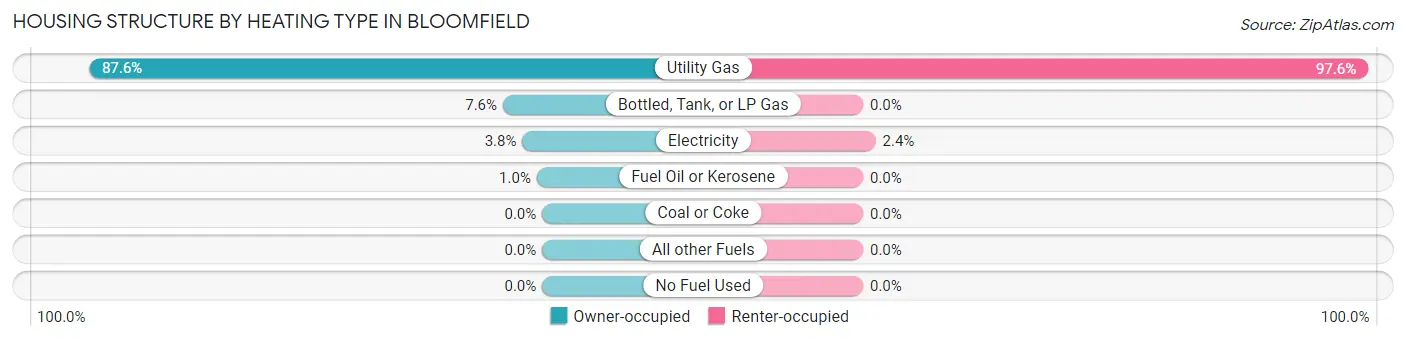
| Heating Type | Owner-occupied | Renter-occupied |
| Utility Gas | 1,098 (87.6%) | 321 (97.6%) |
| Bottled, Tank, or LP Gas | 95 (7.6%) | 0 (0.0%) |
| Electricity | 48 (3.8%) | 8 (2.4%) |
| Fuel Oil or Kerosene | 13 (1.0%) | 0 (0.0%) |
| Coal or Coke | 0 (0.0%) | 0 (0.0%) |
| All other Fuels | 0 (0.0%) | 0 (0.0%) |
| No Fuel Used | 0 (0.0%) | 0 (0.0%) |
| Total | 1,254 (100.0%) | 329 (100.0%) |
Household Vehicle Usage in Bloomfield
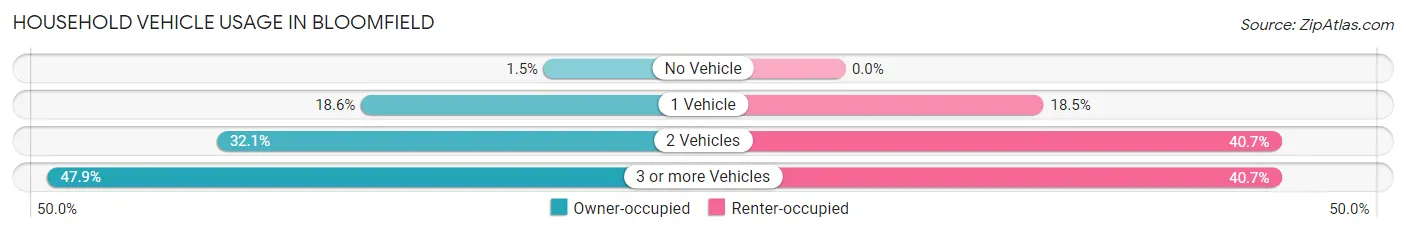
| Vehicles per Household | Owner-occupied | Renter-occupied |
| No Vehicle | 19 (1.5%) | 0 (0.0%) |
| 1 Vehicle | 233 (18.6%) | 61 (18.5%) |
| 2 Vehicles | 402 (32.1%) | 134 (40.7%) |
| 3 or more Vehicles | 600 (47.8%) | 134 (40.7%) |
| Total | 1,254 (100.0%) | 329 (100.0%) |
Real Estate & Mortgages in Bloomfield
Real Estate and Mortgage Overview in Bloomfield
| Characteristic | Without Mortgage | With Mortgage |
| Housing Units | 427 | 827 |
| Median Property Value | $192,100 | $204,700 |
| Median Household Income | $42,928 | $239 |
| Monthly Housing Costs | $572 | $76 |
| Real Estate Taxes | $3,432 | $0 |
Property Value by Mortgage Status in Bloomfield
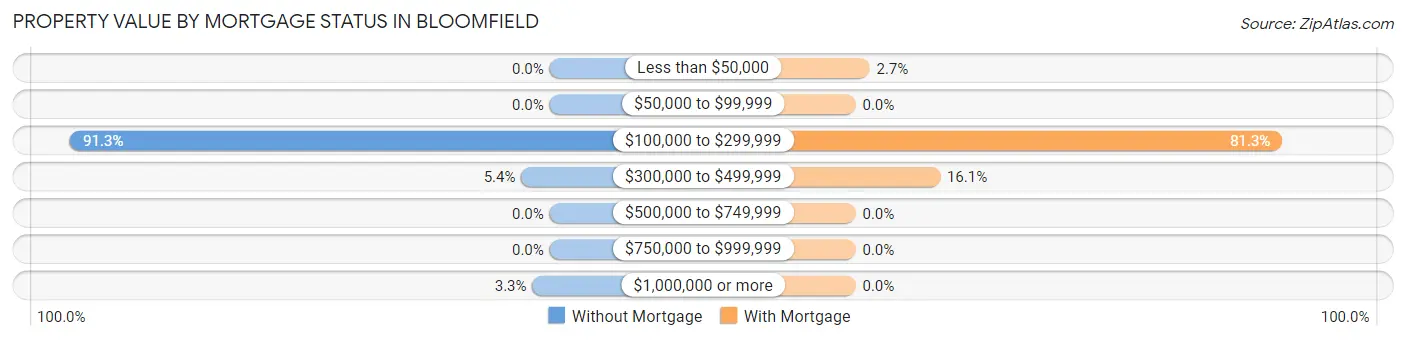
| Property Value | Without Mortgage | With Mortgage |
| Less than $50,000 | 0 (0.0%) | 22 (2.7%) |
| $50,000 to $99,999 | 0 (0.0%) | 0 (0.0%) |
| $100,000 to $299,999 | 390 (91.3%) | 672 (81.3%) |
| $300,000 to $499,999 | 23 (5.4%) | 133 (16.1%) |
| $500,000 to $749,999 | 0 (0.0%) | 0 (0.0%) |
| $750,000 to $999,999 | 0 (0.0%) | 0 (0.0%) |
| $1,000,000 or more | 14 (3.3%) | 0 (0.0%) |
| Total | 427 (100.0%) | 827 (100.0%) |
Household Income by Mortgage Status in Bloomfield
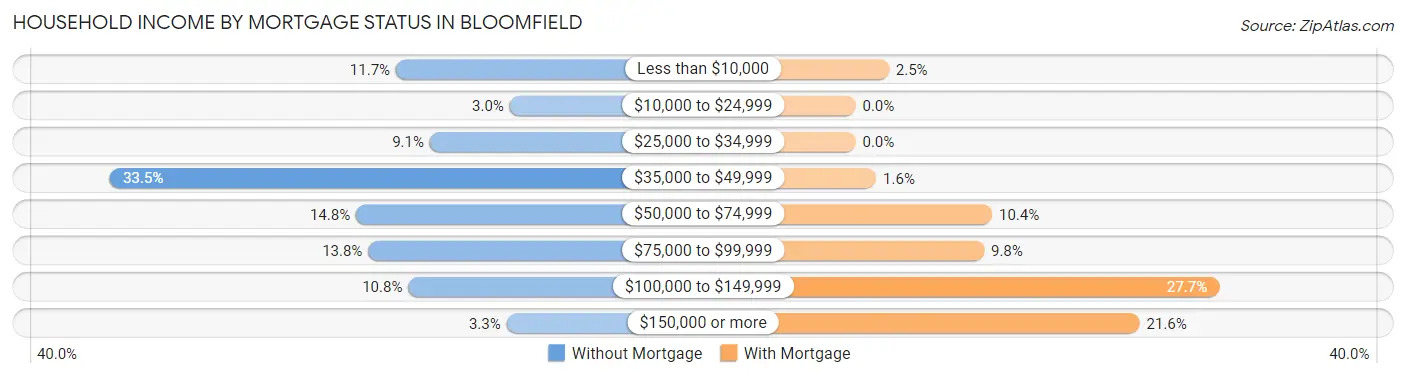
| Household Income | Without Mortgage | With Mortgage |
| Less than $10,000 | 50 (11.7%) | 21 (2.5%) |
| $10,000 to $24,999 | 13 (3.0%) | 0 (0.0%) |
| $25,000 to $34,999 | 39 (9.1%) | 0 (0.0%) |
| $35,000 to $49,999 | 143 (33.5%) | 13 (1.6%) |
| $50,000 to $74,999 | 63 (14.7%) | 86 (10.4%) |
| $75,000 to $99,999 | 59 (13.8%) | 81 (9.8%) |
| $100,000 to $149,999 | 46 (10.8%) | 229 (27.7%) |
| $150,000 or more | 14 (3.3%) | 179 (21.6%) |
| Total | 427 (100.0%) | 827 (100.0%) |
Property Value to Household Income Ratio in Bloomfield
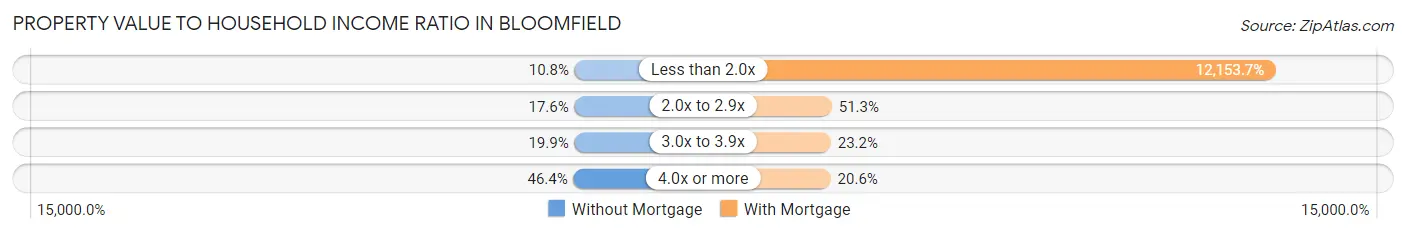
| Value-to-Income Ratio | Without Mortgage | With Mortgage |
| Less than 2.0x | 46 (10.8%) | 100,511 (12,153.7%) |
| 2.0x to 2.9x | 75 (17.6%) | 424 (51.3%) |
| 3.0x to 3.9x | 85 (19.9%) | 192 (23.2%) |
| 4.0x or more | 198 (46.4%) | 170 (20.6%) |
| Total | 427 (100.0%) | 827 (100.0%) |
Real Estate Taxes by Mortgage Status in Bloomfield
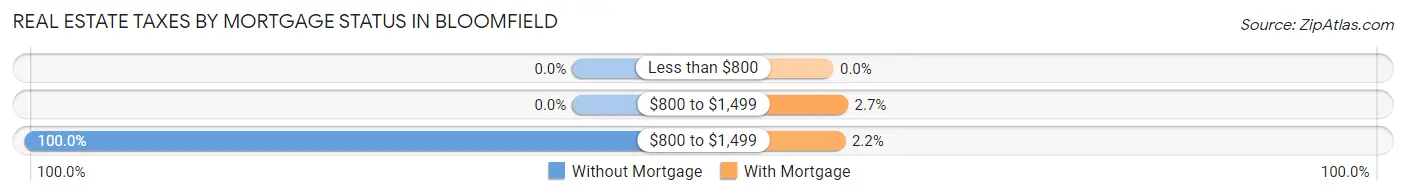
| Property Taxes | Without Mortgage | With Mortgage |
| Less than $800 | 0 (0.0%) | 0 (0.0%) |
| $800 to $1,499 | 0 (0.0%) | 22 (2.7%) |
| $800 to $1,499 | 427 (100.0%) | 18 (2.2%) |
| Total | 427 (100.0%) | 827 (100.0%) |
Health & Disability in Bloomfield
Health Insurance Coverage by Age in Bloomfield
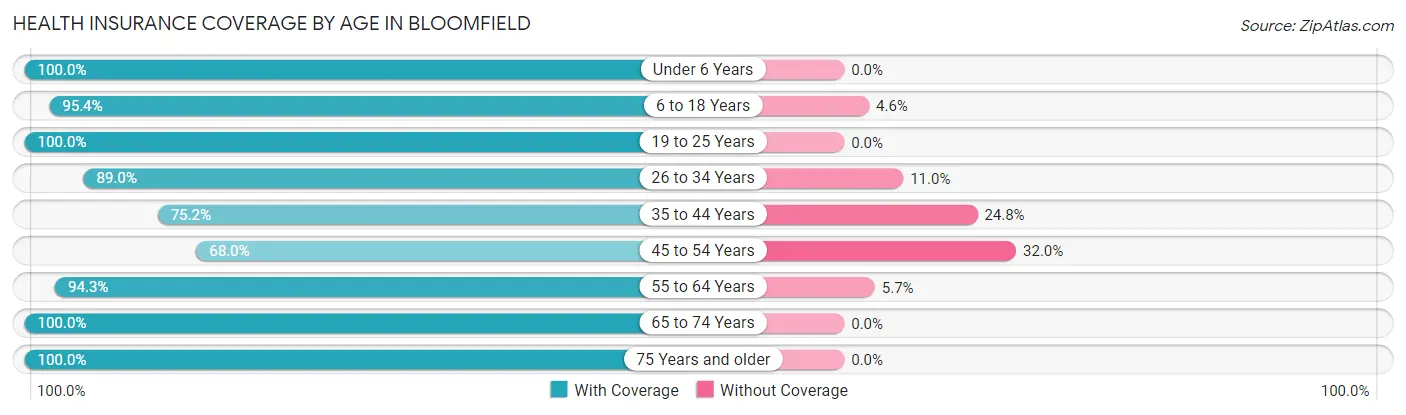
| Age Bracket | With Coverage | Without Coverage |
| Under 6 Years | 272 (100.0%) | 0 (0.0%) |
| 6 to 18 Years | 1,114 (95.4%) | 54 (4.6%) |
| 19 to 25 Years | 350 (100.0%) | 0 (0.0%) |
| 26 to 34 Years | 502 (89.0%) | 62 (11.0%) |
| 35 to 44 Years | 448 (75.2%) | 148 (24.8%) |
| 45 to 54 Years | 403 (68.0%) | 190 (32.0%) |
| 55 to 64 Years | 712 (94.3%) | 43 (5.7%) |
| 65 to 74 Years | 314 (100.0%) | 0 (0.0%) |
| 75 Years and older | 179 (100.0%) | 0 (0.0%) |
| Total | 4,294 (89.6%) | 497 (10.4%) |
Health Insurance Coverage by Citizenship Status in Bloomfield
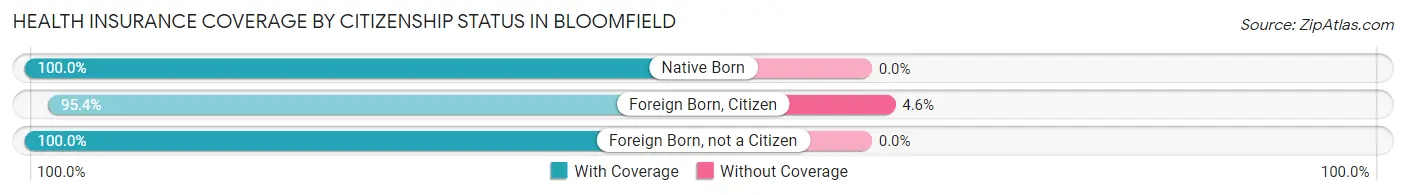
| Citizenship Status | With Coverage | Without Coverage |
| Native Born | 272 (100.0%) | 0 (0.0%) |
| Foreign Born, Citizen | 1,114 (95.4%) | 54 (4.6%) |
| Foreign Born, not a Citizen | 350 (100.0%) | 0 (0.0%) |
Health Insurance Coverage by Household Income in Bloomfield
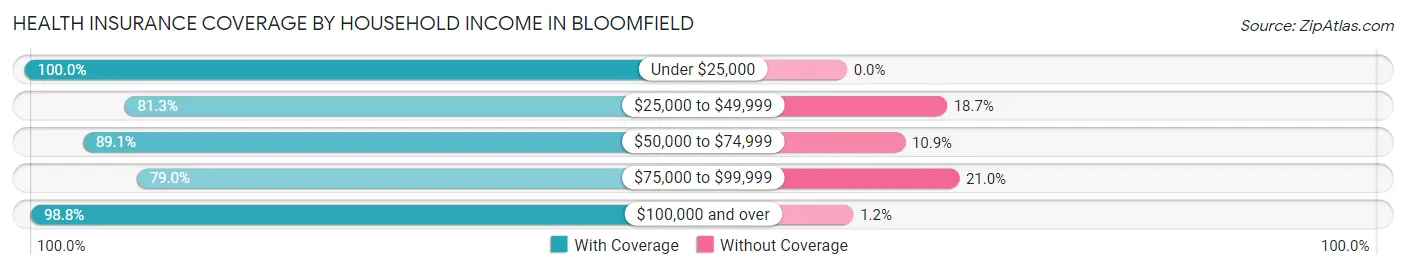
| Household Income | With Coverage | Without Coverage |
| Under $25,000 | 63 (100.0%) | 0 (0.0%) |
| $25,000 to $49,999 | 751 (81.3%) | 173 (18.7%) |
| $50,000 to $74,999 | 532 (89.1%) | 65 (10.9%) |
| $75,000 to $99,999 | 880 (79.0%) | 234 (21.0%) |
| $100,000 and over | 2,050 (98.8%) | 25 (1.2%) |
Public vs Private Health Insurance Coverage by Age in Bloomfield
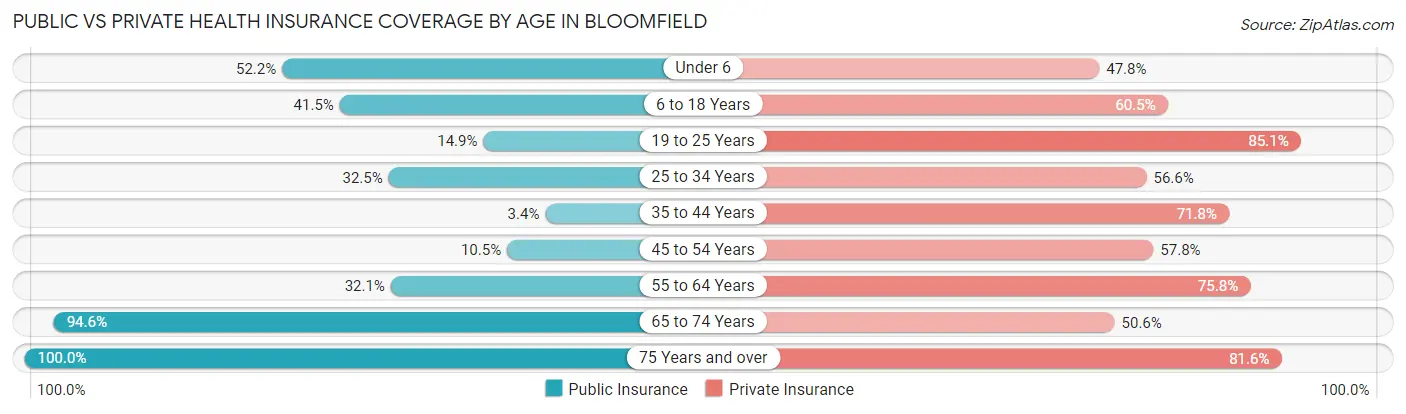
| Age Bracket | Public Insurance | Private Insurance |
| Under 6 | 142 (52.2%) | 130 (47.8%) |
| 6 to 18 Years | 485 (41.5%) | 706 (60.5%) |
| 19 to 25 Years | 52 (14.9%) | 298 (85.1%) |
| 25 to 34 Years | 183 (32.5%) | 319 (56.6%) |
| 35 to 44 Years | 20 (3.4%) | 428 (71.8%) |
| 45 to 54 Years | 62 (10.5%) | 343 (57.8%) |
| 55 to 64 Years | 242 (32.1%) | 572 (75.8%) |
| 65 to 74 Years | 297 (94.6%) | 159 (50.6%) |
| 75 Years and over | 179 (100.0%) | 146 (81.6%) |
| Total | 1,662 (34.7%) | 3,101 (64.7%) |
Disability Status by Sex by Age in Bloomfield
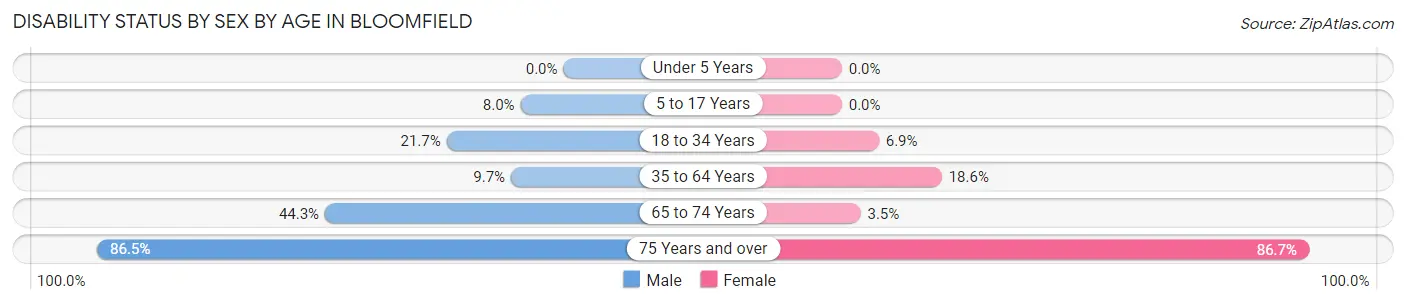
| Age Bracket | Male | Female |
| Under 5 Years | 0 (0.0%) | 0 (0.0%) |
| 5 to 17 Years | 51 (8.0%) | 0 (0.0%) |
| 18 to 34 Years | 98 (21.7%) | 41 (6.9%) |
| 35 to 64 Years | 99 (9.7%) | 172 (18.5%) |
| 65 to 74 Years | 50 (44.3%) | 7 (3.5%) |
| 75 Years and over | 90 (86.5%) | 65 (86.7%) |
Disability Class by Sex by Age in Bloomfield
Disability Class: Hearing Difficulty
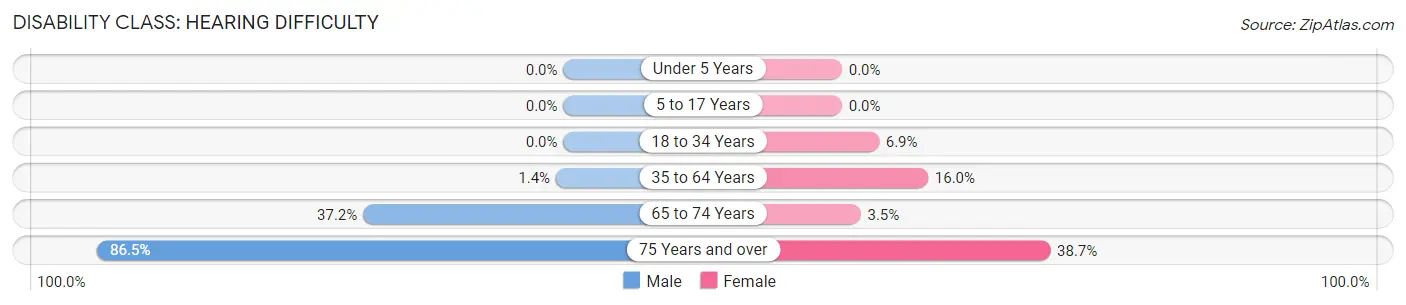
| Age Bracket | Male | Female |
| Under 5 Years | 0 (0.0%) | 0 (0.0%) |
| 5 to 17 Years | 0 (0.0%) | 0 (0.0%) |
| 18 to 34 Years | 0 (0.0%) | 41 (6.9%) |
| 35 to 64 Years | 14 (1.4%) | 148 (16.0%) |
| 65 to 74 Years | 42 (37.2%) | 7 (3.5%) |
| 75 Years and over | 90 (86.5%) | 29 (38.7%) |
Disability Class: Vision Difficulty
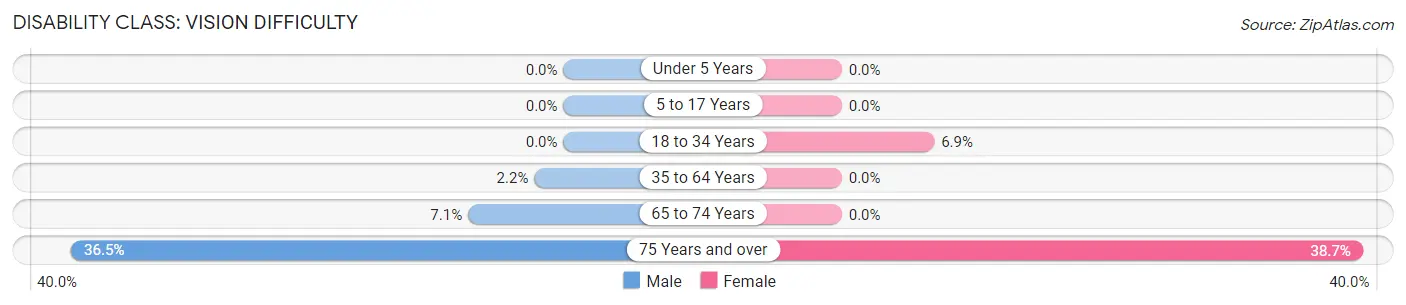
| Age Bracket | Male | Female |
| Under 5 Years | 0 (0.0%) | 0 (0.0%) |
| 5 to 17 Years | 0 (0.0%) | 0 (0.0%) |
| 18 to 34 Years | 0 (0.0%) | 41 (6.9%) |
| 35 to 64 Years | 22 (2.2%) | 0 (0.0%) |
| 65 to 74 Years | 8 (7.1%) | 0 (0.0%) |
| 75 Years and over | 38 (36.5%) | 29 (38.7%) |
Disability Class: Cognitive Difficulty
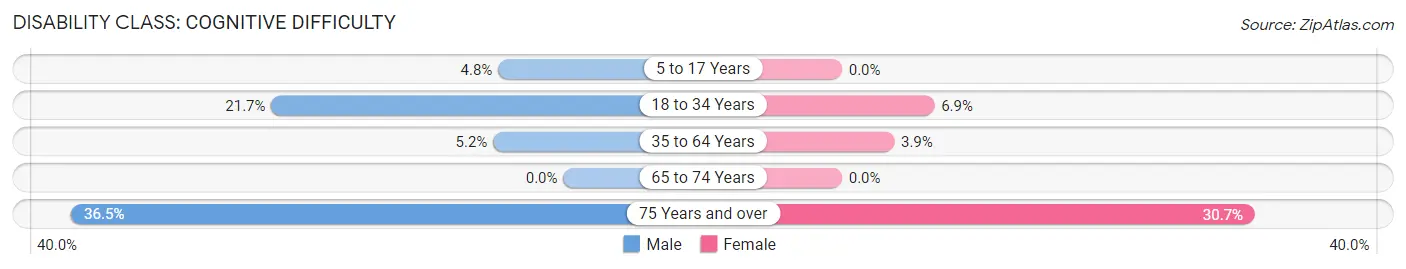
| Age Bracket | Male | Female |
| 5 to 17 Years | 31 (4.8%) | 0 (0.0%) |
| 18 to 34 Years | 98 (21.7%) | 41 (6.9%) |
| 35 to 64 Years | 53 (5.2%) | 36 (3.9%) |
| 65 to 74 Years | 0 (0.0%) | 0 (0.0%) |
| 75 Years and over | 38 (36.5%) | 23 (30.7%) |
Disability Class: Ambulatory Difficulty
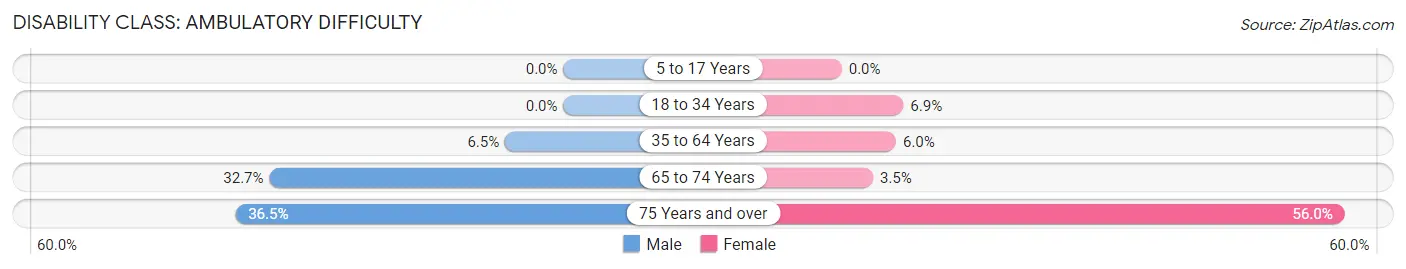
| Age Bracket | Male | Female |
| 5 to 17 Years | 0 (0.0%) | 0 (0.0%) |
| 18 to 34 Years | 0 (0.0%) | 41 (6.9%) |
| 35 to 64 Years | 66 (6.5%) | 56 (6.0%) |
| 65 to 74 Years | 37 (32.7%) | 7 (3.5%) |
| 75 Years and over | 38 (36.5%) | 42 (56.0%) |
Disability Class: Self-Care Difficulty
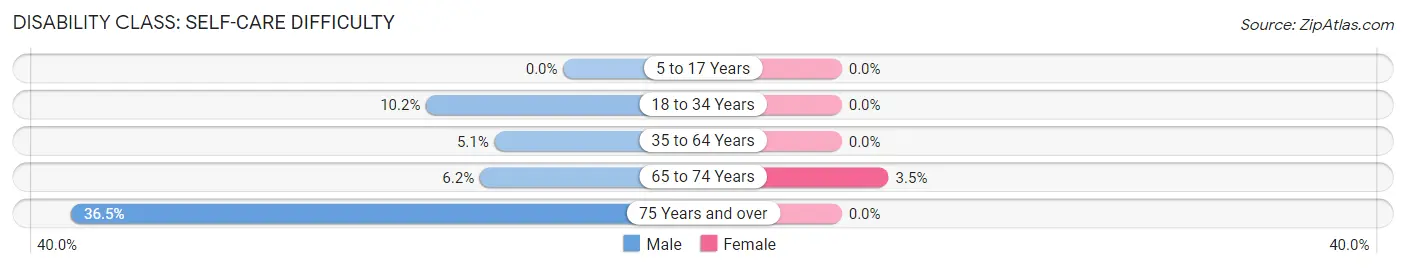
| Age Bracket | Male | Female |
| 5 to 17 Years | 0 (0.0%) | 0 (0.0%) |
| 18 to 34 Years | 46 (10.2%) | 0 (0.0%) |
| 35 to 64 Years | 52 (5.1%) | 0 (0.0%) |
| 65 to 74 Years | 7 (6.2%) | 7 (3.5%) |
| 75 Years and over | 38 (36.5%) | 0 (0.0%) |
Technology Access in Bloomfield
Computing Device Access in Bloomfield
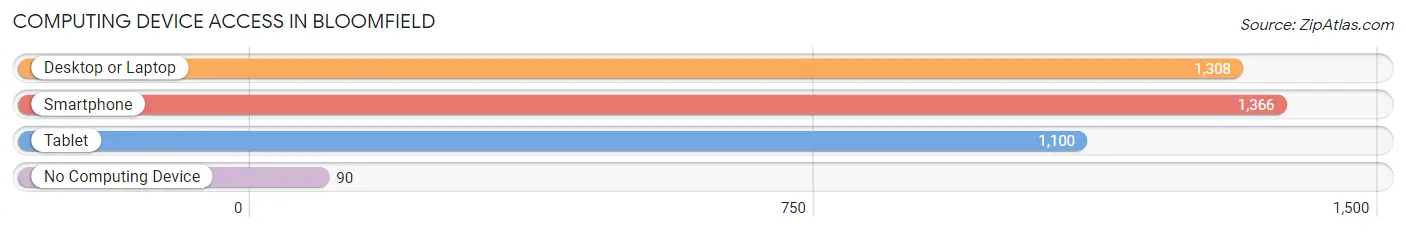
| Device Type | # Households | % Households |
| Desktop or Laptop | 1,308 | 82.6% |
| Smartphone | 1,366 | 86.3% |
| Tablet | 1,100 | 69.5% |
| No Computing Device | 90 | 5.7% |
| Total | 1,583 | 100.0% |
Internet Access in Bloomfield
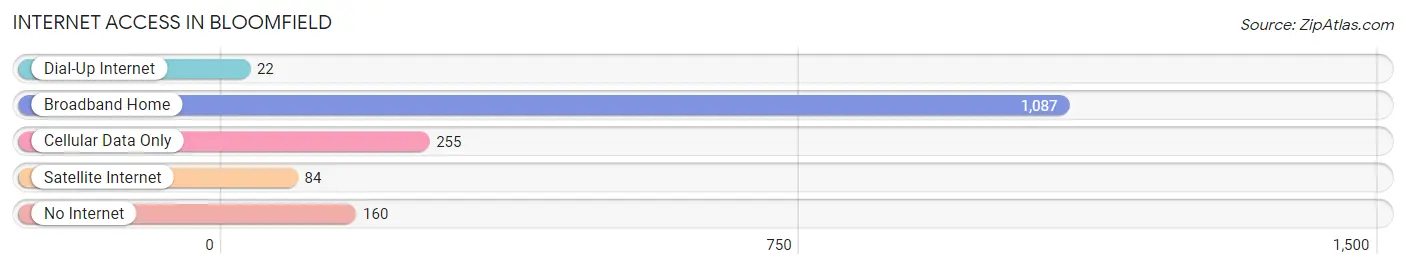
| Internet Type | # Households | % Households |
| Dial-Up Internet | 22 | 1.4% |
| Broadband Home | 1,087 | 68.7% |
| Cellular Data Only | 255 | 16.1% |
| Satellite Internet | 84 | 5.3% |
| No Internet | 160 | 10.1% |
| Total | 1,583 | 100.0% |
Bloomfield Summary
Bloomfield, Wisconsin is a small town located in the southeastern corner of the state, in Walworth County. It is situated on the banks of the Fox River, and is bordered by the towns of Lyons, Sharon, and Whitewater. The population of Bloomfield was 1,845 in the 2010 census, making it the smallest incorporated town in the county.
History
The area that is now Bloomfield was first settled in the early 1830s by settlers from New York and New England. The town was originally known as “Bloomfield Center”, and was officially incorporated in 1856. The town was named after the many wildflowers that grew in the area.
In the late 19th century, Bloomfield was a thriving agricultural community, with many farms and orchards. The town was also home to several small businesses, including a sawmill, a grist mill, and a cheese factory.
Geography
Bloomfield is located in southeastern Wisconsin, in Walworth County. It is situated on the banks of the Fox River, and is bordered by the towns of Lyons, Sharon, and Whitewater. The town covers an area of 2.2 square miles, and has a population of 1,845 people, according to the 2010 census.
The terrain of Bloomfield is mostly flat, with some rolling hills. The town is located in the Central Plain region of Wisconsin, and is part of the Driftless Area, which is characterized by its rugged terrain and lack of glacial deposits.
Economy
The economy of Bloomfield is largely based on agriculture and tourism. The town is home to several small businesses, including a sawmill, a grist mill, and a cheese factory. The town also has several wineries, and is a popular destination for wine-tasting tours.
In addition, Bloomfield is home to several small manufacturing companies, including a plastics manufacturer and a metal fabrication company. The town also has a number of retail stores, including a grocery store, a hardware store, and a pharmacy.
Demographics
According to the 2010 census, the population of Bloomfield was 1,845 people. The racial makeup of the town was 97.3% White, 0.7% African American, 0.3% Native American, 0.2% Asian, 0.1% Pacific Islander, and 1.4% from other races. The median household income was $45,938, and the median family income was $54,844.
The town is served by the Bloomfield-Lyons School District, which includes two elementary schools, one middle school, and one high school. The town also has a public library, and is home to several churches.
Common Questions
What is Per Capita Income in Bloomfield?
Per Capita income in Bloomfield is $31,732.
What is the Median Family Income in Bloomfield?
Median Family Income in Bloomfield is $95,869.
What is the Median Household income in Bloomfield?
Median Household Income in Bloomfield is $95,166.
What is Income or Wage Gap in Bloomfield?
Income or Wage Gap in Bloomfield is 43.9%.
Women in Bloomfield earn 56.1 cents for every dollar earned by a man.
What is Inequality or Gini Index in Bloomfield?
Inequality or Gini Index in Bloomfield is 0.34.
What is the Total Population of Bloomfield?
Total Population of Bloomfield is 4,791.
What is the Total Male Population of Bloomfield?
Total Male Population of Bloomfield is 2,520.
What is the Total Female Population of Bloomfield?
Total Female Population of Bloomfield is 2,271.
What is the Ratio of Males per 100 Females in Bloomfield?
There are 110.96 Males per 100 Females in Bloomfield.
What is the Ratio of Females per 100 Males in Bloomfield?
There are 90.12 Females per 100 Males in Bloomfield.
What is the Median Population Age in Bloomfield?
Median Population Age in Bloomfield is 35.3 Years.
What is the Average Family Size in Bloomfield
Average Family Size in Bloomfield is 3.3 People.
What is the Average Household Size in Bloomfield
Average Household Size in Bloomfield is 3.0 People.
How Large is the Labor Force in Bloomfield?
There are 2,583 People in the Labor Forcein in Bloomfield.
What is the Percentage of People in the Labor Force in Bloomfield?
71.8% of People are in the Labor Force in Bloomfield.
What is the Unemployment Rate in Bloomfield?
Unemployment Rate in Bloomfield is 7.2%.