Lac La Belle, WI Map & Demographics
Lac La Belle Map
Lac La Belle Overview
$131,397
PER CAPITA INCOME
$199,583
AVG FAMILY INCOME
$198,750
AVG HOUSEHOLD INCOME
0.46
INEQUALITY / GINI INDEX
252
TOTAL POPULATION
136
MALE POPULATION
116
FEMALE POPULATION
117.24
MALES / 100 FEMALES
85.29
FEMALES / 100 MALES
53.8
MEDIAN AGE
2.8
AVG FAMILY SIZE
2.5
AVG HOUSEHOLD SIZE
137
LABOR FORCE [ PEOPLE ]
62.6%
PERCENT IN LABOR FORCE
2.2%
UNEMPLOYMENT RATE
Income in Lac La Belle
Income Overview in Lac La Belle
Per Capita Income in Lac La Belle is $131,397, while median incomes of families and households are $199,583 and $198,750 respectively.
| Characteristic | Number | Measure |
| Per Capita Income | 252 | $131,397 |
| Median Family Income | 85 | $199,583 |
| Mean Family Income | 85 | $307,927 |
| Median Household Income | 99 | $198,750 |
| Mean Household Income | 99 | $327,631 |
| Income Deficit | 85 | $0 |
| Wage / Income Gap (%) | 252 | 0.00% |
| Wage / Income Gap ($) | 252 | 100.00¢ per $1 |
| Gini / Inequality Index | 252 | 0.46 |
Earnings by Sex in Lac La Belle
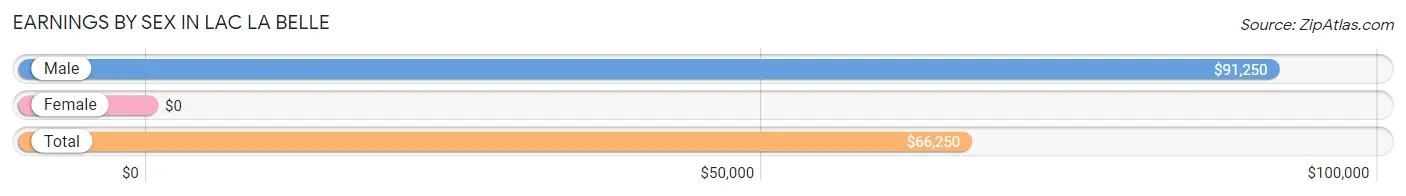
| Sex | Number | Average Earnings |
| Male | 96 (59.6%) | $91,250 |
| Female | 65 (40.4%) | $0 |
| Total | 161 (100.0%) | $66,250 |
Earnings by Sex by Income Bracket in Lac La Belle
The most common earnings brackets in Lac La Belle are $100,000+ for men (43 | 44.8%) and $100,000+ for women (18 | 27.7%).
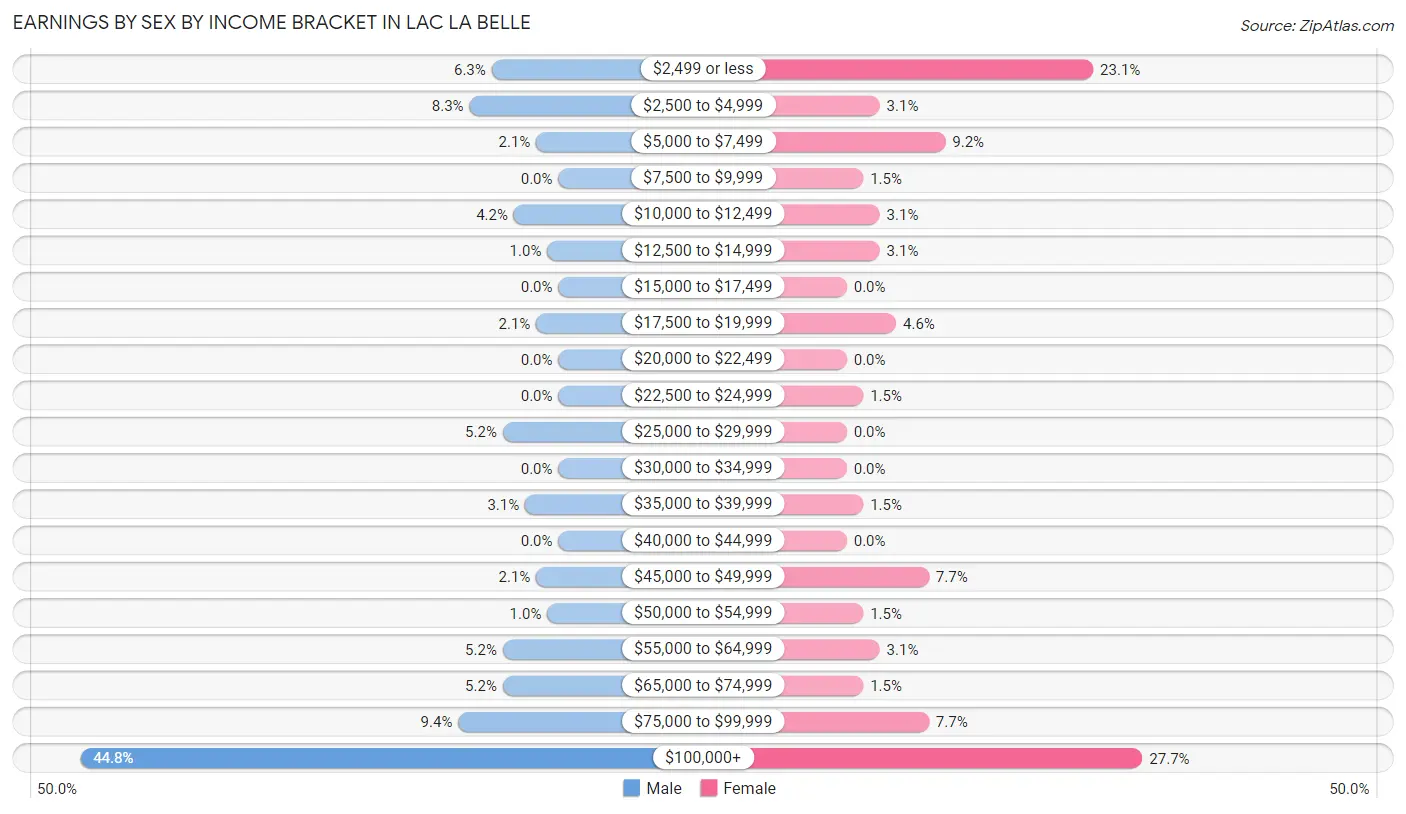
| Income | Male | Female |
| $2,499 or less | 6 (6.2%) | 15 (23.1%) |
| $2,500 to $4,999 | 8 (8.3%) | 2 (3.1%) |
| $5,000 to $7,499 | 2 (2.1%) | 6 (9.2%) |
| $7,500 to $9,999 | 0 (0.0%) | 1 (1.5%) |
| $10,000 to $12,499 | 4 (4.2%) | 2 (3.1%) |
| $12,500 to $14,999 | 1 (1.0%) | 2 (3.1%) |
| $15,000 to $17,499 | 0 (0.0%) | 0 (0.0%) |
| $17,500 to $19,999 | 2 (2.1%) | 3 (4.6%) |
| $20,000 to $22,499 | 0 (0.0%) | 0 (0.0%) |
| $22,500 to $24,999 | 0 (0.0%) | 1 (1.5%) |
| $25,000 to $29,999 | 5 (5.2%) | 0 (0.0%) |
| $30,000 to $34,999 | 0 (0.0%) | 0 (0.0%) |
| $35,000 to $39,999 | 3 (3.1%) | 1 (1.5%) |
| $40,000 to $44,999 | 0 (0.0%) | 0 (0.0%) |
| $45,000 to $49,999 | 2 (2.1%) | 5 (7.7%) |
| $50,000 to $54,999 | 1 (1.0%) | 1 (1.5%) |
| $55,000 to $64,999 | 5 (5.2%) | 2 (3.1%) |
| $65,000 to $74,999 | 5 (5.2%) | 1 (1.5%) |
| $75,000 to $99,999 | 9 (9.4%) | 5 (7.7%) |
| $100,000+ | 43 (44.8%) | 18 (27.7%) |
| Total | 96 (100.0%) | 65 (100.0%) |
Earnings by Sex by Educational Attainment in Lac La Belle
Average earnings in Lac La Belle are $143,750 for men and $53,750 for women, a difference of 62.6%. Men with an educational attainment of graduate degree enjoy the highest average annual earnings of $229,167, while those with bachelor's degree education earn the least with $141,250. Women with an educational attainment of bachelor's degree earn the most with the average annual earnings of $48,750, while those with bachelor's degree education have the smallest earnings of $48,750.
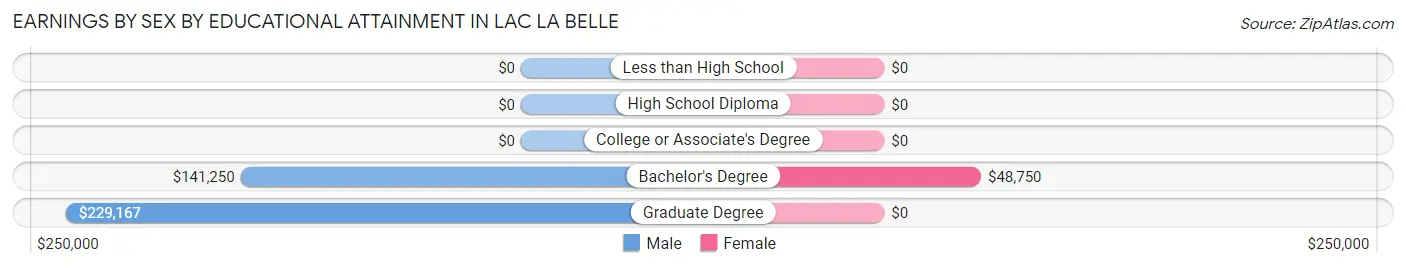
| Educational Attainment | Male Income | Female Income |
| Less than High School | - | - |
| High School Diploma | - | - |
| College or Associate's Degree | - | - |
| Bachelor's Degree | $141,250 | $48,750 |
| Graduate Degree | $229,167 | $0 |
| Total | $143,750 | $53,750 |
Family Income in Lac La Belle
Family Income Brackets in Lac La Belle
According to the Lac La Belle family income data, there are 42 families falling into the $200,000+ income range, which is the most common income bracket and makes up 49.4% of all families.
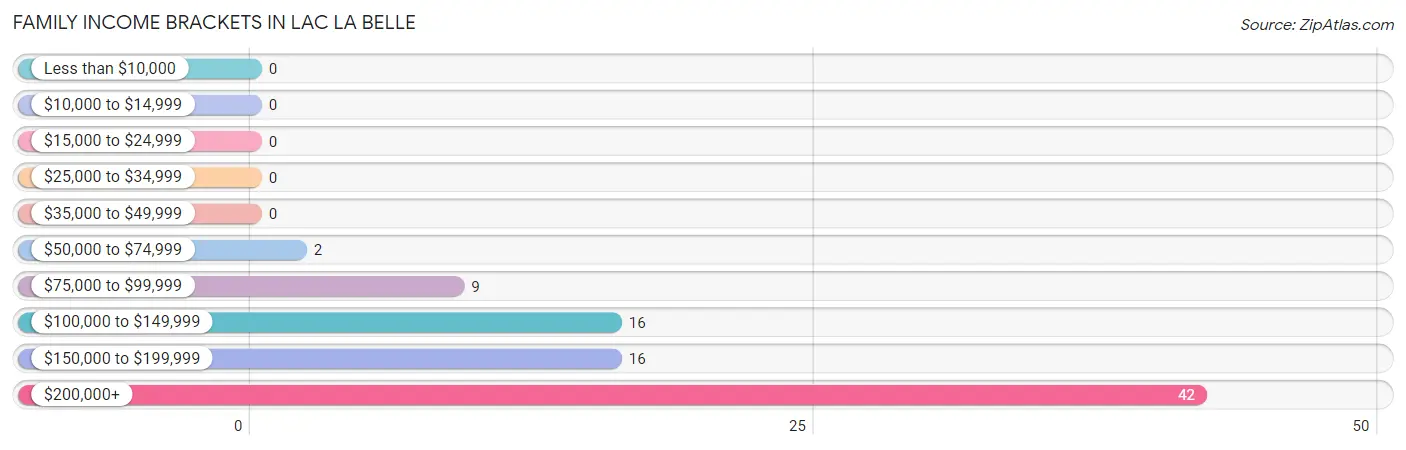
| Income Bracket | # Families | % Families |
| Less than $10,000 | 0 | 0.0% |
| $10,000 to $14,999 | 0 | 0.0% |
| $15,000 to $24,999 | 0 | 0.0% |
| $25,000 to $34,999 | 0 | 0.0% |
| $35,000 to $49,999 | 0 | 0.0% |
| $50,000 to $74,999 | 2 | 2.4% |
| $75,000 to $99,999 | 9 | 10.6% |
| $100,000 to $149,999 | 16 | 18.8% |
| $150,000 to $199,999 | 16 | 18.8% |
| $200,000+ | 42 | 49.4% |
Family Income by Famaliy Size in Lac La Belle
2-person families (52 | 61.2%) account for the highest median family income in Lac La Belle with $205,000 per family, while 2-person families (52 | 61.2%) have the highest median income of $102,500 per family member.
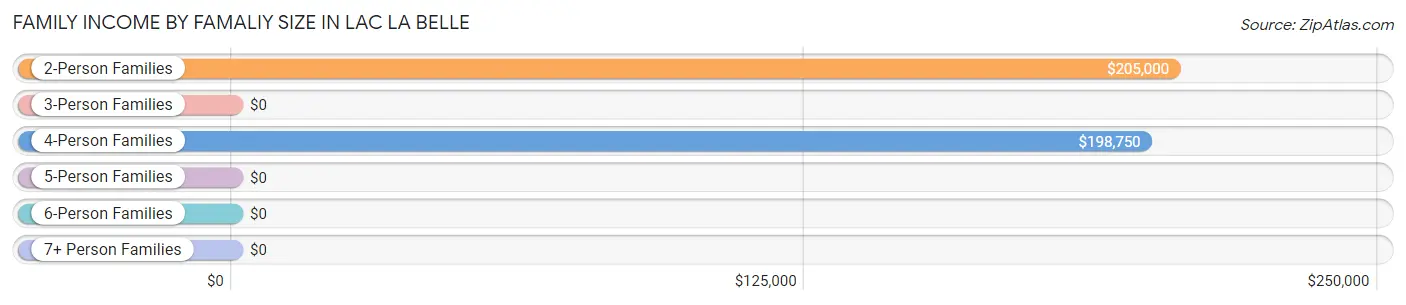
| Income Bracket | # Families | Median Income |
| 2-Person Families | 52 (61.2%) | $205,000 |
| 3-Person Families | 10 (11.8%) | $0 |
| 4-Person Families | 21 (24.7%) | $198,750 |
| 5-Person Families | 1 (1.2%) | $0 |
| 6-Person Families | 1 (1.2%) | $0 |
| 7+ Person Families | 0 (0.0%) | $0 |
| Total | 85 (100.0%) | $199,583 |
Family Income by Number of Earners in Lac La Belle
The median family income in Lac La Belle is $199,583, with families comprising 1 earner (26) having the highest median family income of $218,750, while families with 2 earners (33) have the lowest median family income of $194,375, accounting for 30.6% and 38.8% of families, respectively.
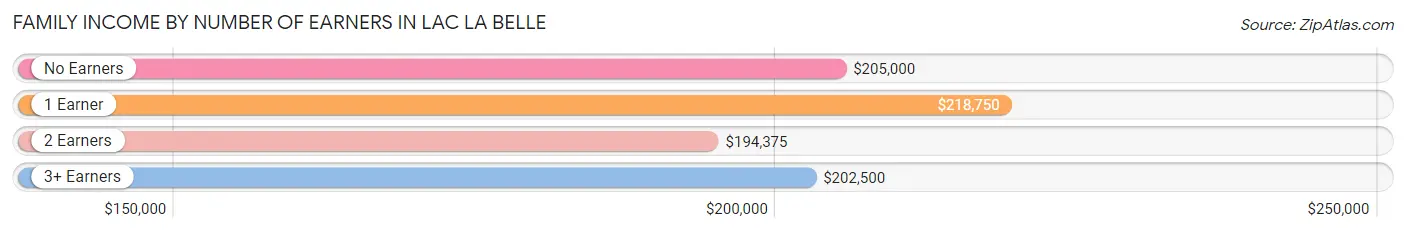
| Number of Earners | # Families | Median Income |
| No Earners | 12 (14.1%) | $205,000 |
| 1 Earner | 26 (30.6%) | $218,750 |
| 2 Earners | 33 (38.8%) | $194,375 |
| 3+ Earners | 14 (16.5%) | $202,500 |
| Total | 85 (100.0%) | $199,583 |
Household Income in Lac La Belle
Household Income Brackets in Lac La Belle
With 48 households falling in the category, the $200,000+ income range is the most frequent in Lac La Belle, accounting for 48.5% of all households.
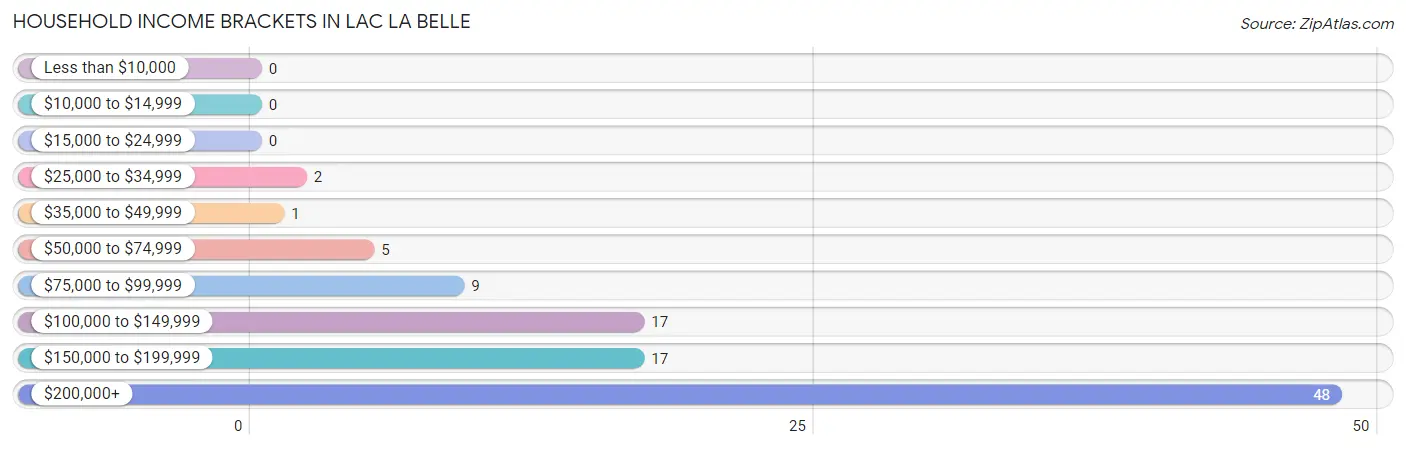
| Income Bracket | # Households | % Households |
| Less than $10,000 | 0 | 0.0% |
| $10,000 to $14,999 | 0 | 0.0% |
| $15,000 to $24,999 | 0 | 0.0% |
| $25,000 to $34,999 | 2 | 2.0% |
| $35,000 to $49,999 | 1 | 1.0% |
| $50,000 to $74,999 | 5 | 5.1% |
| $75,000 to $99,999 | 9 | 9.1% |
| $100,000 to $149,999 | 17 | 17.2% |
| $150,000 to $199,999 | 17 | 17.2% |
| $200,000+ | 48 | 48.5% |
Household Income by Householder Age in Lac La Belle
The median household income in Lac La Belle is $198,750, with the highest median household income of $231,250 found in the 45 to 64 years age bracket for the primary householder. A total of 53 households (53.5%) fall into this category.
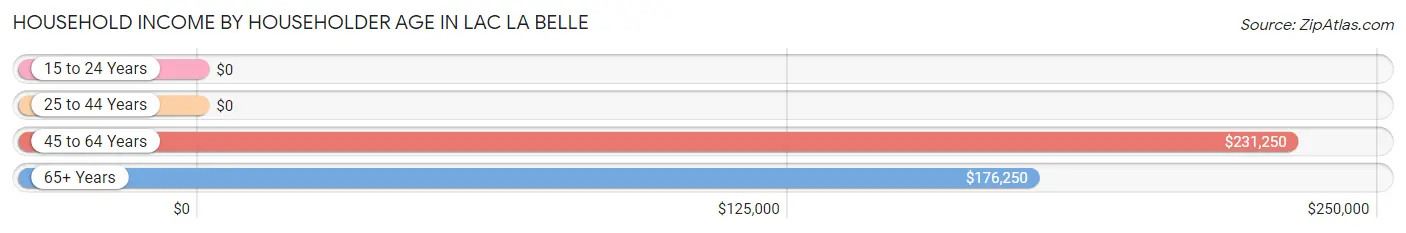
| Income Bracket | # Households | Median Income |
| 15 to 24 Years | 0 (0.0%) | $0 |
| 25 to 44 Years | 12 (12.1%) | $0 |
| 45 to 64 Years | 53 (53.5%) | $231,250 |
| 65+ Years | 34 (34.3%) | $176,250 |
| Total | 99 (100.0%) | $198,750 |
Poverty in Lac La Belle
Income Below Poverty by Sex and Age in Lac La Belle
With 1.5% poverty level for males and 1.7% for females among the residents of Lac La Belle, 18 to 24 year old males and 25 to 34 year old females are the most vulnerable to poverty, with 2 males (11.1%) and 1 females (16.7%) in their respective age groups living below the poverty level.
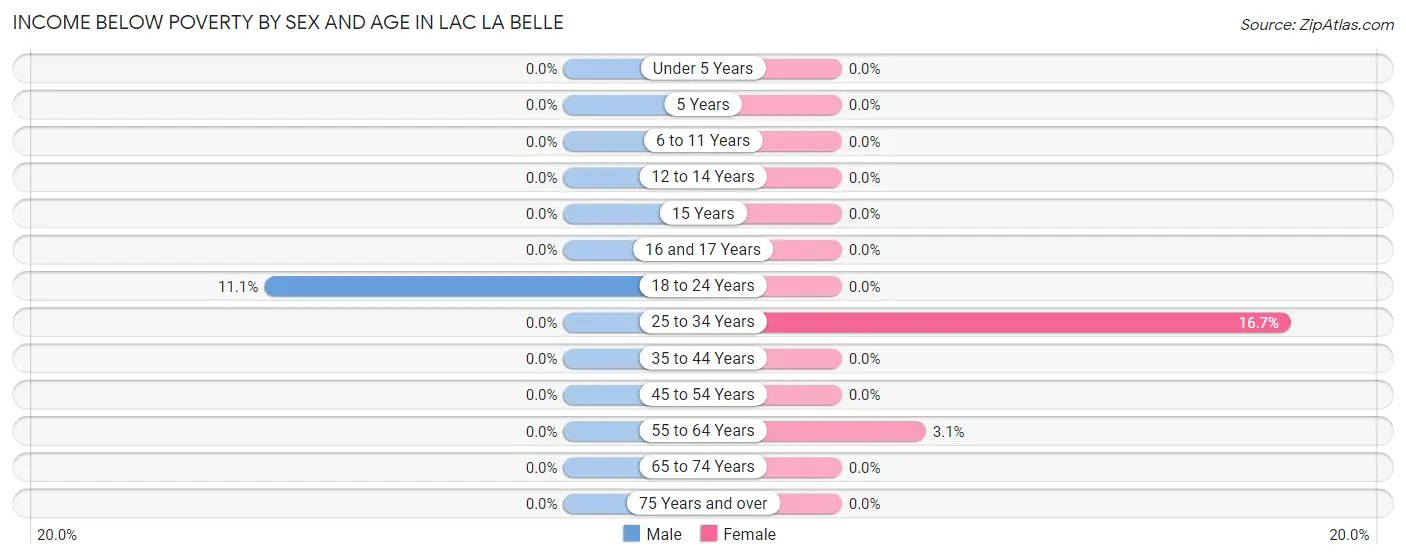
| Age Bracket | Male | Female |
| Under 5 Years | 0 (0.0%) | 0 (0.0%) |
| 5 Years | 0 (0.0%) | 0 (0.0%) |
| 6 to 11 Years | 0 (0.0%) | 0 (0.0%) |
| 12 to 14 Years | 0 (0.0%) | 0 (0.0%) |
| 15 Years | 0 (0.0%) | 0 (0.0%) |
| 16 and 17 Years | 0 (0.0%) | 0 (0.0%) |
| 18 to 24 Years | 2 (11.1%) | 0 (0.0%) |
| 25 to 34 Years | 0 (0.0%) | 1 (16.7%) |
| 35 to 44 Years | 0 (0.0%) | 0 (0.0%) |
| 45 to 54 Years | 0 (0.0%) | 0 (0.0%) |
| 55 to 64 Years | 0 (0.0%) | 1 (3.1%) |
| 65 to 74 Years | 0 (0.0%) | 0 (0.0%) |
| 75 Years and over | 0 (0.0%) | 0 (0.0%) |
| Total | 2 (1.5%) | 2 (1.7%) |
Income Above Poverty by Sex and Age in Lac La Belle
According to the poverty statistics in Lac La Belle, males aged under 5 years and females aged 6 to 11 years are the age groups that are most secure financially, with 100.0% of males and 100.0% of females in these age groups living above the poverty line.
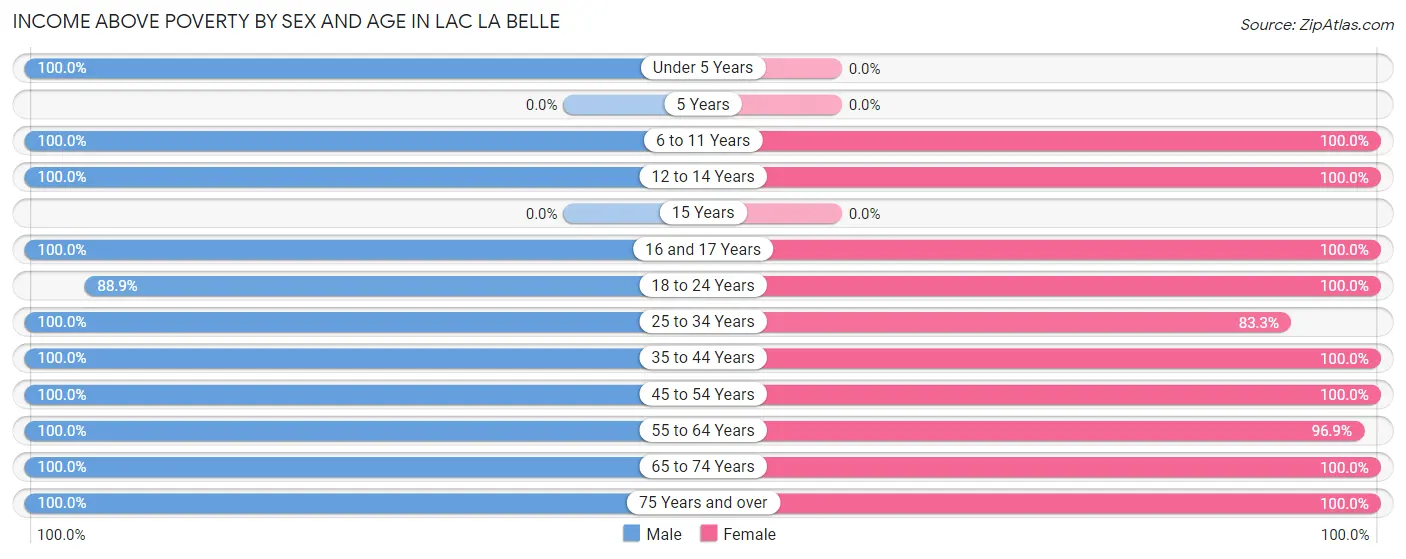
| Age Bracket | Male | Female |
| Under 5 Years | 7 (100.0%) | 0 (0.0%) |
| 5 Years | 0 (0.0%) | 0 (0.0%) |
| 6 to 11 Years | 7 (100.0%) | 6 (100.0%) |
| 12 to 14 Years | 7 (100.0%) | 6 (100.0%) |
| 15 Years | 0 (0.0%) | 0 (0.0%) |
| 16 and 17 Years | 4 (100.0%) | 12 (100.0%) |
| 18 to 24 Years | 16 (88.9%) | 3 (100.0%) |
| 25 to 34 Years | 6 (100.0%) | 5 (83.3%) |
| 35 to 44 Years | 6 (100.0%) | 6 (100.0%) |
| 45 to 54 Years | 21 (100.0%) | 20 (100.0%) |
| 55 to 64 Years | 23 (100.0%) | 31 (96.9%) |
| 65 to 74 Years | 24 (100.0%) | 11 (100.0%) |
| 75 Years and over | 13 (100.0%) | 14 (100.0%) |
| Total | 134 (98.5%) | 114 (98.3%) |
Income Below Poverty Among Married-Couple Families in Lac La Belle
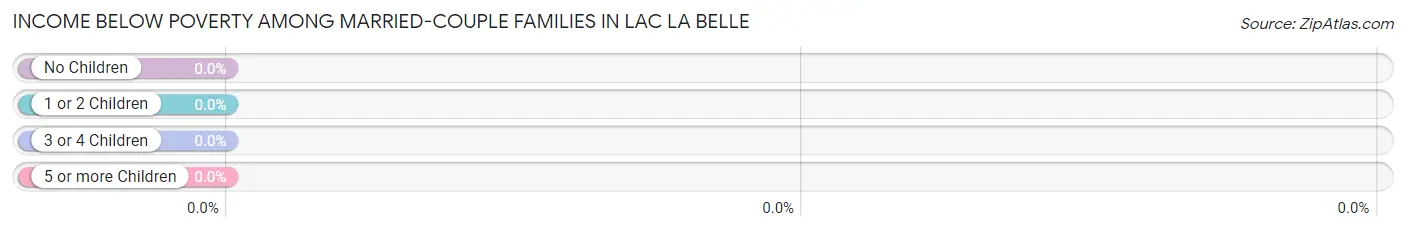
| Children | Above Poverty | Below Poverty |
| No Children | 53 (100.0%) | 0 (0.0%) |
| 1 or 2 Children | 23 (100.0%) | 0 (0.0%) |
| 3 or 4 Children | 1 (100.0%) | 0 (0.0%) |
| 5 or more Children | 0 (0.0%) | 0 (0.0%) |
| Total | 77 (100.0%) | 0 (0.0%) |
Income Below Poverty Among Single-Parent Households in Lac La Belle
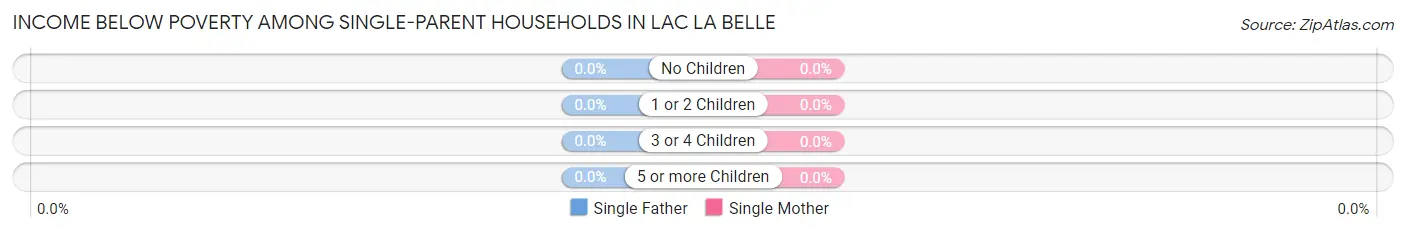
| Children | Single Father | Single Mother |
| No Children | 0 (0.0%) | 0 (0.0%) |
| 1 or 2 Children | 0 (0.0%) | 0 (0.0%) |
| 3 or 4 Children | 0 (0.0%) | 0 (0.0%) |
| 5 or more Children | 0 (0.0%) | 0 (0.0%) |
| Total | 0 (0.0%) | 0 (0.0%) |
Income Below Poverty Among Married-Couple vs Single-Parent Households in Lac La Belle
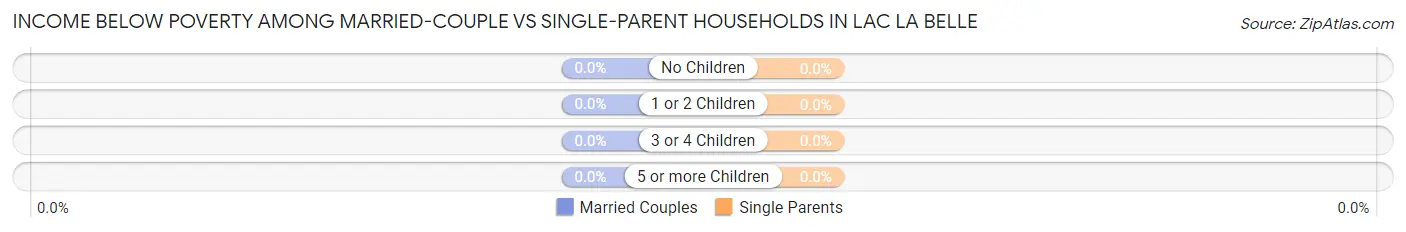
| Children | Married-Couple Families | Single-Parent Households |
| No Children | 0 (0.0%) | 0 (0.0%) |
| 1 or 2 Children | 0 (0.0%) | 0 (0.0%) |
| 3 or 4 Children | 0 (0.0%) | 0 (0.0%) |
| 5 or more Children | 0 (0.0%) | 0 (0.0%) |
| Total | 0 (0.0%) | 0 (0.0%) |
Race in Lac La Belle
The most populous races in Lac La Belle are White / Caucasian (239 | 94.8%), Two or more Races (11 | 4.4%), and Hispanic or Latino (8 | 3.2%).
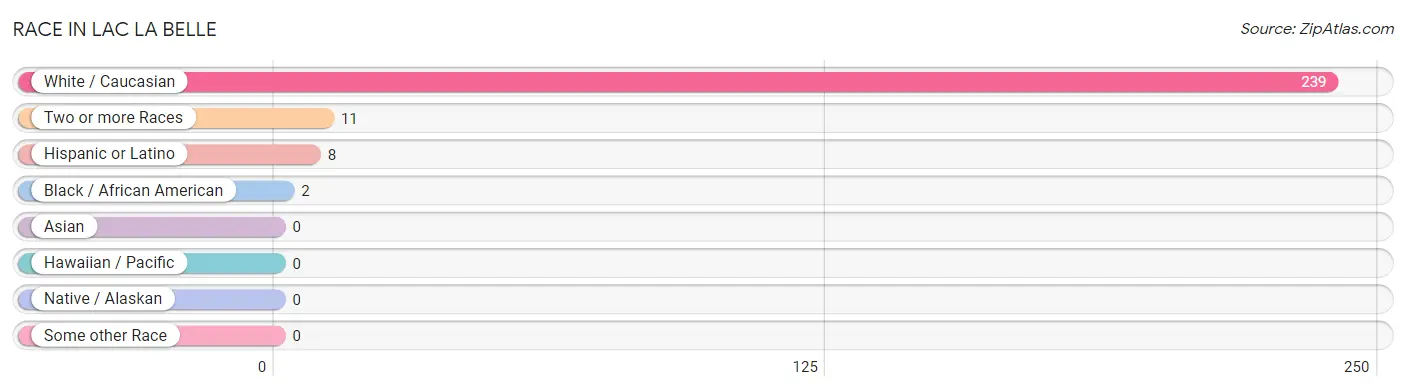
| Race | # Population | % Population |
| Asian | 0 | 0.0% |
| Black / African American | 2 | 0.8% |
| Hawaiian / Pacific | 0 | 0.0% |
| Hispanic or Latino | 8 | 3.2% |
| Native / Alaskan | 0 | 0.0% |
| White / Caucasian | 239 | 94.8% |
| Two or more Races | 11 | 4.4% |
| Some other Race | 0 | 0.0% |
| Total | 252 | 100.0% |
Ancestry in Lac La Belle
The most populous ancestries reported in Lac La Belle are German (92 | 36.5%), Irish (37 | 14.7%), English (29 | 11.5%), Polish (27 | 10.7%), and American (24 | 9.5%), together accounting for 82.9% of all Lac La Belle residents.
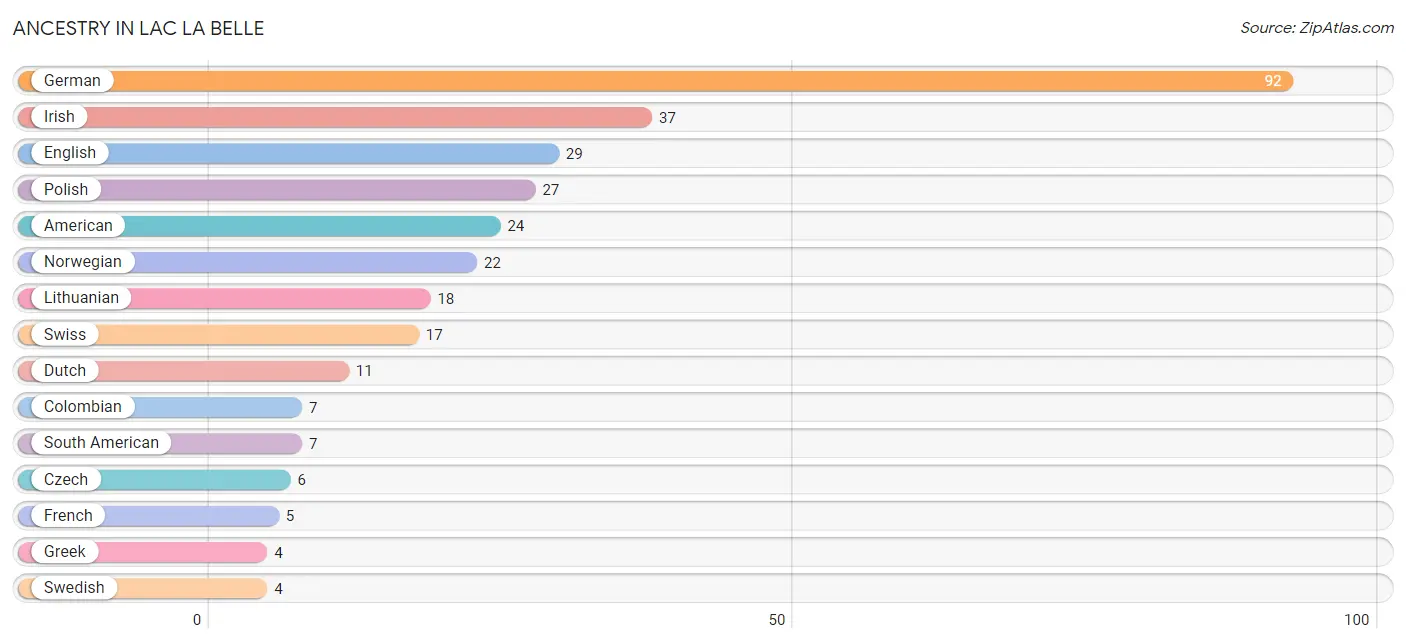
| Ancestry | # Population | % Population |
| American | 24 | 9.5% |
| Austrian | 2 | 0.8% |
| British | 1 | 0.4% |
| Chippewa | 3 | 1.2% |
| Colombian | 7 | 2.8% |
| Czech | 6 | 2.4% |
| Czechoslovakian | 1 | 0.4% |
| Danish | 2 | 0.8% |
| Dutch | 11 | 4.4% |
| Eastern European | 2 | 0.8% |
| English | 29 | 11.5% |
| Finnish | 3 | 1.2% |
| French | 5 | 2.0% |
| German | 92 | 36.5% |
| Greek | 4 | 1.6% |
| Irish | 37 | 14.7% |
| Italian | 3 | 1.2% |
| Lithuanian | 18 | 7.1% |
| Norwegian | 22 | 8.7% |
| Polish | 27 | 10.7% |
| Scandinavian | 2 | 0.8% |
| Scottish | 3 | 1.2% |
| Slavic | 2 | 0.8% |
| South American | 7 | 2.8% |
| Swedish | 4 | 1.6% |
| Swiss | 17 | 6.8% |
| Welsh | 1 | 0.4% | View All 27 Rows |
Immigrants in Lac La Belle
The most numerous immigrant groups reported in Lac La Belle came from Colombia (7 | 2.8%), Latin America (7 | 2.8%), South America (7 | 2.8%), Europe (1 | 0.4%), and Germany (1 | 0.4%), together accounting for 9.1% of all Lac La Belle residents.
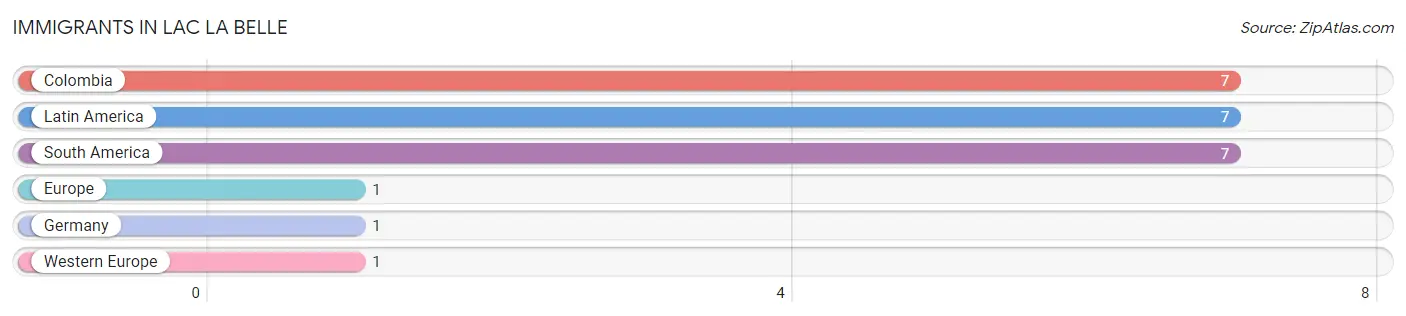
| Immigration Origin | # Population | % Population |
| Colombia | 7 | 2.8% |
| Europe | 1 | 0.4% |
| Germany | 1 | 0.4% |
| Latin America | 7 | 2.8% |
| South America | 7 | 2.8% |
| Western Europe | 1 | 0.4% | View All 6 Rows |
Sex and Age in Lac La Belle
Sex and Age in Lac La Belle
The most populous age groups in Lac La Belle are 65 to 69 Years (16 | 11.8%) for men and 60 to 64 Years (18 | 15.5%) for women.
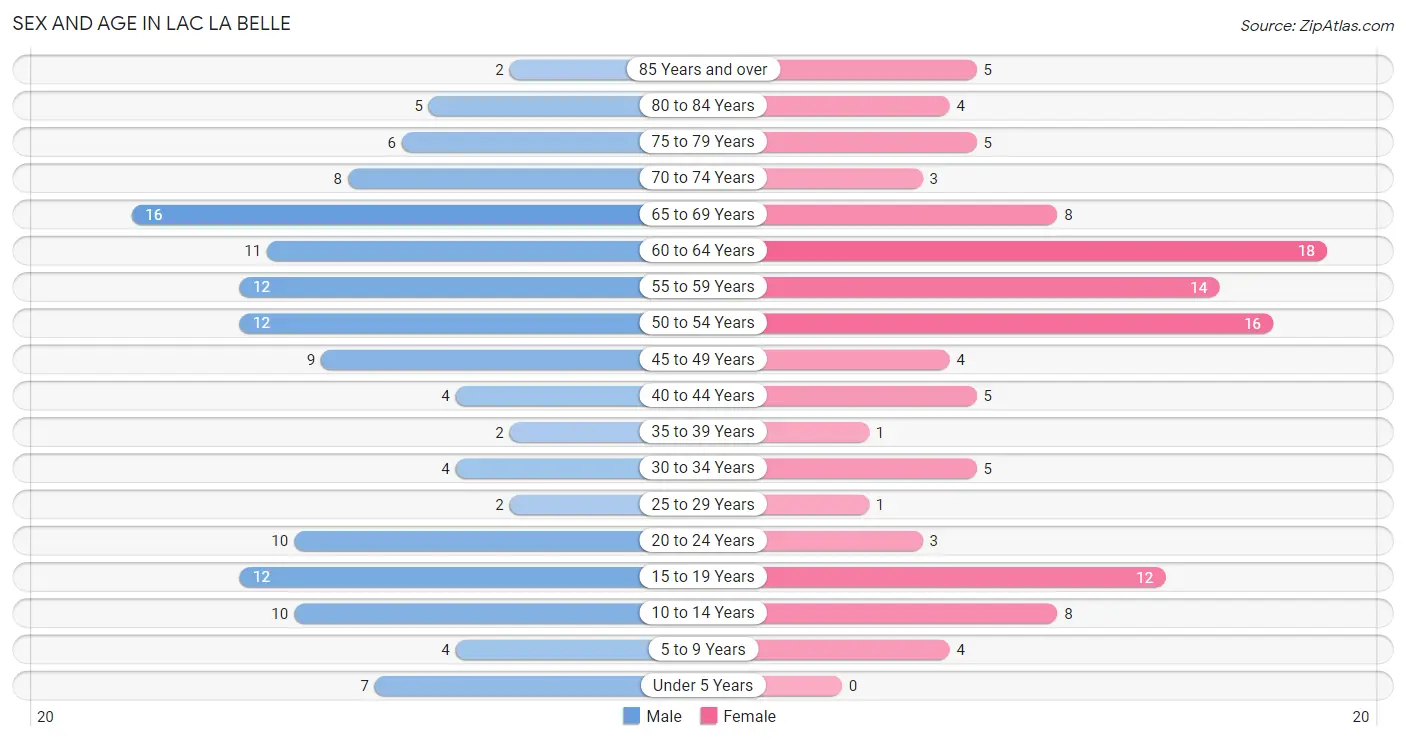
| Age Bracket | Male | Female |
| Under 5 Years | 7 (5.1%) | 0 (0.0%) |
| 5 to 9 Years | 4 (2.9%) | 4 (3.5%) |
| 10 to 14 Years | 10 (7.3%) | 8 (6.9%) |
| 15 to 19 Years | 12 (8.8%) | 12 (10.3%) |
| 20 to 24 Years | 10 (7.3%) | 3 (2.6%) |
| 25 to 29 Years | 2 (1.5%) | 1 (0.9%) |
| 30 to 34 Years | 4 (2.9%) | 5 (4.3%) |
| 35 to 39 Years | 2 (1.5%) | 1 (0.9%) |
| 40 to 44 Years | 4 (2.9%) | 5 (4.3%) |
| 45 to 49 Years | 9 (6.6%) | 4 (3.5%) |
| 50 to 54 Years | 12 (8.8%) | 16 (13.8%) |
| 55 to 59 Years | 12 (8.8%) | 14 (12.1%) |
| 60 to 64 Years | 11 (8.1%) | 18 (15.5%) |
| 65 to 69 Years | 16 (11.8%) | 8 (6.9%) |
| 70 to 74 Years | 8 (5.9%) | 3 (2.6%) |
| 75 to 79 Years | 6 (4.4%) | 5 (4.3%) |
| 80 to 84 Years | 5 (3.7%) | 4 (3.5%) |
| 85 Years and over | 2 (1.5%) | 5 (4.3%) |
| Total | 136 (100.0%) | 116 (100.0%) |
Families and Households in Lac La Belle
Median Family Size in Lac La Belle
The median family size in Lac La Belle is 2.75 persons per family, with single male/father families (3 | 3.5%) accounting for the largest median family size of 3.67 persons per family. On the other hand, single female/mother families (5 | 5.9%) represent the smallest median family size with 2.00 persons per family.
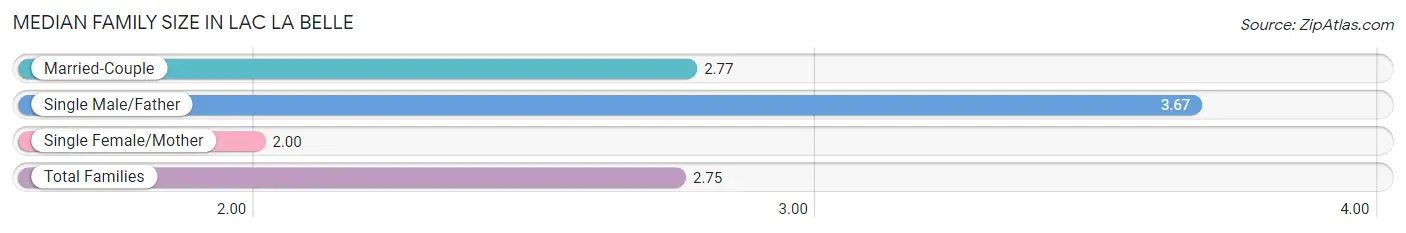
| Family Type | # Families | Family Size |
| Married-Couple | 77 (90.6%) | 2.77 |
| Single Male/Father | 3 (3.5%) | 3.67 |
| Single Female/Mother | 5 (5.9%) | 2.00 |
| Total Families | 85 (100.0%) | 2.75 |
Median Household Size in Lac La Belle
The median household size in Lac La Belle is 2.55 persons per household, with single male/father households (3 | 3.0%) accounting for the largest median household size of 3.67 persons per household. non-family households (14 | 14.1%) represent the smallest median household size with 1.14 persons per household.
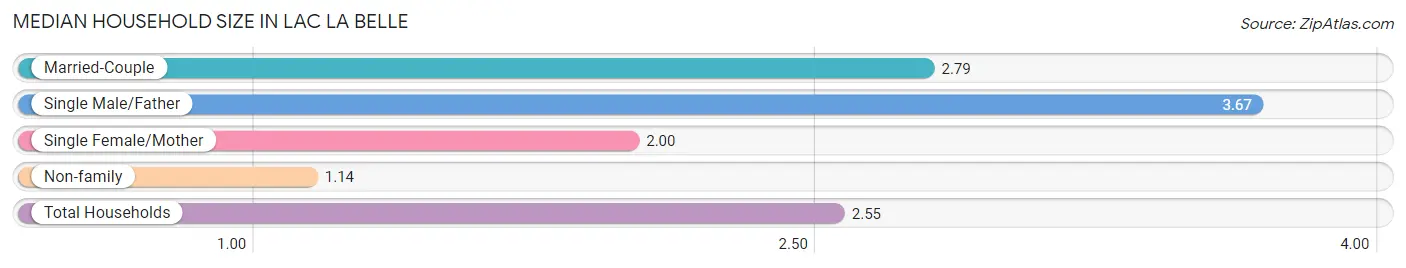
| Household Type | # Households | Household Size |
| Married-Couple | 77 (77.8%) | 2.79 |
| Single Male/Father | 3 (3.0%) | 3.67 |
| Single Female/Mother | 5 (5.1%) | 2.00 |
| Non-family | 14 (14.1%) | 1.14 |
| Total Households | 99 (100.0%) | 2.55 |
Household Size by Marriage Status in Lac La Belle
Out of a total of 99 households in Lac La Belle, 85 (85.9%) are family households, while 14 (14.1%) are nonfamily households. The most numerous type of family households are 2-person households, comprising 52, and the most common type of nonfamily households are 1-person households, comprising 11.
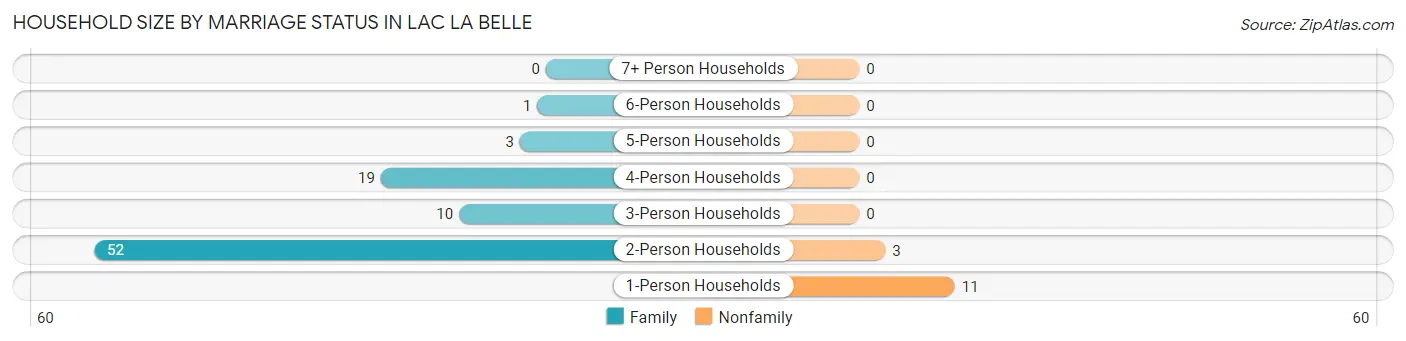
| Household Size | Family Households | Nonfamily Households |
| 1-Person Households | - | 11 (11.1%) |
| 2-Person Households | 52 (52.5%) | 3 (3.0%) |
| 3-Person Households | 10 (10.1%) | 0 (0.0%) |
| 4-Person Households | 19 (19.2%) | 0 (0.0%) |
| 5-Person Households | 3 (3.0%) | 0 (0.0%) |
| 6-Person Households | 1 (1.0%) | 0 (0.0%) |
| 7+ Person Households | 0 (0.0%) | 0 (0.0%) |
| Total | 85 (85.9%) | 14 (14.1%) |
Female Fertility in Lac La Belle
Fertility by Age in Lac La Belle
| Age Bracket | Women with Births | Births / 1,000 Women |
| 15 to 19 years | 0 (0.0%) | 0.0 |
| 20 to 34 years | 0 (0.0%) | 0.0 |
| 35 to 50 years | 0 (0.0%) | 0.0 |
| Total | 0 (0.0%) | 0.0 |
Fertility by Age by Marriage Status in Lac La Belle
| Age Bracket | Married | Unmarried |
| 15 to 19 years | 0 (0.0%) | 0 (0.0%) |
| 20 to 34 years | 0 (0.0%) | 0 (0.0%) |
| 35 to 50 years | 0 (0.0%) | 0 (0.0%) |
| Total | 0 (0.0%) | 0 (0.0%) |
Fertility by Education in Lac La Belle
| Educational Attainment | Women with Births | Births / 1,000 Women |
| Less than High School | 0 (0.0%) | 0.0 |
| High School Diploma | 0 (0.0%) | 0.0 |
| College or Associate's Degree | 0 (0.0%) | 0.0 |
| Bachelor's Degree | 0 (0.0%) | 0.0 |
| Graduate Degree | 0 (0.0%) | 0.0 |
| Total | 0 (0.0%) | 0.0 |
Fertility by Education by Marriage Status in Lac La Belle
| Educational Attainment | Married | Unmarried |
| Less than High School | 0 (0.0%) | 0 (0.0%) |
| High School Diploma | 0 (0.0%) | 0 (0.0%) |
| College or Associate's Degree | 0 (0.0%) | 0 (0.0%) |
| Bachelor's Degree | 0 (0.0%) | 0 (0.0%) |
| Graduate Degree | 0 (0.0%) | 0 (0.0%) |
| Total | 0 (0.0%) | 0 (0.0%) |
Employment Characteristics in Lac La Belle
Employment by Class of Employer in Lac La Belle
Among the 132 employed individuals in Lac La Belle, private company employees (101 | 76.5%), self-employed (incorporated) (20 | 15.1%), and not-for-profit organizations (6 | 4.5%) make up the most common classes of employment.
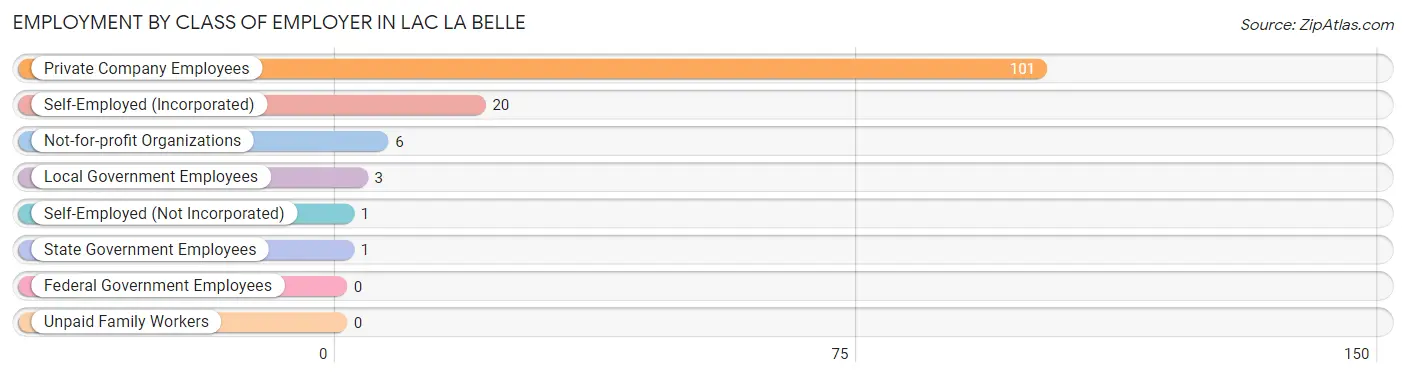
| Employer Class | # Employees | % Employees |
| Private Company Employees | 101 | 76.5% |
| Self-Employed (Incorporated) | 20 | 15.1% |
| Self-Employed (Not Incorporated) | 1 | 0.8% |
| Not-for-profit Organizations | 6 | 4.5% |
| Local Government Employees | 3 | 2.3% |
| State Government Employees | 1 | 0.8% |
| Federal Government Employees | 0 | 0.0% |
| Unpaid Family Workers | 0 | 0.0% |
| Total | 132 | 100.0% |
Employment Status by Age in Lac La Belle
According to the labor force statistics for Lac La Belle, out of the total population over 16 years of age (219), 62.6% or 137 individuals are in the labor force, with 2.2% or 3 of them unemployed. The age group with the highest labor force participation rate is 20 to 24 years, with 100.0% or 13 individuals in the labor force. Within the labor force, the 16 to 19 years age range has the highest percentage of unemployed individuals, with 20.0% or 2 of them being unemployed.
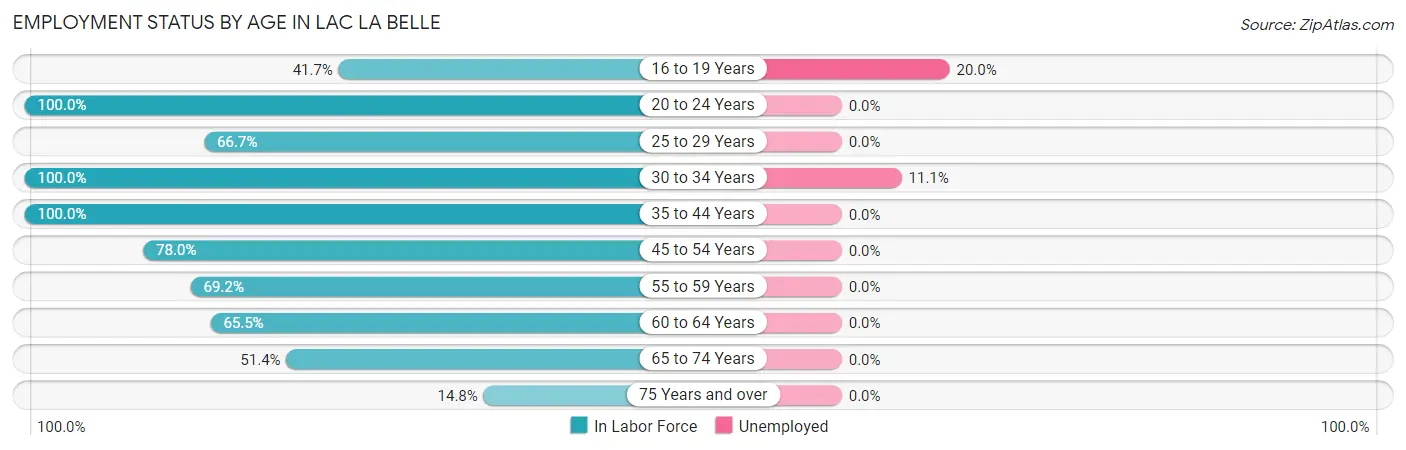
| Age Bracket | In Labor Force | Unemployed |
| 16 to 19 Years | 10 (41.7%) | 2 (20.0%) |
| 20 to 24 Years | 13 (100.0%) | 0 (0.0%) |
| 25 to 29 Years | 2 (66.7%) | 0 (0.0%) |
| 30 to 34 Years | 9 (100.0%) | 1 (11.1%) |
| 35 to 44 Years | 12 (100.0%) | 0 (0.0%) |
| 45 to 54 Years | 32 (78.0%) | 0 (0.0%) |
| 55 to 59 Years | 18 (69.2%) | 0 (0.0%) |
| 60 to 64 Years | 19 (65.5%) | 0 (0.0%) |
| 65 to 74 Years | 18 (51.4%) | 0 (0.0%) |
| 75 Years and over | 4 (14.8%) | 0 (0.0%) |
| Total | 137 (62.6%) | 3 (2.2%) |
Employment Status by Educational Attainment in Lac La Belle
According to labor force statistics for Lac La Belle, 76.7% of individuals (92) out of the total population between 25 and 64 years of age (120) are in the labor force, with 1.1% or 1 of them being unemployed. The group with the highest labor force participation rate are those with the educational attainment of high school diploma, with 100.0% or 2 individuals in the labor force. Within the labor force, individuals with bachelor's degree or higher education have the highest percentage of unemployment, with 1.4% or 1 of them being unemployed.
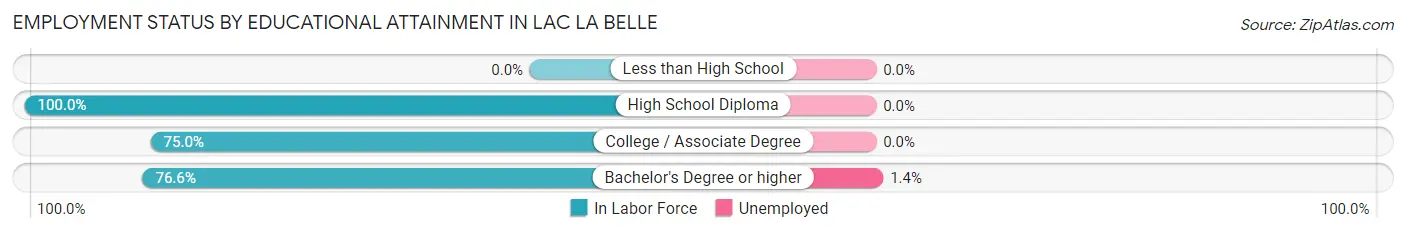
| Educational Attainment | In Labor Force | Unemployed |
| Less than High School | 0 (0.0%) | 0 (0.0%) |
| High School Diploma | 2 (100.0%) | 0 (0.0%) |
| College / Associate Degree | 18 (75.0%) | 0 (0.0%) |
| Bachelor's Degree or higher | 72 (76.6%) | 1 (1.4%) |
| Total | 92 (76.7%) | 1 (1.1%) |
Employment Occupations by Sex in Lac La Belle
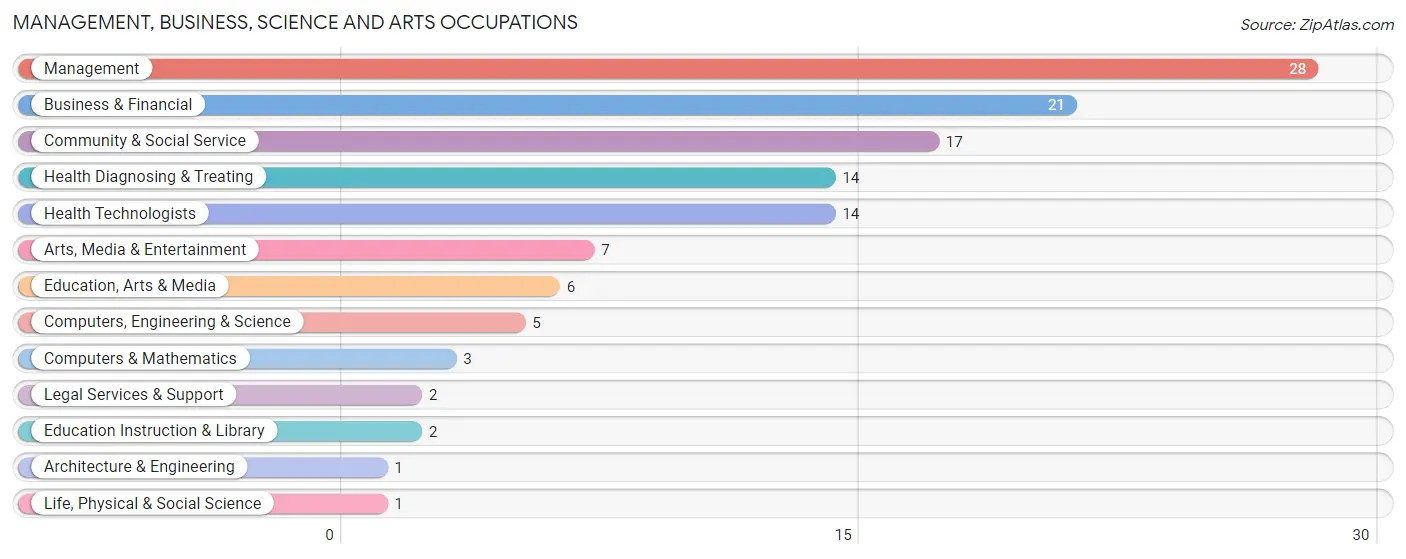
Management, Business, Science and Arts Occupations
The most common Management, Business, Science and Arts occupations in Lac La Belle are Management (28 | 20.9%), Business & Financial (21 | 15.7%), Community & Social Service (17 | 12.7%), Health Diagnosing & Treating (14 | 10.4%), and Health Technologists (14 | 10.4%).
Management, Business, Science and Arts Occupations by Sex
Within the Management, Business, Science and Arts occupations in Lac La Belle, the most male-oriented occupations are Architecture & Engineering (100.0%), Legal Services & Support (100.0%), and Arts, Media & Entertainment (85.7%), while the most female-oriented occupations are Life, Physical & Social Science (100.0%), Education, Arts & Media (66.7%), and Education Instruction & Library (50.0%).
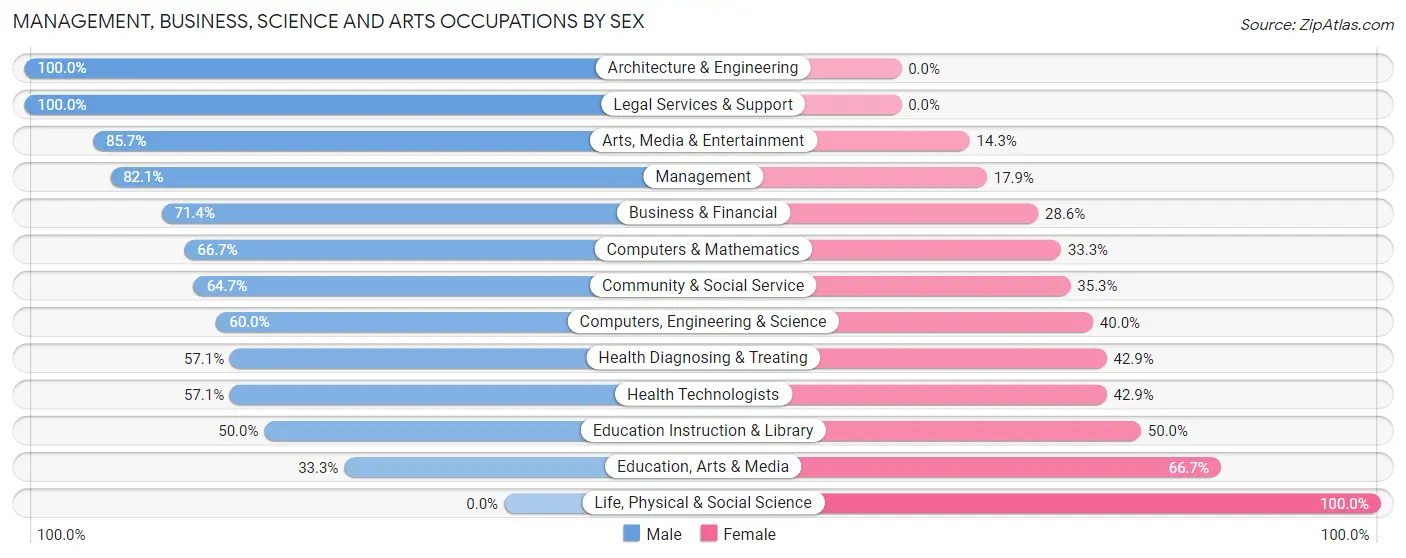
| Occupation | Male | Female |
| Management | 23 (82.1%) | 5 (17.9%) |
| Business & Financial | 15 (71.4%) | 6 (28.6%) |
| Computers, Engineering & Science | 3 (60.0%) | 2 (40.0%) |
| Computers & Mathematics | 2 (66.7%) | 1 (33.3%) |
| Architecture & Engineering | 1 (100.0%) | 0 (0.0%) |
| Life, Physical & Social Science | 0 (0.0%) | 1 (100.0%) |
| Community & Social Service | 11 (64.7%) | 6 (35.3%) |
| Education, Arts & Media | 2 (33.3%) | 4 (66.7%) |
| Legal Services & Support | 2 (100.0%) | 0 (0.0%) |
| Education Instruction & Library | 1 (50.0%) | 1 (50.0%) |
| Arts, Media & Entertainment | 6 (85.7%) | 1 (14.3%) |
| Health Diagnosing & Treating | 8 (57.1%) | 6 (42.9%) |
| Health Technologists | 8 (57.1%) | 6 (42.9%) |
| Total (Category) | 60 (70.6%) | 25 (29.4%) |
| Total (Overall) | 87 (64.9%) | 47 (35.1%) |
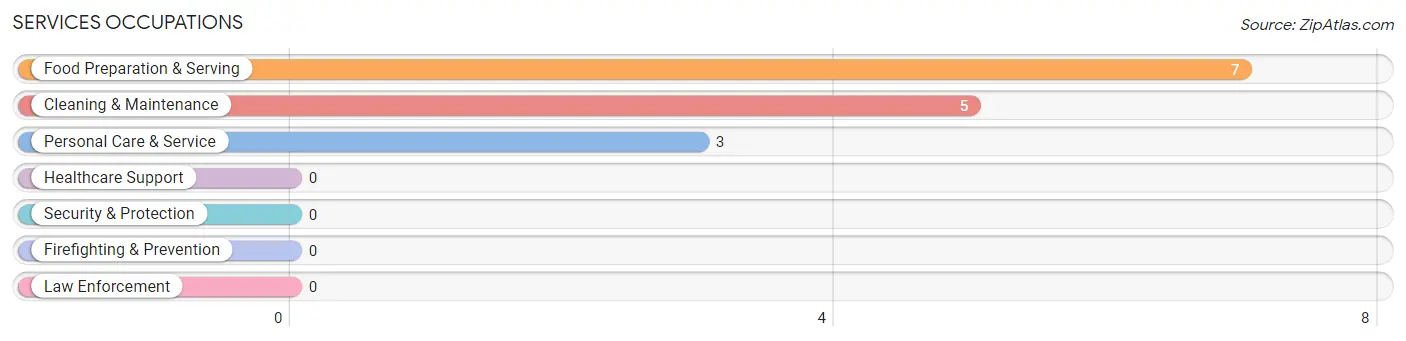
Services Occupations
The most common Services occupations in Lac La Belle are Food Preparation & Serving (7 | 5.2%), Cleaning & Maintenance (5 | 3.7%), and Personal Care & Service (3 | 2.2%).
Services Occupations by Sex
Within the Services occupations in Lac La Belle, the most male-oriented occupations are Cleaning & Maintenance (100.0%), Food Preparation & Serving (85.7%), and Personal Care & Service (33.3%), while the most female-oriented occupations are Personal Care & Service (66.7%), and Food Preparation & Serving (14.3%).
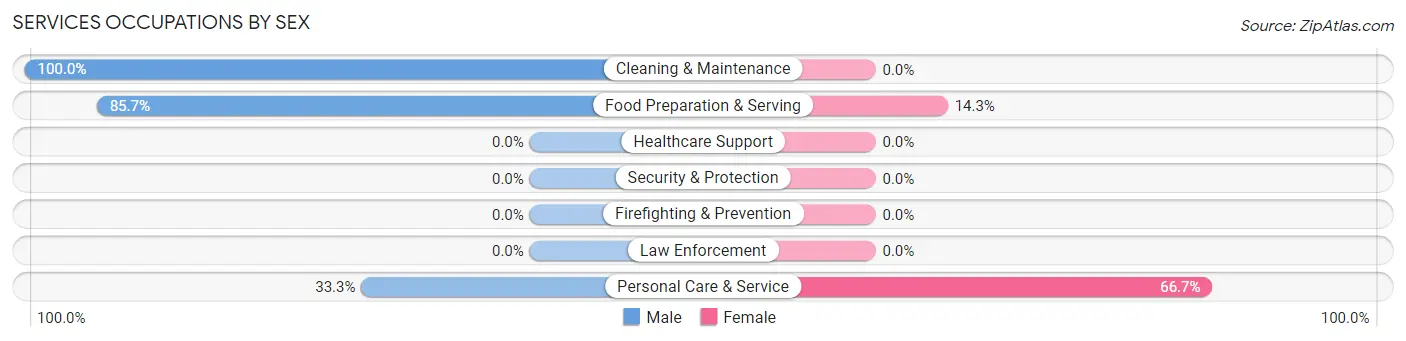
| Occupation | Male | Female |
| Healthcare Support | 0 (0.0%) | 0 (0.0%) |
| Security & Protection | 0 (0.0%) | 0 (0.0%) |
| Firefighting & Prevention | 0 (0.0%) | 0 (0.0%) |
| Law Enforcement | 0 (0.0%) | 0 (0.0%) |
| Food Preparation & Serving | 6 (85.7%) | 1 (14.3%) |
| Cleaning & Maintenance | 5 (100.0%) | 0 (0.0%) |
| Personal Care & Service | 1 (33.3%) | 2 (66.7%) |
| Total (Category) | 12 (80.0%) | 3 (20.0%) |
| Total (Overall) | 87 (64.9%) | 47 (35.1%) |
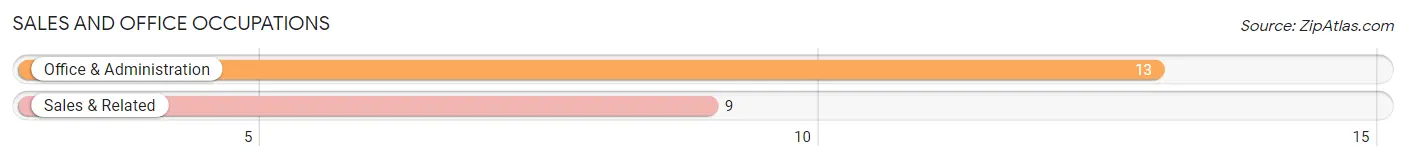
Sales and Office Occupations
The most common Sales and Office occupations in Lac La Belle are Office & Administration (13 | 9.7%), and Sales & Related (9 | 6.7%).
Sales and Office Occupations by Sex
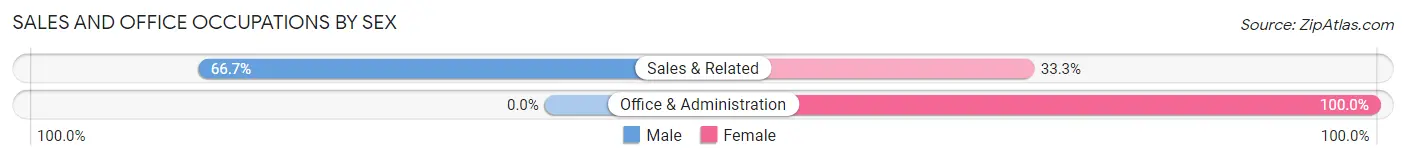
| Occupation | Male | Female |
| Sales & Related | 6 (66.7%) | 3 (33.3%) |
| Office & Administration | 0 (0.0%) | 13 (100.0%) |
| Total (Category) | 6 (27.3%) | 16 (72.7%) |
| Total (Overall) | 87 (64.9%) | 47 (35.1%) |
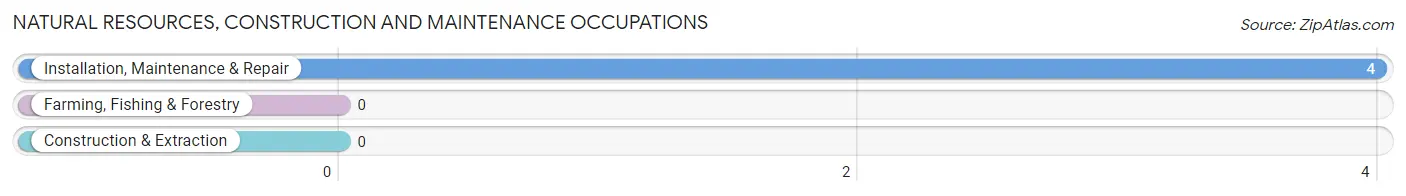
Natural Resources, Construction and Maintenance Occupations
The most common Natural Resources, Construction and Maintenance occupations in Lac La Belle are , and Installation, Maintenance & Repair (4 | 3.0%).
Natural Resources, Construction and Maintenance Occupations by Sex
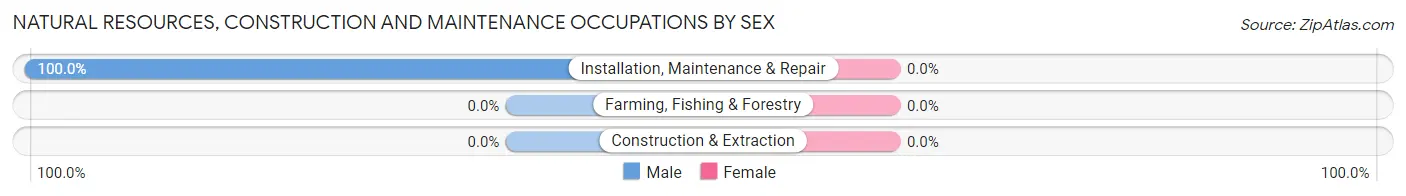
| Occupation | Male | Female |
| Farming, Fishing & Forestry | 0 (0.0%) | 0 (0.0%) |
| Construction & Extraction | 0 (0.0%) | 0 (0.0%) |
| Installation, Maintenance & Repair | 4 (100.0%) | 0 (0.0%) |
| Total (Category) | 4 (100.0%) | 0 (0.0%) |
| Total (Overall) | 87 (64.9%) | 47 (35.1%) |
Production, Transportation and Moving Occupations
The most common Production, Transportation and Moving occupations in Lac La Belle are Production (7 | 5.2%), and Transportation (1 | 0.7%).
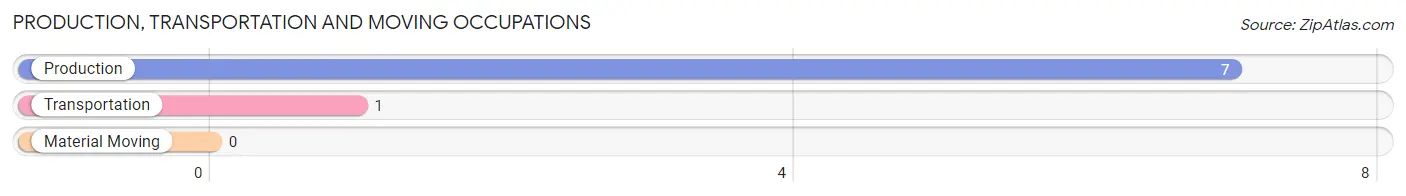
Production, Transportation and Moving Occupations by Sex
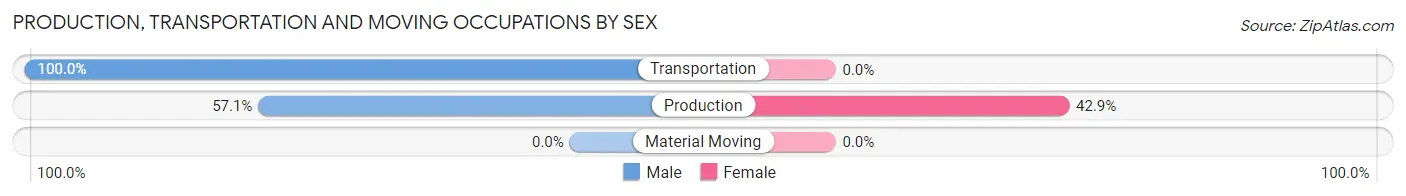
| Occupation | Male | Female |
| Production | 4 (57.1%) | 3 (42.9%) |
| Transportation | 1 (100.0%) | 0 (0.0%) |
| Material Moving | 0 (0.0%) | 0 (0.0%) |
| Total (Category) | 5 (62.5%) | 3 (37.5%) |
| Total (Overall) | 87 (64.9%) | 47 (35.1%) |
Employment Industries by Sex in Lac La Belle
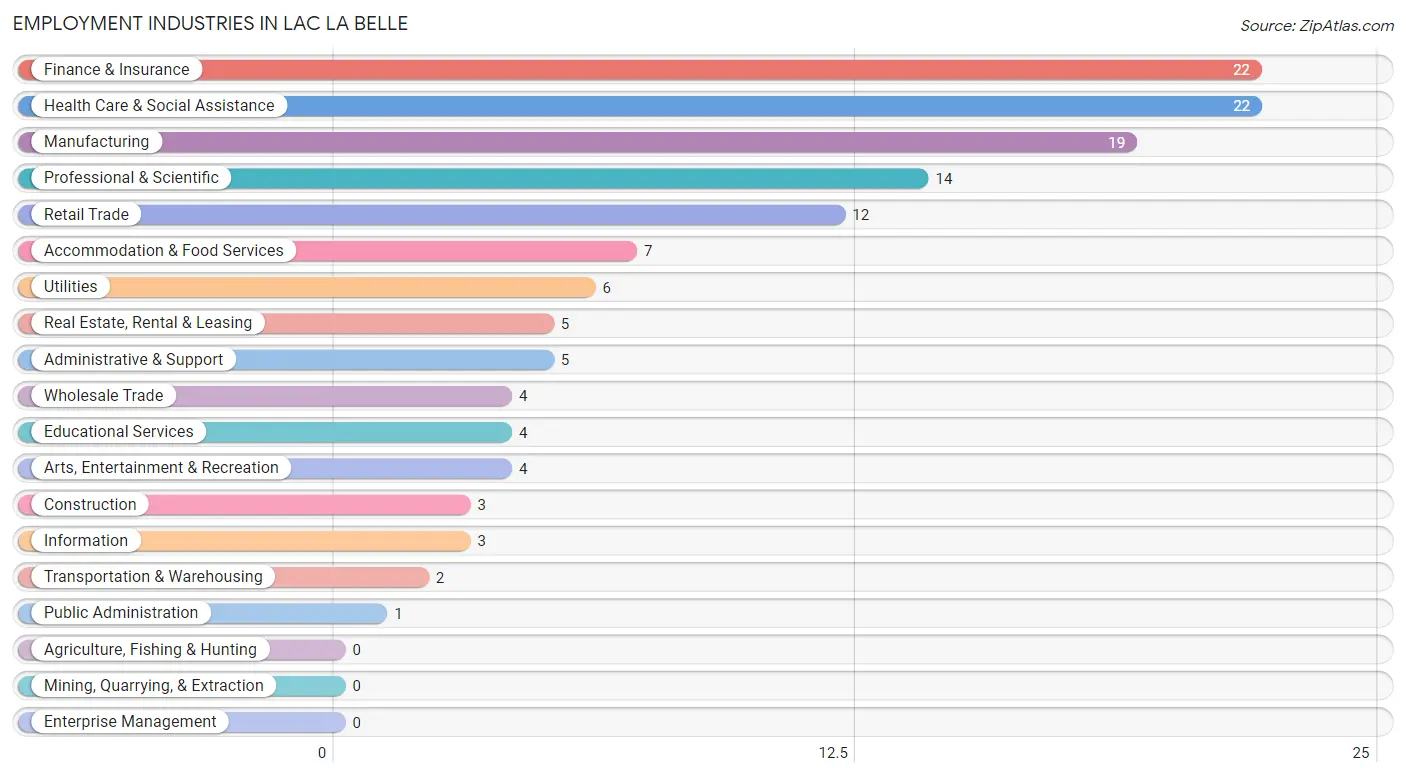
Employment Industries in Lac La Belle
The major employment industries in Lac La Belle include Finance & Insurance (22 | 16.4%), Health Care & Social Assistance (22 | 16.4%), Manufacturing (19 | 14.2%), Professional & Scientific (14 | 10.4%), and Retail Trade (12 | 9.0%).
Employment Industries by Sex in Lac La Belle
The Lac La Belle industries that see more men than women are Construction (100.0%), Administrative & Support (100.0%), and Arts, Entertainment & Recreation (100.0%), whereas the industries that tend to have a higher number of women are Wholesale Trade (100.0%), Educational Services (75.0%), and Health Care & Social Assistance (54.5%).
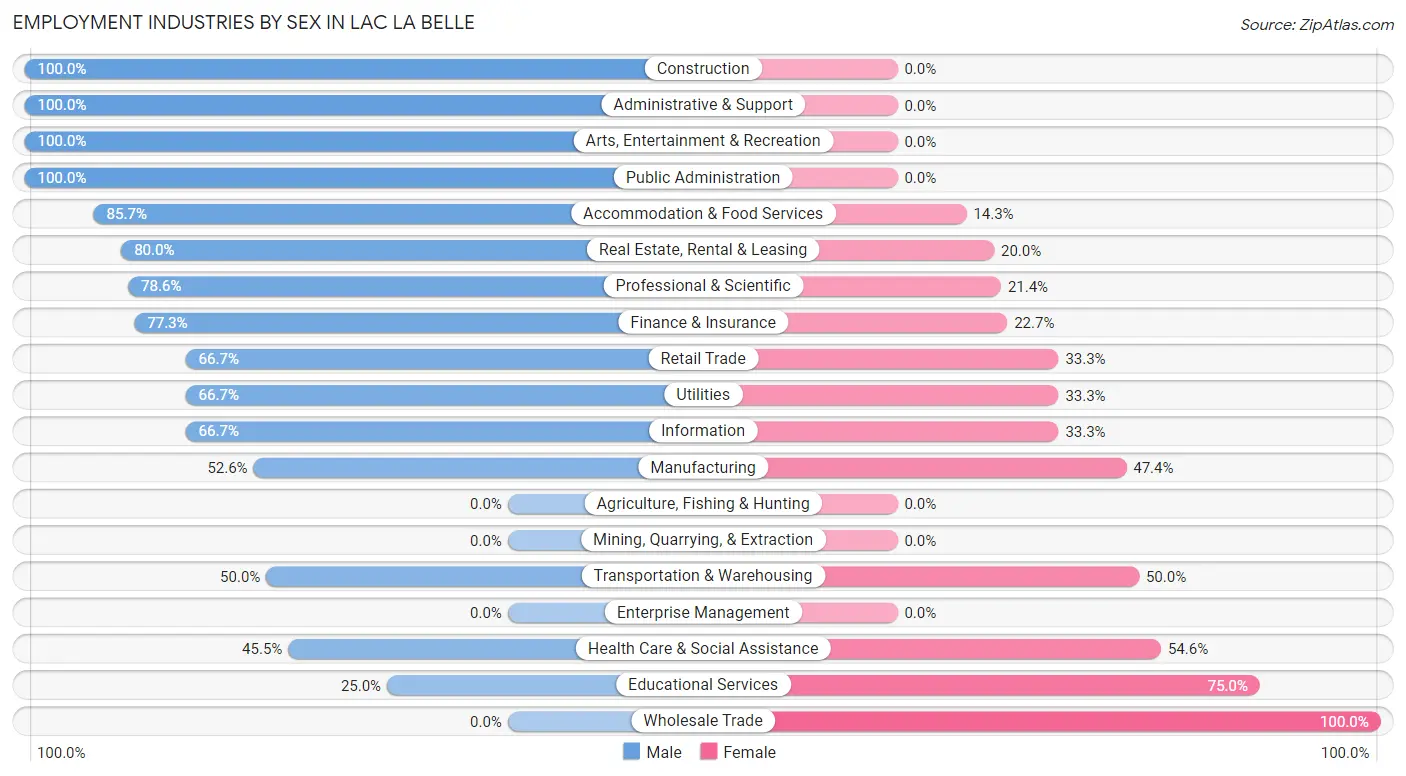
| Industry | Male | Female |
| Agriculture, Fishing & Hunting | 0 (0.0%) | 0 (0.0%) |
| Mining, Quarrying, & Extraction | 0 (0.0%) | 0 (0.0%) |
| Construction | 3 (100.0%) | 0 (0.0%) |
| Manufacturing | 10 (52.6%) | 9 (47.4%) |
| Wholesale Trade | 0 (0.0%) | 4 (100.0%) |
| Retail Trade | 8 (66.7%) | 4 (33.3%) |
| Transportation & Warehousing | 1 (50.0%) | 1 (50.0%) |
| Utilities | 4 (66.7%) | 2 (33.3%) |
| Information | 2 (66.7%) | 1 (33.3%) |
| Finance & Insurance | 17 (77.3%) | 5 (22.7%) |
| Real Estate, Rental & Leasing | 4 (80.0%) | 1 (20.0%) |
| Professional & Scientific | 11 (78.6%) | 3 (21.4%) |
| Enterprise Management | 0 (0.0%) | 0 (0.0%) |
| Administrative & Support | 5 (100.0%) | 0 (0.0%) |
| Educational Services | 1 (25.0%) | 3 (75.0%) |
| Health Care & Social Assistance | 10 (45.5%) | 12 (54.5%) |
| Arts, Entertainment & Recreation | 4 (100.0%) | 0 (0.0%) |
| Accommodation & Food Services | 6 (85.7%) | 1 (14.3%) |
| Public Administration | 1 (100.0%) | 0 (0.0%) |
| Total | 87 (64.9%) | 47 (35.1%) |
Education in Lac La Belle
School Enrollment in Lac La Belle
The most common levels of schooling among the 54 students in Lac La Belle are high school (23 | 42.6%), elementary school (11 | 20.4%), and middle school (9 | 16.7%).
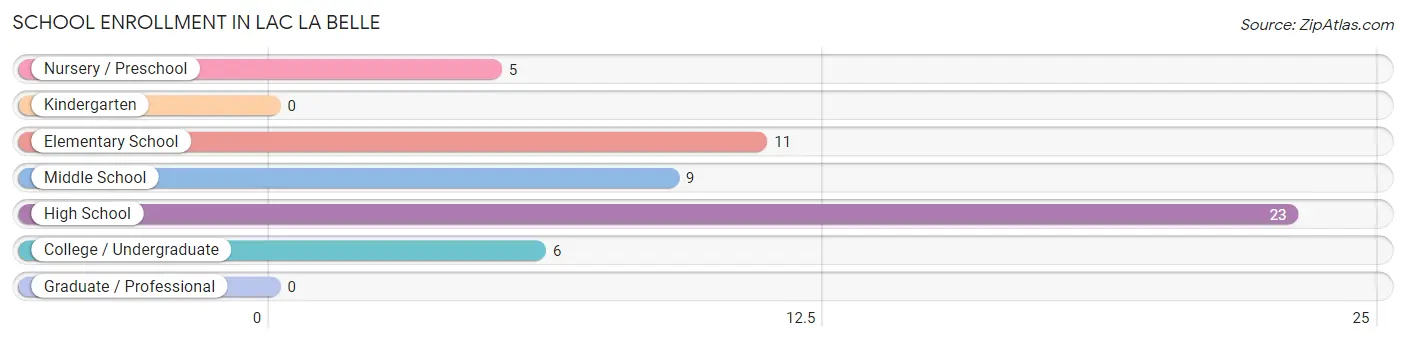
| School Level | # Students | % Students |
| Nursery / Preschool | 5 | 9.3% |
| Kindergarten | 0 | 0.0% |
| Elementary School | 11 | 20.4% |
| Middle School | 9 | 16.7% |
| High School | 23 | 42.6% |
| College / Undergraduate | 6 | 11.1% |
| Graduate / Professional | 0 | 0.0% |
| Total | 54 | 100.0% |
School Enrollment by Age by Funding Source in Lac La Belle
Out of a total of 54 students who are enrolled in schools in Lac La Belle, 14 (25.9%) attend a private institution, while the remaining 40 (74.1%) are enrolled in public schools. The age group of 20 to 24 year olds has the highest likelihood of being enrolled in private schools, with 2 (66.7% in the age bracket) enrolled. Conversely, the age group of 3 to 4 year olds has the lowest likelihood of being enrolled in a private school, with 5 (100.0% in the age bracket) attending a public institution.
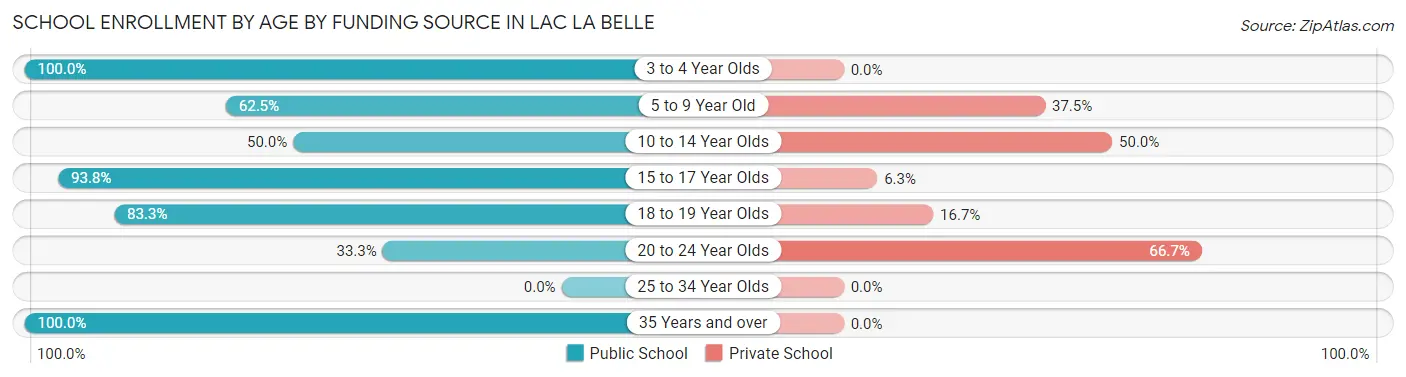
| Age Bracket | Public School | Private School |
| 3 to 4 Year Olds | 5 (100.0%) | 0 (0.0%) |
| 5 to 9 Year Old | 5 (62.5%) | 3 (37.5%) |
| 10 to 14 Year Olds | 7 (50.0%) | 7 (50.0%) |
| 15 to 17 Year Olds | 15 (93.8%) | 1 (6.2%) |
| 18 to 19 Year Olds | 5 (83.3%) | 1 (16.7%) |
| 20 to 24 Year Olds | 1 (33.3%) | 2 (66.7%) |
| 25 to 34 Year Olds | 0 (0.0%) | 0 (0.0%) |
| 35 Years and over | 2 (100.0%) | 0 (0.0%) |
| Total | 40 (74.1%) | 14 (25.9%) |
Educational Attainment by Field of Study in Lac La Belle
Business (35 | 23.2%), education (24 | 15.9%), social sciences (21 | 13.9%), engineering (15 | 9.9%), and bio, nature & agricultural (11 | 7.3%) are the most common fields of study among 151 individuals in Lac La Belle who have obtained a bachelor's degree or higher.
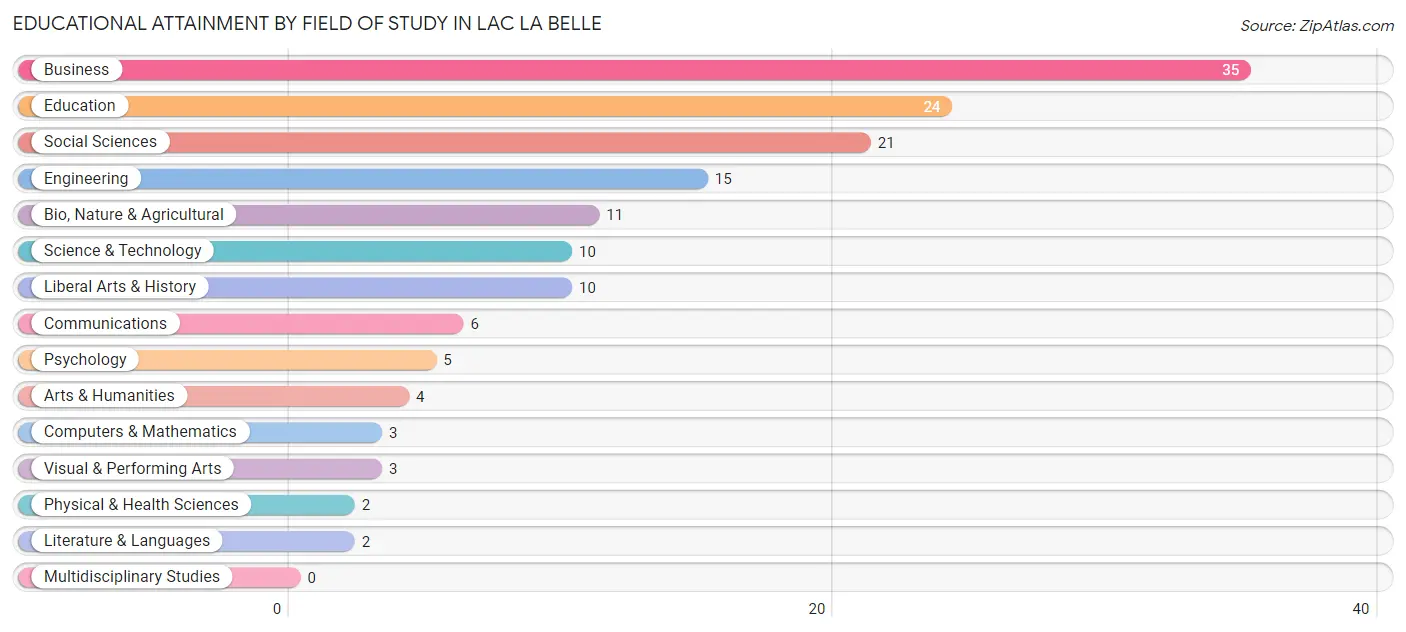
| Field of Study | # Graduates | % Graduates |
| Computers & Mathematics | 3 | 2.0% |
| Bio, Nature & Agricultural | 11 | 7.3% |
| Physical & Health Sciences | 2 | 1.3% |
| Psychology | 5 | 3.3% |
| Social Sciences | 21 | 13.9% |
| Engineering | 15 | 9.9% |
| Multidisciplinary Studies | 0 | 0.0% |
| Science & Technology | 10 | 6.6% |
| Business | 35 | 23.2% |
| Education | 24 | 15.9% |
| Literature & Languages | 2 | 1.3% |
| Liberal Arts & History | 10 | 6.6% |
| Visual & Performing Arts | 3 | 2.0% |
| Communications | 6 | 4.0% |
| Arts & Humanities | 4 | 2.6% |
| Total | 151 | 100.0% |
Transportation & Commute in Lac La Belle
Vehicle Availability by Sex in Lac La Belle
The most prevalent vehicle ownership categories in Lac La Belle are males with 2 vehicles (34, accounting for 39.1%) and females with 2 vehicles (20, making up 75.6%).
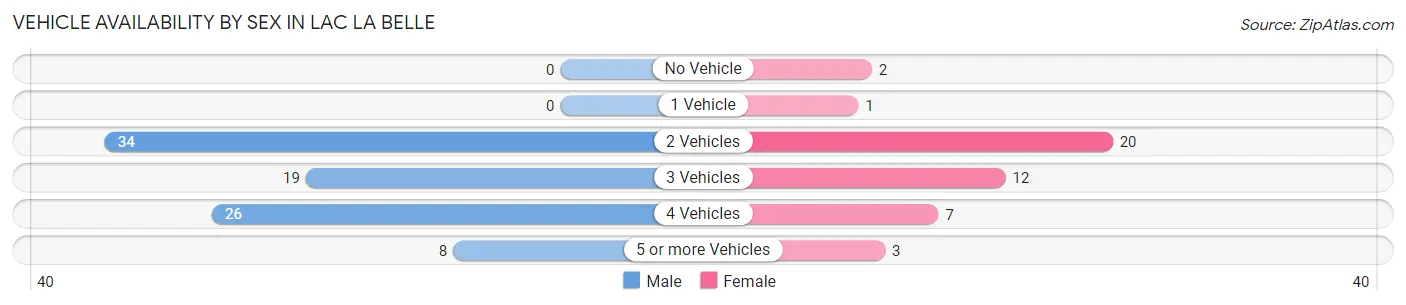
| Vehicles Available | Male | Female |
| No Vehicle | 0 (0.0%) | 2 (4.4%) |
| 1 Vehicle | 0 (0.0%) | 1 (2.2%) |
| 2 Vehicles | 34 (39.1%) | 20 (44.4%) |
| 3 Vehicles | 19 (21.8%) | 12 (26.7%) |
| 4 Vehicles | 26 (29.9%) | 7 (15.6%) |
| 5 or more Vehicles | 8 (9.2%) | 3 (6.7%) |
| Total | 87 (100.0%) | 45 (100.0%) |
Commute Time in Lac La Belle
The most frequently occuring commute durations in Lac La Belle are 30 to 34 minutes (17 commuters, 19.8%), 15 to 19 minutes (16 commuters, 18.6%), and 20 to 24 minutes (16 commuters, 18.6%).
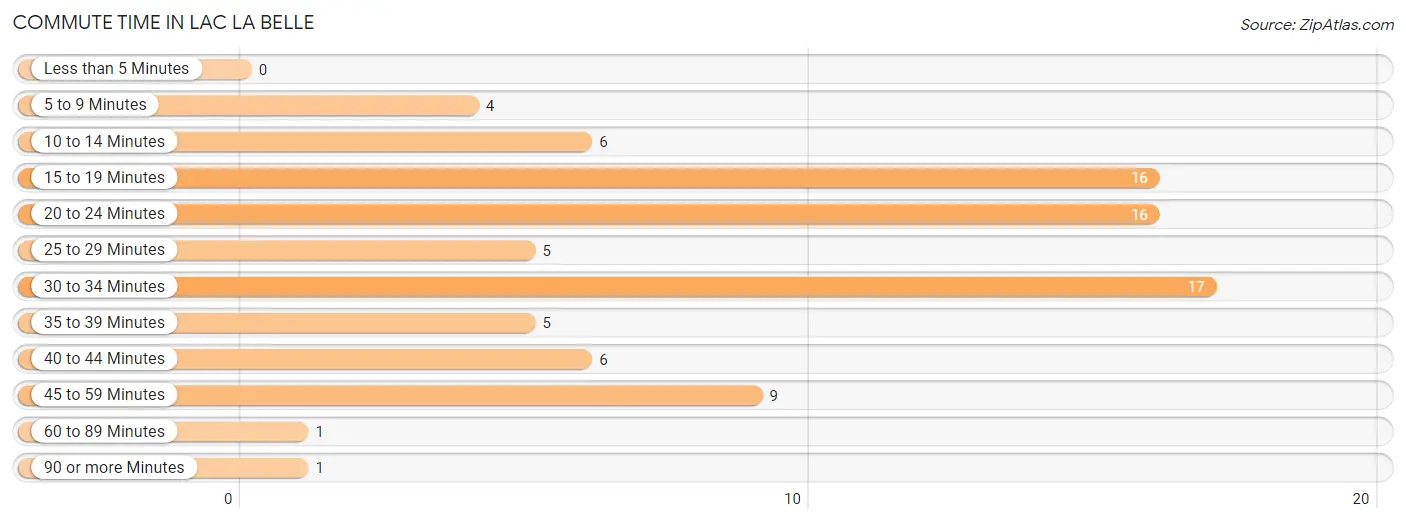
| Commute Time | # Commuters | % Commuters |
| Less than 5 Minutes | 0 | 0.0% |
| 5 to 9 Minutes | 4 | 4.6% |
| 10 to 14 Minutes | 6 | 7.0% |
| 15 to 19 Minutes | 16 | 18.6% |
| 20 to 24 Minutes | 16 | 18.6% |
| 25 to 29 Minutes | 5 | 5.8% |
| 30 to 34 Minutes | 17 | 19.8% |
| 35 to 39 Minutes | 5 | 5.8% |
| 40 to 44 Minutes | 6 | 7.0% |
| 45 to 59 Minutes | 9 | 10.5% |
| 60 to 89 Minutes | 1 | 1.2% |
| 90 or more Minutes | 1 | 1.2% |
Commute Time by Sex in Lac La Belle
The most common commute times in Lac La Belle are 30 to 34 minutes (14 commuters, 24.1%) for males and 15 to 19 minutes (5 commuters, 17.9%) for females.
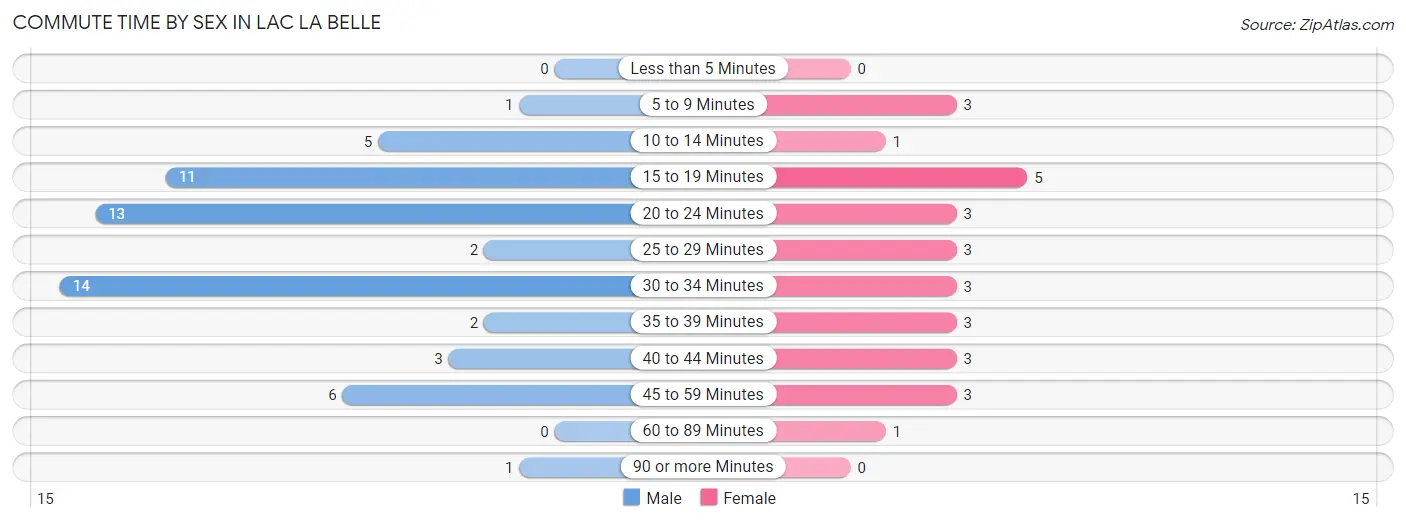
| Commute Time | Male | Female |
| Less than 5 Minutes | 0 (0.0%) | 0 (0.0%) |
| 5 to 9 Minutes | 1 (1.7%) | 3 (10.7%) |
| 10 to 14 Minutes | 5 (8.6%) | 1 (3.6%) |
| 15 to 19 Minutes | 11 (19.0%) | 5 (17.9%) |
| 20 to 24 Minutes | 13 (22.4%) | 3 (10.7%) |
| 25 to 29 Minutes | 2 (3.5%) | 3 (10.7%) |
| 30 to 34 Minutes | 14 (24.1%) | 3 (10.7%) |
| 35 to 39 Minutes | 2 (3.5%) | 3 (10.7%) |
| 40 to 44 Minutes | 3 (5.2%) | 3 (10.7%) |
| 45 to 59 Minutes | 6 (10.3%) | 3 (10.7%) |
| 60 to 89 Minutes | 0 (0.0%) | 1 (3.6%) |
| 90 or more Minutes | 1 (1.7%) | 0 (0.0%) |
Time of Departure to Work by Sex in Lac La Belle
The most frequent times of departure to work in Lac La Belle are 7:00 AM to 7:29 AM (14, 24.1%) for males and 7:30 AM to 7:59 AM (5, 17.9%) for females.
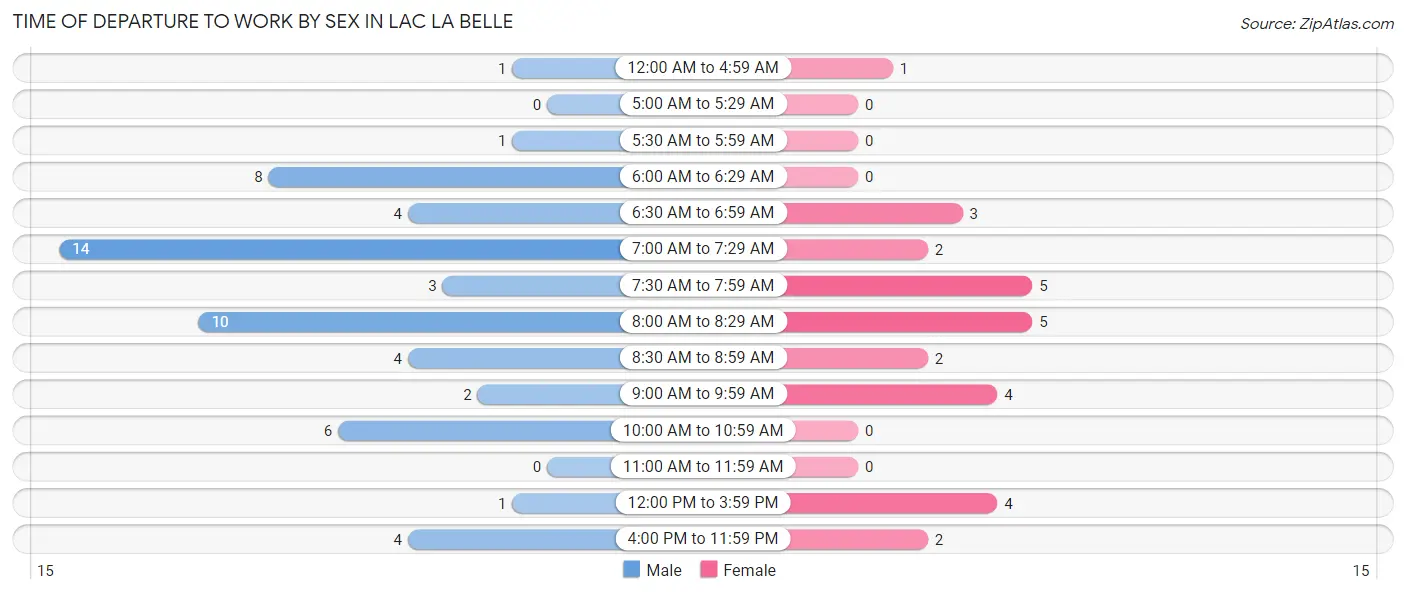
| Time of Departure | Male | Female |
| 12:00 AM to 4:59 AM | 1 (1.7%) | 1 (3.6%) |
| 5:00 AM to 5:29 AM | 0 (0.0%) | 0 (0.0%) |
| 5:30 AM to 5:59 AM | 1 (1.7%) | 0 (0.0%) |
| 6:00 AM to 6:29 AM | 8 (13.8%) | 0 (0.0%) |
| 6:30 AM to 6:59 AM | 4 (6.9%) | 3 (10.7%) |
| 7:00 AM to 7:29 AM | 14 (24.1%) | 2 (7.1%) |
| 7:30 AM to 7:59 AM | 3 (5.2%) | 5 (17.9%) |
| 8:00 AM to 8:29 AM | 10 (17.2%) | 5 (17.9%) |
| 8:30 AM to 8:59 AM | 4 (6.9%) | 2 (7.1%) |
| 9:00 AM to 9:59 AM | 2 (3.5%) | 4 (14.3%) |
| 10:00 AM to 10:59 AM | 6 (10.3%) | 0 (0.0%) |
| 11:00 AM to 11:59 AM | 0 (0.0%) | 0 (0.0%) |
| 12:00 PM to 3:59 PM | 1 (1.7%) | 4 (14.3%) |
| 4:00 PM to 11:59 PM | 4 (6.9%) | 2 (7.1%) |
| Total | 58 (100.0%) | 28 (100.0%) |
Housing Occupancy in Lac La Belle
Occupancy by Ownership in Lac La Belle
Of the total 99 dwellings in Lac La Belle, owner-occupied units account for 89 (89.9%), while renter-occupied units make up 10 (10.1%).
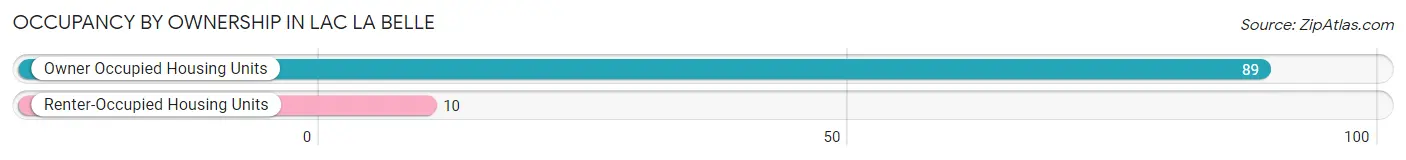
| Occupancy | # Housing Units | % Housing Units |
| Owner Occupied Housing Units | 89 | 89.9% |
| Renter-Occupied Housing Units | 10 | 10.1% |
| Total Occupied Housing Units | 99 | 100.0% |
Occupancy by Household Size in Lac La Belle
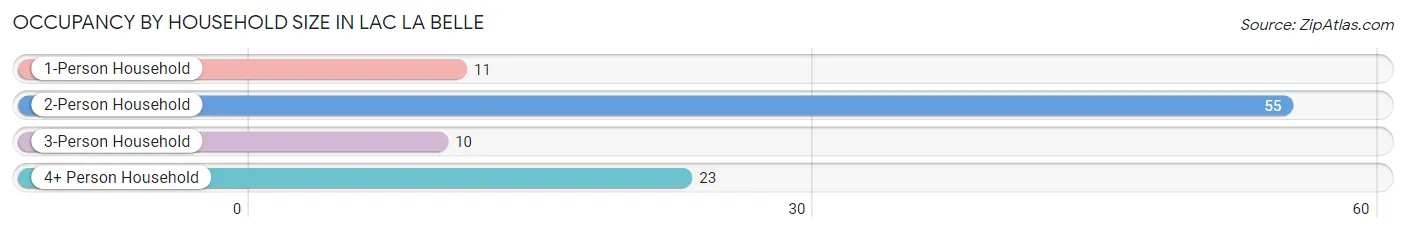
| Household Size | # Housing Units | % Housing Units |
| 1-Person Household | 11 | 11.1% |
| 2-Person Household | 55 | 55.6% |
| 3-Person Household | 10 | 10.1% |
| 4+ Person Household | 23 | 23.2% |
| Total Housing Units | 99 | 100.0% |
Occupancy by Ownership by Household Size in Lac La Belle
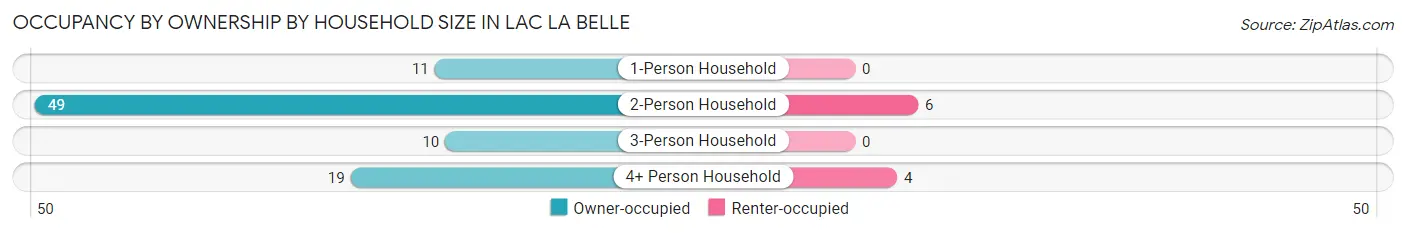
| Household Size | Owner-occupied | Renter-occupied |
| 1-Person Household | 11 (100.0%) | 0 (0.0%) |
| 2-Person Household | 49 (89.1%) | 6 (10.9%) |
| 3-Person Household | 10 (100.0%) | 0 (0.0%) |
| 4+ Person Household | 19 (82.6%) | 4 (17.4%) |
| Total Housing Units | 89 (89.9%) | 10 (10.1%) |
Occupancy by Educational Attainment in Lac La Belle
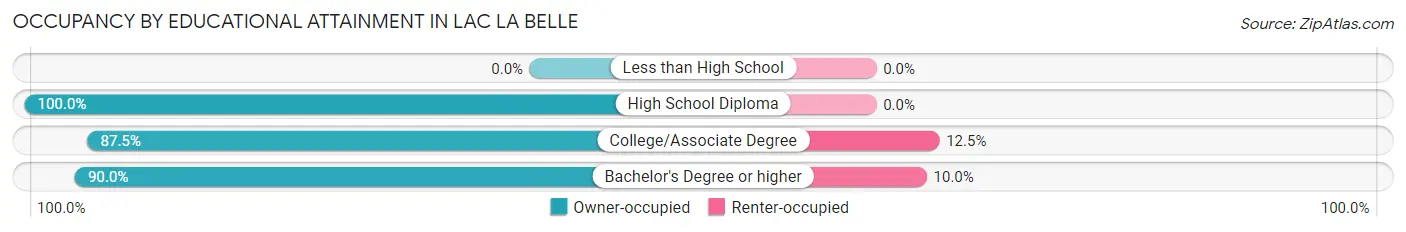
| Household Size | Owner-occupied | Renter-occupied |
| Less than High School | 0 (0.0%) | 0 (0.0%) |
| High School Diploma | 5 (100.0%) | 0 (0.0%) |
| College/Associate Degree | 21 (87.5%) | 3 (12.5%) |
| Bachelor's Degree or higher | 63 (90.0%) | 7 (10.0%) |
Occupancy by Age of Householder in Lac La Belle
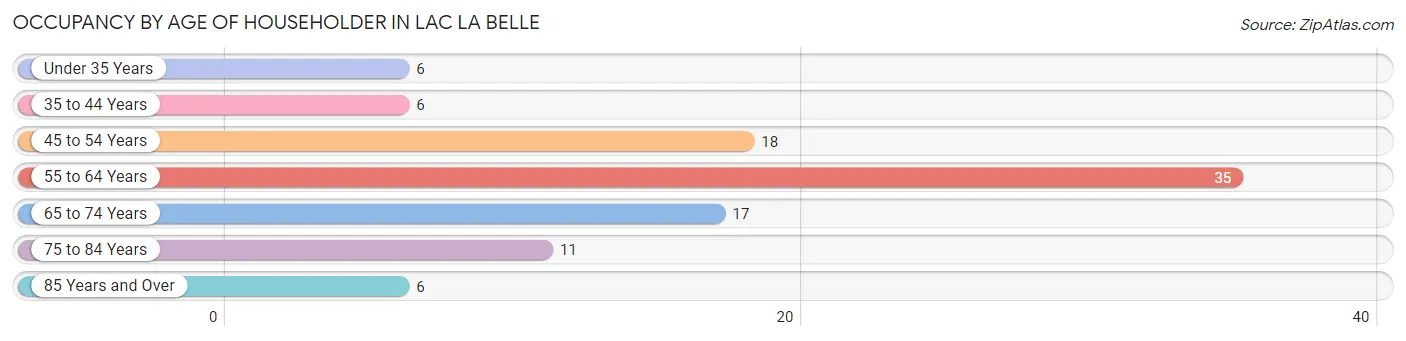
| Age Bracket | # Households | % Households |
| Under 35 Years | 6 | 6.1% |
| 35 to 44 Years | 6 | 6.1% |
| 45 to 54 Years | 18 | 18.2% |
| 55 to 64 Years | 35 | 35.3% |
| 65 to 74 Years | 17 | 17.2% |
| 75 to 84 Years | 11 | 11.1% |
| 85 Years and Over | 6 | 6.1% |
| Total | 99 | 100.0% |
Housing Finances in Lac La Belle
Median Income by Occupancy in Lac La Belle
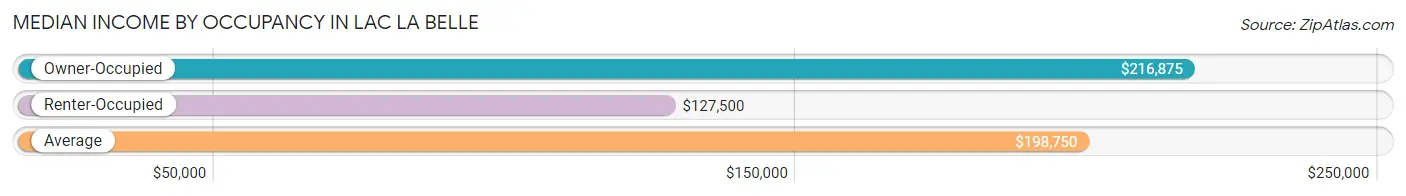
| Occupancy Type | # Households | Median Income |
| Owner-Occupied | 89 (89.9%) | $216,875 |
| Renter-Occupied | 10 (10.1%) | $127,500 |
| Average | 99 (100.0%) | $198,750 |
Occupancy by Householder Income Bracket in Lac La Belle
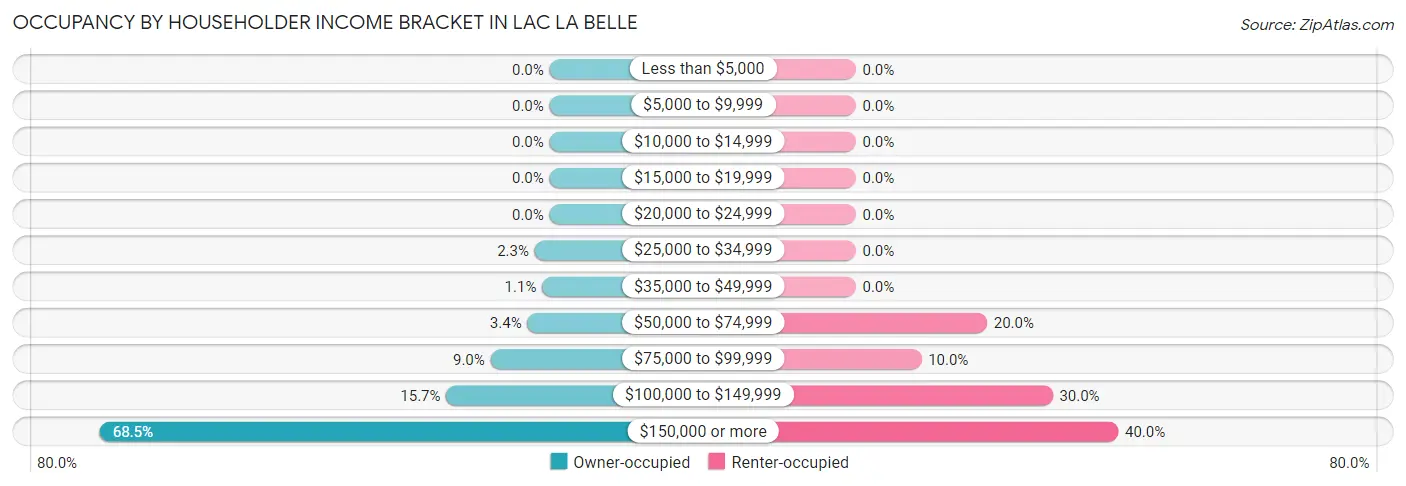
| Income Bracket | Owner-occupied | Renter-occupied |
| Less than $5,000 | 0 (0.0%) | 0 (0.0%) |
| $5,000 to $9,999 | 0 (0.0%) | 0 (0.0%) |
| $10,000 to $14,999 | 0 (0.0%) | 0 (0.0%) |
| $15,000 to $19,999 | 0 (0.0%) | 0 (0.0%) |
| $20,000 to $24,999 | 0 (0.0%) | 0 (0.0%) |
| $25,000 to $34,999 | 2 (2.2%) | 0 (0.0%) |
| $35,000 to $49,999 | 1 (1.1%) | 0 (0.0%) |
| $50,000 to $74,999 | 3 (3.4%) | 2 (20.0%) |
| $75,000 to $99,999 | 8 (9.0%) | 1 (10.0%) |
| $100,000 to $149,999 | 14 (15.7%) | 3 (30.0%) |
| $150,000 or more | 61 (68.5%) | 4 (40.0%) |
| Total | 89 (100.0%) | 10 (100.0%) |
Monthly Housing Cost Tiers in Lac La Belle
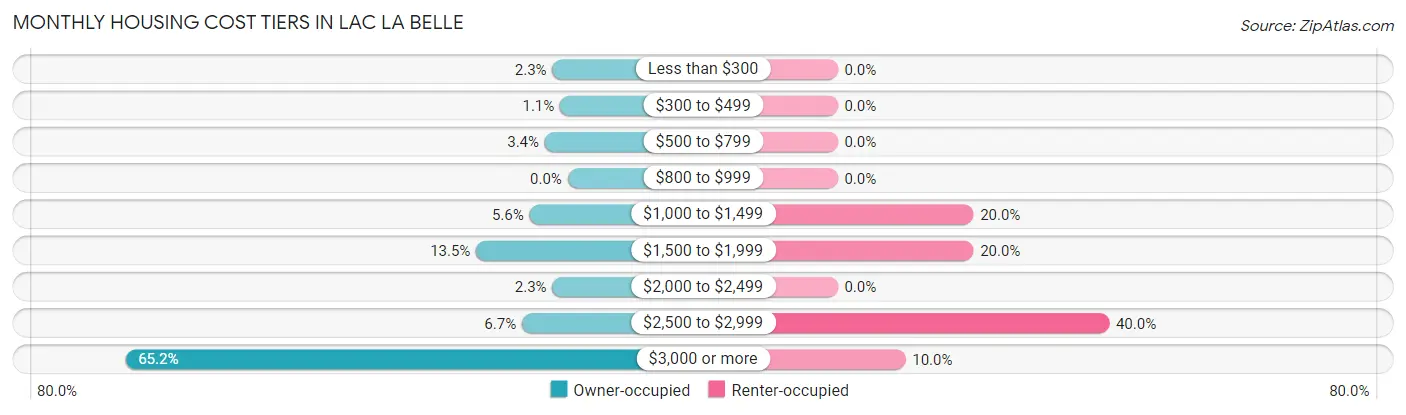
| Monthly Cost | Owner-occupied | Renter-occupied |
| Less than $300 | 2 (2.2%) | 0 (0.0%) |
| $300 to $499 | 1 (1.1%) | 0 (0.0%) |
| $500 to $799 | 3 (3.4%) | 0 (0.0%) |
| $800 to $999 | 0 (0.0%) | 0 (0.0%) |
| $1,000 to $1,499 | 5 (5.6%) | 2 (20.0%) |
| $1,500 to $1,999 | 12 (13.5%) | 2 (20.0%) |
| $2,000 to $2,499 | 2 (2.2%) | 0 (0.0%) |
| $2,500 to $2,999 | 6 (6.7%) | 4 (40.0%) |
| $3,000 or more | 58 (65.2%) | 1 (10.0%) |
| Total | 89 (100.0%) | 10 (100.0%) |
Physical Housing Characteristics in Lac La Belle
Housing Structures in Lac La Belle
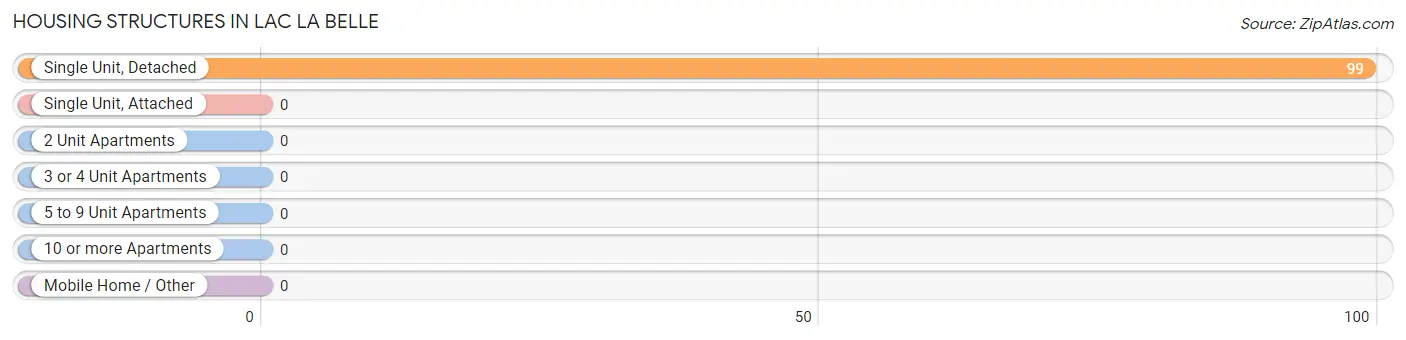
| Structure Type | # Housing Units | % Housing Units |
| Single Unit, Detached | 99 | 100.0% |
| Single Unit, Attached | 0 | 0.0% |
| 2 Unit Apartments | 0 | 0.0% |
| 3 or 4 Unit Apartments | 0 | 0.0% |
| 5 to 9 Unit Apartments | 0 | 0.0% |
| 10 or more Apartments | 0 | 0.0% |
| Mobile Home / Other | 0 | 0.0% |
| Total | 99 | 100.0% |
Housing Structures by Occupancy in Lac La Belle
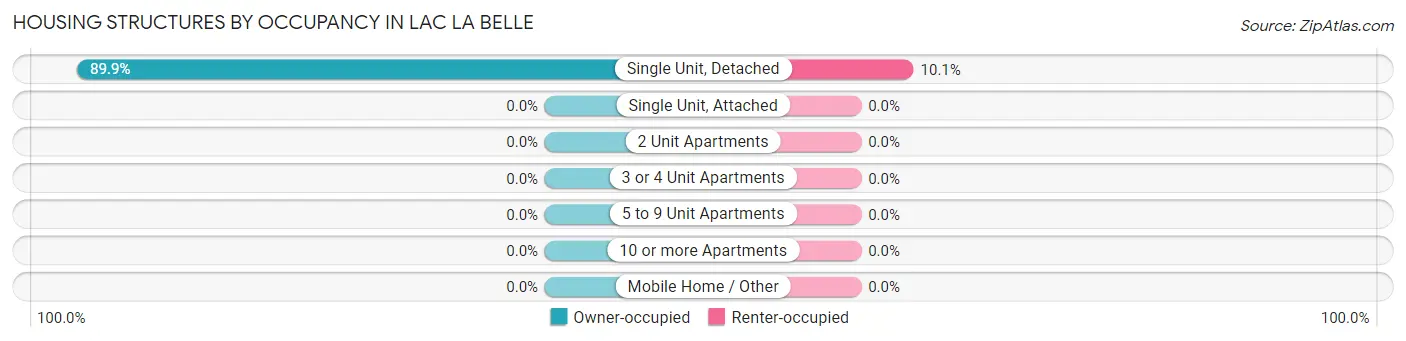
| Structure Type | Owner-occupied | Renter-occupied |
| Single Unit, Detached | 89 (89.9%) | 10 (10.1%) |
| Single Unit, Attached | 0 (0.0%) | 0 (0.0%) |
| 2 Unit Apartments | 0 (0.0%) | 0 (0.0%) |
| 3 or 4 Unit Apartments | 0 (0.0%) | 0 (0.0%) |
| 5 to 9 Unit Apartments | 0 (0.0%) | 0 (0.0%) |
| 10 or more Apartments | 0 (0.0%) | 0 (0.0%) |
| Mobile Home / Other | 0 (0.0%) | 0 (0.0%) |
| Total | 89 (89.9%) | 10 (10.1%) |
Housing Structures by Number of Rooms in Lac La Belle
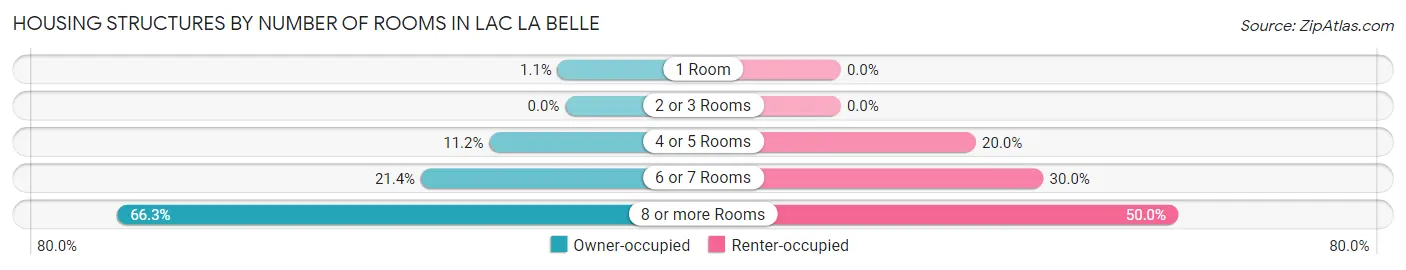
| Number of Rooms | Owner-occupied | Renter-occupied |
| 1 Room | 1 (1.1%) | 0 (0.0%) |
| 2 or 3 Rooms | 0 (0.0%) | 0 (0.0%) |
| 4 or 5 Rooms | 10 (11.2%) | 2 (20.0%) |
| 6 or 7 Rooms | 19 (21.3%) | 3 (30.0%) |
| 8 or more Rooms | 59 (66.3%) | 5 (50.0%) |
| Total | 89 (100.0%) | 10 (100.0%) |
Housing Structure by Heating Type in Lac La Belle
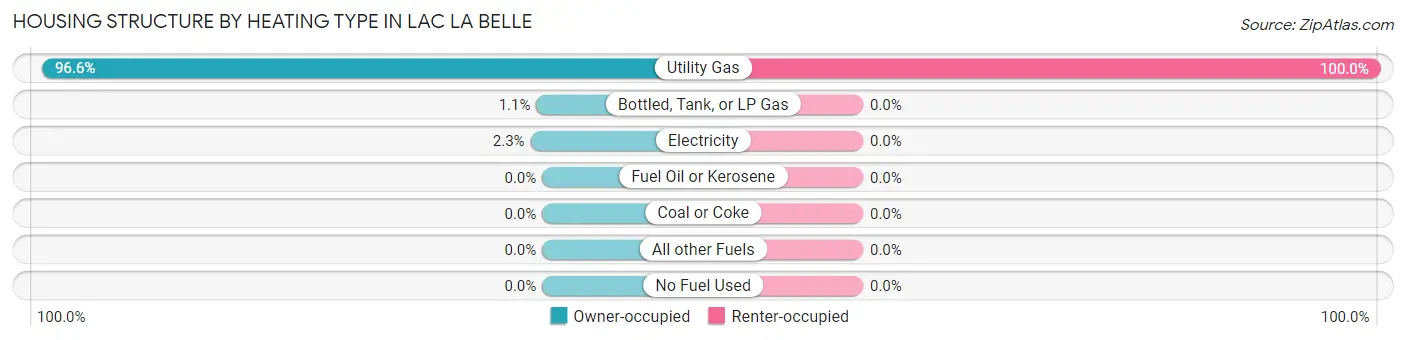
| Heating Type | Owner-occupied | Renter-occupied |
| Utility Gas | 86 (96.6%) | 10 (100.0%) |
| Bottled, Tank, or LP Gas | 1 (1.1%) | 0 (0.0%) |
| Electricity | 2 (2.2%) | 0 (0.0%) |
| Fuel Oil or Kerosene | 0 (0.0%) | 0 (0.0%) |
| Coal or Coke | 0 (0.0%) | 0 (0.0%) |
| All other Fuels | 0 (0.0%) | 0 (0.0%) |
| No Fuel Used | 0 (0.0%) | 0 (0.0%) |
| Total | 89 (100.0%) | 10 (100.0%) |
Household Vehicle Usage in Lac La Belle
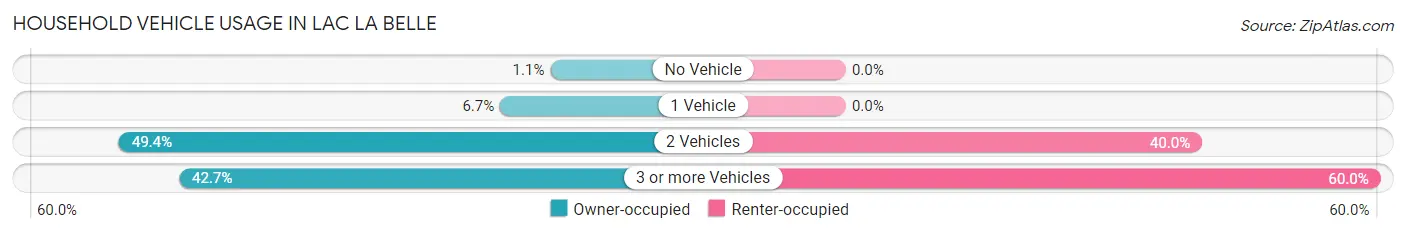
| Vehicles per Household | Owner-occupied | Renter-occupied |
| No Vehicle | 1 (1.1%) | 0 (0.0%) |
| 1 Vehicle | 6 (6.7%) | 0 (0.0%) |
| 2 Vehicles | 44 (49.4%) | 4 (40.0%) |
| 3 or more Vehicles | 38 (42.7%) | 6 (60.0%) |
| Total | 89 (100.0%) | 10 (100.0%) |
Real Estate & Mortgages in Lac La Belle
Real Estate and Mortgage Overview in Lac La Belle
| Characteristic | Without Mortgage | With Mortgage |
| Housing Units | 18 | 71 |
| Median Property Value | $1,100,000 | $1,125,000 |
| Median Household Income | $196,250 | $49 |
| Monthly Housing Costs | $1,501 | $56 |
| Real Estate Taxes | $10,001 | $0 |
Property Value by Mortgage Status in Lac La Belle
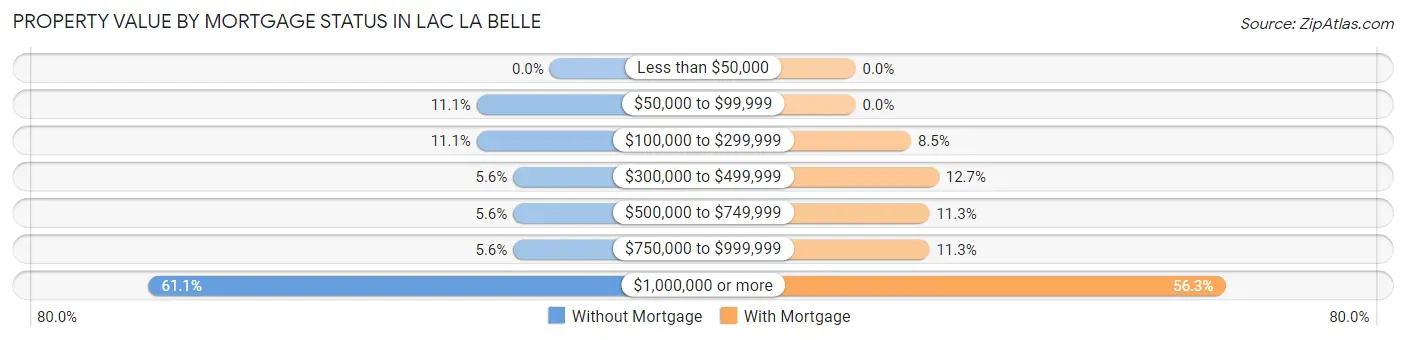
| Property Value | Without Mortgage | With Mortgage |
| Less than $50,000 | 0 (0.0%) | 0 (0.0%) |
| $50,000 to $99,999 | 2 (11.1%) | 0 (0.0%) |
| $100,000 to $299,999 | 2 (11.1%) | 6 (8.5%) |
| $300,000 to $499,999 | 1 (5.6%) | 9 (12.7%) |
| $500,000 to $749,999 | 1 (5.6%) | 8 (11.3%) |
| $750,000 to $999,999 | 1 (5.6%) | 8 (11.3%) |
| $1,000,000 or more | 11 (61.1%) | 40 (56.3%) |
| Total | 18 (100.0%) | 71 (100.0%) |
Household Income by Mortgage Status in Lac La Belle
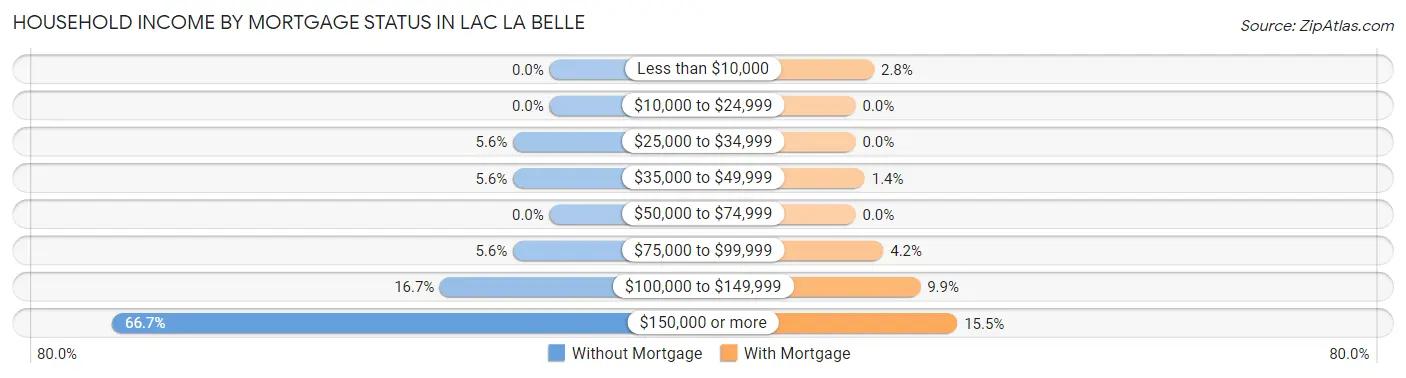
| Household Income | Without Mortgage | With Mortgage |
| Less than $10,000 | 0 (0.0%) | 2 (2.8%) |
| $10,000 to $24,999 | 0 (0.0%) | 0 (0.0%) |
| $25,000 to $34,999 | 1 (5.6%) | 0 (0.0%) |
| $35,000 to $49,999 | 1 (5.6%) | 1 (1.4%) |
| $50,000 to $74,999 | 0 (0.0%) | 0 (0.0%) |
| $75,000 to $99,999 | 1 (5.6%) | 3 (4.2%) |
| $100,000 to $149,999 | 3 (16.7%) | 7 (9.9%) |
| $150,000 or more | 12 (66.7%) | 11 (15.5%) |
| Total | 18 (100.0%) | 71 (100.0%) |
Property Value to Household Income Ratio in Lac La Belle
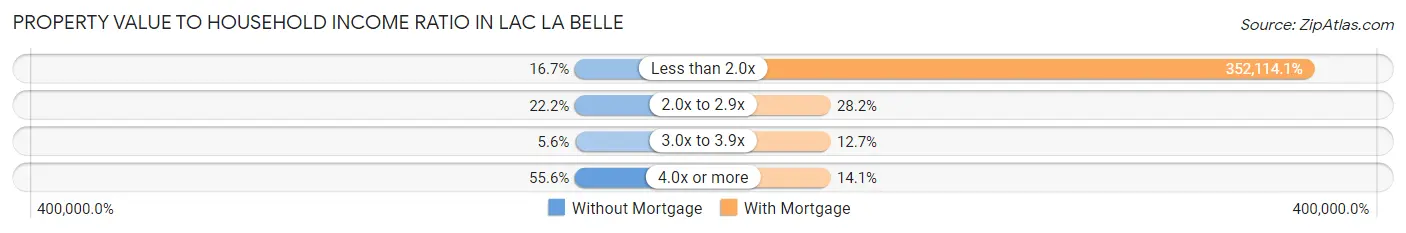
| Value-to-Income Ratio | Without Mortgage | With Mortgage |
| Less than 2.0x | 3 (16.7%) | 250,001 (352,114.1%) |
| 2.0x to 2.9x | 4 (22.2%) | 20 (28.2%) |
| 3.0x to 3.9x | 1 (5.6%) | 9 (12.7%) |
| 4.0x or more | 10 (55.6%) | 10 (14.1%) |
| Total | 18 (100.0%) | 71 (100.0%) |
Real Estate Taxes by Mortgage Status in Lac La Belle
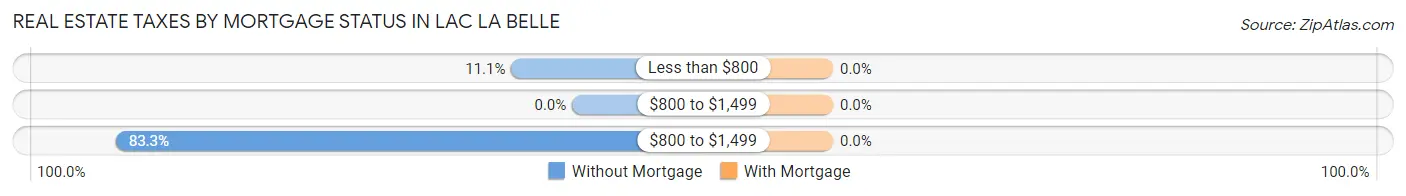
| Property Taxes | Without Mortgage | With Mortgage |
| Less than $800 | 2 (11.1%) | 0 (0.0%) |
| $800 to $1,499 | 0 (0.0%) | 0 (0.0%) |
| $800 to $1,499 | 15 (83.3%) | 0 (0.0%) |
| Total | 18 (100.0%) | 71 (100.0%) |
Health & Disability in Lac La Belle
Health Insurance Coverage by Age in Lac La Belle
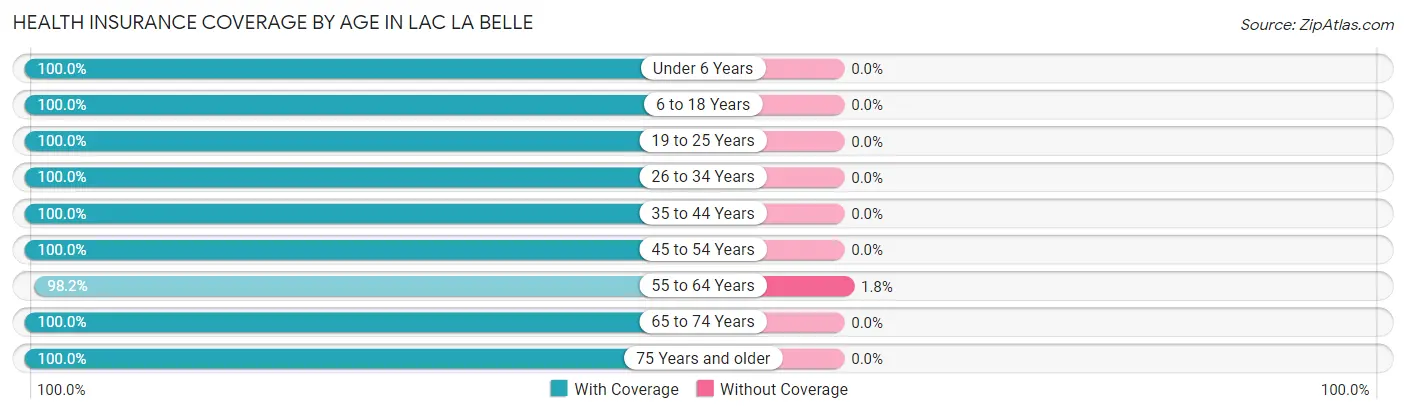
| Age Bracket | With Coverage | Without Coverage |
| Under 6 Years | 7 (100.0%) | 0 (0.0%) |
| 6 to 18 Years | 45 (100.0%) | 0 (0.0%) |
| 19 to 25 Years | 18 (100.0%) | 0 (0.0%) |
| 26 to 34 Years | 12 (100.0%) | 0 (0.0%) |
| 35 to 44 Years | 12 (100.0%) | 0 (0.0%) |
| 45 to 54 Years | 41 (100.0%) | 0 (0.0%) |
| 55 to 64 Years | 54 (98.2%) | 1 (1.8%) |
| 65 to 74 Years | 35 (100.0%) | 0 (0.0%) |
| 75 Years and older | 27 (100.0%) | 0 (0.0%) |
| Total | 251 (99.6%) | 1 (0.4%) |
Health Insurance Coverage by Citizenship Status in Lac La Belle
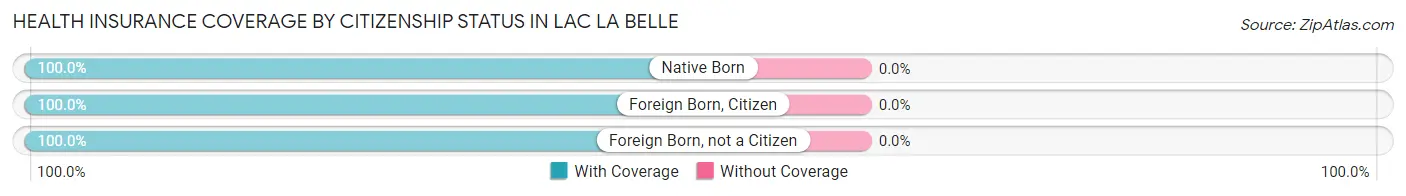
| Citizenship Status | With Coverage | Without Coverage |
| Native Born | 7 (100.0%) | 0 (0.0%) |
| Foreign Born, Citizen | 45 (100.0%) | 0 (0.0%) |
| Foreign Born, not a Citizen | 18 (100.0%) | 0 (0.0%) |
Health Insurance Coverage by Household Income in Lac La Belle
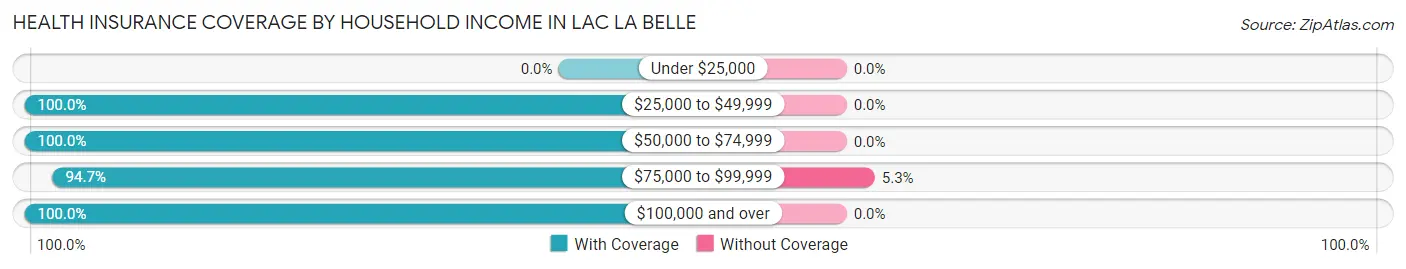
| Household Income | With Coverage | Without Coverage |
| Under $25,000 | 0 (0.0%) | 0 (0.0%) |
| $25,000 to $49,999 | 3 (100.0%) | 0 (0.0%) |
| $50,000 to $74,999 | 15 (100.0%) | 0 (0.0%) |
| $75,000 to $99,999 | 18 (94.7%) | 1 (5.3%) |
| $100,000 and over | 215 (100.0%) | 0 (0.0%) |
Public vs Private Health Insurance Coverage by Age in Lac La Belle
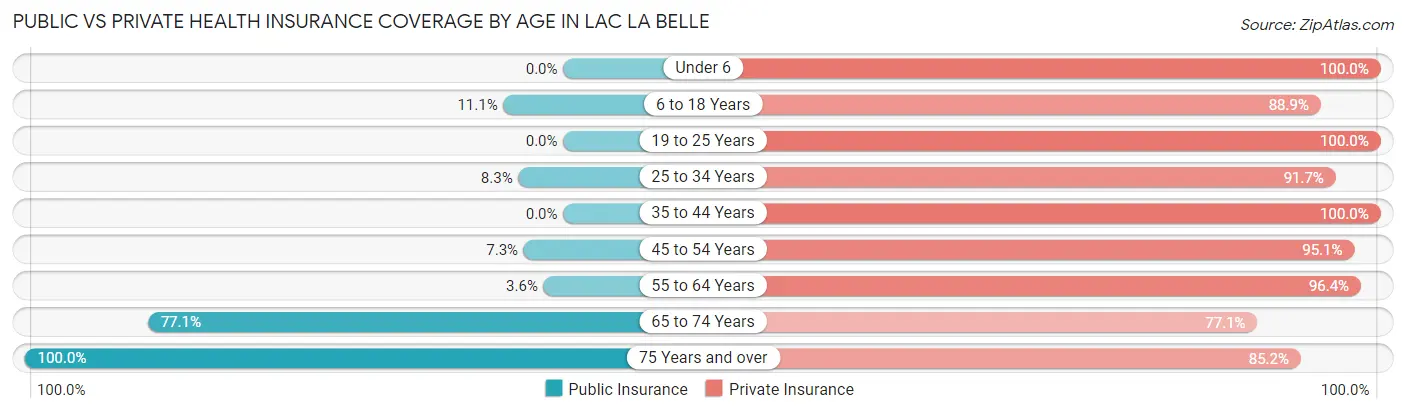
| Age Bracket | Public Insurance | Private Insurance |
| Under 6 | 0 (0.0%) | 7 (100.0%) |
| 6 to 18 Years | 5 (11.1%) | 40 (88.9%) |
| 19 to 25 Years | 0 (0.0%) | 18 (100.0%) |
| 25 to 34 Years | 1 (8.3%) | 11 (91.7%) |
| 35 to 44 Years | 0 (0.0%) | 12 (100.0%) |
| 45 to 54 Years | 3 (7.3%) | 39 (95.1%) |
| 55 to 64 Years | 2 (3.6%) | 53 (96.4%) |
| 65 to 74 Years | 27 (77.1%) | 27 (77.1%) |
| 75 Years and over | 27 (100.0%) | 23 (85.2%) |
| Total | 65 (25.8%) | 230 (91.3%) |
Disability Status by Sex by Age in Lac La Belle
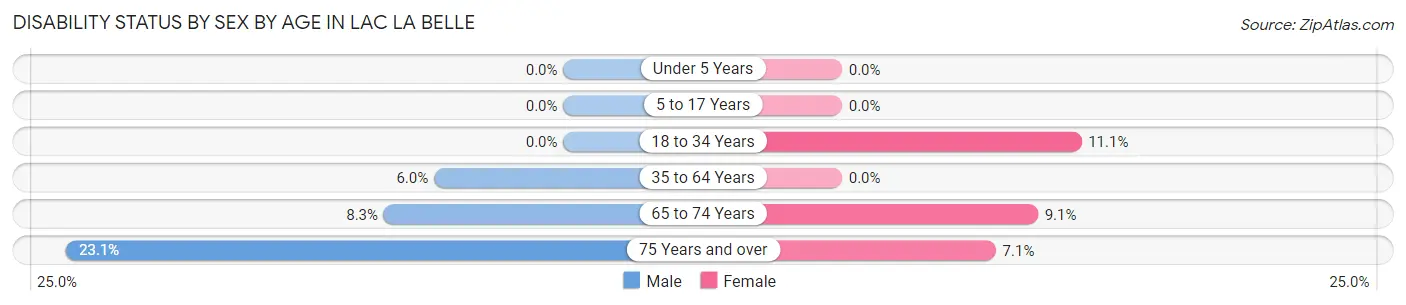
| Age Bracket | Male | Female |
| Under 5 Years | 0 (0.0%) | 0 (0.0%) |
| 5 to 17 Years | 0 (0.0%) | 0 (0.0%) |
| 18 to 34 Years | 0 (0.0%) | 1 (11.1%) |
| 35 to 64 Years | 3 (6.0%) | 0 (0.0%) |
| 65 to 74 Years | 2 (8.3%) | 1 (9.1%) |
| 75 Years and over | 3 (23.1%) | 1 (7.1%) |
Disability Class by Sex by Age in Lac La Belle
Disability Class: Hearing Difficulty
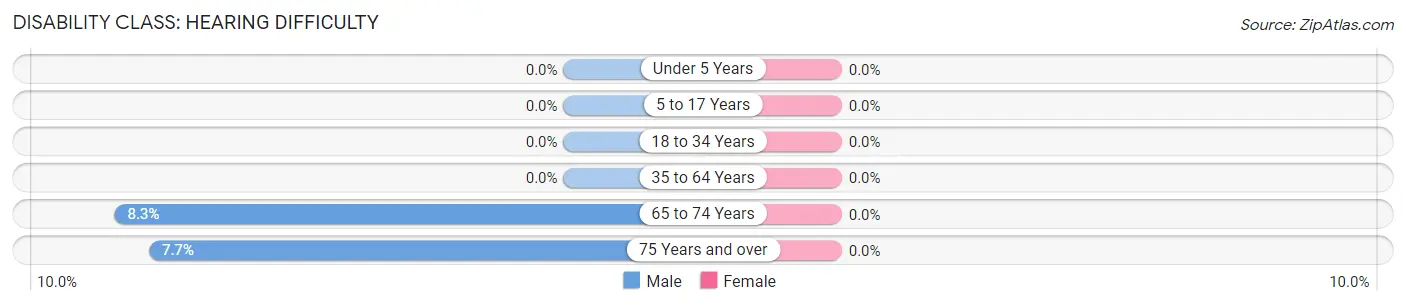
| Age Bracket | Male | Female |
| Under 5 Years | 0 (0.0%) | 0 (0.0%) |
| 5 to 17 Years | 0 (0.0%) | 0 (0.0%) |
| 18 to 34 Years | 0 (0.0%) | 0 (0.0%) |
| 35 to 64 Years | 0 (0.0%) | 0 (0.0%) |
| 65 to 74 Years | 2 (8.3%) | 0 (0.0%) |
| 75 Years and over | 1 (7.7%) | 0 (0.0%) |
Disability Class: Vision Difficulty
| Age Bracket | Male | Female |
| Under 5 Years | 0 (0.0%) | 0 (0.0%) |
| 5 to 17 Years | 0 (0.0%) | 0 (0.0%) |
| 18 to 34 Years | 0 (0.0%) | 0 (0.0%) |
| 35 to 64 Years | 0 (0.0%) | 0 (0.0%) |
| 65 to 74 Years | 0 (0.0%) | 0 (0.0%) |
| 75 Years and over | 0 (0.0%) | 0 (0.0%) |
Disability Class: Cognitive Difficulty
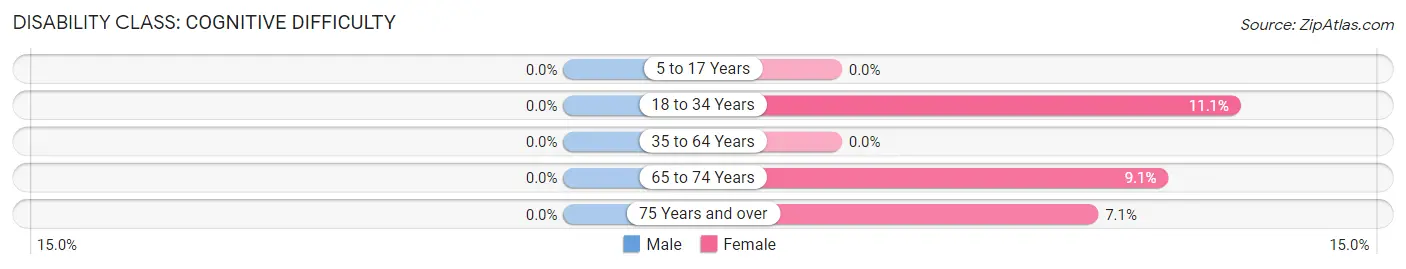
| Age Bracket | Male | Female |
| 5 to 17 Years | 0 (0.0%) | 0 (0.0%) |
| 18 to 34 Years | 0 (0.0%) | 1 (11.1%) |
| 35 to 64 Years | 0 (0.0%) | 0 (0.0%) |
| 65 to 74 Years | 0 (0.0%) | 1 (9.1%) |
| 75 Years and over | 0 (0.0%) | 1 (7.1%) |
Disability Class: Ambulatory Difficulty
| Age Bracket | Male | Female |
| 5 to 17 Years | 0 (0.0%) | 0 (0.0%) |
| 18 to 34 Years | 0 (0.0%) | 0 (0.0%) |
| 35 to 64 Years | 3 (6.0%) | 0 (0.0%) |
| 65 to 74 Years | 0 (0.0%) | 1 (9.1%) |
| 75 Years and over | 2 (15.4%) | 1 (7.1%) |
Disability Class: Self-Care Difficulty
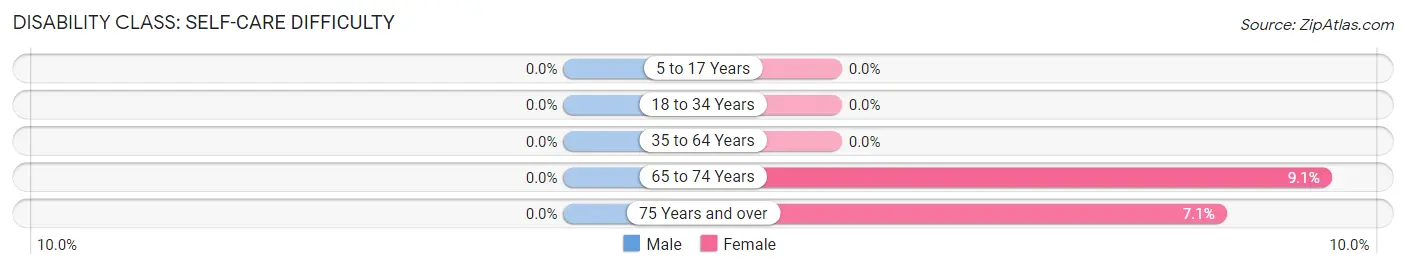
| Age Bracket | Male | Female |
| 5 to 17 Years | 0 (0.0%) | 0 (0.0%) |
| 18 to 34 Years | 0 (0.0%) | 0 (0.0%) |
| 35 to 64 Years | 0 (0.0%) | 0 (0.0%) |
| 65 to 74 Years | 0 (0.0%) | 1 (9.1%) |
| 75 Years and over | 0 (0.0%) | 1 (7.1%) |
Technology Access in Lac La Belle
Computing Device Access in Lac La Belle
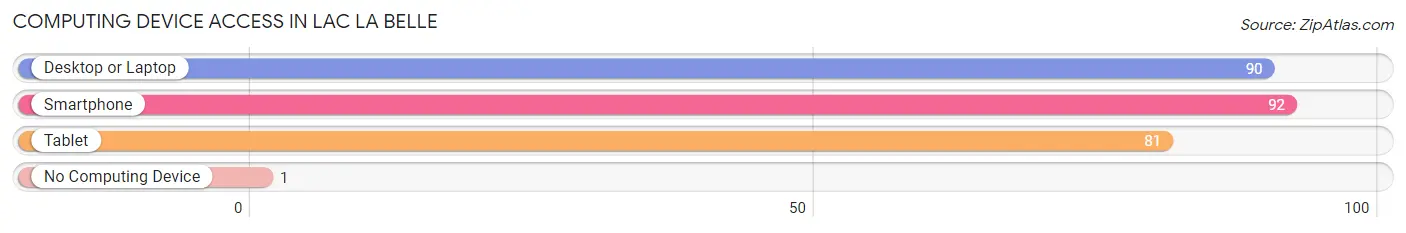
| Device Type | # Households | % Households |
| Desktop or Laptop | 90 | 90.9% |
| Smartphone | 92 | 92.9% |
| Tablet | 81 | 81.8% |
| No Computing Device | 1 | 1.0% |
| Total | 99 | 100.0% |
Internet Access in Lac La Belle
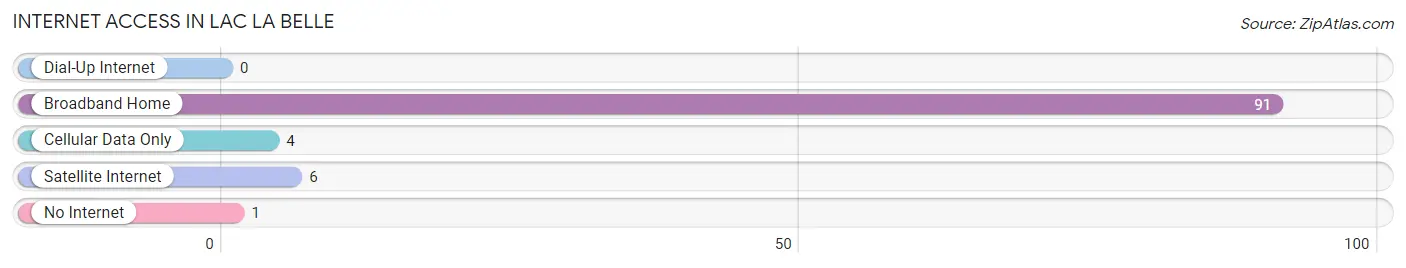
| Internet Type | # Households | % Households |
| Dial-Up Internet | 0 | 0.0% |
| Broadband Home | 91 | 91.9% |
| Cellular Data Only | 4 | 4.0% |
| Satellite Internet | 6 | 6.1% |
| No Internet | 1 | 1.0% |
| Total | 99 | 100.0% |
Lac La Belle Summary
Lac La Belle is a small village located in the Keweenaw Peninsula of Michigan’s Upper Peninsula. It is situated on the shore of Lake Superior, and is surrounded by the Huron Mountains. The village is home to a population of approximately 500 people, and is known for its picturesque views and outdoor activities.
History
The area that is now Lac La Belle was first inhabited by the Ojibwe people, who called the area “Kitchi-gami”, meaning “great water”. The first European settlers arrived in the area in the late 1800s, and the village was officially established in 1887. The village was named after the nearby lake, which was named by French explorers in the 17th century.
The village was originally a logging and fishing community, and the local economy was largely based on these industries. In the early 1900s, the village began to attract tourists, and the local economy shifted to focus on tourism. The village was also home to a number of resorts, which attracted visitors from all over the country.
Geography
Lac La Belle is located in the Keweenaw Peninsula of Michigan’s Upper Peninsula. The village is situated on the shore of Lake Superior, and is surrounded by the Huron Mountains. The village is located approximately 25 miles north of the city of Houghton, and is accessible by car via US-41.
The village is home to a number of lakes, including Lac La Belle, which is the largest lake in the area. The lake is known for its clear waters and is popular for fishing, swimming, and boating. The village is also home to a number of parks, including the Lac La Belle County Park, which offers camping, hiking, and other outdoor activities.
Economy
The local economy of Lac La Belle is largely based on tourism. The village is home to a number of resorts, which attract visitors from all over the country. The village is also home to a number of restaurants, shops, and other businesses, which cater to the needs of tourists.
The village is also home to a number of manufacturing companies, which produce a variety of products, including furniture, clothing, and electronics. The village is also home to a number of small businesses, which provide services to the local community.
Demographics
As of the 2010 census, the population of Lac La Belle was 498 people. The village is predominantly white, with 94.2% of the population identifying as white. The median household income in the village is $41,250, and the median age is 44.7 years.
Conclusion
Lac La Belle is a small village located in the Keweenaw Peninsula of Michigan’s Upper Peninsula. The village is situated on the shore of Lake Superior, and is surrounded by the Huron Mountains. The village is home to a population of approximately 500 people, and is known for its picturesque views and outdoor activities. The local economy of Lac La Belle is largely based on tourism, and the village is home to a number of resorts, restaurants, shops, and other businesses. The village is predominantly white, with 94.2% of the population identifying as white. The median household income in the village is $41,250, and the median age is 44.7 years.
Common Questions
What is Per Capita Income in Lac La Belle?
Per Capita income in Lac La Belle is $131,397.
What is the Median Family Income in Lac La Belle?
Median Family Income in Lac La Belle is $199,583.
What is the Median Household income in Lac La Belle?
Median Household Income in Lac La Belle is $198,750.
What is Inequality or Gini Index in Lac La Belle?
Inequality or Gini Index in Lac La Belle is 0.46.
What is the Total Population of Lac La Belle?
Total Population of Lac La Belle is 252.
What is the Total Male Population of Lac La Belle?
Total Male Population of Lac La Belle is 136.
What is the Total Female Population of Lac La Belle?
Total Female Population of Lac La Belle is 116.
What is the Ratio of Males per 100 Females in Lac La Belle?
There are 117.24 Males per 100 Females in Lac La Belle.
What is the Ratio of Females per 100 Males in Lac La Belle?
There are 85.29 Females per 100 Males in Lac La Belle.
What is the Median Population Age in Lac La Belle?
Median Population Age in Lac La Belle is 53.8 Years.
What is the Average Family Size in Lac La Belle
Average Family Size in Lac La Belle is 2.8 People.
What is the Average Household Size in Lac La Belle
Average Household Size in Lac La Belle is 2.5 People.
How Large is the Labor Force in Lac La Belle?
There are 137 People in the Labor Forcein in Lac La Belle.
What is the Percentage of People in the Labor Force in Lac La Belle?
62.6% of People are in the Labor Force in Lac La Belle.
What is the Unemployment Rate in Lac La Belle?
Unemployment Rate in Lac La Belle is 2.2%.