Zip Codes with the Highest Percentage of Population with a Degree in Science and Engineering in Nevada
RELATED REPORTS & OPTIONS
Science and Engineering
Nevada
Compare Zip Codes
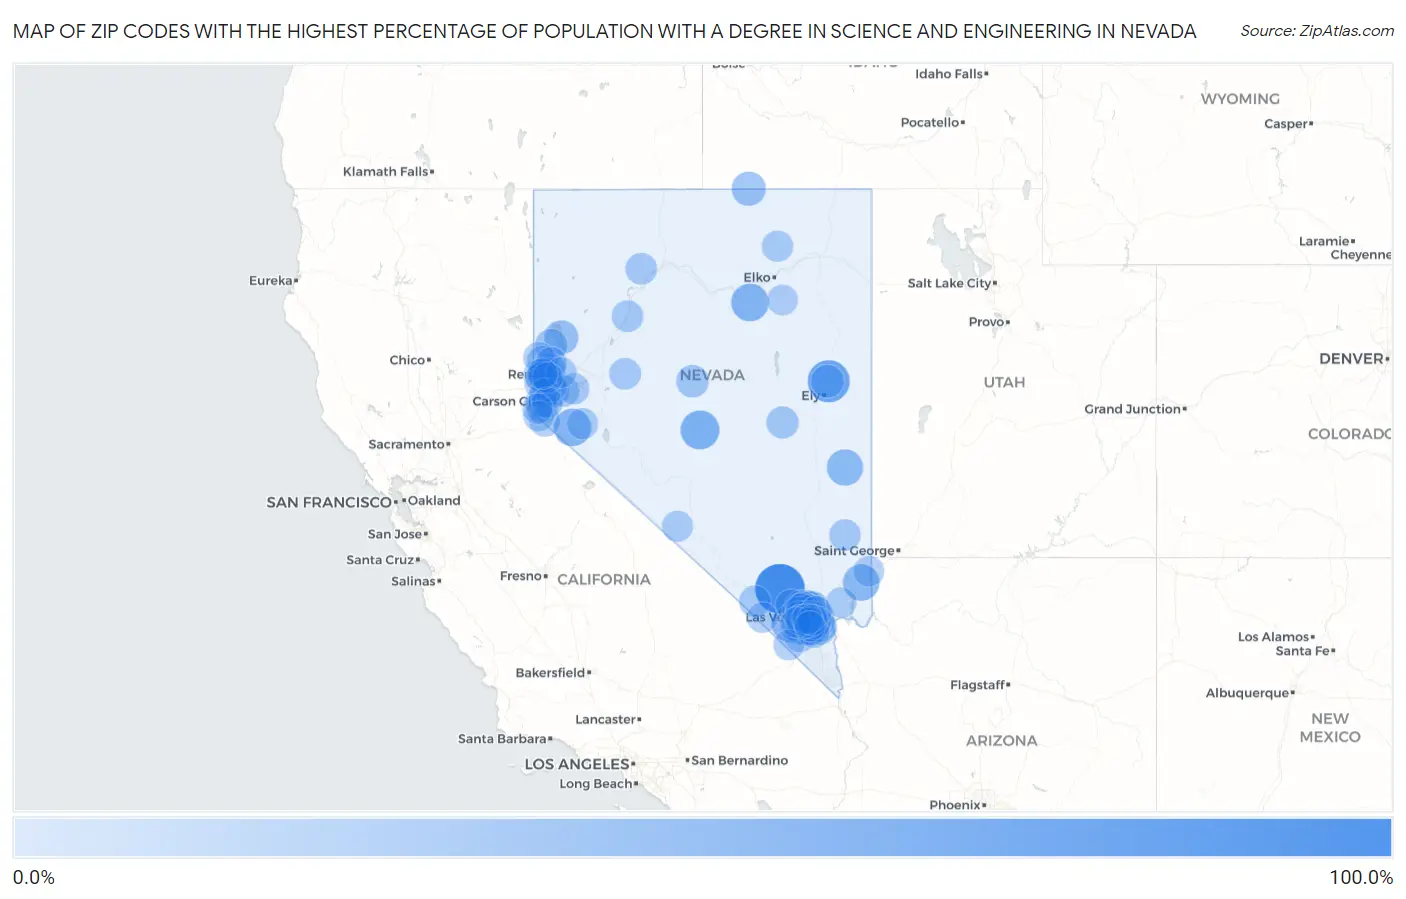
Map of Zip Codes with the Highest Percentage of Population with a Degree in Science and Engineering in Nevada
0.0%
100.0%
Zip Codes with the Highest Percentage of Population with a Degree in Science and Engineering in Nevada
| Zip Code | % Graduates | vs State | vs National | |
| 1. | 89018 | 100.0% | 10.1%(+89.9)#1 | 9.8%(+90.2)#3 |
| 2. | 89318 | 63.2% | 10.1%(+53.1)#2 | 9.8%(+53.4)#230 |
| 3. | 89045 | 47.2% | 10.1%(+37.1)#3 | 9.8%(+37.4)#463 |
| 4. | 89822 | 41.6% | 10.1%(+31.5)#4 | 9.8%(+31.8)#617 |
| 5. | 89430 | 40.7% | 10.1%(+30.7)#5 | 9.8%(+31.0)#641 |
| 6. | 89161 | 38.8% | 10.1%(+28.7)#6 | 9.8%(+29.0)#720 |
| 7. | 89007 | 36.2% | 10.1%(+26.1)#7 | 9.8%(+26.4)#863 |
| 8. | 89043 | 35.2% | 10.1%(+25.1)#8 | 9.8%(+25.4)#921 |
| 9. | 89086 | 34.0% | 10.1%(+23.9)#9 | 9.8%(+24.2)#996 |
| 10. | 89832 | 25.0% | 10.1%(+14.9)#10 | 9.8%(+15.2)#1,940 |
| 11. | 89424 | 25.0% | 10.1%(+14.9)#11 | 9.8%(+15.2)#1,971 |
| 12. | 89440 | 19.5% | 10.1%(+9.46)#12 | 9.8%(+9.77)#3,542 |
| 13. | 89301 | 19.3% | 10.1%(+9.23)#13 | 9.8%(+9.54)#3,642 |
| 14. | 89085 | 17.4% | 10.1%(+7.32)#14 | 9.8%(+7.63)#4,680 |
| 15. | 89310 | 17.4% | 10.1%(+7.30)#15 | 9.8%(+7.61)#4,693 |
| 16. | 89510 | 16.3% | 10.1%(+6.20)#16 | 9.8%(+6.51)#5,506 |
| 17. | 89314 | 15.8% | 10.1%(+5.70)#17 | 9.8%(+6.01)#5,908 |
| 18. | 89183 | 15.1% | 10.1%(+5.02)#18 | 9.8%(+5.33)#6,597 |
| 19. | 89178 | 15.1% | 10.1%(+4.99)#19 | 9.8%(+5.30)#6,626 |
| 20. | 89143 | 14.7% | 10.1%(+4.63)#20 | 9.8%(+4.94)#6,987 |
| 21. | 89002 | 14.7% | 10.1%(+4.62)#21 | 9.8%(+4.92)#6,995 |
| 22. | 89084 | 14.6% | 10.1%(+4.52)#22 | 9.8%(+4.82)#7,116 |
| 23. | 89139 | 14.5% | 10.1%(+4.37)#23 | 9.8%(+4.68)#7,288 |
| 24. | 89141 | 13.6% | 10.1%(+3.48)#24 | 9.8%(+3.79)#8,416 |
| 25. | 89445 | 13.1% | 10.1%(+3.06)#25 | 9.8%(+3.36)#9,014 |
| 26. | 89419 | 13.0% | 10.1%(+2.93)#26 | 9.8%(+3.23)#9,226 |
| 27. | 89179 | 13.0% | 10.1%(+2.90)#27 | 9.8%(+3.21)#9,262 |
| 28. | 89060 | 12.9% | 10.1%(+2.84)#28 | 9.8%(+3.15)#9,333 |
| 29. | 89406 | 12.7% | 10.1%(+2.62)#29 | 9.8%(+2.93)#9,681 |
| 30. | 89129 | 12.7% | 10.1%(+2.59)#30 | 9.8%(+2.89)#9,744 |
| 31. | 89148 | 12.7% | 10.1%(+2.57)#31 | 9.8%(+2.87)#9,776 |
| 32. | 89008 | 12.4% | 10.1%(+2.32)#32 | 9.8%(+2.63)#10,180 |
| 33. | 89431 | 12.4% | 10.1%(+2.32)#33 | 9.8%(+2.62)#10,195 |
| 34. | 89146 | 12.2% | 10.1%(+2.09)#34 | 9.8%(+2.39)#10,582 |
| 35. | 89110 | 12.2% | 10.1%(+2.08)#35 | 9.8%(+2.39)#10,594 |
| 36. | 89509 | 12.1% | 10.1%(+2.04)#36 | 9.8%(+2.35)#10,671 |
| 37. | 89156 | 12.0% | 10.1%(+1.96)#37 | 9.8%(+2.26)#10,818 |
| 38. | 89004 | 11.8% | 10.1%(+1.72)#38 | 9.8%(+2.02)#11,260 |
| 39. | 89705 | 11.8% | 10.1%(+1.69)#39 | 9.8%(+1.99)#11,318 |
| 40. | 89108 | 11.7% | 10.1%(+1.58)#40 | 9.8%(+1.89)#11,522 |
| 41. | 89166 | 11.5% | 10.1%(+1.36)#41 | 9.8%(+1.67)#11,919 |
| 42. | 89117 | 11.3% | 10.1%(+1.16)#42 | 9.8%(+1.47)#12,334 |
| 43. | 89403 | 11.2% | 10.1%(+1.10)#43 | 9.8%(+1.41)#12,456 |
| 44. | 89436 | 11.1% | 10.1%(+1.03)#44 | 9.8%(+1.34)#12,582 |
| 45. | 89429 | 11.1% | 10.1%(+1.02)#45 | 9.8%(+1.33)#12,591 |
| 46. | 89801 | 11.0% | 10.1%(+0.950)#46 | 9.8%(+1.26)#12,785 |
| 47. | 89032 | 11.0% | 10.1%(+0.896)#47 | 9.8%(+1.20)#12,901 |
| 48. | 89142 | 10.9% | 10.1%(+0.795)#48 | 9.8%(+1.10)#13,122 |
| 49. | 89506 | 10.8% | 10.1%(+0.749)#49 | 9.8%(+1.06)#13,222 |
| 50. | 89130 | 10.8% | 10.1%(+0.666)#50 | 9.8%(+0.974)#13,417 |
| 51. | 89015 | 10.6% | 10.1%(+0.531)#51 | 9.8%(+0.839)#13,699 |
| 52. | 89081 | 10.5% | 10.1%(+0.455)#52 | 9.8%(+0.762)#13,857 |
| 53. | 89512 | 10.5% | 10.1%(+0.442)#53 | 9.8%(+0.750)#13,875 |
| 54. | 89447 | 10.5% | 10.1%(+0.402)#54 | 9.8%(+0.710)#13,985 |
| 55. | 89031 | 10.4% | 10.1%(+0.348)#55 | 9.8%(+0.656)#14,098 |
| 56. | 89011 | 10.4% | 10.1%(+0.262)#56 | 9.8%(+0.570)#14,272 |
| 57. | 89703 | 10.4% | 10.1%(+0.262)#57 | 9.8%(+0.570)#14,274 |
| 58. | 89012 | 10.3% | 10.1%(+0.248)#58 | 9.8%(+0.556)#14,318 |
| 59. | 89521 | 10.3% | 10.1%(+0.179)#59 | 9.8%(+0.486)#14,453 |
| 60. | 89013 | 10.3% | 10.1%(+0.167)#60 | 9.8%(+0.475)#14,488 |
| 61. | 89523 | 10.2% | 10.1%(+0.138)#61 | 9.8%(+0.446)#14,536 |
| 62. | 89074 | 10.2% | 10.1%(+0.072)#62 | 9.8%(+0.379)#14,684 |
| 63. | 89508 | 10.1% | 10.1%(-0.033)#63 | 9.8%(+0.275)#14,900 |
| 64. | 89120 | 10.0% | 10.1%(-0.101)#64 | 9.8%(+0.207)#15,057 |
| 65. | 89122 | 10.0% | 10.1%(-0.105)#65 | 9.8%(+0.203)#15,066 |
| 66. | 89441 | 9.8% | 10.1%(-0.273)#66 | 9.8%(+0.035)#15,442 |
| 67. | 89052 | 9.6% | 10.1%(-0.454)#67 | 9.8%(-0.146)#15,848 |
| 68. | 89511 | 9.5% | 10.1%(-0.551)#68 | 9.8%(-0.244)#16,062 |
| 69. | 89138 | 9.5% | 10.1%(-0.563)#69 | 9.8%(-0.255)#16,081 |
| 70. | 89131 | 9.4% | 10.1%(-0.654)#70 | 9.8%(-0.346)#16,309 |
| 71. | 89014 | 9.4% | 10.1%(-0.672)#71 | 9.8%(-0.364)#16,358 |
| 72. | 89044 | 9.4% | 10.1%(-0.698)#72 | 9.8%(-0.390)#16,415 |
| 73. | 89460 | 9.3% | 10.1%(-0.786)#73 | 9.8%(-0.478)#16,614 |
| 74. | 89118 | 9.1% | 10.1%(-1.01)#74 | 9.8%(-0.698)#17,147 |
| 75. | 89113 | 9.1% | 10.1%(-1.03)#75 | 9.8%(-0.724)#17,204 |
| 76. | 89101 | 9.0% | 10.1%(-1.04)#76 | 9.8%(-0.734)#17,222 |
| 77. | 89519 | 9.0% | 10.1%(-1.09)#77 | 9.8%(-0.782)#17,356 |
| 78. | 89144 | 9.0% | 10.1%(-1.13)#78 | 9.8%(-0.826)#17,430 |
| 79. | 89107 | 8.9% | 10.1%(-1.15)#79 | 9.8%(-0.845)#17,480 |
| 80. | 89027 | 8.8% | 10.1%(-1.30)#80 | 9.8%(-0.988)#17,813 |
| 81. | 89149 | 8.8% | 10.1%(-1.32)#81 | 9.8%(-1.01)#17,870 |
| 82. | 89704 | 8.8% | 10.1%(-1.33)#82 | 9.8%(-1.02)#17,891 |
| 83. | 89103 | 8.7% | 10.1%(-1.43)#83 | 9.8%(-1.12)#18,135 |
| 84. | 89434 | 8.6% | 10.1%(-1.49)#84 | 9.8%(-1.18)#18,260 |
| 85. | 89019 | 8.6% | 10.1%(-1.50)#85 | 9.8%(-1.19)#18,276 |
| 86. | 89048 | 8.6% | 10.1%(-1.53)#86 | 9.8%(-1.22)#18,337 |
| 87. | 89502 | 8.5% | 10.1%(-1.57)#87 | 9.8%(-1.26)#18,418 |
| 88. | 89115 | 8.5% | 10.1%(-1.57)#88 | 9.8%(-1.26)#18,419 |
| 89. | 89701 | 8.5% | 10.1%(-1.59)#89 | 9.8%(-1.29)#18,468 |
| 90. | 89147 | 8.5% | 10.1%(-1.61)#90 | 9.8%(-1.30)#18,504 |
| 91. | 89119 | 8.5% | 10.1%(-1.61)#91 | 9.8%(-1.31)#18,519 |
| 92. | 89449 | 8.4% | 10.1%(-1.73)#92 | 9.8%(-1.42)#18,800 |
| 93. | 89135 | 8.3% | 10.1%(-1.84)#93 | 9.8%(-1.53)#19,074 |
| 94. | 89503 | 8.2% | 10.1%(-1.87)#94 | 9.8%(-1.57)#19,156 |
| 95. | 89815 | 8.2% | 10.1%(-1.92)#95 | 9.8%(-1.61)#19,265 |
| 96. | 89121 | 8.0% | 10.1%(-2.06)#96 | 9.8%(-1.75)#19,571 |
| 97. | 89102 | 8.0% | 10.1%(-2.10)#97 | 9.8%(-1.80)#19,672 |
| 98. | 89123 | 7.7% | 10.1%(-2.40)#98 | 9.8%(-2.10)#20,362 |
| 99. | 89413 | 7.3% | 10.1%(-2.79)#99 | 9.8%(-2.48)#21,132 |
| 100. | 89040 | 7.3% | 10.1%(-2.81)#100 | 9.8%(-2.50)#21,169 |
1
2Common Questions
What are the Top 10 Zip Codes with the Highest Percentage of Population with a Degree in Science and Engineering in Nevada?
Top 10 Zip Codes with the Highest Percentage of Population with a Degree in Science and Engineering in Nevada are:
What zip code has the Highest Percentage of Population with a Degree in Science and Engineering in Nevada?
89018 has the Highest Percentage of Population with a Degree in Science and Engineering in Nevada with 100.0%.
What is the Percentage of Population with a Degree in Science and Engineering in the State of Nevada?
Percentage of Population with a Degree in Science and Engineering in Nevada is 10.1%.
What is the Percentage of Population with a Degree in Science and Engineering in the United States?
Percentage of Population with a Degree in Science and Engineering in the United States is 9.8%.