Zip Codes with the Highest Percentage of Population with a Degree in Liberal Arts and History in Las Vegas, NV
RELATED REPORTS & OPTIONS
Liberal Arts and History
Las Vegas
Compare Zip Codes
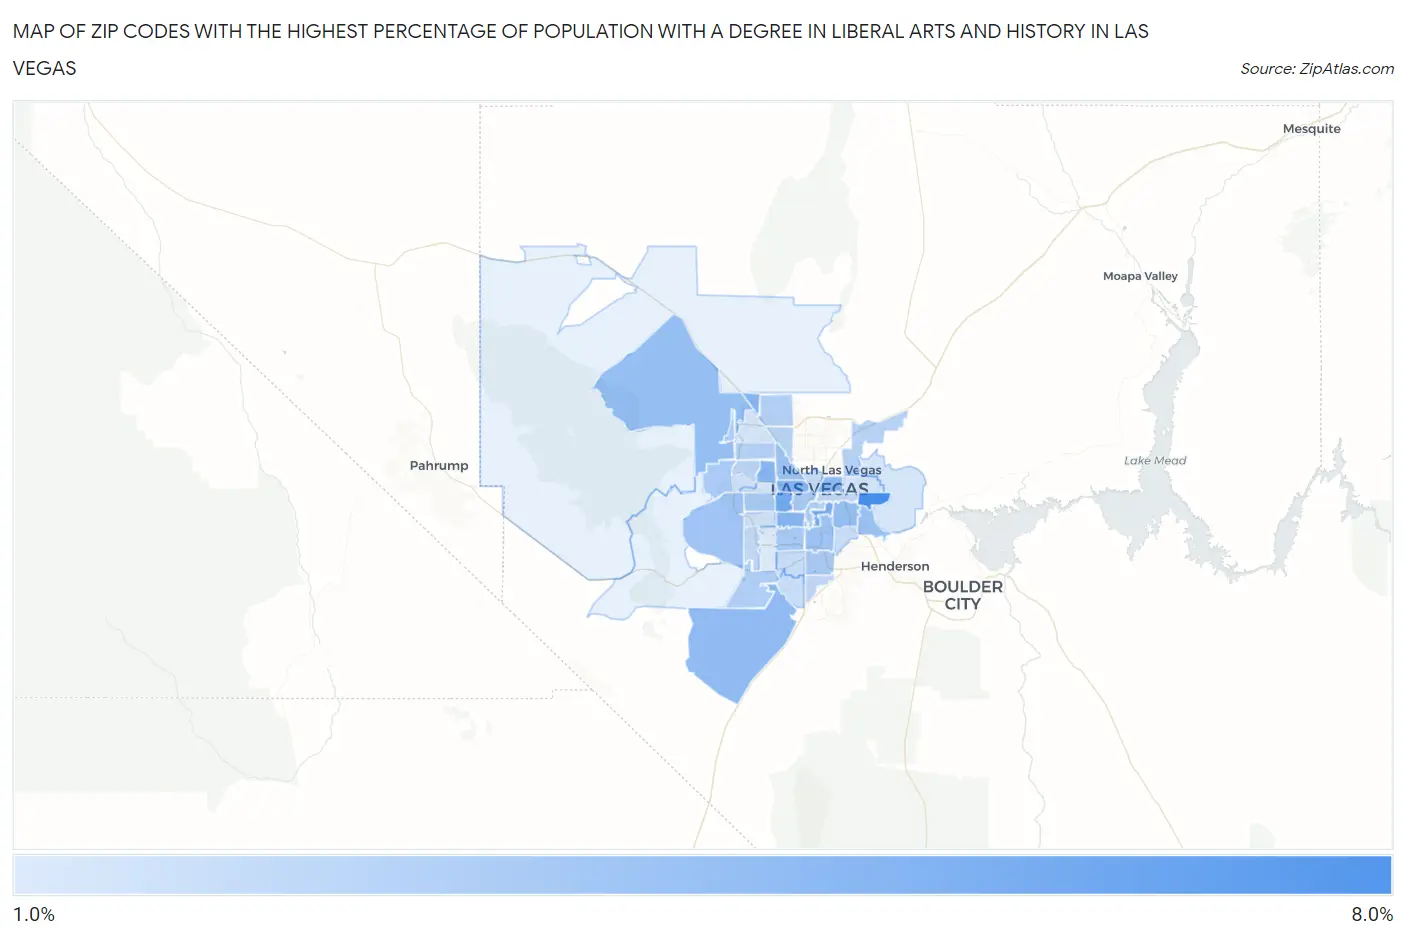
Map of Zip Codes with the Highest Percentage of Population with a Degree in Liberal Arts and History in Las Vegas
1.9%
7.6%
Zip Codes with the Highest Percentage of Population with a Degree in Liberal Arts and History in Las Vegas, NV
| Zip Code | % Graduates | vs State | vs National | |
| 1. | 89142 | 7.6% | 3.8%(+3.72)#15 | 4.9%(+2.70)#5,482 |
| 2. | 89146 | 5.9% | 3.8%(+2.06)#23 | 4.9%(+1.03)#8,763 |
| 3. | 89169 | 5.7% | 3.8%(+1.89)#26 | 4.9%(+0.870)#9,183 |
| 4. | 89107 | 5.1% | 3.8%(+1.29)#33 | 4.9%(+0.262)#10,916 |
| 5. | 89143 | 5.1% | 3.8%(+1.23)#35 | 4.9%(+0.211)#11,095 |
| 6. | 89128 | 5.1% | 3.8%(+1.23)#37 | 4.9%(+0.202)#11,119 |
| 7. | 89103 | 5.1% | 3.8%(+1.21)#38 | 4.9%(+0.191)#11,155 |
| 8. | 89101 | 4.9% | 3.8%(+1.03)#41 | 4.9%(+0.004)#11,724 |
| 9. | 89179 | 4.7% | 3.8%(+0.842)#46 | 4.9%(-0.182)#12,359 |
| 10. | 89166 | 4.6% | 3.8%(+0.707)#53 | 4.9%(-0.317)#12,782 |
| 11. | 89121 | 4.5% | 3.8%(+0.603)#56 | 4.9%(-0.421)#13,118 |
| 12. | 89122 | 4.4% | 3.8%(+0.504)#58 | 4.9%(-0.520)#13,444 |
| 13. | 89119 | 4.2% | 3.8%(+0.342)#62 | 4.9%(-0.682)#14,049 |
| 14. | 89108 | 4.2% | 3.8%(+0.315)#64 | 4.9%(-0.709)#14,170 |
| 15. | 89135 | 4.1% | 3.8%(+0.291)#66 | 4.9%(-0.733)#14,244 |
| 16. | 89118 | 3.9% | 3.8%(+0.016)#70 | 4.9%(-1.01)#15,281 |
| 17. | 89117 | 3.8% | 3.8%(-0.017)#71 | 4.9%(-1.04)#15,412 |
| 18. | 89102 | 3.8% | 3.8%(-0.024)#72 | 4.9%(-1.05)#15,429 |
| 19. | 89123 | 3.8% | 3.8%(-0.076)#73 | 4.9%(-1.10)#15,626 |
| 20. | 89138 | 3.8% | 3.8%(-0.085)#74 | 4.9%(-1.11)#15,663 |
| 21. | 89178 | 3.6% | 3.8%(-0.238)#76 | 4.9%(-1.26)#16,218 |
| 22. | 89109 | 3.5% | 3.8%(-0.313)#78 | 4.9%(-1.34)#16,460 |
| 23. | 89131 | 3.3% | 3.8%(-0.524)#82 | 4.9%(-1.55)#17,232 |
| 24. | 89129 | 3.3% | 3.8%(-0.527)#83 | 4.9%(-1.55)#17,244 |
| 25. | 89115 | 3.2% | 3.8%(-0.629)#85 | 4.9%(-1.65)#17,584 |
| 26. | 89130 | 3.2% | 3.8%(-0.647)#87 | 4.9%(-1.67)#17,639 |
| 27. | 89134 | 3.2% | 3.8%(-0.675)#89 | 4.9%(-1.70)#17,750 |
| 28. | 89183 | 2.9% | 3.8%(-0.941)#92 | 4.9%(-1.97)#18,680 |
| 29. | 89104 | 2.9% | 3.8%(-0.967)#93 | 4.9%(-1.99)#18,744 |
| 30. | 89148 | 2.9% | 3.8%(-0.972)#94 | 4.9%(-2.00)#18,759 |
| 31. | 89139 | 2.6% | 3.8%(-1.20)#96 | 4.9%(-2.22)#19,505 |
| 32. | 89106 | 2.6% | 3.8%(-1.24)#98 | 4.9%(-2.26)#19,631 |
| 33. | 89120 | 2.6% | 3.8%(-1.29)#99 | 4.9%(-2.31)#19,787 |
| 34. | 89141 | 2.5% | 3.8%(-1.32)#101 | 4.9%(-2.35)#19,900 |
| 35. | 89144 | 2.4% | 3.8%(-1.42)#103 | 4.9%(-2.45)#20,215 |
| 36. | 89147 | 2.4% | 3.8%(-1.48)#105 | 4.9%(-2.50)#20,360 |
| 37. | 89110 | 2.2% | 3.8%(-1.62)#108 | 4.9%(-2.64)#20,741 |
| 38. | 89149 | 2.1% | 3.8%(-1.73)#110 | 4.9%(-2.75)#21,033 |
| 39. | 89156 | 2.1% | 3.8%(-1.75)#111 | 4.9%(-2.78)#21,115 |
| 40. | 89145 | 2.0% | 3.8%(-1.82)#113 | 4.9%(-2.84)#21,292 |
| 41. | 89113 | 1.9% | 3.8%(-1.97)#114 | 4.9%(-3.00)#21,670 |
1
Common Questions
What are the Top 10 Zip Codes with the Highest Percentage of Population with a Degree in Liberal Arts and History in Las Vegas, NV?
Top 10 Zip Codes with the Highest Percentage of Population with a Degree in Liberal Arts and History in Las Vegas, NV are:
What zip code has the Highest Percentage of Population with a Degree in Liberal Arts and History in Las Vegas, NV?
89142 has the Highest Percentage of Population with a Degree in Liberal Arts and History in Las Vegas, NV with 7.6%.
What is the Percentage of Population with a Degree in Liberal Arts and History in Las Vegas, NV?
Percentage of Population with a Degree in Liberal Arts and History in Las Vegas is 3.8%.
What is the Percentage of Population with a Degree in Liberal Arts and History in Nevada?
Percentage of Population with a Degree in Liberal Arts and History in Nevada is 3.8%.
What is the Percentage of Population with a Degree in Liberal Arts and History in the United States?
Percentage of Population with a Degree in Liberal Arts and History in the United States is 4.9%.