Zip Codes with the Highest Percentage of Population with a Degree in Liberal Arts and History in Gardnerville, NV
RELATED REPORTS & OPTIONS
Liberal Arts and History
Gardnerville
Compare Zip Codes
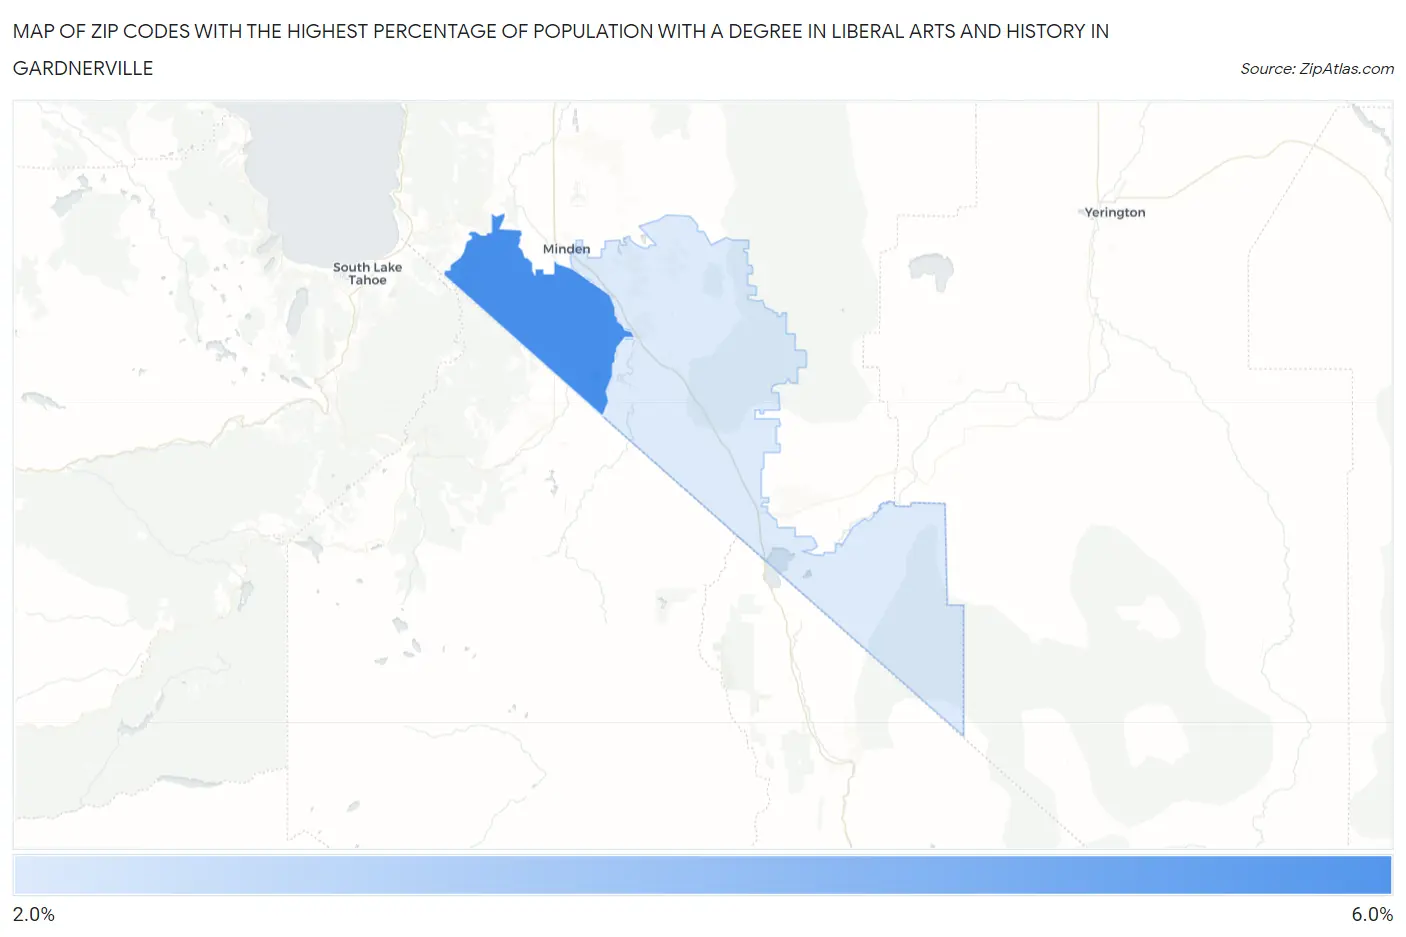
Map of Zip Codes with the Highest Percentage of Population with a Degree in Liberal Arts and History in Gardnerville
2.8%
5.7%
Zip Codes with the Highest Percentage of Population with a Degree in Liberal Arts and History in Gardnerville, NV
| Zip Code | % Graduates | vs State | vs National | |
| 1. | 89460 | 5.7% | 3.8%(+1.87)#28 | 4.9%(+0.842)#9,254 |
| 2. | 89410 | 2.8% | 3.8%(-1.01)#95 | 4.9%(-2.03)#18,873 |
1
Common Questions
What are the Top Zip Codes with the Highest Percentage of Population with a Degree in Liberal Arts and History in Gardnerville, NV?
Top Zip Codes with the Highest Percentage of Population with a Degree in Liberal Arts and History in Gardnerville, NV are:
What zip code has the Highest Percentage of Population with a Degree in Liberal Arts and History in Gardnerville, NV?
89460 has the Highest Percentage of Population with a Degree in Liberal Arts and History in Gardnerville, NV with 5.7%.
What is the Percentage of Population with a Degree in Liberal Arts and History in Nevada?
Percentage of Population with a Degree in Liberal Arts and History in Nevada is 3.8%.
What is the Percentage of Population with a Degree in Liberal Arts and History in the United States?
Percentage of Population with a Degree in Liberal Arts and History in the United States is 4.9%.