Zip Codes with the Highest Percentage of Population with a Degree in Liberal Arts and History in North Las Vegas, NV
RELATED REPORTS & OPTIONS
Liberal Arts and History
North Las Vegas
Compare Zip Codes
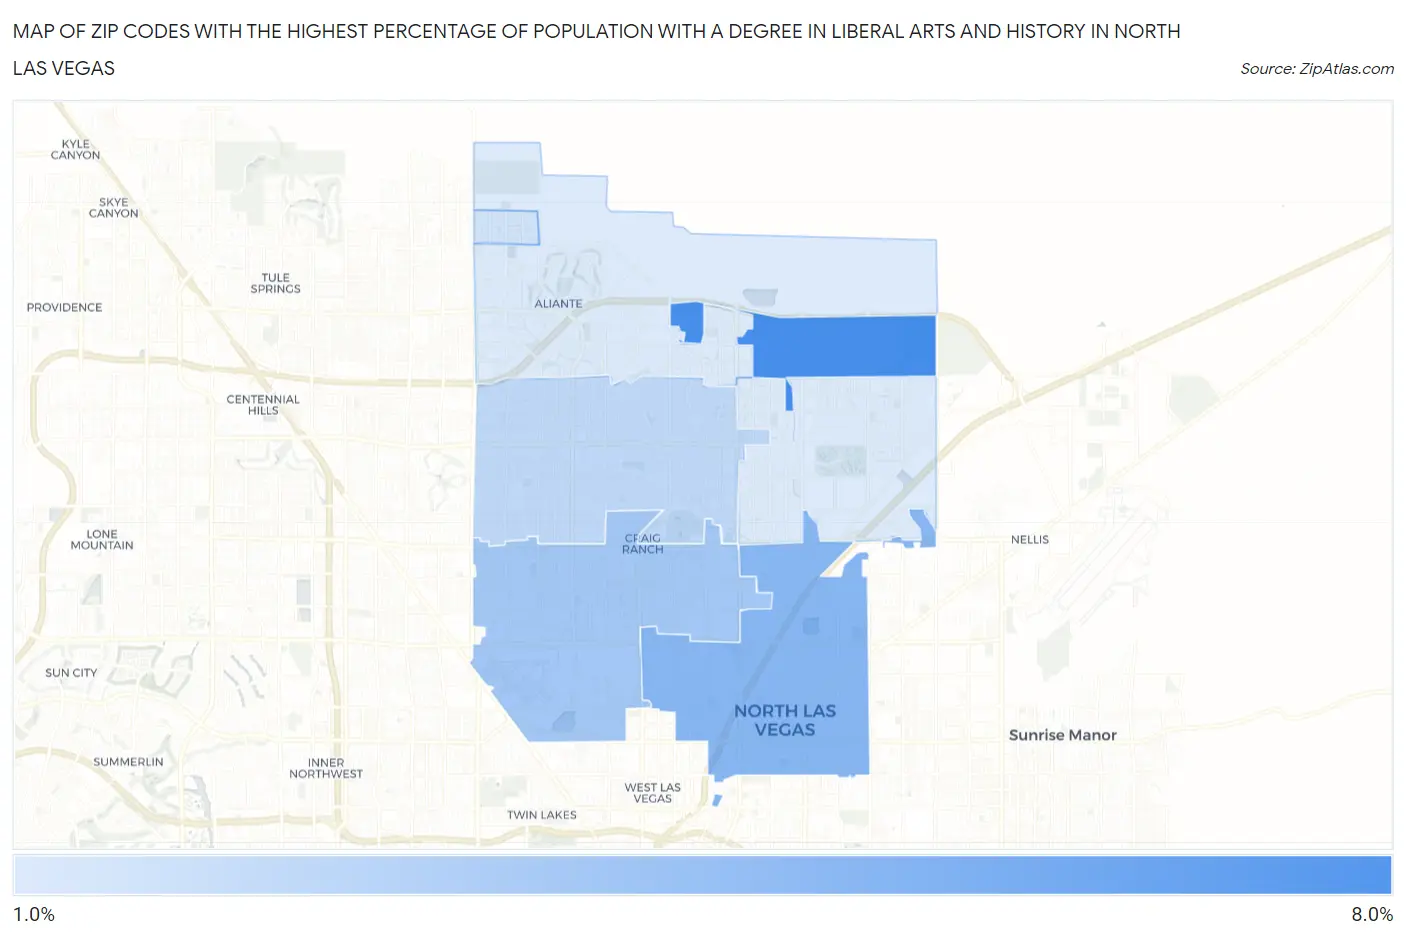
Map of Zip Codes with the Highest Percentage of Population with a Degree in Liberal Arts and History in North Las Vegas
1.7%
6.4%
Zip Codes with the Highest Percentage of Population with a Degree in Liberal Arts and History in North Las Vegas, NV
| Zip Code | % Graduates | vs State | vs National | |
| 1. | 89086 | 6.4% | 3.8%(+2.57)#19 | 4.9%(+1.54)#7,533 |
| 2. | 89030 | 4.4% | 3.8%(+0.548)#57 | 4.9%(-0.476)#13,302 |
| 3. | 89032 | 3.5% | 3.8%(-0.358)#80 | 4.9%(-1.38)#16,630 |
| 4. | 89031 | 2.6% | 3.8%(-1.22)#97 | 4.9%(-2.24)#19,565 |
| 5. | 89085 | 2.1% | 3.8%(-1.79)#112 | 4.9%(-2.81)#21,201 |
| 6. | 89084 | 1.7% | 3.8%(-2.12)#115 | 4.9%(-3.14)#22,013 |
| 7. | 89081 | 1.7% | 3.8%(-2.14)#116 | 4.9%(-3.16)#22,063 |
1
Common Questions
What are the Top 5 Zip Codes with the Highest Percentage of Population with a Degree in Liberal Arts and History in North Las Vegas, NV?
Top 5 Zip Codes with the Highest Percentage of Population with a Degree in Liberal Arts and History in North Las Vegas, NV are:
What zip code has the Highest Percentage of Population with a Degree in Liberal Arts and History in North Las Vegas, NV?
89086 has the Highest Percentage of Population with a Degree in Liberal Arts and History in North Las Vegas, NV with 6.4%.
What is the Percentage of Population with a Degree in Liberal Arts and History in North Las Vegas, NV?
Percentage of Population with a Degree in Liberal Arts and History in North Las Vegas is 2.4%.
What is the Percentage of Population with a Degree in Liberal Arts and History in Nevada?
Percentage of Population with a Degree in Liberal Arts and History in Nevada is 3.8%.
What is the Percentage of Population with a Degree in Liberal Arts and History in the United States?
Percentage of Population with a Degree in Liberal Arts and History in the United States is 4.9%.