Zip Codes with the Highest Percentage of Population with a Degree in Liberal Arts and History in Pahrump, NV
RELATED REPORTS & OPTIONS
Liberal Arts and History
Pahrump
Compare Zip Codes
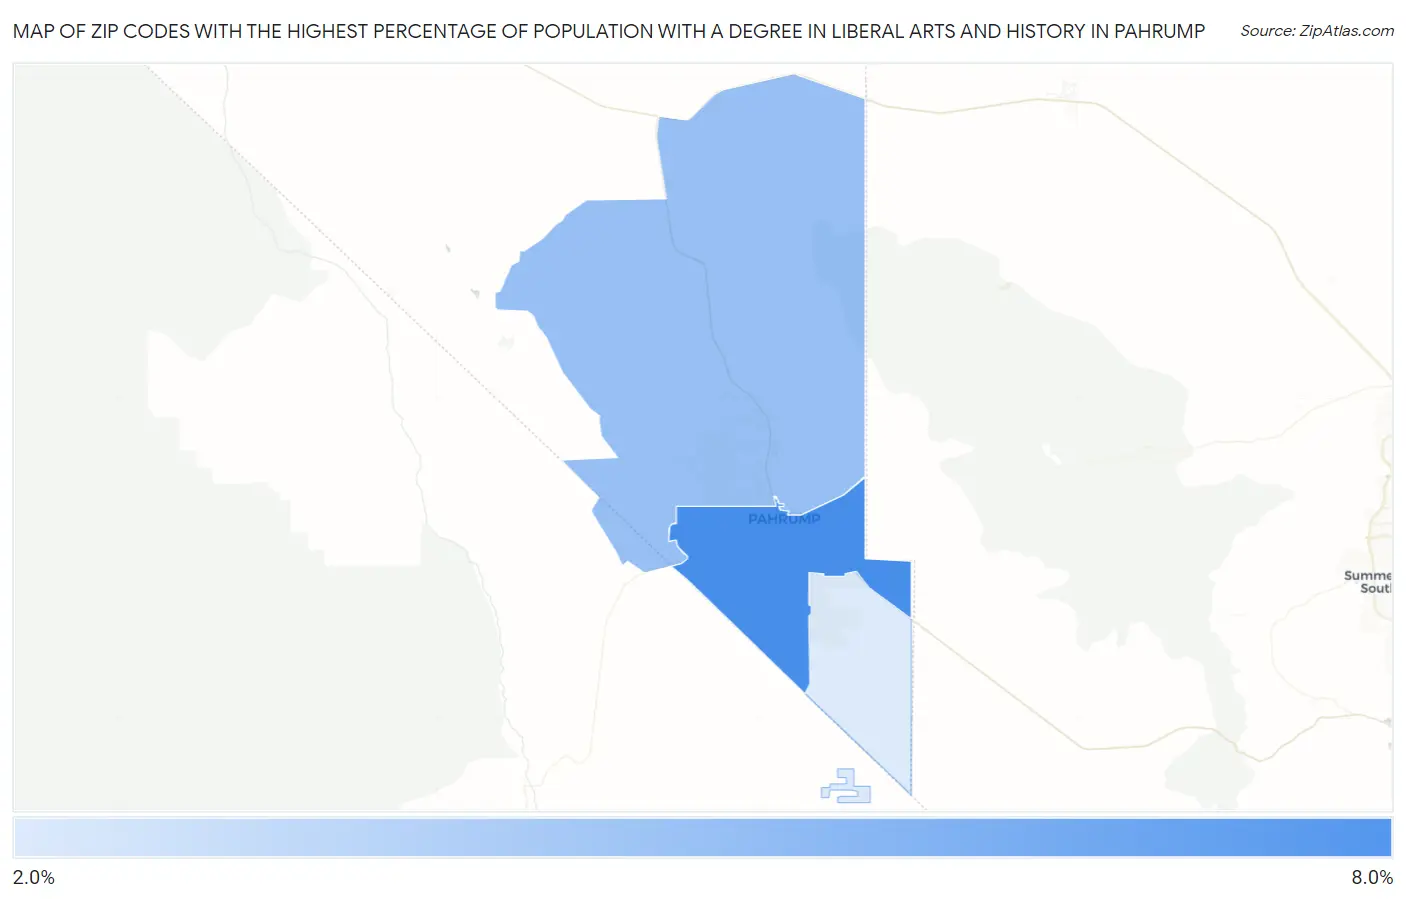
Map of Zip Codes with the Highest Percentage of Population with a Degree in Liberal Arts and History in Pahrump
2.3%
6.3%
Zip Codes with the Highest Percentage of Population with a Degree in Liberal Arts and History in Pahrump, NV
| Zip Code | % Graduates | vs State | vs National | |
| 1. | 89048 | 6.3% | 3.8%(+2.47)#21 | 4.9%(+1.45)#7,736 |
| 2. | 89060 | 4.2% | 3.8%(+0.304)#65 | 4.9%(-0.720)#14,205 |
| 3. | 89061 | 2.3% | 3.8%(-1.55)#106 | 4.9%(-2.58)#20,558 |
1
Common Questions
What are the Top Zip Codes with the Highest Percentage of Population with a Degree in Liberal Arts and History in Pahrump, NV?
Top Zip Codes with the Highest Percentage of Population with a Degree in Liberal Arts and History in Pahrump, NV are:
What zip code has the Highest Percentage of Population with a Degree in Liberal Arts and History in Pahrump, NV?
89048 has the Highest Percentage of Population with a Degree in Liberal Arts and History in Pahrump, NV with 6.3%.
What is the Percentage of Population with a Degree in Liberal Arts and History in Pahrump, NV?
Percentage of Population with a Degree in Liberal Arts and History in Pahrump is 4.9%.
What is the Percentage of Population with a Degree in Liberal Arts and History in Nevada?
Percentage of Population with a Degree in Liberal Arts and History in Nevada is 3.8%.
What is the Percentage of Population with a Degree in Liberal Arts and History in the United States?
Percentage of Population with a Degree in Liberal Arts and History in the United States is 4.9%.