Zip Codes with the Highest Percentage of Population with a Degree in Computers and Mathematics in Las Vegas, NV

RELATED REPORTS & OPTIONS

Computers and Mathematics
Population
Families and Households
Female Fertility
Female Fertility (Unmarried)
Race (Community Size)
Race (Percentage)
Ancestry (Community Size)
AfghanAfricanAlaska NativeAlbanianAleutAmericanApacheArabArapahoArgentineanArmenianAssyrian / Chaldean / SyriacAustralianAustrianBangladeshiBarbadianBasqueBelgianBelizeanBhutaneseBlackfeetBolivianBrazilianBritishBritish West IndianBulgarianBurmeseCajunCambodianCanadianCape VerdeanCelticCentral AmericanCentral American IndianCherokeeCheyenneChickasawChileanChineseChippewaChoctawColombianComancheCosta RicanCreeCreekCroatianCubanCzechCzechoslovakianDanishDelawareDominicanDutchDutch West IndianEastern EuropeanEcuadorianEgyptianEnglishEstonianEthiopianEuropeanFijianFilipinoFinnishFrenchFrench American IndianFrench CanadianGermanGerman RussianGhanaianGreekGuamanian / ChamorroGuatemalanGuyaneseHaitianHonduranHopiHungarianIcelanderIndian (Asian)IndonesianInupiatIranianIraqiIrishIroquoisIsraeliItalianJamaicanJapaneseJordanianKenyanKoreanLaotianLatvianLebaneseLiberianLithuanianLuxembourgerMacedonianMalaysianMalteseMenomineeMexicanMexican American IndianMongolianMoroccanNative HawaiianNavajoNew ZealanderNicaraguanNigerianNorthern EuropeanNorwegianOkinawanOsagePaiutePakistaniPalestinianPanamanianParaguayanPennsylvania GermanPeruvianPimaPolishPortuguesePotawatomiPuebloPuerto RicanPuget Sound SalishRomanianRussianSalvadoranSamoanScandinavianScotch-IrishScottishSeminoleSenegaleseSerbianShoshoneSierra LeoneanSiouxSlavicSlovakSloveneSomaliSouth AfricanSouth AmericanSouth American IndianSoviet UnionSpaniardSpanishSpanish AmericanSpanish American IndianSri LankanSubsaharan AfricanSudaneseSwedishSwissSyrianThaiTlingit-HaidaTohono O'OdhamTonganTrinidadian and TobagonianTurkishU.S. Virgin IslanderUgandanUkrainianUruguayanUteVenezuelanVietnameseWelshWest IndianYaquiYugoslavianYumanYup'ikZimbabwean
Ancestry (Percentage)
AfghanAfricanAlaska NativeAlbanianAleutAmericanApacheArabArapahoArgentineanArmenianAssyrian / Chaldean / SyriacAustralianAustrianBangladeshiBarbadianBasqueBelgianBelizeanBhutaneseBlackfeetBolivianBrazilianBritishBritish West IndianBulgarianBurmeseCajunCambodianCanadianCape VerdeanCelticCentral AmericanCentral American IndianCherokeeCheyenneChickasawChileanChineseChippewaChoctawColombianComancheCosta RicanCreeCreekCroatianCubanCzechCzechoslovakianDanishDelawareDominicanDutchDutch West IndianEastern EuropeanEcuadorianEgyptianEnglishEstonianEthiopianEuropeanFijianFilipinoFinnishFrenchFrench American IndianFrench CanadianGermanGerman RussianGhanaianGreekGuamanian / ChamorroGuatemalanGuyaneseHaitianHonduranHopiHungarianIcelanderIndian (Asian)IndonesianInupiatIranianIraqiIrishIroquoisIsraeliItalianJamaicanJapaneseJordanianKenyanKoreanLaotianLatvianLebaneseLiberianLithuanianLuxembourgerMacedonianMalaysianMalteseMenomineeMexicanMexican American IndianMongolianMoroccanNative HawaiianNavajoNew ZealanderNicaraguanNigerianNorthern EuropeanNorwegianOkinawanOsagePaiutePakistaniPalestinianPanamanianParaguayanPennsylvania GermanPeruvianPimaPolishPortuguesePotawatomiPuebloPuerto RicanPuget Sound SalishRomanianRussianSalvadoranSamoanScandinavianScotch-IrishScottishSeminoleSenegaleseSerbianShoshoneSierra LeoneanSiouxSlavicSlovakSloveneSomaliSouth AfricanSouth AmericanSouth American IndianSoviet UnionSpaniardSpanishSpanish AmericanSpanish American IndianSri LankanSubsaharan AfricanSudaneseSwedishSwissSyrianThaiTlingit-HaidaTohono O'OdhamTonganTrinidadian and TobagonianTurkishU.S. Virgin IslanderUgandanUkrainianUruguayanUteVenezuelanVietnameseWelshWest IndianYaquiYugoslavianYumanYup'ikZimbabwean
Immigrant Origin (Total)
AfghanistanAfricaAlbaniaArgentinaArmeniaAsiaAustraliaAustriaBahamasBangladeshBarbadosBelarusBelgiumBelizeBoliviaBosnia and HerzegovinaBrazilBulgariaBurma / MyanmarCambodiaCameroonCanadaCaribbeanCentral AmericaChileChinaColombiaCosta RicaCroatiaCubaCzechoslovakiaDenmarkDominican RepublicEastern AfricaEastern AsiaEastern EuropeEcuadorEgyptEl SalvadorEnglandEritreaEthiopiaEuropeFijiFranceGermanyGhanaGreeceGuatemalaGuyanaHaitiHondurasHong KongHungaryIndiaIndonesiaIranIraqIrelandIsraelItalyJamaicaJapanJordanKazakhstanKenyaKoreaLaosLatin AmericaLatviaLebanonLiberiaLithuaniaMalaysiaMexicoMicronesiaMiddle AfricaMoldovaMoroccoNepalNetherlandsNicaraguaNigeriaNorth MacedoniaNorthern AfricaNorthern EuropeNorwayOceaniaPakistanPanamaPeruPhilippinesPolandPortugalRomaniaRussiaSaudi ArabiaScotlandSenegalSerbiaSierra LeoneSingaporeSomaliaSouth AfricaSouth AmericaSouth Central AsiaSouth Eastern AsiaSouthern EuropeSpainSri LankaSudanSwedenSwitzerlandSyriaTaiwanThailandTrinidad and TobagoTurkeyUgandaUkraineUruguayUzbekistanVenezuelaVietnamWest IndiesWestern AfricaWestern AsiaWestern EuropeYemenZaireZimbabwe
Immigrant Origin (Percentage)
AfghanistanAfricaAlbaniaArgentinaArmeniaAsiaAustraliaAustriaBahamasBangladeshBarbadosBelarusBelgiumBelizeBoliviaBosnia and HerzegovinaBrazilBulgariaBurma / MyanmarCambodiaCameroonCanadaCaribbeanCentral AmericaChileChinaColombiaCosta RicaCroatiaCubaCzechoslovakiaDenmarkDominican RepublicEastern AfricaEastern AsiaEastern EuropeEcuadorEgyptEl SalvadorEnglandEritreaEthiopiaEuropeFijiFranceGermanyGhanaGreeceGuatemalaGuyanaHaitiHondurasHong KongHungaryIndiaIndonesiaIranIraqIrelandIsraelItalyJamaicaJapanJordanKazakhstanKenyaKoreaLaosLatin AmericaLatviaLebanonLiberiaLithuaniaMalaysiaMexicoMicronesiaMiddle AfricaMoldovaMoroccoNepalNetherlandsNicaraguaNigeriaNorth MacedoniaNorthern AfricaNorthern EuropeNorwayOceaniaPakistanPanamaPeruPhilippinesPolandPortugalRomaniaRussiaSaudi ArabiaScotlandSenegalSerbiaSierra LeoneSingaporeSomaliaSouth AfricaSouth AmericaSouth Central AsiaSouth Eastern AsiaSouthern EuropeSpainSri LankaSudanSwedenSwitzerlandSyriaTaiwanThailandTrinidad and TobagoTurkeyUgandaUkraineUruguayUzbekistanVenezuelaVietnamWest IndiesWestern AfricaWestern AsiaWestern EuropeYemenZaireZimbabwe
Income
Income (Families)
Income (Households)
Poverty
Poverty (Families)
Unemployment
Employment Occupations
Employment Industries
Employer Class
Commute Time
Commute Means
School Enrollment
Education by Degree Field
Occupancy
Finances
Physical Characteristics
Las Vegas
Compare Zip Codes
Comparison Subject

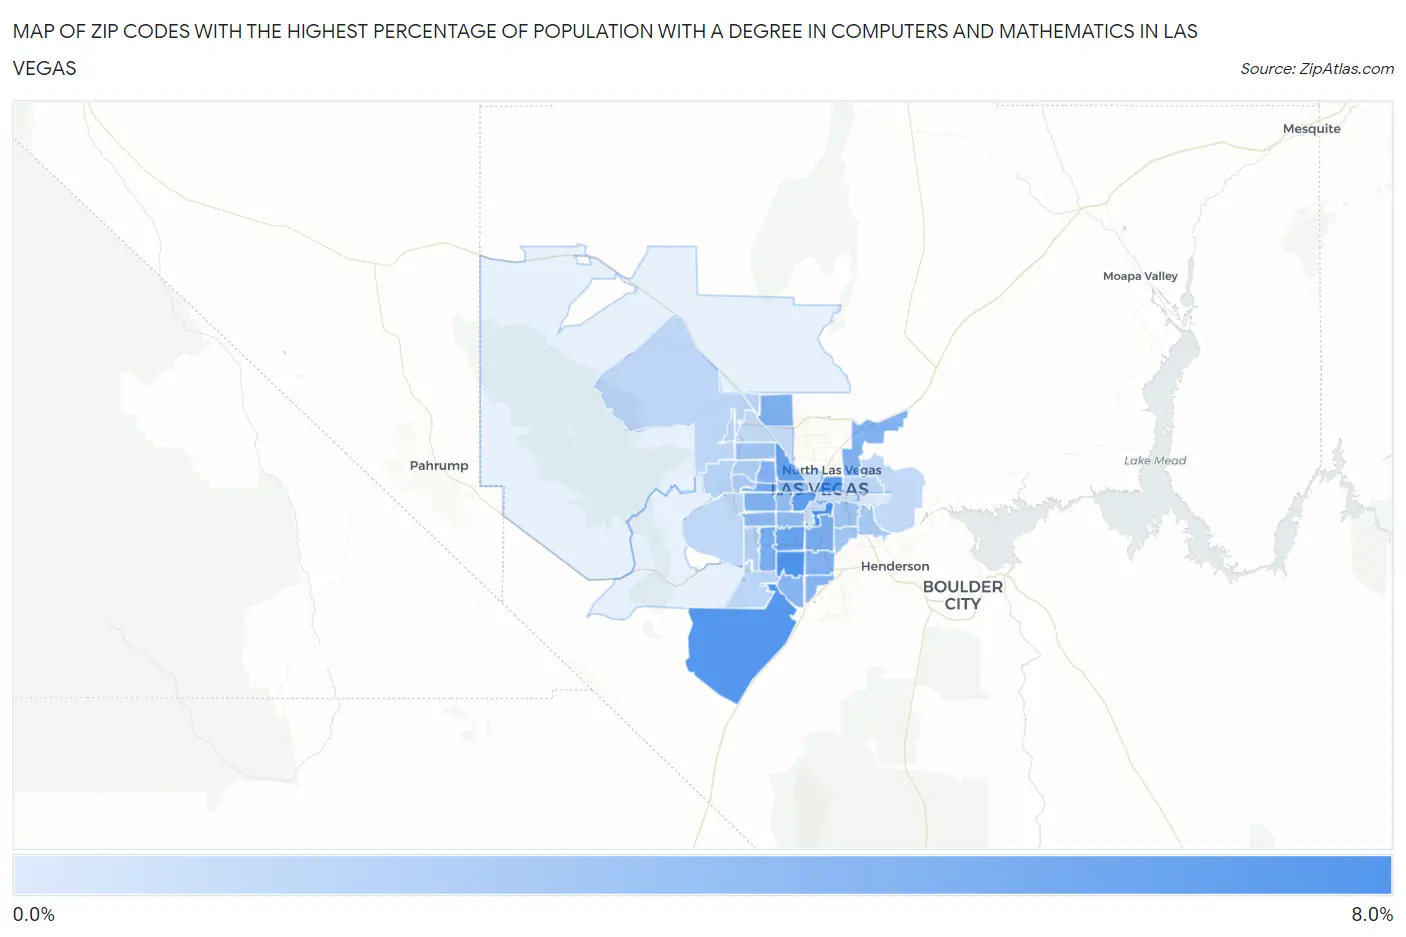
Map of Zip Codes with the Highest Percentage of Population with a Degree in Computers and Mathematics in Las Vegas

0.0%
8.0%
Zip Codes with the Highest Percentage of Population with a Degree in Computers and Mathematics in Las Vegas Map

Zip Codes with the Highest Percentage of Population with a Degree in Computers and Mathematics in Las Vegas, NV

Zip Code % Graduates vs State vs National
1.891698.0%4.2%(+3.77)#124.9%(+3.08)#2,924
2.891397.5%4.2%(+3.30)#164.9%(+2.62)#3,327
3.891797.3%4.2%(+3.12)#184.9%(+2.43)#3,500
4.891017.2%4.2%(+2.98)#194.9%(+2.29)#3,640
5.891026.7%4.2%(+2.53)#244.9%(+1.84)#4,158
6.891086.5%4.2%(+2.32)#264.9%(+1.64)#4,412
7.891186.5%4.2%(+2.25)#274.9%(+1.57)#4,511
8.891455.9%4.2%(+1.64)#304.9%(+0.956)#5,583
9.891135.7%4.2%(+1.50)#314.9%(+0.811)#5,866
10.891195.7%4.2%(+1.46)#324.9%(+0.778)#5,933
11.891315.3%4.2%(+1.11)#354.9%(+0.426)#6,713
12.891155.3%4.2%(+1.09)#364.9%(+0.407)#6,751
13.891585.3%4.2%(+1.09)#374.9%(+0.404)#6,757
14.891175.2%4.2%(+1.04)#384.9%(+0.354)#6,890
15.891235.2%4.2%(+0.959)#404.9%(+0.273)#7,055
16.891285.2%4.2%(+0.958)#414.9%(+0.272)#7,060
17.891415.0%4.2%(+0.833)#444.9%(+0.147)#7,354
18.891835.0%4.2%(+0.809)#464.9%(+0.123)#7,412
19.891474.8%4.2%(+0.547)#484.9%(-0.140)#8,119
20.891034.7%4.2%(+0.460)#494.9%(-0.226)#8,371
21.891464.5%4.2%(+0.254)#514.9%(-0.432)#8,992
22.891074.5%4.2%(+0.248)#524.9%(-0.438)#9,009
23.891213.9%4.2%(-0.284)#574.9%(-0.970)#10,714
24.891293.7%4.2%(-0.490)#624.9%(-1.18)#11,473
25.891203.7%4.2%(-0.505)#634.9%(-1.19)#11,535
26.891223.5%4.2%(-0.720)#684.9%(-1.41)#12,342
27.891443.4%4.2%(-0.826)#734.9%(-1.51)#12,719
28.891343.1%4.2%(-1.09)#794.9%(-1.77)#13,661
29.891483.0%4.2%(-1.26)#834.9%(-1.94)#14,246
30.891382.8%4.2%(-1.39)#864.9%(-2.08)#14,721
31.891432.7%4.2%(-1.55)#884.9%(-2.24)#15,323
32.891782.6%4.2%(-1.57)#894.9%(-2.25)#15,384
33.891662.5%4.2%(-1.72)#934.9%(-2.40)#15,947
34.891352.5%4.2%(-1.75)#954.9%(-2.44)#16,087
35.891102.4%4.2%(-1.80)#964.9%(-2.48)#16,229
36.891562.3%4.2%(-1.88)#984.9%(-2.56)#16,489
37.891492.2%4.2%(-1.99)#1014.9%(-2.68)#16,901
38.891302.0%4.2%(-2.16)#1024.9%(-2.85)#17,459
39.891091.9%4.2%(-2.34)#1054.9%(-3.03)#18,043
40.891041.8%4.2%(-2.45)#1064.9%(-3.13)#18,346
41.891061.7%4.2%(-2.47)#1074.9%(-3.16)#18,414
42.891421.1%4.2%(-3.15)#1134.9%(-3.84)#20,364

Common Questions

What are the Top 10 Zip Codes with the Highest Percentage of Population with a Degree in Computers and Mathematics in Las Vegas, NV?
Top 10 Zip Codes with the Highest Percentage of Population with a Degree in Computers and Mathematics in Las Vegas, NV are:
#1
8.0%
#2
7.5%
#3
7.3%
#4
7.2%
#5
6.7%
#6
6.5%
#7
6.5%
#8
5.9%
#9
5.7%
#10
5.7%
What zip code has the Highest Percentage of Population with a Degree in Computers and Mathematics in Las Vegas, NV?
89169 has the Highest Percentage of Population with a Degree in Computers and Mathematics in Las Vegas, NV with 8.0%.
What is the Percentage of Population with a Degree in Computers and Mathematics in Las Vegas, NV?
Percentage of Population with a Degree in Computers and Mathematics in Las Vegas is 4.2%.
What is the Percentage of Population with a Degree in Computers and Mathematics in Nevada?
Percentage of Population with a Degree in Computers and Mathematics in Nevada is 4.2%.
What is the Percentage of Population with a Degree in Computers and Mathematics in the United States?
Percentage of Population with a Degree in Computers and Mathematics in the United States is 4.9%.