Zip Codes with the Highest Percentage of Population Employed in Food Preparation & Serving in Waterford, MI
RELATED REPORTS & OPTIONS
Food Preparation & Serving
Waterford
Compare Zip Codes
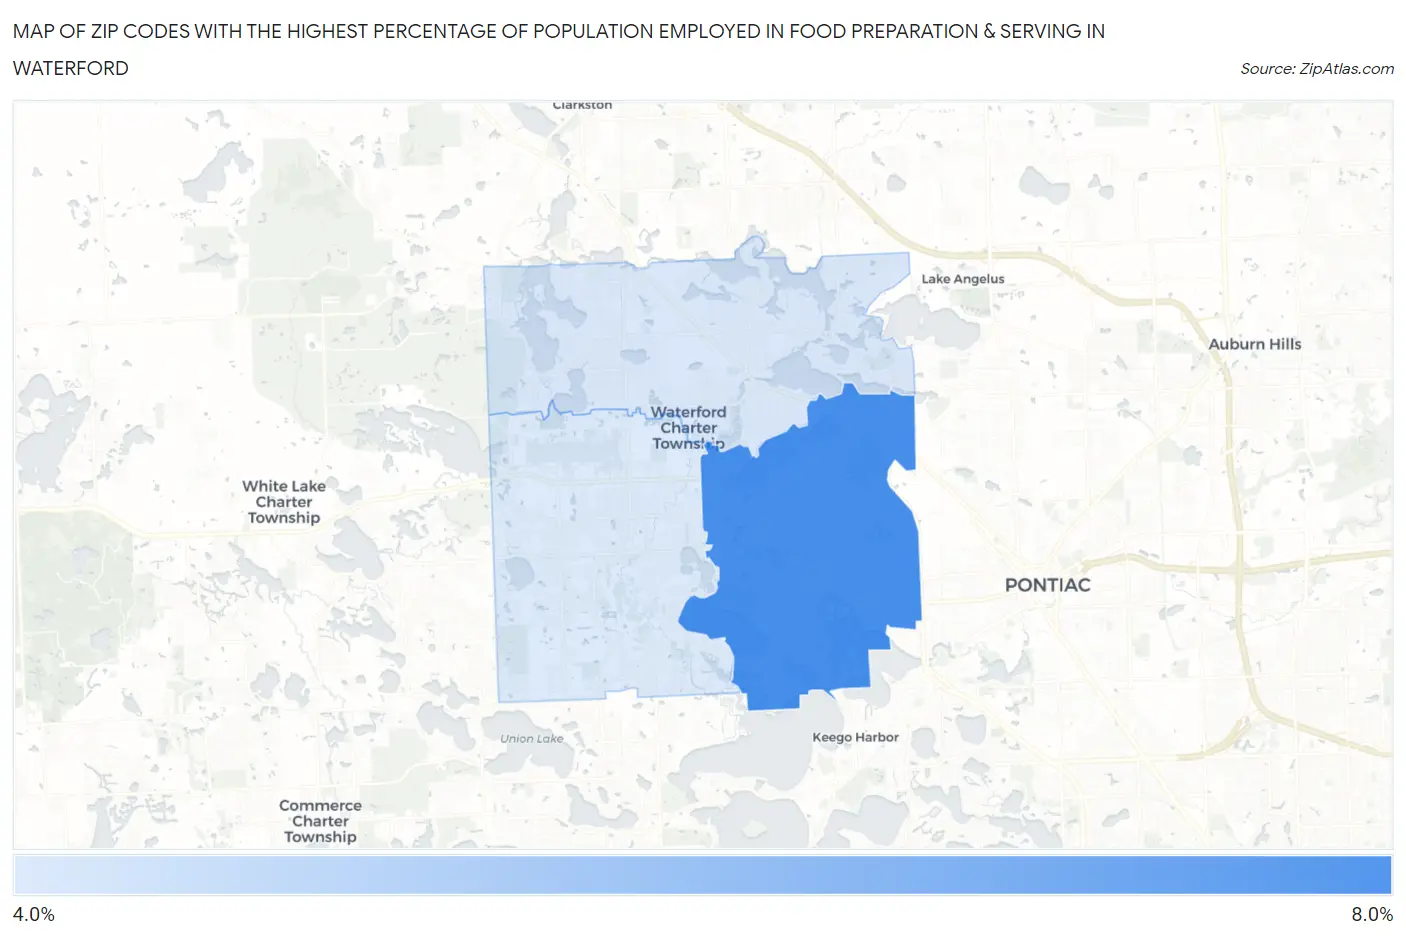
Map of Zip Codes with the Highest Percentage of Population Employed in Food Preparation & Serving in Waterford
4.8%
7.9%
Zip Codes with the Highest Percentage of Population Employed in Food Preparation & Serving in Waterford, MI
| Zip Code | % Employed | vs State | vs National | |
| 1. | 48328 | 7.9% | 5.7%(+2.26)#153 | 5.3%(+2.65)#4,840 |
| 2. | 48329 | 4.9% | 5.7%(-0.773)#512 | 5.3%(-0.387)#13,347 |
| 3. | 48327 | 4.8% | 5.7%(-0.836)#518 | 5.3%(-0.449)#13,624 |
1
Common Questions
What are the Top Zip Codes with the Highest Percentage of Population Employed in Food Preparation & Serving in Waterford, MI?
Top Zip Codes with the Highest Percentage of Population Employed in Food Preparation & Serving in Waterford, MI are:
What zip code has the Highest Percentage of Population Employed in Food Preparation & Serving in Waterford, MI?
48328 has the Highest Percentage of Population Employed in Food Preparation & Serving in Waterford, MI with 7.9%.
What is the Percentage of Population Employed in Food Preparation & Serving in Michigan?
Percentage of Population Employed in Food Preparation & Serving in Michigan is 5.7%.
What is the Percentage of Population Employed in Food Preparation & Serving in the United States?
Percentage of Population Employed in Food Preparation & Serving in the United States is 5.3%.